Introduction
Cerebral vasospasm (CV) or delayed cerebral ischemia
(DCI) is the main complication and cause of morbidity following
surgery in individuals that have a subarachnoid hemorrhage (SAH).
Unfortunately, however, 16-65% of these patients, despite the use
of different therapeutic procedures, consequently develop ischemia
(1-4).
A variety of strategies are employed to enhance cerebral blood flow
(CBF) in patients with SAH who develop CV. Intra-aortic balloon
counterpulsation, hyperdynamic therapy, intra-arterial and
intrathecal drug infusion, as well as novel experimental
techniques, such as endovascular treatment and different drugs or
their combinations, may be helpful if treatment are commenced at an
early stage. However, if a CV does not appear or treatment begins
at a late stage, cerebral ischemia (CI) may occur even with optimal
management (5).
Identifying CV (clinically or with angiography) at
an early stage in SAH can be difficult and challenging (1,2).
Although 40-70% of patients exhibit the substantiation of arterial
narrowing (on a Doppler ultrasound or an angiography), only 20 to
30% present with DCI (1,2). Intra-arterial digital subtraction
angiography (DSA) significantly performs as a screening device in
patients whose symptoms and clinical findings are consistent with
focal CI (6). However, when
assessing the global vasculature using DSA, the detailed
delineation of the calf vessels may not be obtained when numerous
stenoses are present and constitute an invasive method. Computed
tomography (CT) can reveal the amount of irreversibly damaged
tissue (the ischemic core) (7-9),
and it indicates that reperfusion therapy may not be necessary or
may even be harmful when the ischemic core is large or the
perfusion is damaged to a great extent (10,11). By
contrast, CT perfusion (CTP) is able to identify damage which is
not recognized by other methods and may be beneficial for the
assessment of CI related to SAH (12). CTP can be used in daily practice, or
it can be used as a separate diagnostic tool without the need for
magnetic resonance imaging data to predict the outcomes of patients
with SAH (13,14). In addition, available data on its
association with other non-invasive techniques, such as
transcranial Doppler (TCD) ultrasound are not sufficient (1,15,16).
In this respect, the present study was performed
with an aim to evaluate the utility of the CTP procedure in the
daily practice of a tertiary hospital for the early recognition of
symptomatic vasospasm in preventing permanent neurological
deterioration and to assess the diagnostic performance of this
technique in the clinical outcomes of patients with SAH (traumatic
and aneurysmal).
Patients and methods
Study design and inclusion
criteria
The present retrospective study included patients
with spontaneous/aneurysmal or traumatic SAH i) who presented with
Glasgow Coma Scale (GCS) scores of 15/15 to 4/15; and ii) whose CT
scan demonstrated high-grade SAH according to neuroimaging damage
degree (Fisher-IV), in a very early stage (48 h after the onset) of
SAH, as well as patients presenting with traumatic brain injury
(TBI) without SAH as controls, between July, 2018 and January, 2020
at the University Hospital of Larisa (Larisa, Greece). Patients
with TBI without SAH were selected as controls, as TBI may be
associated with the pathophysiology of ischemic post-traumatic
events. The Institutional Review Board (IRB) of University of
Thessaly, Greece/The School of Medicine/School of Health Sciences
approved the study (IRB no. 2492/19-01-2015). The study was in line
with the Declaration of Helsinki in 1995 (as revised in Edinburgh
2000). Written informed was obtained from all patients.
As the present study was retrospective, groups of
patients whose parameters (such as blood pressure and intra- and
extracranial artery stenosis), were the same and without any marked
differences were included.
Exclusion criteria
Patients with factors predisposed to CI apart from
vasospasm (i.e., those with atrial fibrillation or other
arrhythmias, diabetes mellitus, hyperlipidemia and hypotension) or
with factors predisposed to bleeding (anticoagulant agents and
severe liver impairment) were excluded. All participants were
followed up for 30 days or until they were discharged from the
hospital. Outcomes were evaluated at 30 days using a CT scan and a
full neurological examination was performed, together with GCS
assessment. The clinical outcome was categorized according to the
presence of neurological or radiological evidence as normal,
adverse (headache, change of consciousness, or others), or
mortality.
Treatments
During the 3rd to 6th day after SAH, CTP was
performed in all the participants to identify a quantifiable index
of CI after CV given that angiographically detectable cerebral
artery constriction is most commonly present at 3-10 days after the
onset. Cerebral blood volume (CBV) and cerebral blood flow (CBF)
values were documented and assessed after receiving two contiguous
10-mm slices placed at the anatomical point of the basal ganglia
with similar angulation as for native CT. A bolus of 50 ml of
nonionic contrast medium (Imeron 400, Bracco Imaging Deutschland
GmbH) accompanied by 30 ml of saline was then infused using a power
injector at a flow rate of 4 ml/sec. Subsequently, 40 images were
captured at each slice level at a rate of two images per second
(120 kV, 110 mAs, 512x512 matrix). CTP color maps were assessed
qualitatively using a visual grading scale, and CTP parameters were
established utilizing software platforms (Perfusion CT, Siemens). A
positive visual measurement was recorded for side-to-side
discrepancies or obvious bilateral anomalies, which could suggest a
decline in CBF, CBV, and mean transit time (MTT), which were
related to the central volume principle: CBF=CBV/MTT (1,17). CBV
was determined in milliliters of blood per 100 gm of brain and was
established as the volume of blood flow for a certain amount of
brain tissue (1,18). MTT was determined as the average time
needed for blood to move through a certain volume of brain and was
calculated in seconds (1).
Moreover, 15-20 min before CTP, TCD via a
trans-temporal window was carried out to illustrate and assess flow
velocities in the anterior cerebral artery (ACA), middle cerebral
artery (MCA), posterior cerebral artery (PCA) and posterior
communicating artery. Peak systolic velocity (PSV, in cm/sec),
which is the maximum flow velocity value during systole, was
calculated at the peak of the waveform. End-diastolic velocity
(EDV, in cm/sec) was determined at the end of diastole,
traditionally at the lowest point before the beginning of a new
waveform, which is between 20 and 50% of the PSV value (1,19). The
Lindegaard ratio, defined as MCA mean CBF velocity divided by
extracranial internal carotid artery mean CBF velocity, was
utilized as an indicator of systemic hemodynamic alterations. The
mean flow velocity (in cm/sec) was calculated as the average of the
edge frequency across a cardiac cycle, which was calculated as EDV
plus one-third of the variance between PSV and EDV [MFV
(cm/sec)=(PSV + 2EDV/3)] (1,19). A sonographic CV was defined as an MFV
of >140 cm/sec in the MCA, ACA, and/or PCA or >90 cm/sec in
the basilar artery. Pulsatility index (PI)=PSV-EDV/MFV was utilized
as an index for intracranial pressure elevation (1,19).
Statistical analysis
The normality of the distribution of variables was
determined using the Shapiro-Wilk test. The data were
non-parametric and were compared using the Mann-Whitney U test. To
identify predictors of adverse events (adverse ischemic events),
statistically significant factors were subsequently examined using
Cox proportional hazards multivariate regression analysis. Receiver
operating characteristic (ROC) analysis was presented to reveal the
implementation of TCD or CTP indicators in recognition of
unfavorable outcomes. A P-value of <0.05 was characterized as
statistically significant. Statistical analysis was performed with
the use of the Statistical Package for the Social Sciences (SPSS
11; SPSS, Inc.).
Results
A total of 34 patients were enrolled in the present
study (Table I). Of these, 15
patients were males (44.1%), and the median age was 50.00 years
(interquartile range, 31 years). Of these patients, 15 patients
(44.1%) had traumatic SAH following TBI, 11 patients (33.3%) had
aneurysmal SAH and 8 patients (23.6%) presented with no SAH after
TBI as controls. The outcomes and baseline characteristics of the
study participants are presented in Table I. Overall, 12 patients (35.2%), who
experienced some clinical symptoms, such as a decline in the level
of consciousness or a worsening headache, were administered
hypervolemic hypertensive and intra-arterial calcium channel
therapy after early the identification of symptomatic vasospasm
with CTP findings and were presented with permanent neurological
deficits as detected using a CT scan after 1 month of
follow-up.
 | Table IBaseline characteristics of the
patients and clinical outcomes. |
Table I
Baseline characteristics of the
patients and clinical outcomes.
| Patient no. | Age, years | Sex | Cause of
admission | Fisher scale | aSAH or tSAH | GCS of
admission | Clinical symptoms
before TCD or CT perfusion attributed to CV | Intervention to
prevent permanent neurological deterioration | Radiologic finding
(CT scan) | Clinical
outcome |
|---|
| 1 | 68 | M | TBI aEDH | 2 | + | 8 | Decline in level of
consciousness, worsening headache | HHTh | Ischemic lesion to
the left parietal lobe (posterior limb of the left internal
capsule) | Right foot
palsy |
| 2 | 16 | M | TBI | 2 | + | 13 | | | - | |
| 3 | 68 | F | Pcom aneurysm | 4 | + | 13 | Worsening
headache | HHTh and
ICaChA | Ischemic lesion to
the right temporo-parietal | Left foot
palsy |
| 4 | 41 | M | Acom aneurysm | 3 | + | 12 | Worsening
headache | HHTh and
ICaChA | Small area with
ischemic lesion to the right frontal | Emotional
disturbances |
| 5 | 55 | F | Left MCA
aneurysm | 3 | + | 14 | | HHTh | | |
| 6 | 69 | M | TBI non SAH | 1 | + | 7 | | | | |
| 7 | 85 | F | TBI non SAH | 1 | + | 13 | | | | |
| 8 | 45 | F | TBI | 2 | + | 15 | | | | |
| 9 | 67 | F | TBI non SAH | 1 | + | 15 | | | | |
| 10 | 34 | F | TBI non SAH | 1 | + | 15 | | | | |
| 11 | 81 | M | Left MCA
aneurysm | 3 | + | 13 | Worsening
headache | HHTh and
ICaChA | Ischemic lesion
left fronto-parietal | Right hand
palsy |
| 12 | 79 | F | TBI | 2 | + | 14 | | | | |
| 13 | 75 | M | TBI, aEDH | 2 | + | 12 | | HHTh and
ICaChA | Ischemic lesion
right frontal | Emotional
disturbances |
| 14 | 66 | F | TBI | 2 | + | 15 | | | | |
| 15 | 49 | F | TBI non SAH | 1 | _ | 15 | | | | |
| 16 | 54 | F | TBI | 2 | + | 14 | | | | |
| 17 | 55 | M | Right PCA
aneurysm | 4 | + | 7 | Worsening
headache | HHTh and
ICaChA | Ischemic lesion
right occipital | Visual
disturbances |
| 18 | 78 | F | TBI | 2 | + | 15 | | | | |
| 19 | 37 | F | TBI | 2 | + | 13 | | | | |
| 20 | 25 | F | TBI | 2 | + | 15 | | | | |
| 21 | 32 | M | Right MCA
aneurysm | 3 | + | 13 | Worsening
headache | HHTh and
ICaChA | Ischemic lesion
right fronto-parietal | Left foot
palsy |
| 22 | 62 | F | TBI non SAH | 1 | _ | 15 | | | | |
| 23 | 27 | F | TBI | 2 | + | 14 | | | | |
| 24 | 37 | M | TBI | 2 | + | 14 | Worsening
headache | | Ischemic lesion
left frontal | Emotional
disturbances |
| 25 | 56 | M | Right PCA
aneurysm | 3 | + | 12 | Decline in level of
consciousness, worsening headache | HHTh and
ICaChA | Ischemic lesion
right parieto-occipital | Left foot
palsy |
| 26 | 51 | F | TBI | 2 | + | 13 | | | | |
| 27 | 23 | F | TBI non SAH | 1 | _ | 15 | | | | |
| 28 | 69 | F | TBI | 2 | + | 14 | | | | |
| 29 | 67 | M | Left MCA
aneurysm | 3 | + | 15 | Worsening
headache | HHTh and
ICaChA | Ischemic lesion
left parietal | Right hand
palsy |
| 30 | 46 | M | Left ACA
aneurysm | 4 | + | 8 | Decline in level of
consciousness, worsening headache | HHTh and
ICaChA | Ischemic lesion
left fronto-parietal | Right foot
palsy |
| 31 | 45 | F | TBI | 2 | + | 14 | | | | |
| 32 | 71 | M | TBI | 2 | + | 15 | | | | |
| 33 | 74 | M | Right ACA
aneurysm | 3 | + | 14 | Worsening
headache | HHTh and
ICaChA | Ischemic
lesion | Emotional
disturbances |
| 34 | 43 | M | TBI non SAH | 1 | _ | 14 | | | right frontal | |
The TCD and CTP data are presented in Tables II and III, respectively. In addition, in the 12
patients who presented with permanent neurological deficits, CTP
revealed reduced CBF and prolonged MTT. TCD also revealed elevated
PSVs and PIs in the same patients, apart from patient no. 4, whose
right ACA PI was normal (=0.9). In addition, TCD revealed that the
right ACA PI of patient no. 21 was normal (=1) with PSV=87 cm/sec
and MFV=69 cm/sec, the right PCA PI of patient no. 25 was 1.2 with
PSV=58 cm/sec and MFV=35 cm/sec, and the left MCA PI of patient no.
30 was normal (=0.8) with PSV=89 cm/sec and MFV=87 cm/sec.
| Table IITranscranial Doppler parameters. |
Table II
Transcranial Doppler parameters.
| |
Patient
no. |
|---|
| Parameters | 1 | 2 | 3 | 4 | 5 | 6 | 7 | 8 | 9 | 10 | 11 | 12 | 13 | 14 | 15 | 16 | 17 |
|---|
| PCA (left) | | | | | | | | | | | | | | | | | |
|
-PSV
(cm/sec) | 81 | 63 | 134 | 118 | 121 | 57 | 56 | 50 | 56 | 143 | 63 | 48 | 71 | 106 | 64 | 107 | 95 |
|
-EDV
(cm/sec) | 34 | 30 | 32 | 28 | 30 | 17 | 15 | 17 | 15 | 54 | 16 | 19 | 32 | 51 | 19 | 24 | 18 |
|
-MFV
(cm/s) | 49 | 42 | 66 | 58 | 53 | 28 | 28 | 36 | 41 | 84 | 42 | 29 | 45 | 69 | 50 | 75 | 77 |
|
-PI
(cm/sec) | 0.9 | 0.7 | 1.5 | 1.5 | 1.6 | 1.3 | 1.4 | 0.9 | 1 | 1 | 0.7 | 1 | 0.8 | 0.8 | 0.9 | 1.1 | 1 |
| PCA (right) | | | | | | | | | | | | | | | | | |
|
-PSV
(cm/sec) | 98 | 68 | 87 | 94 | 86 | 45 | 42 | 48 | 52 | 208 | 42 | 120 | 82 | 81 | 56 | 117 | 191 |
|
-EDV
(cm/sec) | 19 | 36 | 35 | 30 | 40 | 15 | 16 | 33 | 21 | 86 | 30 | 24 | 47 | 34 | 13 | 15 | 22 |
|
-MFV
(cm/sec) | 46 | 47 | 49 | 52 | 54 | 25 | 26 | 15 | 44 | 127 | 26 | 56 | 59 | 49 | 43 | 85 | 105 |
|
-PI
(cm/sec) | 1.7 | 0.7 | 1.1 | 1.2 | 0.8 | 1.2 | 1 | 1 | 0.7 | 0.9 | 1 | 1 | 0.6 | 0.9 | 1 | 1.2 | 1.6 |
| MCA (left) | | | | | | | | | | | | | | | | | |
|
-PSV
(cm/sec) | 91 | 106 | 118 | 199 | 168 | 59 | 64 | 59 | 62 | 126 | 189 | 76 | 106 | 63 | 58 | 84 | 93 |
|
-EDV
(cm/sec) | 34 | 51 | 31 | 74 | 46 | 18 | 19 | 15 | 22 | 48 | 23 | 27 | 51 | 30 | 21 | 13 | 19 |
|
-MFV
(cm/sec) | 53 | 69 | 60 | 116 | 87 | 32 | 35 | 48 | 41 | 74 | 110 | 44 | 69 | 42 | 61 | 118 | 82 |
|
-PI
(cm/sec) | 1.0 | 0.8 | 1.4 | 1.1 | 1.3 | 1.3 | 1.2 | 0.9 | 1 | 1 | 1.5 | 1.1 | 0.8 | 0.7 | 0.6 | 0.6 | 0.9 |
| MCA (right) | | | | | | | | | | | | | | | | | |
|
-PSV
(cm/sec) | 71 | 82 | 113 | 188 | 190 | 81 | 77 | 61 | 59 | 165 | 88 | 82 | 91 | 42 | 69 | 87 | 76 |
|
-EDV
(cm/sec) | 32 | 47 | 33 | 64 | 49 | 24 | 27 | 17 | 21 | 89 | 40 | 29 | 34 | 16 | 16 | 21 | 15 |
|
-MFV
(cm/sec) | 45 | 59 | 60 | 106 | 96 | 43 | 43 | 62 | 47 | 114 | 56 | 46 | 53 | 26 | 75 | 82 | 67 |
|
-PI
(cm/sec) | 0.8 | 0.6 | 1.3 | 1.1 | 1.4 | 1.3 | 1.1 | 0.7 | 0.8 | 0.6 | 0.8 | 1.1 | 1 | 1 | 0.7 | 0.8 | 0.9 |
| ACA (left) | | | | | | | | | | | | | | | | | |
|
-PSV
(cm/sec) | 138 | 88 | 94 | 143 | 126 | 83 | 79 | 48 | 47 | 81 | 168 | 88 | 145 | 75 | 74 | 91 | 79 |
|
-EDV
(cm/sec) | 28 | 40 | 26 | 54 | 48 | 22 | 24 | 19 | 19 | 24 | 28 | 40 | 73 | 37 | 21 | 19 | 17 |
|
-MFV
(cm/sec) | 64 | 56 | 48 | 84 | 74 | 43 | 42 | 36 | 35 | 43 | 82 | 56 | 98 | 50 | 75 | 80 | 68 |
|
-PI
(cm/sec) | 1.7 | 0.9 | 1.4 | 1.0 | 1 | 1.4 | 1.3 | 0.8 | 0.8 | 1.3 | 1.7 | 0.8 | 0.7 | 0.7 | 0.7 | 0.9 | 0.9 |
| ACA (right) | | | | | | | | | | | | | | | | | |
|
-PSV
(cm/sec) | 468 | 145 | 190 | 208 | 165 | 76 | 82 | 46 | 49 | 57 | 145 | 126 | 160 | 77 | 87 | 86 | 81 |
|
-EDV
(cm/sec) | 77 | 73 | 79 | 86 | 89 | 27 | 29 | 15 | 21 | 13 | 73 | 48 | 19 | 27 | 19 | 18 | 12 |
|
-MFV
(cm/sec) | 208 | 98 | 119 | 127 | 114 | 44 | 46 | 34 | 28 | 28 | 98 | 74 | 88 | 43 | 75 | 85 | 98 |
|
-PI
(cm/sec) | 1.9 | 0.9 | 0.9 | 0.9 | 0.6 | 1.1 | 1.1 | 0.9 | 1 | 1.1 | 0.7 | 1 | 1.6 | 1.1 | 0.9 | 0.8 | 0.7 |
| Total PSV (cm/sec)
(mean) | 157.8 | 92 | 122.6 | 158.3 | 142.6 | 66.8 | 66.6 | 52 | 54.1 | 130 | 115.8 | 90 | 109.1 | 74.0 | 68 | 95.3 | 102.5 |
| Total PI (cm/sec)
(mean) | 1.5 | 0.7 | 1.2 | 1.1 | 1.1 | 1.2 | 1.1 | 0.8 | 0.8 | 0.9 | 1.0 | 1.0 | 0.9 | 0.8 | 0.8 | 0.9 | 1.0 |
|
PCA
(left) | | | | | | | | | | | | | | | | | |
|
-PSV
(cm/sec) | 67 | 59 | 110 | 75 | 67 | 76 | 64 | 102 | 110 | 120 | 97 | 86 | 91 | 89 | 77 | 67 | 98 |
|
-EDV
(cm/sec) | 15 | 18 | 23 | 27 | 29 | 15 | 21 | 13 | 73 | 48 | 19 | 27 | 19 | 14 | 27 | 21 | 25 |
|
-MFV
(cm/sec) | 57 | 45 | 72 | 43 | 42 | 61 | 39 | 127 | 37 | 80 | 70 | 65 | 90 | 125 | 55 | 65 | 73 |
|
-PI
(cm/sec) | 0.9 | 0.9 | 1.2 | 1.1 | 0.9 | 1 | 1.1 | 0.7 | 1 | 0.9 | 1.1 | 0.9 | 0.8 | 0.6 | 0.9 | 0.7 | 1 |
| PCA (right) | | | | | | | | | | | | | | | | | |
|
-PSV
(cm/sec) | 78 | 64 | 107 | 46 | 49 | 57 | 145 | 58 | 83 | 79 | 48 | 47 | 81 | 168 | 88 | 145 | 75 |
|
-EDV
(cm/sec) | 21 | 16 | 19 | 29 | 15 | 21 | 24 | 16 | 48 | 22 | 24 | 19 | 19 | 24 | 28 | 35 | 29 |
|
-MFV
(cm/sec) | 71 | 68 | 67 | 24 | 37 | 40 | 121 | 35 | 43 | 81 | 34 | 40 | 68 | 160 | 60 | 122 | 57 |
|
-PI
(cm/sec) | 0.8 | 0.7 | 1.3 | 0.7 | 0.9 | 0.9 | 1 | 1.2 | 0.8 | 0.7 | 0.7 | 0.7 | 0.9 | 0.9 | 1 | 0.9 | 0.8 |
| MCA (left) | | | | | | | | | | | | | | | | | |
|
-PSV
(cm/sec) | 87 | 71 | 99 | 77 | 61 | 99 | 165 | 88 | 82 | 91 | 142 | 179 | 89 | 110 | 98 | 103 | 95 |
|
-EDV
(cm/sec) | 19 | 12 | 18 | 21 | 13 | 41 | 48 | 19 | 27 | 19 | 14 | 24 | 19 | 35 | 38 | 32 | 29 |
|
-MFV
(cm/sec) | 68 | 73 | 54 | 70 | 68 | 82 | 167 | 76 | 61 | 72 | 160 | 86 | 87 | 68 | 66 | 88 | 94 |
|
-PI
(cm/sec) | 1 | 0.8 | 1.5 | 0.8 | 0.7 | 0.7 | 0.7 | 0.9 | 0.9 | 1 | 0.8 | 1.8 | 0.8 | 1.1 | 0.9 | 0.8 | 0.7 |
| MCA (right)) | | | | | | | | | | | | | | | | | |
|
-PSV
(cm/sec) | 78 | 69 | 89 | 75 | 67 | 76 | 64 | 102 | 110 | 120 | 97 | 86 | 91 | 89 | 77 | 67 | 101 |
|
-EDV
(cm/sec) | 16 | 18 | 12 | 17 | 21 | 23 | 19 | 25 | 20 | 36 | 17 | 22 | 24 | 15 | 21 | 14 | 20 |
|
-MFV
(cm/sec) | 68 | 51 | 85 | 72 | 46 | 75 | 75 | 85 | 112 | 105 | 86 | 91 | 74 | 82 | 70 | 53 | 115 |
|
-PI
(cm/sec) | 0.9 | 1 | 0.9 | 0.8 | 1 | 0.7 | 0.6 | 0.9 | 0.8 | 0.8 | 0.9 | 0.7 | 0.9 | 0.9 | 0.8 | 1 | 0.7 |
| ACA (left) | | | | | | | | | | | | | | | | | |
|
-PSV
(cm/sec) | 67 | 75 | 67 | 76 | 64 | 102 | 191 | 102 | 110 | 120 | 97 | 86 | 67 | 102 | 110 | 120 | 97 |
|
-EDV
(cm/sec) | 16 | 25 | 20 | 16 | 17 | 22 | 17 | 17 | 21 | 23 | 19 | 25 | 21 | 20 | 46 | 37 | 22 |
|
-MFV
(cm/sec) | 56 | 55 | 58 | 60 | 67 | 88 | 102 | 106 | 111 | 107 | 111 | 67 | 51 | 91 | 71 | 103 | 75 |
|
-PI
(cm/sec) | 0.9 | 0.9 | 0.8 | 1 | 0.7 | 0.9 | 1.7 | 0.8 | 0.8 | 0.9 | 0.7 | 0.9 | 0.9 | 0.9 | 0.9 | 0.8 | 1 |
| ACA (right) | | | | | | | | | | | | | | | | | |
|
-PSV
(cm/sec) | 86 | 110 | 112 | 87 | 82 | 46 | 49 | 57 | 145 | 126 | 160 | 67 | 76 | 64 | 102 | 193 | 102 |
|
-EDV
(cm/sec) | 18 | 29 | 32 | 18 | 29 | 15 | 21 | 13 | 73 | 48 | 39 | 27 | 19 | 18 | 29 | 23 | 32 |
|
-MFV
(cm/sec) | 77 | 90 | 114 | 69 | 40 | 18 | 35 | 62 | 58 | 111 | 134 | 44 | 43 | 51 | 81 | 100 | 85 |
|
-PI
(cm/sec) | 0.9 | 0.9 | 0.7 | 1 | 1.3 | 1.7 | 0.8 | 0.7 | 0.7 | 0.7 | 0.9 | 0.9 | 1.3 | 0.9 | 0.9 | 1.7 | 0.8 |
| Total PSV
(cm/sec) | 77.1 | 74.6 | 97.3 | 72.6 | 65 | 76 | 113 | 84.8 | 106.6 | 109.3 | 106.8 | 91.8 | 82.5 | 103.6 | 92 | 115.8 | 94.6 |
| Total PI
(cm/sec) | 0.9 | 0.8 | 1.0 | 0.9 | 0.9 | 0.9 | 0.9 | 0.8 | 0.8 | 0.8 | 0.8 | 0.9 | 0.9 | 0.8 | 0.9 | 0.9 | 0.8 |
| Table IIICT perfusion (white matter)
parameters. |
Table III
CT perfusion (white matter)
parameters.
| |
Patient
no. |
|---|
| Parameters | 1 | 2 | 3 | 4 | 5 | 6 | 7 | 8 | 9 | 10 | 11 | 12 | 13 | 14 | 15 | 16 | 17 |
|---|
| CBV
(mlblood/100 gtissue) | | | | | | | | | | | | | | | | | |
|
Right | | | | | | | | | | | | | | | | | |
|
Frontal | 2.8 | 3.9 | 1.4 | 2.3 | 3.1 | 3.8 | 4.1 | 1.4 | 2.2 | 1.3 | 1.6 | 2.9 | 0.1 | 2.0 | 1.4 | 1.9 | 0.6 |
|
Parietal | 4.8 | 4.6 | 2.2 | 2 | 4.4 | 3.6 | 3.7 | 1.5 | 2.0 | 1.1 | 1.8 | 2.7 | 0.1 | 1.0 | 1.0 | 2.1 | 0.7 |
|
Occipital | 5.5 | 5 | 3.5 | 2 | 3.9 | 4 | 3 | 2.4 | 2.1 | 1.2 | 2.1 | 3.0 | 0.1 | 1.3 | 1.4 | 2.5 | 0.5 |
|
Left | | | | | | | | | | | | | | | | | |
|
Frontal | 2.5 | 4.0 | 2.5 | 3.2 | 2.2 | 4.8 | 2.4 | 1.0 | 2.3 | 1.5 | 1.7 | 3.0 | 0.3 | 1.6 | 1.7 | 2.5 | 0.5 |
|
Parietal | 1.9 | 5.8 | 3.1 | 2.9 | 4.1 | 4.5 | 3.5 | 2.7 | 2.8 | 1.5 | 2.0 | 2.0 | 0.2 | 1.9 | 2.2 | 2,8 | 0.4 |
|
Occipital | 5.0 | 5.3 | 2.3 | 2 | 2.8 | 3.9 | 3.1 | 1.1 | 2.1 | 1.2 | 1.7 | 3.8 | 0.3 | 1.0 | 1.8 | 1.7 | 0.3 |
| Total (mean) | 3.7 | 4.7 | 2.5 | 2.4 | 3.4 | 4.1 | 3.3 | 1.6 | 2.2 | 1.3 | 1.8 | 2.9 | 0.2 | 1.4 | 1.5 | 2.2 | 0.5 |
| CBF
(mlblood/100 gtissue min) | | | | | | | | | | | | | | | | | |
|
Right | | | | | | | | | | | | | | | | | |
|
Frontal | 18.6 | 32.8 | 4.2 | 8.6 | 34.1 | 42.8 | 53 | 35.2 | 44.1 | 27.9 | 30 | 46.9 | 1.1 | 38.4 | 28.8 | 37.2 | 10.1 |
|
Parietal | 35.6 | 30 | 10.6 | 15.6 | 33.3 | 12 | 41 | 29.4 | 42.3 | 31.2 | 29 | 52.8 | 2.3 | 33.2 | 27.4 | 36.4 | 12.3 |
|
Occipital | 31.8 | 30 | 17.4 | 11.8 | 33.4 | 31.9 | 48 | 36.2 | 48.4 | 26.5 | 31 | 63.3 | 2.5 | 38.2 | 31.3 | 38.6 | 3.9 |
|
Left | | | | | | | | | | | | | | | | | |
|
Frontal | 19.5 | 33.2 | 5.3 | 9.5 | 16.3 | 44.7 | 42.3 | 26.7 | 43.7 | 32.5 | 13.8 | 62.3 | 5.1 | 29.1 | 26.4 | 37.4 | 12.8 |
|
Parietal | 15.9 | 33 | 12.9 | 15.9 | 11.4 | 42.9 | 41 | 42.3 | 45.9 | 33.4 | 14.1 | 62.9 | 5.7 | 47.6 | 33.4 | 40.6 | 9.9 |
|
Occipital | 34.5 | 33 | 17.5 | 14.5 | 36.1 | 41.5 | 35 | 33.9 | 45.3 | 25.7 | 21 | 57.2 | 10.1 | 30.1 | 30.4 | 34.9 | 8.3 |
| Total (mean) | 25.9 | 32 | 11.3 | 12.6 | 27.4 | 35.9 | 43.3 | 33.9 | 44.9 | 29.5 | 23.1 | 57.5 | 4.4 | 36.1 | 29.6 | 37.5 | 9.5 |
| MTT (sec) | | | | | | | | | | | | | | | | | |
|
Right | | | | | | | | | | | | | | | | | |
|
Frontal | 9.1 | 7.3 | 5 | 4.1 | 10.9 | 4 | 3.9 | 2.4 | 3.1 | 3.0 | 3.2 | 3.8 | 8.9 | 3.2 | 3.0 | 3.2 | 4.1 |
|
Parietal | 8.2 | 9.3 | 7.4 | 4.2 | 8.7 | 3.9 | 4 | 3.2 | 2.9 | 2.2 | 3.9 | 3.1 | 2.2 | 2.9 | 2.2 | 3.5 | 3.8 |
|
Occipital | 10.5 | 10 | 6 | 4.5 | 7.1 | 4 | 4.9 | 4 | 2.7 | 2.6 | 4.2 | 2.9 | 3.6 | 2.1 | 2.7 | 4 | 8.1 |
|
Left | | | | | | | | | | | | | | | | | |
|
Frontal | 7.9 | 7.4 | 5.3 | 7.9 | 9.1 | 3.9 | 3.8 | 2.3 | 3.2 | 2.9 | 7.8 | 2.9 | 3.8 | 3.3 | 3.9 | 4.1 | 2.5 |
|
Parietal | 7.4 | 9.6 | 2.5 | 7.4 | 6 | 4.7 | 4.1 | 3.9 | 3.7 | 2.7 | 8.9 | 2.0 | 2.9 | 2.4 | 4.1 | 4.2 | 3.0 |
|
Occipital | 8.7 | 9.7 | 6.3 | 8.7 | 5.2 | 3.8 | 4.2 | 2.0 | 2.8 | 3.0 | 5 | 4 | 3.1 | 2.1 | 3.6 | 3.0 | 2.7 |
| Total (mean) | 8.6 | 8.8 | 5.4 | 6.1 | 7.8 | 4.0 | 4.1 | 2.9 | 3.0 | 2.7 | 5.5 | 3.4 | 4 | 2.6 | 3.3 | 3.5 | 3.8 |
| Table III
Continued. |
| |
Patient
no. |
| Parameters | 18 | 19 | 20 | 21 | 22 | 23 | 24 | 25 | 26 | 27 | 28 | 29 | 30 | 31 | 32 | 33 | 34 |
| CBV
(mlblood/100 gtissue) | | | | | | | | | | | | | | | | | |
|
Right | | | | | | | | | | | | | | | | | |
|
Frontal | 1.2 | 3.5 | 1.9 | 0.4 | 2.8 | 1.7 | 1.1 | 0.8 | 1.7 | 1.7 | 1.9 | 0.8 | 1.3 | 1.7 | 2.3 | 0.4 | 1.8 |
|
Parietal | 0.7 | 3 | 1.8 | 0.5 | 3.4 | 2.1 | 1.1 | 0.4 | 1.3 | 3.4 | 1.9 | 1.1 | 1.4 | 1.2 | 2.4 | 0.6 | 2.5 |
|
Occipital | 1.3 | 3.5 | 2.0 | 0.5 | 3.1 | 1.5 | 0.8 | 0.2 | 1.5 | 3.0 | 2.3 | 1.0 | 0.8 | 1.8 | 1.8 | 0.4 | 1.9 |
|
Left | | | | | | | | | | | | | | | | | |
|
Frontal | 1.6 | 3.5 | 1.5 | 0.6 | 3.2 | 2.7 | 0.3 | 1.3 | 1.4 | 1.3 | 2.1 | 0.8 | 0.4 | 1.4 | 2.6 | 0.7 | 1.7 |
|
Parietal | 1.1 | 3.7 | 1.9 | 0.4 | 1.6 | 2.5 | 1.1 | 0.7 | 1.6 | 3.6 | 1.8 | 0.4 | 0.5 | 2.2 | 2.9 | 0.9 | 2.7 |
|
Occipital | 1.7 | 3.4 | 1.6 | 0.8 | 2.9 | 2.4 | 1.0 | 0.6 | 1.4 | 2.2 | 2.3 | 0.6 | 0.7 | 1.6 | 2.7 | 1 | 1.6 |
| Total (mean) | 1.2 | 3.4 | 1.7 | 0.5 | 2.6 | 2.1 | 0.9 | 0.6 | 1.4 | 2.5 | 2.0 | 0.7 | 0.8 | 1.6 | 2.4 | 0.6 | 2.0 |
| CBF
(mlblood/100 gtissue min) | | | | | | | | | | | | | | | | | |
|
Right | | | | | | | | | | | | | | | | | |
|
Frontal | 26.2 | 55.8 | 28.2 | 2.9 | 44.1 | 38 | 16.9 | 13.2 | 28.4 | 45 | 36.8 | 17.8 | 22.3 | 33.2 | 38.5 | 3.1 | 38.9 |
|
Parietal | 25.8 | 56.3 | 27.1 | 3.5 | 53.9 | 39.7 | 17.1 | 2.9 | 27.6 | 55.2 | 36.3 | 18.4 | 20.8 | 29.4 | 39.6 | 12.7 | 41.7 |
|
Occipital | 27.2 | 55.7 | 38.1 | 8.4 | 45.9 | 37 | 17.3 | 1.1 | 24.6 | 44.7 | 36.7 | 16.3 | 21.9 | 34.7 | 38.3 | 11.6 | 39.4 |
|
Left | | | | | | | | | | | | | | | | | |
|
Frontal | 24.7 | 66.6 | 28.7 | 14.8 | 52.1 | 39.5 | 1.9 | 22.2 | 25.4 | 34.5 | 35.2 | 12.8 | 3.5 | 28.1 | 47.4 | 15.3 | 37.6 |
|
Parietal | 24.9 | 56.4 | 30.3 | 13.9 | 43.7 | 37.9 | 16.3 | 12.9 | 25.5 | 51.3 | 37.4 | 2.4 | 3.9 | 31.9 | 39.7 | 14.9 | 42.9 |
|
Occipital | 26.4 | 60.3 | 29.2 | 12.5 | 43.8 | 37 | 16 | 16.4 | 26.4 | 46.6 | 35.8 | 13.2 | 12.6 | 30.1 | 41.8 | 16 | 38.2 |
| Total (mean) | 25.8 | 58.5 | 30.2 | 9.3 | 47.2 | 38.1 | 14.2 | 11.4 | 26.3 | 46.2 | 36.3 | 13.4 | 14.1 | 31.2 | 40.8 | 12.2 | 39.7 |
| MTT (sec) | | | | | | | | | | | | | | | | | |
|
Right | | | | | | | | | | | | | | | | | |
|
Frontal | 2.9 | 3.8 | 4.2 | 10.1 | 3.9 | 2.7 | 4 | 3.9 | 3.8 | 2.3 | 3.2 | 2.9 | 3.5 | 3.2 | 3.7 | 8.9 | 2.9 |
|
Parietal | 1.8 | 3.2 | 4 | 9.8 | 3.8 | 3.3 | 3.9 | 9.7 | 2.9 | 3.8 | 3.3 | 3.9 | 4.1 | 2.5 | 3.7 | 3.1 | 3.6 |
|
Occipital | 2.9 | 3.8 | 3.3 | 3.9 | 4.1 | 2.5 | 2.8 | 8.8 | 3.7 | 4.1 | 3.9 | 3.8 | 2.3 | 3.2 | 2.9 | 2.5 | 2.9 |
|
Left | | | | | | | | | | | | | | | | | |
|
Frontal | 4.0 | 3.2 | 3.3 | 2.8 | 3.8 | 4.2 | 10.2 | 3.6 | 3.5 | 2.4 | 3.7 | 4.1 | 7.7 | 3 | 3.4 | 3.1 | 2.7 |
|
Parietal | 2.8 | 4 | 3.9 | 1.9 | 2.2 | 4 | 4.2 | 3.5 | 3.9 | 4.3 | 3 | 10.2 | 8.2 | 4.3 | 4.5 | 3.9 | 3.8 |
|
Occipital | 3.9 | 3.4 | 3.3 | 3.9 | 4.1 | 3.9 | 3.8 | 2.3 | 3.2 | 2.9 | 4 | 2.9 | 3.8 | 3.3 | 3.9 | 4.1 | 2.5 |
| Total (mean) | 3 | 3.5 | 3.6 | 5.4 | 3.6 | 3.4 | 4.8 | 5.3 | 3.5 | 3.3 | 3.5 | 4.6 | 4.9 | 3.6 | 3.6 | 4.2 | 3 |
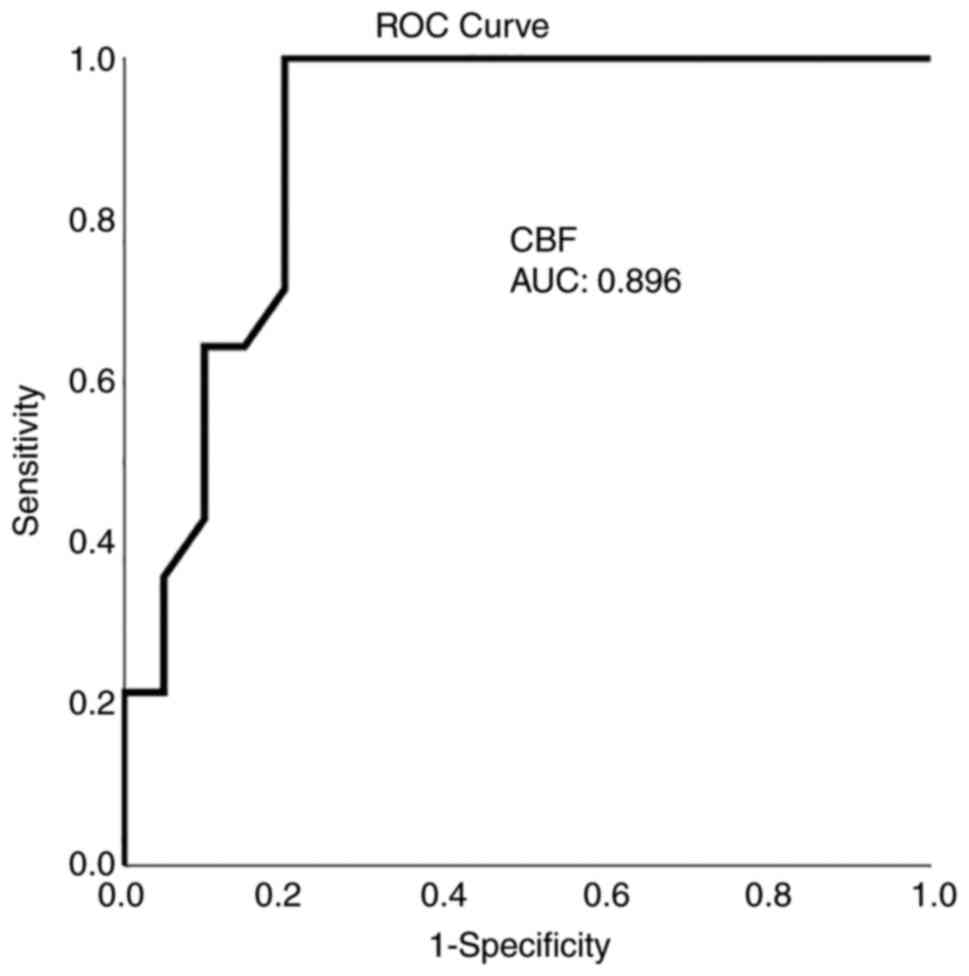
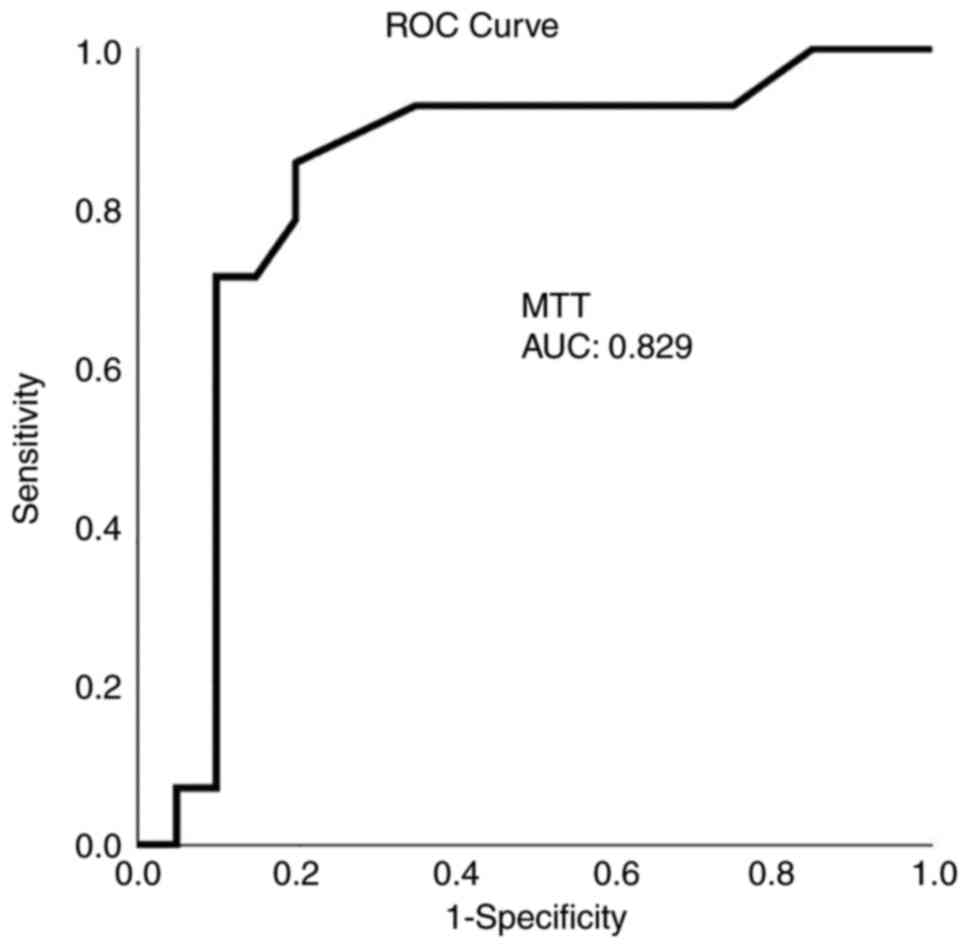
Diagnostics
ROC analysis demonstrated that, among the CTP and
TCD variables, a CBF value <21.5 ml x 100 g-1 x
min-1 with 92.9% sensitivity and 80% specificity and an
MTT value >3.7 sec with 86% sensitivity and 80% specificity
presented the optimal performance to diagnose adverse ischemic
events at 1 month, as evaluated by an area-under-the-curve standard
error [AUC(SE)] of 0.89(0.06), P=0.005 (Table IV and Fig. 1, Fig.
2, Fig. 3 and Fig. 4).
| Table IVROC analysis. |
Table IV
ROC analysis.
| Name | Total CBF
(mlblood/100 gtissue min) | Total CBV
(mlblood/100 gtissue) | Total MTT
(sec) | Total PI
(cm/sec) | Total PSV
(cm/sec) |
|---|
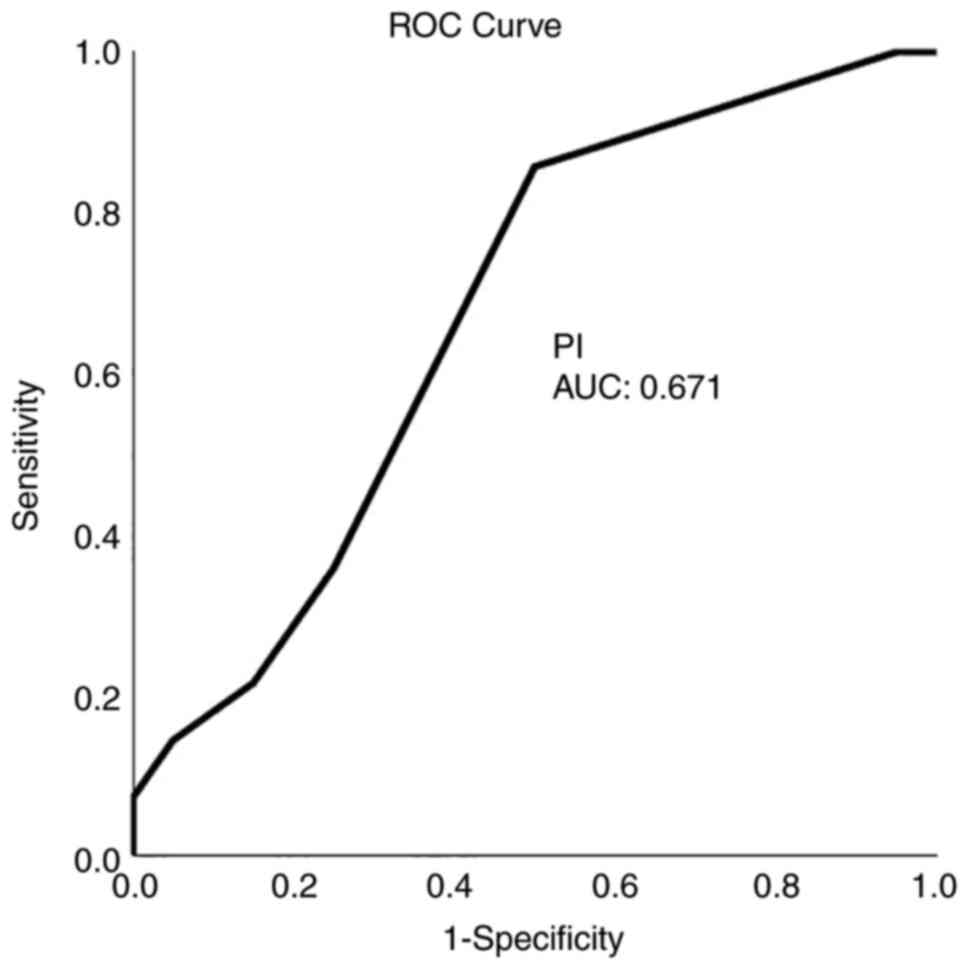
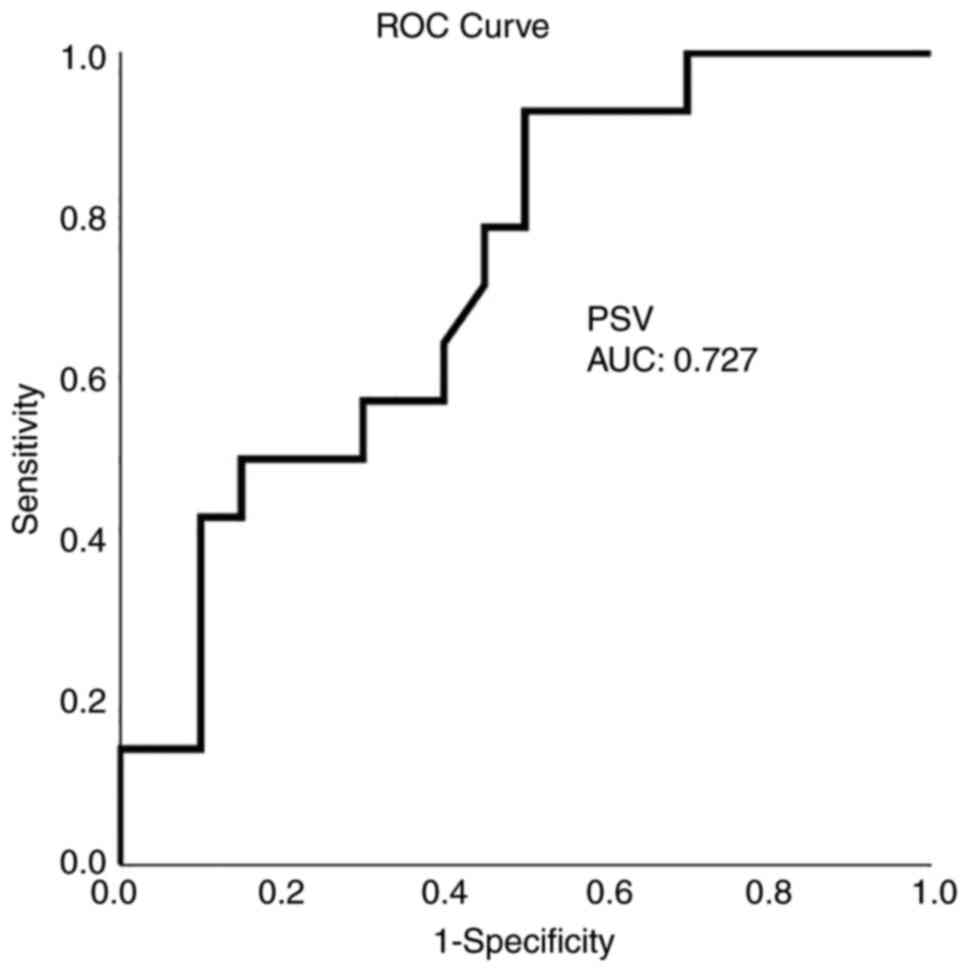
| Area | 0.896 | 0.254 | 0.829 | 0.671 | 0.727 |
| Std Error | 0.055 | 0.093 | 0.079 | 0.093 | 0.087 |
| P-value | 0.000 | 0.016 | 0.001 | 0.093 | 0.026 |
Univariate analysis performed with the use of the
Mann-Whitney U test revealed that there was a statistically
significant difference in the mean values of PSV, CBF, CBV and MTT
between participants who developed adverse ischemic events and
between those who did not develop adverse ischemic events
(P<0.05, Table V).
| Table VUnivariate analysis (outcome,
ischemic event at 1 month). |
Table V
Univariate analysis (outcome,
ischemic event at 1 month).
| Parameter | Patients with an
ischemic event | Patients without an
ischemic event | P-value |
|---|
| Age | 57.8±22 | 52.0±15 | 0.248 |
| Blood pressure | 91.2±9 | 95.7±11 | 0.203 |
| GCS | 13.3±2 | 12.9±2 | 0.367 |
| Total PSV
(cm/sec) | 108.08±25.63 | 87.38±24.29 | 0.023 |
| Total PI
(cm/sec) | 0.97±0.18 | 0.89±0.12 | 0.097 |
| CBF
(mlblood/100 gtissue min) | 22.59±5.65 | 12.81±12.08 | 0.003 |
| CBV
(mlblood/100 gtissue min) | 2.22±0.73 | 1.10±1.14 | 0.004 |
| MTT (sec) | 3.85±1.57 | 4.94±1.35 | 0.001 |
Cox proportion hazards multivariate regression
analysis (Table VI) revealed that
CBF was an independent factor in detecting an ischemic events in 1
month (P=0.003).
| Table VIMultivariate analysis (outcome,
ischemic event at 1 month). |
Table VI
Multivariate analysis (outcome,
ischemic event at 1 month).
| | 95% CI for
Exp(B) |
|---|
| Parameter | P-value | Exp(B) | Lower | Upper |
|---|
| Total PSV mean
(cm/sec) | 0.331 | 1.054 | 0.948 | |
| CBV mean
(mlblood/100 gtissue min) | 0.926 | 0.900 | 1.005 | 1.105 |
| CBF mean
(mlblood/100 gtissue min) | 0.003 | 1.150 | 1.197 | 8.337 |
| MTT mean (sec) | 0.614 | 0.774 | 0.943 | 1.402 |
Discussion
The results of the present study suggest that CTP is
obtainable in everyday practice, and it may provide valuable
details about SAH-associated CV. Certainly, CTP, and mainly CBF and
MTT, can help to recognize patients who develop delayed unfavorable
ischemic incidents and are more precise than TCD at this point.
Thus, the CTP constitutes a very hopeful diagnostic instrument for
managing SAH.
DSA is the gold standard for identifying CV and
different cerebrovascular entities (1,20,21).
However, the invasiveness of the procedure and the radiation
exposure require careful patient selection and preclude widespread
use (15). In addition, a number of
invasive procedures, such as intracerebral CBF-dimension and
microdialysis, have been developed due to their significance in
detecting CV in patients after SAH (15). Those methods eschew the hazards of
setting and continuing monitoring with intracerebral probes, such
as infection, and they are only accurate if the calculation is
performed in an area of the brain that will eventually be affected
by decreased perfusion (1,15). Furthermore, MR perfusion, CTP,
positron emission tomography, Xenon CT and single-photon emission
CT all permit tomographic CBF evaluation. However, CTP is currently
the most commonly used and studied imaging technique (22). A range of cut-off values associated
with DCI has been mentioned, counting an MTT value >5.0-6.4 sec
or a local CBF value <25-40 ml x 100 g-1 x
min-1 (1,23).
The present study detected two separate major types
of patients depending on their CTP and TCD data. The first profile
was related to the clinical outcomes without ischemic damage in the
CT scan at these locations, whereas the second one was related to
unfavorable clinical outcomes with ischemic damage in the CT scan.
In the first profile, the majority of patients had CTP that
indicated no vasospasm or mild vasospasm according to the CBF and
MTT values; this was observed in patient nos. 2 and 5. In patient
no. 2, CTP revealed only delayed MTT from 7.3 to 10 sec and TCD
revealed elevated PIs (0.9 in both right and left ACAs), indicating
severe vasospasm. In patient no. 5, CTP demonstrated a decrease in
CBF with delayed MTT, and TCD demonstrated elevated PIs in the
right and left MCAs (1.4 and 1.3, respectively) and the left PCA
(1.6), indicating mild vasospasm. On the other hand, 12 patients
with the second profile, had CTP that illustrated substantial
vasospasm with clinically and radiologically evident infarct
lesions (Table I); however, PI
values in TCD had a range between normal and 1.3, which is in
agreement mainly with mild or no vasospasm (i.e., patient nos. 1,
3, 4, 21, 25 and 30). For patient no. 1, CTP demonstrated a
decreased CBF value (in the right and left frontal, as well as left
parietal areas), normal CBV values, and delayed MTT (7.4 to 10.5
sec), and TCD revealed a mean PI value of 1.5. In patient no. 3,
CTP revealed decreased CBF and CBV values in the right frontal and
parietal areas and delayed MTT mostly in the left part (7.4 to 10.9
sec), and TCD revealed a mean PI value of 1.2. In patient no. 4,
CTP revealed reduced CBF and delayed MTT in the left from 7.4 to
8.7 sec, and TCD revealed a mean PI value of 1.1 (Tables II and III).
These findings indicate that CTP indices (CBF and
MTT) presented a better dispersion in ROC analysis in comparison
with TCD values (Table IV). CBF
represents the blood flow in the brain, and any decrease in its
value is strongly connected with the incidence and severity of
vasospasm, which constitutes an important predictor variable of
clinical outcome as well. CTP parameters (CBF and MTT) appear to be
associated quite well with CI, although focal flow reduction can
also be presented as a result of brain damage, retraction, or
perihematomal brain impairment (1,5). On the
contrary, TCD provides considerable information about the flow
changes in an arterial segment and, based on the spectral models in
a range of nearby intracranial arteries, it can identify CV in the
MCA (24) and may possibly help as a
comparatively simple screening technique of the vasospasm; however,
some authors were reluctant to report any association between TCD
and angiographic evidence in patients with CV (1,25,26).
Additionally, TCD ultrasonography encounters both anatomical and
technical limitations and is an operator-dependent technique
(27).
CTP has been applied for the assessment of CI with
sensitivity between 74.1 and 84% and specificity between 79 and
93.0% (28,29). In the present study, all regions with
decreased CBF or prolonged MTT were associated with delayed
ischemic unfavorable incidents, i.e., CBF [AUC (SE)] of 0.89(0.06),
P=0.005, and MTT [AUC(SE)] of 0.82(0.07), P=0.001. This finding is
in agreement with previous reports stating that a CBF reduction may
suggest permanent ischemic lesions with a CBF threshold <25 ml x
100 g-1 x min-1. In addition, when a CBF
decrease is associated with a CBV value <2 ml x 100
g-1 or with an increased MTT value >145%, core
ischemia or penumbra can be identified (29). In the present study, a CBF threshold
of 21.5 ml x 100 g-1 x min-1 and an MTT value
>3.7 sec with 80 sensitivity and 100% specificity for CBF and
86% sensitivity and 80% specificity for MTT, which were calculated
after an aneurysmal or traumatic SAH and they were similar to the
literature (29), detected an
unfavorable ischemic incident at 1 month. Previous studies have
reported that a reduced CBF with normal or raised CBV may also
indicate hemodynamic hypo-perfusion without real infarction damage
in reaction to the autoregulation (1,30).
MTT alone may indicate mild to moderate vasospasm,
whereas a MTT delay related to CBF and/or CBV changes may predict
severe vasospasm (30). In the
present study, all participants who obtained the aforementioned
triad had late unfavorable ischemic events; however, no patients
had MTT prolongation without any other CTP abnormalities, and
therefore, the value of MTT as a stand-alone indicator could not be
confirmed. Furthermore, in the present study, multivariable
analysis revealed that MTT prolongation was not an independent
factor for the diagnosis of ischemia at 1 month (P=0.614) and was
only associated with CBF abnormalities that were related to
clinical and CT indications of ischemia.
It is worth mentioning that imaging technology in
healthcare facilities has become more widely available worlwide
over time. Furthermore, the amount to which technology availability
has changed varies across different areas with some areas expand
and contract through time, whereas others expand and contract
faster (31). As regards SAH,
consecutive TCD measurements and the calculation of the hemispheric
index are currently routinely used in several neurointensive care
units. A regards the CTP, it requires the transportation of the
patient out of the intensive care unit, limiting the clinical
relevance of this method for monitoring (32).
A strong point of the present study is that it
evaluated the utility of the CTP procedure in the daily practice of
a tertiary hospital for the early recognition of symptomatic
vasospasm in preventing permanent neurological deterioration. The
present study also assessed the diagnostic performance of this
technique in the clinical outcomes, not only of patients with
aneurysmal, but and traumatic SAH in the first 24 h. This expansion
allows for the better evaluation and understanding of the complex
vasospasm entity.
The present study has certain limitations. It was a
small, single-center study. In addition, factors such as the ethnic
origin and the quality of different CT instruments vary between
studies. Therefore, firm conclusions regarding the role of CTP in
the management of SAH cannot be reached. However, the findings
presented herein may serve as a basis for future more extensive
multi-centered clinical studies with more homogeneous samples
formed by aneurysmal SAH, along with comparing CPT to angiogram
studies and assessing whether CBF predicts the response to
vasospasm treatment.
In conclusion, the data of the present study
demonstrated that the combination of CTP and TCD was instrumental
in diagnosing ischemic events. In patients with CV, TCD alone was
unable to achieve a good association with angiographic results. On
the other hand, CTP demonstrated better precision, and mainly, CBF
was a considerable index that could identify the extent of CI
precociously in patients experiencing SAH; thus, it may allow
intervention to prevent permanent neurological deterioration,
either through the accentuation of hypervolemic hypertensive
therapy, intra-arterial calcium channel administration, or
intracranial angioplasty. MTT prolongation was not an independent
factor, and only its relation with CBF abnormalities was associated
with clinical and CT evidence of ischemia.
Acknowledgements
Not applicable.
Funding
Funding: No funding was received.
Availability of data and materials
The datasets used and/or analyzed during the current
study are available from the corresponding author on reasonable
request.
Authors' contributions
GF, AAF and VEG conceptualized the study. VEG, AAF,
PP, PS, NT, VT, NM and KT made substantial contributions to data
analysis and interpretation, and wrote and prepared the draft of
the manuscript. DAS, VEG and GF analyzed the data and provided
critical revisions. VEG and GF confirm the authenticity of all the
data. All authors contributed to manuscript revision and have read
and approved the final version of the manuscript.
Ethics approval and consent to
participate
The Institutional Review Board (IRB) of University
of Thessaly, Greece/The School of Medicine/School of Health
Sciences approved the study (IRB no. 2492/19-01-2015). The study
was in line with the Declaration of Helsinki in 1995 (as revised in
Edinburgh 2000). Written informed was obtained from the
patients.
Patient consent for publication
Not applicable.
Competing interests
The authors declare that they have no competing
interests.
References
|
1
|
Fotakopoulos G, Makris D, Kotlia P,
Kapsalaki E, Papanikolaou J, Georgiadis I, Zakynthinos E and
Fountas K: The value of computed tomography perfusion &
transcranial doppler in early diagnosis of cerebral vasospasm in
aneurysmal & traumatic subarachnoid hemorrhage. Future Sci OA.
4(FSO313)2018.PubMed/NCBI View Article : Google Scholar
|
|
2
|
Ko NU, Rajendran P, Kim H, Rutkowski M,
Pawlikowska L, Kwok PY, Higashida RT, Lawton MT, Smith WS, Zaroff
JG and Young WL: Endothelial nitric oxide synthase polymorphism
(-786T->C) and increased risk of angiographic vasospasm after
aneurysmal subarachnoid hemorrhage. Stroke. 39:1103–1108.
2008.PubMed/NCBI View Article : Google Scholar
|
|
3
|
Dumont AS, Dumont RJ, Chow MM, Lin CL,
Calisaneller T, Ley KF, Kassell NF and Lee KS: Cerebral vasospasm
after subarachnoid hemorrhage: Putative role of inflammation.
Neurosurgery. 53:123–133. 2003.PubMed/NCBI View Article : Google Scholar
|
|
4
|
Starke RM, Kim GH, Komotar RJ, Hickman ZL,
Black EM, Rosales MB, Kellner CP, Hahn DK, Otten ML, Edwards J, et
al: Endothelial nitric oxide synthase gene single-nucleotide
polymorphism predicts cerebral vasospasm after aneurysmal
subarachnoid hemorrhage. J Cereb Blood Flow Metab. 28:1204–1211.
2008.PubMed/NCBI View Article : Google Scholar
|
|
5
|
Francoeur CL and Mayer SA: Management of
delayed cerebral ischemia after subarachnoid hemorrhage. Crit Care.
20(277)2016.PubMed/NCBI View Article : Google Scholar
|
|
6
|
Foley WD, Smith DF, Milde MW, Lawson TL,
Towne JB and Bandyk DF: Intravenous DSA examination of patients
with suspected cerebral ischemia. Radiology. 151:651–659.
1984.PubMed/NCBI View Article : Google Scholar
|
|
7
|
Muir KW, Baird-Gunning J, Walker L, Baird
T, McCormick M and Coutts SB: Can the ischemic penumbra be
identified on noncontrast CT of acute stroke? Stroke. 38:2485–2490.
2007.PubMed/NCBI View Article : Google Scholar
|
|
8
|
Murphy BD, Fox AJ, Lee DH, Sahlas DJ,
Black SE, Hogan MJ, Coutts SB, Demchuk AM, Goyal M, Aviv RI, et al:
Identification of penumbra and infarct in acute ischemic stroke
using computed tomography perfusion-derived blood flow and blood
volume measurements. Stroke. 37:1771–1777. 2006.PubMed/NCBI View Article : Google Scholar
|
|
9
|
Wintermark M and Warach SJ: STIR and
Virtual International Stroke Trials Archive (VISTA)-Imaging
Investigators. Acute stroke imaging research roadmap II and
international survey of acute stroke imaging capabilities: We need
your help! AJNR Am J Neuroradiol. 34(1671)2013.PubMed/NCBI View Article : Google Scholar
|
|
10
|
Campbell BC, Christensen S, Butcher KS,
Gordon I, Parsons MW, Desmond PM, Barber PA, Levi CR, Bladin CF, De
Silva DA, et al: Regional very low cerebral blood volume predicts
hemorrhagic transformation better than diffusion-weighted imaging
volume and thresholded apparent diffusion coefficient in acute
ischemic stroke. Stroke. 41:82–88. 2010.PubMed/NCBI View Article : Google Scholar
|
|
11
|
Yassi N, Parsons MW, Christensen S, Sharma
G, Bivard A, Donnan GA, Levi CR, Desmond PM, Davis SM and Campbell
BC: Prediction of poststroke hemorrhagic transformation using
computed tomography perfusion. Stroke. 44:3039–3043.
2013.PubMed/NCBI View Article : Google Scholar
|
|
12
|
Provenzale JM, Shah K, Patel U and McCrory
DC: Systematic review of CT and MR perfusion imaging for assessment
of acute cerebrovascular disease. AJNR Am J Neuroradiol.
29:1476–1482. 2008.PubMed/NCBI View Article : Google Scholar
|
|
13
|
Derex L, Nighoghossian N, Hermier M,
Adeleine P, Berthezène Y, Philippeau F, Honnorat J, Froment JC and
Trouillas P: Influence of pretreatment MRI parameters on clinical
outcome, recanalization and infarct size in 49 stroke patients
treated by intravenous tissue plasminogen activator. J Neurol Sci.
225:3–9. 2004.PubMed/NCBI View Article : Google Scholar
|
|
14
|
Parsons MW, Barber PA, Chalk J, Darby DG,
Rose S, Desmond PM, Gerraty RP, Tress BM, Wright PM, Donnan GA and
Davis SM: Diffusion- and perfusion-weighted MRI response to
thrombolysis in stroke. Ann Neurol. 51:28–37. 2002.PubMed/NCBI View Article : Google Scholar
|
|
15
|
Kunze E, Pham M, Raslan F, Stetter C, Lee
JY, Solymosi L, Ernestus RI, Vince GH and Westermaier T: Value of
perfusion CT, transcranial doppler sonography, and neurological
examination to detect delayed vasospasm after aneurysmal
subarachnoid hemorrhage. Radiol Res Pract.
2012(231206)2012.PubMed/NCBI View Article : Google Scholar
|
|
16
|
Westermaier T, Pham M, Stetter C, Willner
N, Solymosi L, Ernestus RI, Vince GH and Kunze E: Value of
transcranial doppler, perfusion-CT and neurological evaluation to
forecast secondary ischemia after aneurysmal SAH. Neurocrit Care.
20:406–412. 2014.PubMed/NCBI View Article : Google Scholar
|
|
17
|
Meier P and Zierler KL: On the theory of
the indicator-dilution method for measurement of blood flow and
volume. J Appl Physiol. 6:731–744. 1954.PubMed/NCBI View Article : Google Scholar
|
|
18
|
Konstas AA, Goldmakher GV, Lee TY and Lev
MH: Theoretic basis and technical implementations of CT perfusion
in acute ischemic stroke, part 1: Theoretic basis. AJNR Am J
Neuroradiol. 30:662–668. 2009.PubMed/NCBI View Article : Google Scholar
|
|
19
|
Lysakowski C, Walder B, Costanza MC and
Tramèr MR: Transcranial doppler versus angiography in patients with
vasospasm due to a ruptured cerebral aneurysm: A systematic review.
Stroke. 32:2292–2298. 2001.PubMed/NCBI View Article : Google Scholar
|
|
20
|
Chaudhary SR, Ko N, Dillon WP, Yu MB, Liu
S, Criqui GI, Higashida RT, Smith WS and Wintermark M: Prospective
evaluation of multidetector-row CT angiography for the diagnosis of
vasospasm following subarachnoid hemorrhage: A comparison with
digital subtraction angiography. Cerebrovasc Dis. 25:144–150.
2008.PubMed/NCBI View Article : Google Scholar
|
|
21
|
Yao GE, Li Q, Jiang XJ, Liu J, Li JL,
Zhang LL, Li LL, Zhang J and Xie P: Vasospasm after subarachnoid
hemorrhage: A 3D rotational angiography study. Acta Neurochir
Suppl. 110:221–225. 2011.PubMed/NCBI View Article : Google Scholar
|
|
22
|
Cremers CH, van der Schaaf IC, Wensink E,
Greving JP, Rinkel GJ, Velthuis BK and Vergouwen MD: CT perfusion
and delayed cerebral ischemia in aneurysmal subarachnoid
hemorrhage: A systematic review and meta-analysis. J Cereb Blood
Flow Metab. 34:200–207. 2014.PubMed/NCBI View Article : Google Scholar
|
|
23
|
Sanelli PC, Ugorec I, Johnson CE, Tan J,
Segal AZ, Fink M, Heier LA, Tsiouris AJ, Comunale JP, John M, et
al: Using quantitative CT perfusion for evaluation of delayed
cerebral ischemia following aneurysmal subarachnoid hemorrhage.
AJNR Am J Neuroradiol. 32:2047–2053. 2011.PubMed/NCBI View Article : Google Scholar
|
|
24
|
Fontanella M, Valfrè W, Benech F, Carlino
C, Garbossa D, Ferrio M, Perez R, Berardino M, Bradac G and Ducati
A: Vasospasm after SAH due to aneurysm rupture of the anterior
circle of Willis: Value of TCD monitoring. Neurol Res. 30:256–261.
2008.PubMed/NCBI View Article : Google Scholar
|
|
25
|
Bornstein NM and Norris JW: Transcranial
doppler sonography is at present of limited clinical value. Arch
Neurol. 51:1057–1059. 1994.PubMed/NCBI View Article : Google Scholar
|
|
26
|
Steinmeier R, Laumer R, Bondár I, Priem R
and Fahlbusch R: Cerebral hemodynamics in subarachnoid hemorrhage
evaluated by transcranial doppler sonography. Part 2. Pulsatility
indices: Normal reference values and characteristics in
subarachnoid hemorrhage. Neurosurgery. 33:10–18. 1993.PubMed/NCBI View Article : Google Scholar
|
|
27
|
Washington CW and Zipfel GJ: Participants
in the International Multi-disciplinary Consensus Conference on the
Critical Care Management of Subarachnoid Hemorrhage. Detection and
monitoring of vasospasm and delayed cerebral ischemia: A review and
assessment of the literature. Neurocrit Care. 15:312–317.
2011.PubMed/NCBI View Article : Google Scholar
|
|
28
|
Dankbaar JW, de Rooij NK, Velthuis BK,
Frijns CJ, Rinkel GJ and van der Schaaf IC: Diagnosing delayed
cerebral ischemia with different CT modalities in patients with
subarachnoid hemorrhage with clinical deterioration. Stroke.
40:3493–3498. 2009.PubMed/NCBI View Article : Google Scholar
|
|
29
|
Greenberg ED, Gold R, Reichman M, John M,
Ivanidze J, Edwards AM, Johnson CE, Comunale JP and Sanelli P:
Diagnostic accuracy of CT angiography and CT perfusion for cerebral
vasospasm: A meta-analysis. AJNR Am J Neuroradiol. 31:1853–1860.
2010.PubMed/NCBI View Article : Google Scholar
|
|
30
|
Wintermark M, Flanders AE, Velthuis B,
Meuli R, van Leeuwen M, Goldsher D, Pineda C, Serena J, van der
Schaaf I, Waaijer A, et al: Perfusion-CT assessment of infarct core
and penumbra: Receiver operating characteristic curve analysis in
130 patients suspected of acute hemispheric stroke. Stroke.
37:979–985. 2006.PubMed/NCBI View Article : Google Scholar
|
|
31
|
Baker L, Birnbaum H, Geppert J, Mishol D
and Moyneur E: The relationship between technology availability and
health care spending. Health Aff (Millwood) Suppl Web Exclusives:
W3-537-551, 2003.
|
|
32
|
Springborg JB, Frederiksen HJ, Eskesen V
and Olsen NV: Trends in monitoring patients with aneurysmal
subarachnoid haemorrhage. Br J Anaesth. 94:259–270. 2005.PubMed/NCBI View Article : Google Scholar
|