Introduction
Type 2 diabetes mellitus (T2DM) and Alzheimer’s
disease (AD) are common chronic diseases in the elderly. The
prevalence of T2DM and AD is increasing sharply due to
socio-demographic aging and lifestyle changes (1,2).
Epidemiologic evidence suggests an association between T2DM and AD.
Other studies (3,4) have shown that patients with T2DM are
at greater risk of developing AD than non-diabetic patients. Thus,
AD is occasionally referred to as type 3 diabetes mellitus
(5). Although the specific
mechanism by which T2DM increases the risk of AD is unclear, it has
been proposed that insulin resistance (IR) is significant in the
pathogenesis of AD. Studies have affirmed that IR is an independent
risk factor for AD (6,7). The mammalian target of rapamycin
(mTOR) is a key regulatory protein of the phosphoinositide 3-OH
kinase/protein kinase B insulin signal transduction pathway
(PI3K/PKB pathway). mTOR is able to adjust insulin sensitivity by
providing feedback and maintaining the β-cell function of the
islets of Langerhans. It is essential in the insulin signaling
process (8). Certain studies
(9–11) have indicated that mTOR is
significantly involved in the development and progression of IR and
T2DM. Other studies have shown that the hyperphosphorylation of
tau, which is neurotoxic, increases with the activation of mTOR
(12,13). However, the exact reason for this
increase remains unclear. Impairment of insulin signaling induces
IR in the brain, which promotes the onset of AD. Whether T2DM
results in the excessive activation of mTOR, and thus insulin
signaling damage, is unclear. No related studies have been reported
to date. In the current study, behavioral changes, mTOR activity
and tau protein phosphorylation in the hippocampal tissue were
observed following the establishment of T2DM, AD and T2DM+AD models
in rats. The models established in this study have suggested a role
for mTOR in the increased risk of developing AD in T2DM rats.
AD is called central diabetes mellitus by some
scholars (7). However, the reason
for this finding is not yet clear. mTOR is involved in the
development and progression of IR and T2DM. The characteristic
pathological changes leading to the occurrence and development of
AD are triggered by the excessive phosphorylation of tau protein.
Thus, the excessive phosphorylation of tau is the key factor which
causes the disease (13). The
phosphorylation of the tau protein is regulated by protein kinases
and protein phosphatases (including cyclin-dependent kinase 5 and
glycogen synthase kinase 3) (12).
Earlier studies (14,15) have demonstrated that mTOR may be
one of the kinases associated with excessive tau protein
phosphorylation.
mTOR may be the common kinase involved in insulin
signal transfer and protein phosphorylation. However, no studies
have explored whether the impairment of insulin signaling results
in excessive mTOR activity to induce excessive tau protein
phosphorylation and, consequently, AD. This study used a T2DM+AD
rat model to investigate the expression of mTOR in AD and its role
in the increased risk of developing AD in T2DM rats.
Materials and methods
Animals and grouping
Healthy male rats, which were clean grade and
weighing 200±20 g, were provided by the Jiangxi University of
Traditional Chinese Medicine. This study was carried out in strict
accordance with the recommendations of the Guide for the Care and
Use of Laboratory Animals of the National Institutes of Health. The
animal use protocol was reviewed and approved by the Institutional
Animal Care and Use Committee of the Jiangxi University of
Traditional Chinese Medicine. A Certificate of Conformity: SCXK
(Jiangxi) 2005-0001 was obtained for the experimental animals. Rats
that reacted sensitively or too slowly and had poor swimming
posture or congenital dementia were eliminated using the Morris
water maze. After one week of adaptive feeding, 50 qualified rats
were divided into two groups: the normal control (n=23) and T2DM
(n=27) groups. The rat model of T2DM was established via a single
intraperitoneal injection of streptozotocin (STZ; Sigma, St. Louis,
MO, USA) and the provision of a high-fat and high-carbohydrate
diet. When the T2DM rat model was successfully established, the
normal control group was divided into two groups: control (n=11)
and AD (n=12). The T2DM group was divided into the T2DM (n=12) and
T2DM+AD (n=15) groups. The AD rat model was established by
injecting Aβ1–40 into the bilateral hippocampus at stereotaxic
coordinates. All rats ate and drank freely during the experimental
period.
T2DM rat model
After one week of adaptive feeding, the T2DM group
was provided with a high-fat and high-carbohydrate diet for eight
weeks, and then injected with a single intraperitoneal STZ dose of
30 mg/kg. In comparison, the control group received a single
intraperitoneal injection of citric acid buffer at the same volume.
After one week, blood glucose levels were measured via the tail
vein. A fasting plasma glucose level ≥16.7 mmol/l was considered to
indicate the successful establishment of a type 2 diabetes
model.
AD rat model
The rats were anesthetized via an intraperitoneal
injection of chloral hydrate (10% 3 ml/kg). Their heads were fixed
with a stereotaxic locator. Skin preparation and sterilization were
performed. A 2-cm incision along the midline of the skull top was
made, and the skull was subsequently exposed by separating the
periosteum. The anterior fontanelle, which was the basis point, was
identified in the parietal lobe. A needle point was located 3.0 mm
behind the anterior fontanelle and 2.0 mm next to the midline based
on the stereotactic atlas of the rat brain. The skull was opened
using a miniature dental drill. A needle was vertically inserted
2.9 mm into the hippocampal tissue. Condensed matter (1 μl) of
Aβ1–40, which was placed into a 5 μl micro injector, was injected
into the two sides of the hippocampal tissue. The needle was slowly
withdrawn after remaining in the brain for 10 min. The skin
covering the area was subsequently sutured. The AD model was
thereby established. Using the same method, an equal volume of
sterile saline was injected into the two sides of the hippocampal
tissue of the control and T2DM rats. The Morris water maze test was
performed one week after injection. The standard was the upper
limit of 95% of the control rats. The rats that exceeded this limit
were the demented rats. Thus, the AD rat model was successfully
established.
T2DM+AD rat model
Four weeks after the successful establishment of the
T2DM rat model, a composite model of AD was generated following the
method previously described.
Morris water maze experiment
The Morris water maze test was conducted for seven
days, beginning one week after injection of the hippocampus. The
directional navigation test was performed in the first six days of
the experiment. The performance of each rat from swimming in the
water to climbing the platform within 60 sec was recorded for the
latency period. If the rat found the platform within 60 sec, then
it was allowed to stand on the platform for 10 sec; if not, it was
aided in arriving at the platform with a test-stick, after which,
it was also allowed to stand on the platform for 10 sec. The time
taken to reach the platform was recorded as its latency period.
Each rat was trained four times every day, twice in the morning and
twice in the afternoon. The seventh day of the test was allotted
for the space exploration test. The platform was removed and the
rat was placed into the second quadrant of the water maze. The
number of times the rat crossed to the original location of the
platform within 120 sec was then recorded.
Biochemical indicator testing
Blood serum samples were drawn from the inferior
vena cava. The samples were sent to the Inspection Center at the
First Affiliated Hospital of Nanchang University to determine the
fasting blood glucose (FBG), total cholesterol (TC) and
triglyceride (TG) levels.
Immunohistochemistry
The rats were sacrificed by decapitation. The
bilateral hippocampal organization was stripped and fixed with 4%
neutral formaldehyde. The immunohistochemical method (sp) was used
to detect mTOR and phosphorylated tau protein (Ser202). Three
tissue slices of the hippocampal organization of each rat were
observed under a microscope at ×400. Four non-overlapping fields
were then randomly selected. The number of positive cells in each
view was counted and, using the Image-Pro Plus v 5.5 image analysis
system, the percentage of positive-reaction cells from the total
number of cells in each field of vision was calculated and
averaged.
RT-PCR
After removal, the bilateral hippocampal
organizations were immediately preserved in liquid nitrogen, and
then placed in an ice box at −80°C. RT-PCR was used to detect the
mTOR mRNA content and total tau protein mRNA expression. The mTOR
primers were: upstream, 5′-ATG ACG AGA CCC AGG CTA AG-3′; and
downstream, 5′-GCC AGT CCT CTA CAA TAC GC-3′. The amplification
segment was ~387 bp. The tau protein primers were: upstream 5′-CGG
CGT AAG CAA AGA CA-3′; and downstream, 5′-TGT AGC CGC TTC GTT
CT-3′. The amplification segment was ~215 bp. The GAPDH primers
were: upstream, 5′-CCT CTG GAA AGC TGT GGC GT-3′; and downstream,
5′-TTG GAG GCC ATG TAG GCC AT-3′. The amplification segment was
~430 bp. An integrated gel imaging and analysis system was used for
the spectrophotometric scanning and analysis of the bands. The gene
and reference gene absorbance values indicate the relative
strengths of the genetic expression.
Statistical methods
SPSS 13.0 statistical software was used to analyze
the results. Data are expressed as mean ± standard deviation.
Single factor analysis of variance was used to compare the
differences among and between the groups. When the differences were
significant, SNK-q inspection was used to compare the two groups.
P<0.05 was considered to indicate a statistically significant
result.
Results
Survival rate
At the end of the experiment, 39 rats survived. The
numbers of surviving rats in the normal control, T2DM, AD and
T2DM+AD groups were 11, 10, 9 and 9, respectively. The successful
modeling rates were 100, 83, 75 and 60%, respectively.
Biochemical indicators
Compared with the control and AD groups, the FBG, TC
and TG levels of the T2DM and T2DM+AD groups were elevated
(P<0.01). No significant difference was observed between the
control and AD groups. However, the FBG, TC and TG levels in the
T2DM+AD group were higher than those in the T2DM group (P<0.05;
Table I).
 | Table IBiochemical indicators (mean ± s). |
Table I
Biochemical indicators (mean ± s).
| Group | Cases | FBG (mmol/l) | TG (mmol/l) | TC (mmol/l) |
|---|
| Control | 11 | 4.85±0.49 | 0.75±0.06 | 1.06±0.13 |
| T2DM | 10 | 22.57±2.90a | 1.47±0.10a | 2.47±0.06a |
| AD | 9 | 5.06±0.66b | 0.71±0.08b | 1.01±0.08b |
| T2DM+AD | 9 | 24.53±2.21acd | 1.57±0.12acd | 2.57±0.13acd |
Behavioral changes
In the Morris water maze place navigation test, the
average escape latency of the rats in each group was gradually
shortened. The latency of the control group was the most evidently
reduced. Compared with the control group, the latencies of the
T2DM, AD and T2DM+AD groups were not significantly shortened. The
latency trends among these groups were similar. In the space
exploration experiments, the control rats swam in the quadrant
containing the platform. However, all rats in the experimental
groups swam in all platform quadrants. Compared with those in the
control and T2DM groups, the number of times the AD and T2DM+AD
rats crossed to the initial platform position decreased
significantly (P<0.01). Significant differences were observed
between the control and T2DM groups (P<0.01) as well as between
the AD and T2DM+AD groups (P<0.05; Table II).
| Table IITimes of crossing to the former
platform location in 120 sec (mean ± s). |
Table II
Times of crossing to the former
platform location in 120 sec (mean ± s).
| Group | Cases | No. of crossings |
|---|
| Control | 11 | 11.91±1.81 |
| T2DM | 10 | 7.10±0.99a |
| AD | 9 | 3.00±0.71ab |
| T2DM+AD | 9 | 1.78±0.83a–c |
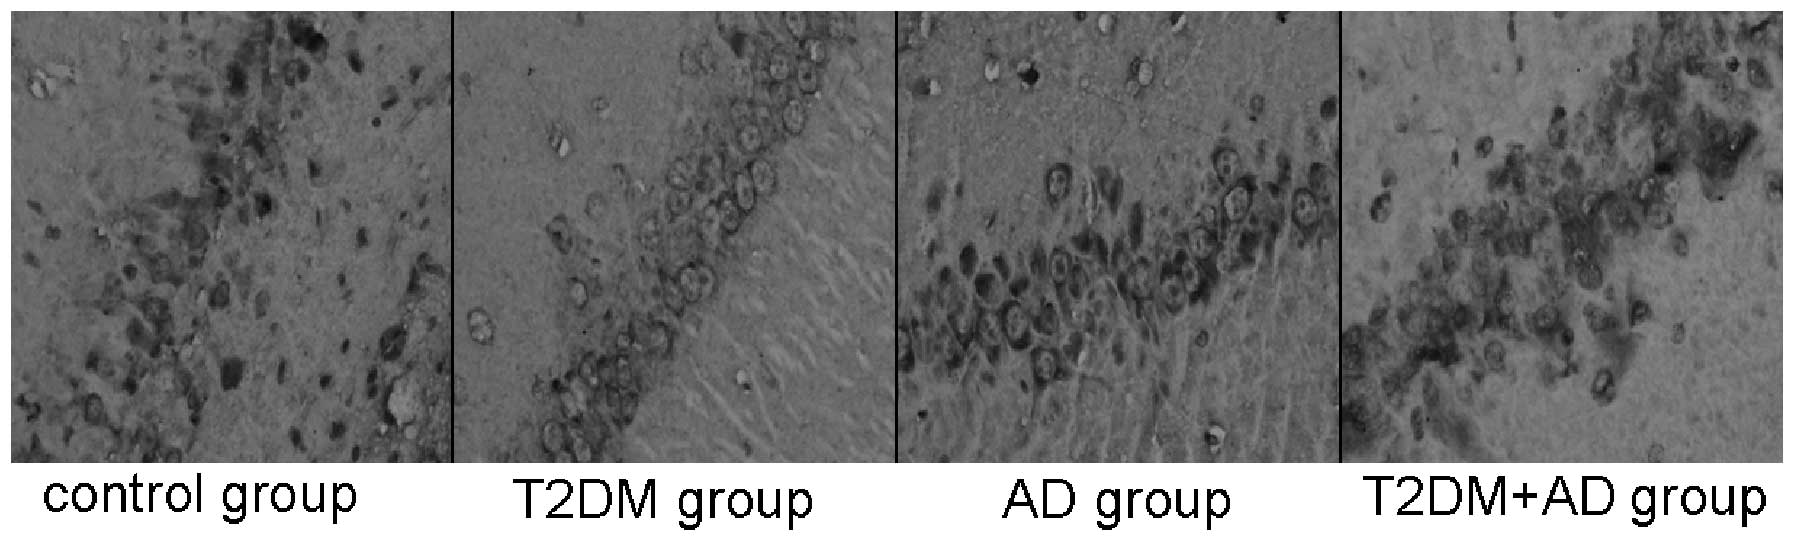
Immunohistochemistry results
mTOR-positive cells, which exhibit a brown
cytoplasmic color, were observed near the injection site on the
hippocampal nerve cells of each rat. Compared with the control and
AD groups, the mTOR levels in the hippocampal tissues of the T2DM
and T2DM+AD groups were significantly increased (P<0.05).
However, no significant difference was observed between the control
and AD groups. A significant difference was observed between the
T2DM+AD and T2DM groups (P<0.01; Table III and Fig. 1).
| Table IIIImmunohistochemistry results for mTOR
(mean ± s). |
Table III
Immunohistochemistry results for mTOR
(mean ± s).
| Group | Cases | mTOR |
|---|
| Control | 11 | 0.27±0.04 |
| T2DM | 10 | 0.49±0.12a |
| AD | 9 | 0.21±0.05b |
| T2DM+AD | 9 | 0.62±0.07acd |
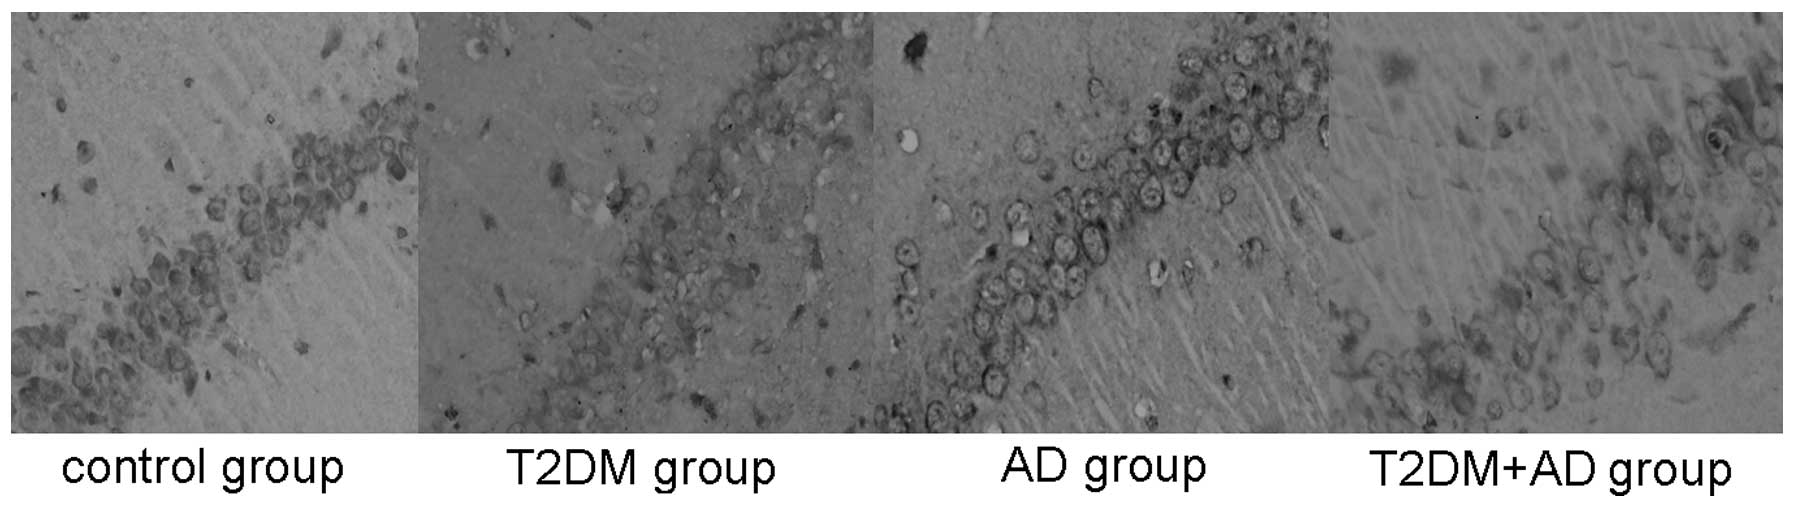
The tau (Ser202) hyperphosphorylation-positive cells
also underwent brown cytoplasmic staining. These cells were also
observed near the injection site on the hippocampal nerve cells of
each rat. Compared with the control and T2DM groups, the tau
hyperphosphorylation levels in the hippocampal tissues of the AD
and T2DM+AD groups were significantly increased (P<0.01). No
significant difference was observed between the control and T2DM
groups or between the T2DM+AD and AD groups (P<0.01; Table IV and Fig. 2).
| Table IVImmunohistochemistry results for the
hyperphosphorylation of tau (Ser202) (mean ± s). |
Table IV
Immunohistochemistry results for the
hyperphosphorylation of tau (Ser202) (mean ± s).
| Group | Cases | Tau |
|---|
| Control | 11 | 0.14±0.05 |
| T2DM | 10 | 0.22±0.14 |
| AD | 9 | 0.57±0.06ab |
| T2DM+AD | 9 | 0.73±0.08a–c |
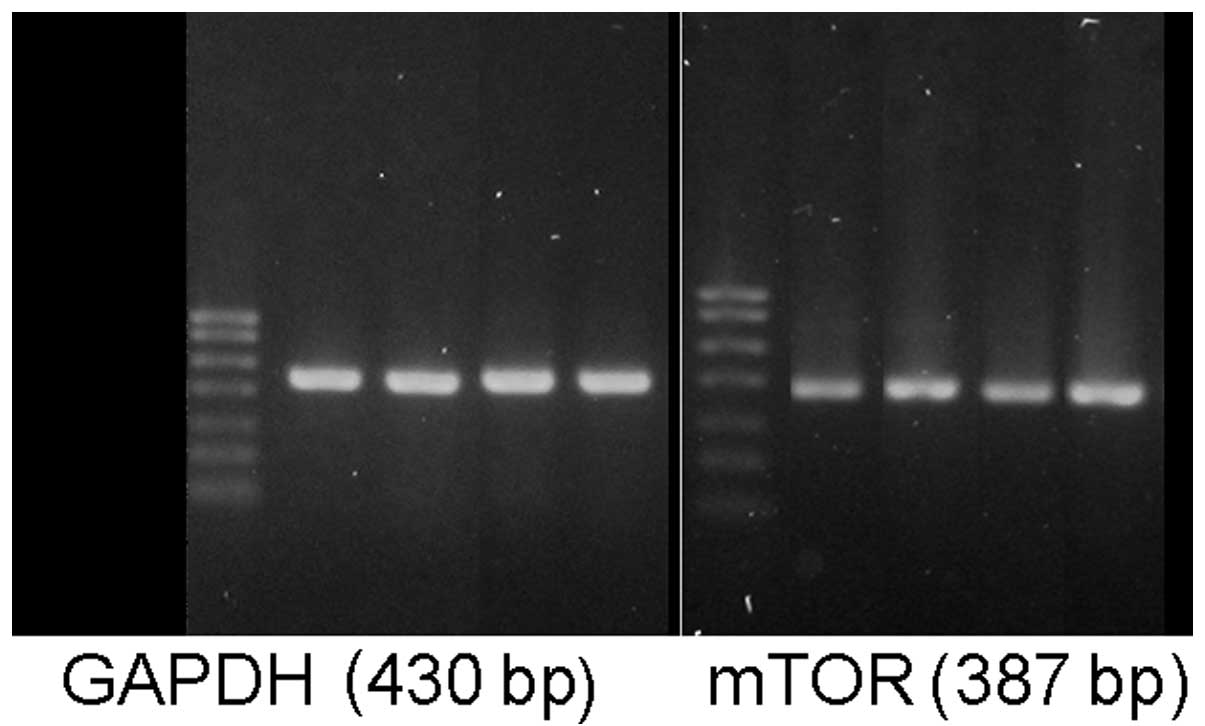
mTOR and tau protein gene expression
The mTOR mRNA levels in the hippocampal tissues of
the T2DM and T2DM+AD groups were significantly increased compared
with those in the control and AD groups (P<0.05). No significant
difference was observed between the control and AD groups. However,
a significant difference was observed between the T2DM+AD and T2DM
groups (P<0.01; Table V and
Fig. 3).
| Table VGene expression of mTOR (mean ±
s). |
Table V
Gene expression of mTOR (mean ±
s).
| Group | Cases | mTOR |
|---|
| Control | 11 | 0.62±0.07 |
| T2DM | 10 | 0.71±0.12a |
| AD | 9 | 0.61±0.01b |
| T2DM+AD | 9 | 0.88±0.05acd |
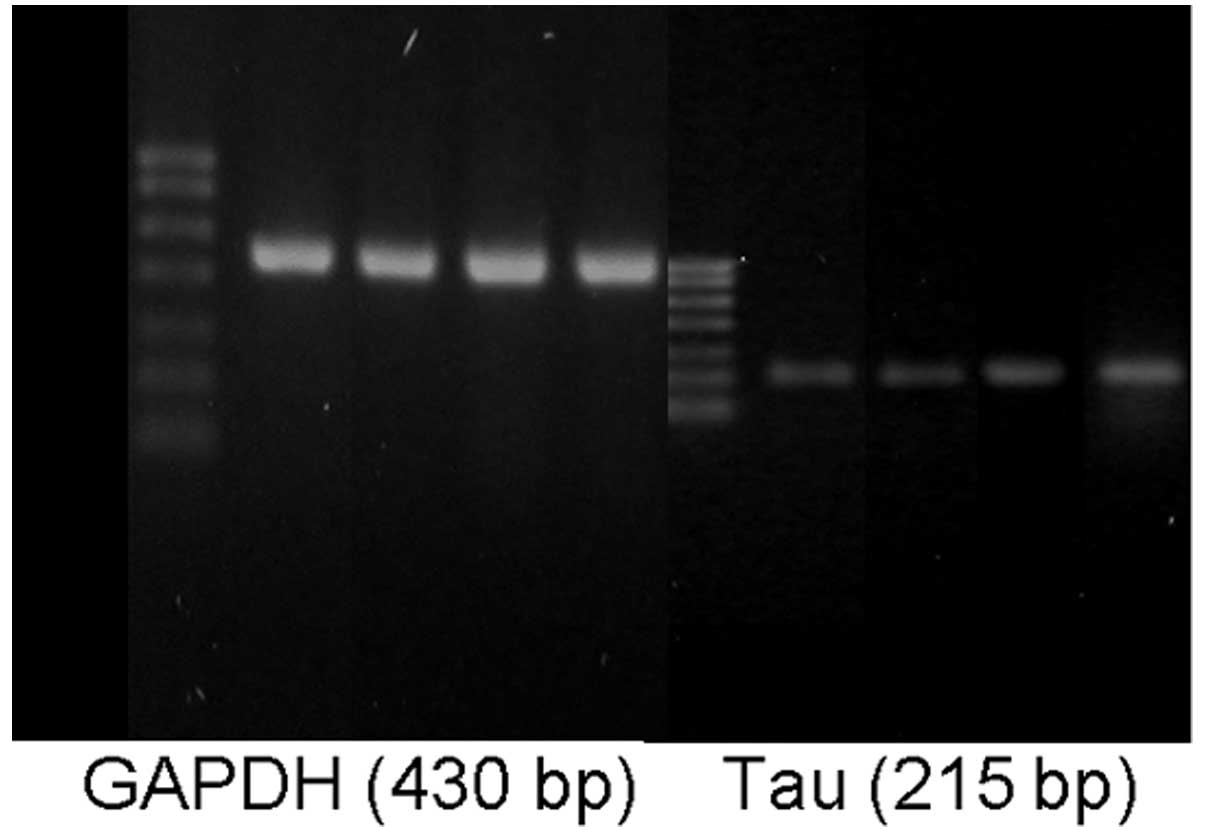
The total tau protein mRNA levels in the hippocampal
tissues of the AD and T2DM+AD groups were significantly increased
compared with those in the control and T2DM groups (P<0.01). No
significant difference was observed between the control and T2DM
groups. However, a significant difference was observed between the
T2DM+AD and AD groups (P<0.01; Table VI and Fig. 4).
| Table VIGene expression of total tau protein
(mean ± s). |
Table VI
Gene expression of total tau protein
(mean ± s).
| Group | Cases | Tau |
|---|
| Control | 11 | 0.18±0.02 |
| T2DM | 10 | 0.22±0.06 |
| AD | 9 | 0.36±0.09ab |
| T2DM+AD | 9 | 0.54±0.05a–c |
Discussion
The Morris water maze test revealed that the T2DM
rats crossed to the platform significantly fewer times than the
control rats. Thus, T2DM may degenerate rat memory and cognition
abilities. Furthermore, compared with the AD rats, the number of
times the T2DM+AD rats crossed to the platform decreased
significantly. This indicates that T2DM aggravates memory and
cognition disabilities in AD, and may increase the incidence of AD
through several mechanisms. These results are consistent with the
findings of Zhang et al(16).
In this study, we detected the mTOR activity in
hippocampal tissue at the protein and mRNA levels by
immunohistochemical analysis and RT-PCR. The mTOR activities in the
hippocampal tissue of the T2DM rats increased significantly
compared with those of the control group. Thus, T2DM may increase
mTOR activity in the brain, possibly by disabling the PI3K/PKB/mTOR
pathway and then increasing IR in the brain. The mTOR levels in the
hippocampal tissues of the T2DM+AD rats increased significantly
compared with those in the T2DM rats, which demonstrates that T2DM
triggers excessive mTOR activation in brain tissue, which may
aggravate IR in the brain and induce AD.
Furthermore, in this study, we determined the
quantity of excessively phosphorylated tau protein by
immunohistochemical analysis and the total quantity of tau protein
in the hippocampal tissue by RT-PCR. The levels of excessively
phosphorylated tau protein and total tau protein significantly
increased in the hippocampal tissues of the T2DM+AD rats compared
with those in the control, AD and T2DM groups. Thus, T2DM may
aggravate the degree of excessive tau protein phosphorylation by
activating mTOR activity in the hippocampal tissue and then
critically elevate AD. When compared with the control group, tau
protein hyperphosphorylation in the hippocampal tissues of the T2DM
group rats was not evident. The reason may be that the time of T2DM
development is too short or the mTOR activity is not high enough to
trigger excessive tau protein phosphorylation. The exact reasons
need to be established through further study.
Therefore, the results of the current study indicate
that the mechanism by which T2DM increases the risk of AD involves
mTOR, a key regulatory protein in the insulin signaling pathway.
T2DM causes excessive activation of mTOR in the hippocampal tissue,
which may occur through insulin signaling pathway impairment.
Although the excessive activation of mTOR triggers tau
hyperphosphorylation, thereby promoting the occurrence of AD, the
relationship between the insulin signaling impairment and the
excessive activation of mTOR remains unclear. Further studies on
the upstream and downstream factors of mTOR (including PI3K, PKB
and S6 kinase 1) may substantially reduce the risk of the
co-occurrence of AD and T2DM. Resolving these questions may
facilitate the development of new methods for the treatment of
AD.
Acknowledgements
This study was supported by the National Natural
Science Foundation of China (No. 81041046).
References
|
1
|
Janson J, Laedtke T, Parisi JE, O’Brien P,
Petersen RC and Butler PC: Increased risk of type 2 diabetes in
Alzheimer disease. Diabetes. 53:474–481. 2004. View Article : Google Scholar : PubMed/NCBI
|
|
2
|
Moroz N, Tong M, Longato L, Xu H and de la
Monte SM: Limited Alzheimer-type neurodegeneration in experimental
obesity and type 2 diabetes mellitus. J Alzheimers Dis. 15:29–44.
2008.PubMed/NCBI
|
|
3
|
Bao CR, Zhou M and Qin DL: Present
situation of studies about the relationship between type 2 diabetes
and Alzheimer’s disease. J Luzhou Medical College. 32:568–569.
2009.(In Chinese).
|
|
4
|
Zhu XY, Niu BF, Dong ZX and Huang HY:
Studies of the relationship between type 2 diabetes and Alzheimer’s
disease. Medical Review. 17:1528–1531. 2011.
|
|
5
|
Chen YJ and Tian JZ: Alzheimer’s disease
is another form of diabetes. Chin J Gerontology. 28:402–406.
2008.(In Chinese).
|
|
6
|
de la Monte SM and Wands JR: Review of
insulin and insulin-like growth factor expression, signaling, and
malfunction in the central nervous system: relevance to Alzheimer’s
disease. J Alzheimer Disease. 7:45–61. 2005.PubMed/NCBI
|
|
7
|
Li Y: The awareness of the relationship
between Central insulin resistance and Alzheimer’s disease. J Diagn
Pract. 8:248–251. 2009.
|
|
8
|
Leibowitz G, Cerasi E and Ketzinel-Gilad
M: The role of mTOR in the adaptation and failure of beta-cells in
type 2 diabetes. Diabetes. 10(Suppl 4): 157–169. 2008.PubMed/NCBI
|
|
9
|
Glynn EL, Lujan HL, Kramer VJ, Drummond
MJ, DiCarlo SE and Rasmussen BB: A chronic increase in physical
activity inhibits fed-state mTOR/S6K1 signaling and reduces IRS-1
serine phosphorylation in rat skeletal muscle. Appl Physiol Nutr
Metab. 33:93–101. 2008. View
Article : Google Scholar : PubMed/NCBI
|
|
10
|
Vila-Bedmar R, Lorenzo M and
Fernández-Veledo S: Adenosine 5′-monophosphate-activated protein
kinase-mammalian target of rapamycin cross talk regulates brown
adipocyte differ- entiation. Endocrinology. 151:980–992. 2010.
|
|
11
|
Zhang C, Yoon MS and Chen J: Amino
acid-sensing mTOR signaling is involved in modulation of lipolysis
by chronic insulin treatment in adipocytes. Am J Physiol Endocrinol
Metab. 296:E862–E868. 2009. View Article : Google Scholar : PubMed/NCBI
|
|
12
|
Fan H: The research progress of
risk-related between diabetes and Alzheimer’s disease. J Practical
Geriatrics. 24:342–345. 2010.
|
|
13
|
Mi K and Johnson GV: The role of Tau
phosphorylation in the pathogenesis of Alzheimer’s disease. Curr
Alzheimer Res. 3:449–463. 2006.
|
|
14
|
An WL, Cowburn RF, Li L, et al:
Up-regulation of phosphorylated/activated p70 S6 kinase and its
relationship to neurofibrillary pathology in Alzheimer’s disease.
Am J Pathol. 163:591–607. 2003.PubMed/NCBI
|
|
15
|
Khurana V, Lu Y, Steinhilb ML, Oldham S,
Shulman JM and Feany MB: TOR-mediated cell-cyele activation causes
neurodegeneration in a Drosophila tauopathy model. Curr Biol.
16:230–241. 2006. View Article : Google Scholar : PubMed/NCBI
|
|
16
|
Zhang Y, Zhang Sl, Gao FH, Chen Y and Yang
XJ: The research of GSK-3β and tau phosphorylated proteins in
hippocampal tissue of type 2 diabetes and Alzheimer’s disease rats.
Chin J Gerontol. 29:63–66. 2010.(In Chinese).
|