Introduction
Hashimoto's thyroiditis (HT) is as an autoimmune
disorder and is often a common cause of hypothyroidism. It accounts
for ~7.3–20.5% of all thyroid diseases, and its frequency of
occurrence is ~7-fold higher in women, compared with men, often
during middle age (1,2). Patients with HT, particularly
clinical hypothyroidism, are particularly susceptible to other
associated medical conditions, including insulin resistance and
metabolic syndromes (1–5).
Insulin resistance and metabolic disorders are
common complications of HT. Accumulating evidence from previous
investigations has demonstrated associations between hypothyroidism
and disordered glucose and insulin metabolism. Increased insulin
resistance has been observed in patients diagnosed with clinical
and subclinical hypothyroidism (4,6–9). To
date, reports on the underlying mechanisms of insulin resistance in
HT remain inconclusive. Dimitriadis et al reported that
decreased glucose uptake in muscle and adipose tissues may be due
to reduced blood flow, resulting in impaired mitochondrial
oxidation in patients with hypothyroidism (4). However, few studies have been
performed, which link dysfunctions in the immune response with HT
and insulin resistance.
Immune dysregulation leading to chronic inflammation
and autoimmunity has been implicated in insulin resistance and the
pathogenesis of diabetes mellitus (DM) (10). Immunotherapeutic agents have been
introduced to treat type 1 and type 2 DM. For example, anti-CD3
antibody therapy, which targets the clearance of effector T cells
and promotes T cell tolerance, has been validated studies in
several clinical trials to be an effective therapeutic agent in
autoimmune diseases (11–13). Rituximab, a monoclonal antibody
targeting CD20-expressing B cells, has been used to treat type 1 DM
through its protective effect on insulin-secreting βcells (14). Additionally, in a study using type
2 DM mouse models, B cell depletion by anti-CD20 antibodies
prevented disease onset and inhibited insulin resistance by
eliminating autoantibody production (15). As dysregulated immune responses and
autoimmunity are important contributors to HT and insulin
resistance, the present study aimed to examine the immune
components shared between the two conditions.
To modulate immune responses and prevent the
hyperactivation of immune components and incidence of autoimmune
disorders, including DM, a subset of T cells has evolved to
function as regulatory cells. These regulatory T cells (Tregs)
control the scope of inflammation and suppresses autoimmunity,
traditionally through the secretion of suppressor cytokines,
including interleukin (IL)-10. Furthermore, a
CD8+CD28− suppressor T cell subset, which
functions to inhibit the cytotoxic activity of CD8+
cytotoxic T lymphocytes, has been defined (16). It is well established that the
activation of cytotoxic T lymphocytes is among the earliest events
leading to the destruction of thyrocytes, and the development of HT
and other autoimmune conditions. Whether the newly identified
CD8+CD28− suppressor T cells are involved in
the pathophysiologic process remains to be fully elucidated.
Similarly, the concept of regulatory B cells (Bregs) has been
suggested with intrinsic immunoregulatory properties similar to
Tregs (17,18). Bregs are reported to comprise two
major populations:
CD19+CD24hiCD38hi and
CD19+CD24+CD27+, which are capable
of producing IL-10 upon stimulation (19). IL-10 is an essential
anti-inflammatory cytokine, and IL-10-producing Bregs are sometimes
referred to as B10 cells (20).
The contribution of Bregs in autoimmune thyroiditis was reported in
a previous study using mouse models (21). However, evidence of the
contribution of Bregs in a human study of HT is not currently
available. Therefore, in the present study, the Breg and
CD8+CD28− suppressor T cell populations were
examined in patients with HT, and the association between HT and
insulin resistance was analyzed in those patients. In order to
eliminate the effect of thyroid hormones on insulin signaling and
glucose regulation, which may confound the results (22), only patients with type I HT who had
normal thyroid functions and were not on hormone treatment were
included in the study.
Materials and methods
Ethics statement
All questionnaires and medical procedures were
approved by the Institutional Review Board of Fudan University
(Shanghai, China). Written informed consent was prospectively
obtained from all study participants.
Patients
A total of 59 patients (age range, 18–60 years),
diagnosed with type I HT at the Fifth People's Hospital of
Shanghai, Fudan University between March and November 2013, were
enrolled in the present study and assigned to the HT experimental
group. An additional 38 healthy age- and gender-matched volunteers
were recruited to the control group. The diagnosis criteria for
type I HT were as follows: Normal thyroid function and
characteristic clinical manifestations associated with elevated
serum anti-thyroid peroxidase antibodies (anti-TPO) or
anti-thyroglobulin antibodies (anti-Tg) at ≥60 U/ml (23). The clinical manifestations were
detected twice for each patient, with a 1-week interval. The
exclusion criteria were as follows: Patients with a previous and/or
new diagnosis of DM, determined by oral glucose tolerance test
(OGTT), patients with a confirmed diagnosis of hyperthyroidism, and
those who received anti-thyroid drugs or thyroid hormone
replacement therapy. In addition, patients with cardiovascular and
cerebrovascular diseases, severe liver or kidney dysfunction,
malignant tumors, severe mental disorders, were currently taking
glucocorticoids, or were pregnant or breastfeeding were excluded.
The diagnoses of DM, impaired glucose regulation and hypertension
were made according to the guidelines approved by the World Health
Organization (24).
Sample collection
Questionnaires containing demographic information,
medical history of hypertension, weight, height, body mass index
(BMI), and waist and hip circumferences were administered to all
study participants. An OGTT was performed using fasting blood
samples and blood samples collected 30 and 120 min following
drinking 75 g glucose dissolved in 250–300 ml water. The levels of
plasma glucose, serum lipid, C-peptide and insulin were measured,
and thyroid function was assessed. The insulin level in the blood
at the time points of 0, 30, and 120 min were designated as Ins0,
Ins30 and Ins120, respectively. In addition, the plasma glucose
levels at those time points were designated as Glu0, Glu30 and
Glu120, with the average glucose and insulin levels in the OGTT
designated as GluAve and InsAve, respectively. The area under the
curve (AUC) for insulin and glucose (InsAuc and GluAuc,
respectively) were determined by the insulin secretion curve
adjusted for glucose.
Biochemical analyses
The plasma glucose levels were measured using a
glucose oxidation assay kit (Shanghai Institute of Biological
Products Co., Ltd. Shanghai, China), using a Beckman Glucose Lab
Analyzer 2 (Model 6517; Beckman Coulter, Inc., Danvers, MA, USA).
The serum lipid contents, including total cholesterol (TC),
triglyceride (TG), high-density lipoprotein cholesterol (HDL-C) and
low-density lipoprotein cholesterol (LDL-C), were measured using an
enzymatic colorimetric analyzer (Hitachi 7600 Clinical Analyzer;
Hitachi, Ltd., Tokyo, Japan). The serum levels of C-peptide and
insulin, and the thyroid function indicators total triiodothyronine
(TT3), total thyroxine (TT4), free
triiodothyronine (FT3), free thyroxine (FT4),
thyroid stimulating hormone (TSH), anti-Tg and anti-TPO were
measured using specific radioimmunoassay kits purchased from Linco
Research, Inc. (St. Charles, MO, USA) in a Beckman immunoassay
analyzer (Beckman Coulter, Inc.).
To assess β-cell function and insulin sensitivity,
the following parameters were measured: i) homeostasis model
assessment of β-cell function (HOMA-β) [20 × Ins0 (µU/ml)]/[Glu0
(mmol/l)-3.5]; ii) change in insulin and glucose ratio at 30 min
OGTT (ΔI30/ΔG30) [Ins30-Ins0 (µU/ml)]/[Glu30-Glu0 (mmol/l)]; iii)
early-phase insulin secretion (InsAuc30/GluAuc30) [Ins0+Ins30
(pmol/L)]/[Glu0+Glu30 (mmol/l)]; iv) ratio of insulin to glucose
AUC values at 120 min (InsAuc120/GluAuc120) [Ins0+4 × Ins30+3 ×
Ins120 (pmol/l)]/[Glu0+4′Glu30+3 × Glu120 (mmol/l)]; v) HOMA of
insulin resistance (HOMA-IR) calculated as [Ins0 (µU/ml)x Glu0
(mmol/l)/22.5]; vi) disposition index (DI) calculated as
[HOMA-β/HOMA-IR]; vi) Matsuda index (ISIM) of insulin
sensitivity [10,000/((Glu0 (mg/dL) × Ins0 (µU/ml) × GluAve (mg/dl)
× InsAve (µU/ml))1/2]; vii) DI at 30 min OGTT (DI30)
[InsAuc30/GluAuc30 × ISIM]; and viii) DI at 120 min OGTT
(DI120) [InsAuc120/GluAuc120 × ISIM].
Flow cytometry
Venous blood was obtained from the study
participants by EDTA-anticoagulation. For examination of different
lymphocyte populations, two 100-µL blood aliquots were incubated
with CD4-FITC/CD8-PE-Cy5/CD28-PE and
CD19-PE-Cy5/CD24-PE/CD27-APC/CD38-FITC (BD Biosciences, San Jose,
CA, USA) for 20 min at room temperature in the absence of light.
The stained samples were treated with Simultest™ (Beckman Coulter,
Inc.) to lyse erythrocytes. The samples were washed with PBS twice
prior to flow cytometric analysis. The following isotype controls
were used: IgG1-FITC, IgG1-PE-Cy5, IgG2a-PE and IgG1-APC. For
examination of intracellular IL-10, 100 µl whole blood was cultured
in RPMI 1640 supplemented with 10% heat inactivated fetal bovine
serum (Gibco; Thermo Fisher Scientific, Inc., Waltham, MA, USA), 25
µg/l phorbol 12-myristate 13-acetate, 1 mg/l ionomycin and 20 µg/l
monensin (Sigma-Aldrich; Merck Millipore, Darmstadt, Germany) at a
density of 2×10⁶ cells/ml. Following incubating for 4–6
h at 37°C and in 5% CO2, CD19-Cy5 (BD Biosciences) was
added to the cells for 30 min at room temperature. Subsequently,
the cells were permeabilized according to the manufacturer's
protocol (Beckman Coulter, Inc.), followed by incubation with the
monoclonal antibodies IL-10-PE (20 µl, cat. no. JES3-9D7; BD
Biosciences) or isotype control IgG2a-PE (BD Biosciences) for 30
min at room temperature. The stained cells were then analyzed on a
FACSCalibur flow cytometer (BD Biosciences). Lymphocytes were
collected to measure the percentages of CD8+,
CD8+CD28−,
CD19+CD24+CD27+,
CD19+CD24hiCD38hi and
CD19+IL-10+ (B10) cell subpopulations.
Statistical analysis
Data are expressed as the mean ± standard deviation
or percentage. Comparison of continuous data between groups was
performed using either a parametric test, such as Student's t-test
and one-way analysis of variance), or a nonparametric test
(Mann-Whitney U or Kruskal-Wallis H tests). The comparison of
categorical data between groups was performed using a χ2
test. Pearson's correlation analysis was used to investigate the
association between different parameters. P<0.05 (two-tailed)
was considered to indicate a statistically significant difference.
SPSS version 17.0 (SPSS Inc., Chicago, IL, USA) was used to analyze
data.
Results and Discussion
Comparison of biochemical parameters
between HT and control groups
Laboratory measurements were recorded in patients
with type I HT (HT group; n=59) and healthy volunteers (normal
group; n=38). The results are summarized in Table I. No significant differences were
found in the mean age (47.2±14.7, vs. 40.6±16.9 years) or
female-to-male ratio between the HT and control groups. Average hip
circumference was similar between the two groups, however, a
marginal but significant increase in waist circumference was
observed in the HT group (P<0.05). Abdominal circumference has
previously been associated with diabetes and cardiovascular
disease, suggesting that those in the HT group may be predisposed
to such risk factors. Biochemical parameters in the blood,
including those for pancreatic and thyroid functions, were also
measured. No significant differences were observed in blood
pressure, BMI, lipid profiles (TC, TG, HLD-C and LDL-C), thyroid
indicators (TT3, TT4, FT3,
FT4 and TSH) or diabetes-associated autoantibodies
(GADA, IAA and ICA) between the two groups. The incidence of
impaired glucose regulation was also similar between the two groups
(Table I). Consistent with the
diagnosis, the levels of anti-Tg and anti-TPO, two specific
indicators for HT, were significantly higher in the HT group,
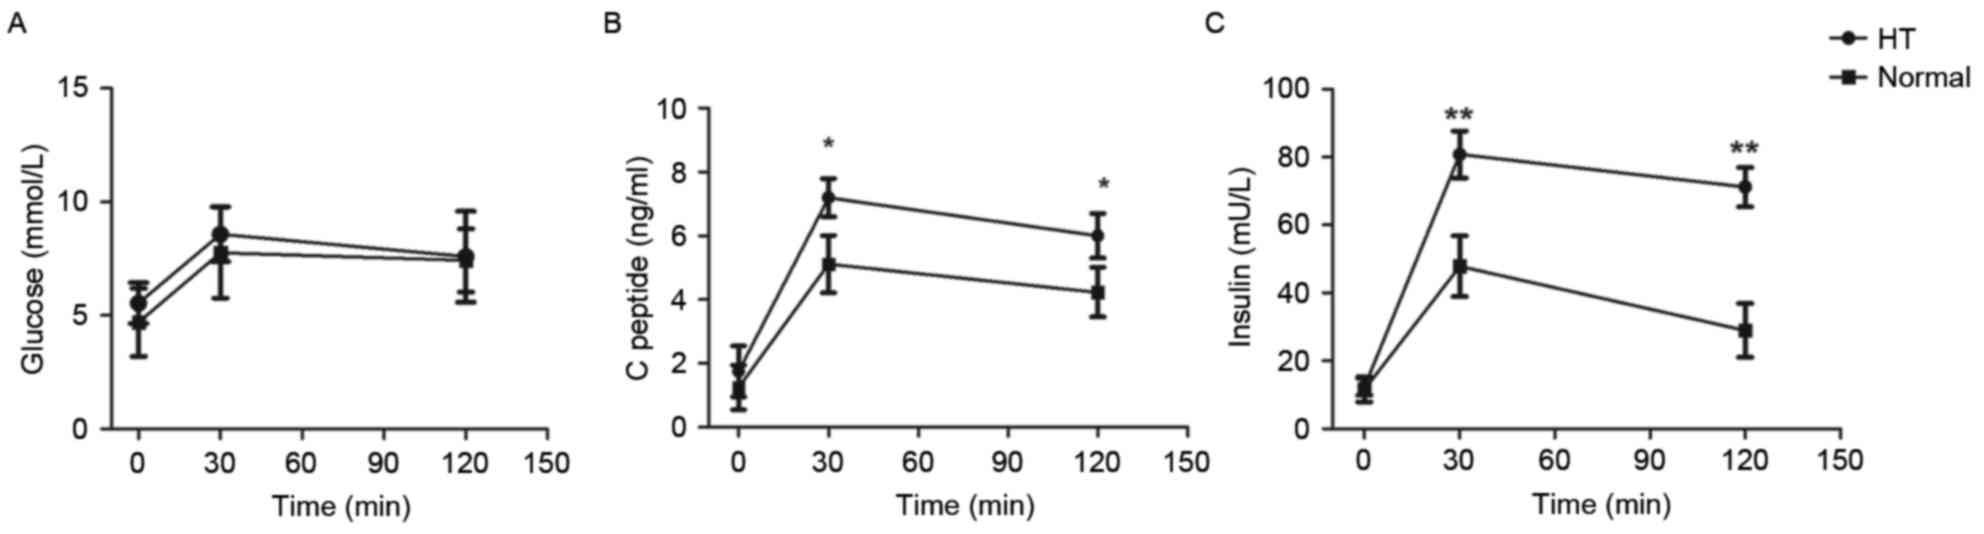
compared with those in the control group (P<0.05). The level of
C-peptide at 30 min was significantly different between the groups
(Fig. 1B). In addition, OGTT was
performed to determine insulin resistance, and the results showed
markedly elevated insulin levels at 30 and 120 min following
glucose intake in the HT group (Fig.
1C).
 | Table I.Comparison of demographic
characteristics and laboratory measurements between HT and control
groups. |
Table I.
Comparison of demographic
characteristics and laboratory measurements between HT and control
groups.
| Characteristic | HT (n=59) | Control (n=38) | P-value |
|---|
| Age (years) | 47.2±14.7 | 40.6±16.9 | NS |
| Gender
(female/male) | 53/6 | 34/4 | NS |
| Waist circumference
(cm) | 83.4±9.4 | 77.1±8.7 | 0.043 |
| Hip circumference
(cm) | 94.6±7.3 | 93.5±4.1 | NS |
| SBP (mmHg) | 120.5±8.8 | 130.7±22.9 | NS |
| DBP (mmHg) | 75.5±5.3 | 71.2±5.4 | NS |
| BMI
(kg/m2) | 23.3±3.7 | 23.7±3.2 | NS |
| FT3
(pg/ml) | 2.9±0.6 | 2.9±0.7 | NS |
| FT4
(ng/dl) | 1.1±0.3 | 1.1±0.1 | NS |
| TT3
(ng/ml) | 1.1±0.4 | 1.4±1.5 | NS |
| TT4
(µg/dl) | 8.5±3.0 | 9.3±1.7 | NS |
| TSH (µU/ml) | 2.1±1.2 | 2.2±1.3 | NS |
| Anti-TPO
(U/ml) | 790.1±572.3 | 30.3±16.6 | <0.001 |
| Anti-TG (U/ml) | 216.5±29.3 | 16.1±9.7 | <0.001 |
| TC (mmol/l) | 4.9±1.3 | 4.5±0.9 | NS |
| TG (mmol/l) | 1.4±0.8 | 1.1±0.8 | NS |
| HDL-C (mmol/l) | 1.5±0.4 | 1.3±0.6 | NS |
| LDL-C (mmol/l) | 3.3±1.3 | 3.0±0.7 | NS |
| GADA (%) | 0 | 0 | NS |
| IAA (%) | 0 | 0 | NS |
| ICA (%) | 0 | 0 | NS |
| IGR (%) | 39.1 | 30.8 | NS |
Comparison of pancreatic β-cell
function and insulin sensitivity between HT and control groups
As shown in Table
II, the parameters for HOMA-β, insulin response (ΔI30/ΔG30),
and estimated insulin resistance in the fasting state (HOMA-IR) and
postprandial state (ISIM) showed no significant
differences between the HT and control groups. Furthermore, the
early-phase DI (DI30) and the total DI (DI120) were similar between
the two groups. However, the early-phase and total insulin
secretions (InsAuc30/GluAuc30 and InsAuc120/GluAuc120,
respectively) were markedly higher in the HT group, compared with
those in the control group. In addition, the basal insulin DI,
which reflected the capacity of β-cell compensation function for IR
in the fasting state, was significantly lower in the HT group
(P<0.05). These results indicated that the patients with type I
HT had increased insulin secretion in the postprandial state. No
significant differences were found in the fasting glucose or
insulin secretion, indicated by plasma C-peptide and insulin
differences between the HT and control groups (Fig. 1), however, the fasting β-cell
compensation function (indicated by DI) was markedly reduced in the
HT group (Table I).
| Table II.Comparison of β-cell function and
insulin sensitivity between HT and control groups. |
Table II.
Comparison of β-cell function and
insulin sensitivity between HT and control groups.
| Parameter | HT (n=59) | Control (n=38) | P-value |
|---|
| Secretory capacity
of pancreatic β-cells |
|
|
|
|
HOMA-β | 132.4±95.7 | 187.1±153.6 | NS |
|
ΔI30/ΔG30 | 20.3±18.5 | 17.3±13.2 | NS |
|
InsAuc30/GluAuc30 | 45.3±31.2 | 32.2±14.1 | 0.015 |
|
InsAuc120/GluAuc120 | 61.9±38.5 | 45.1±22.2 | 0.047 |
| β-cell compensation
for IR |
|
|
|
| DI | 63.0±30.4 | 108.6±78.6 | 0.002 |
|
DI30 | 217.5±161.4 | 196.3±89.1 | NS |
|
DI120 | 294.5±197.6 | 266.0±107.8 | NS |
| Insulin
sensitivity |
|
|
|
|
HOMA-IR | 2.5±1.9 | 1.8±1.0 | NS |
|
ISIM | 6.1±4.8 | 6.9±3.2 | NS |
Comparison of lymphocyte populations
between HT and control groups
To analyze lymphocyte populations, peripheral blood
was obtained from patients in the HT group and the healthy
controls. The percentages of different lymphocyte populations were
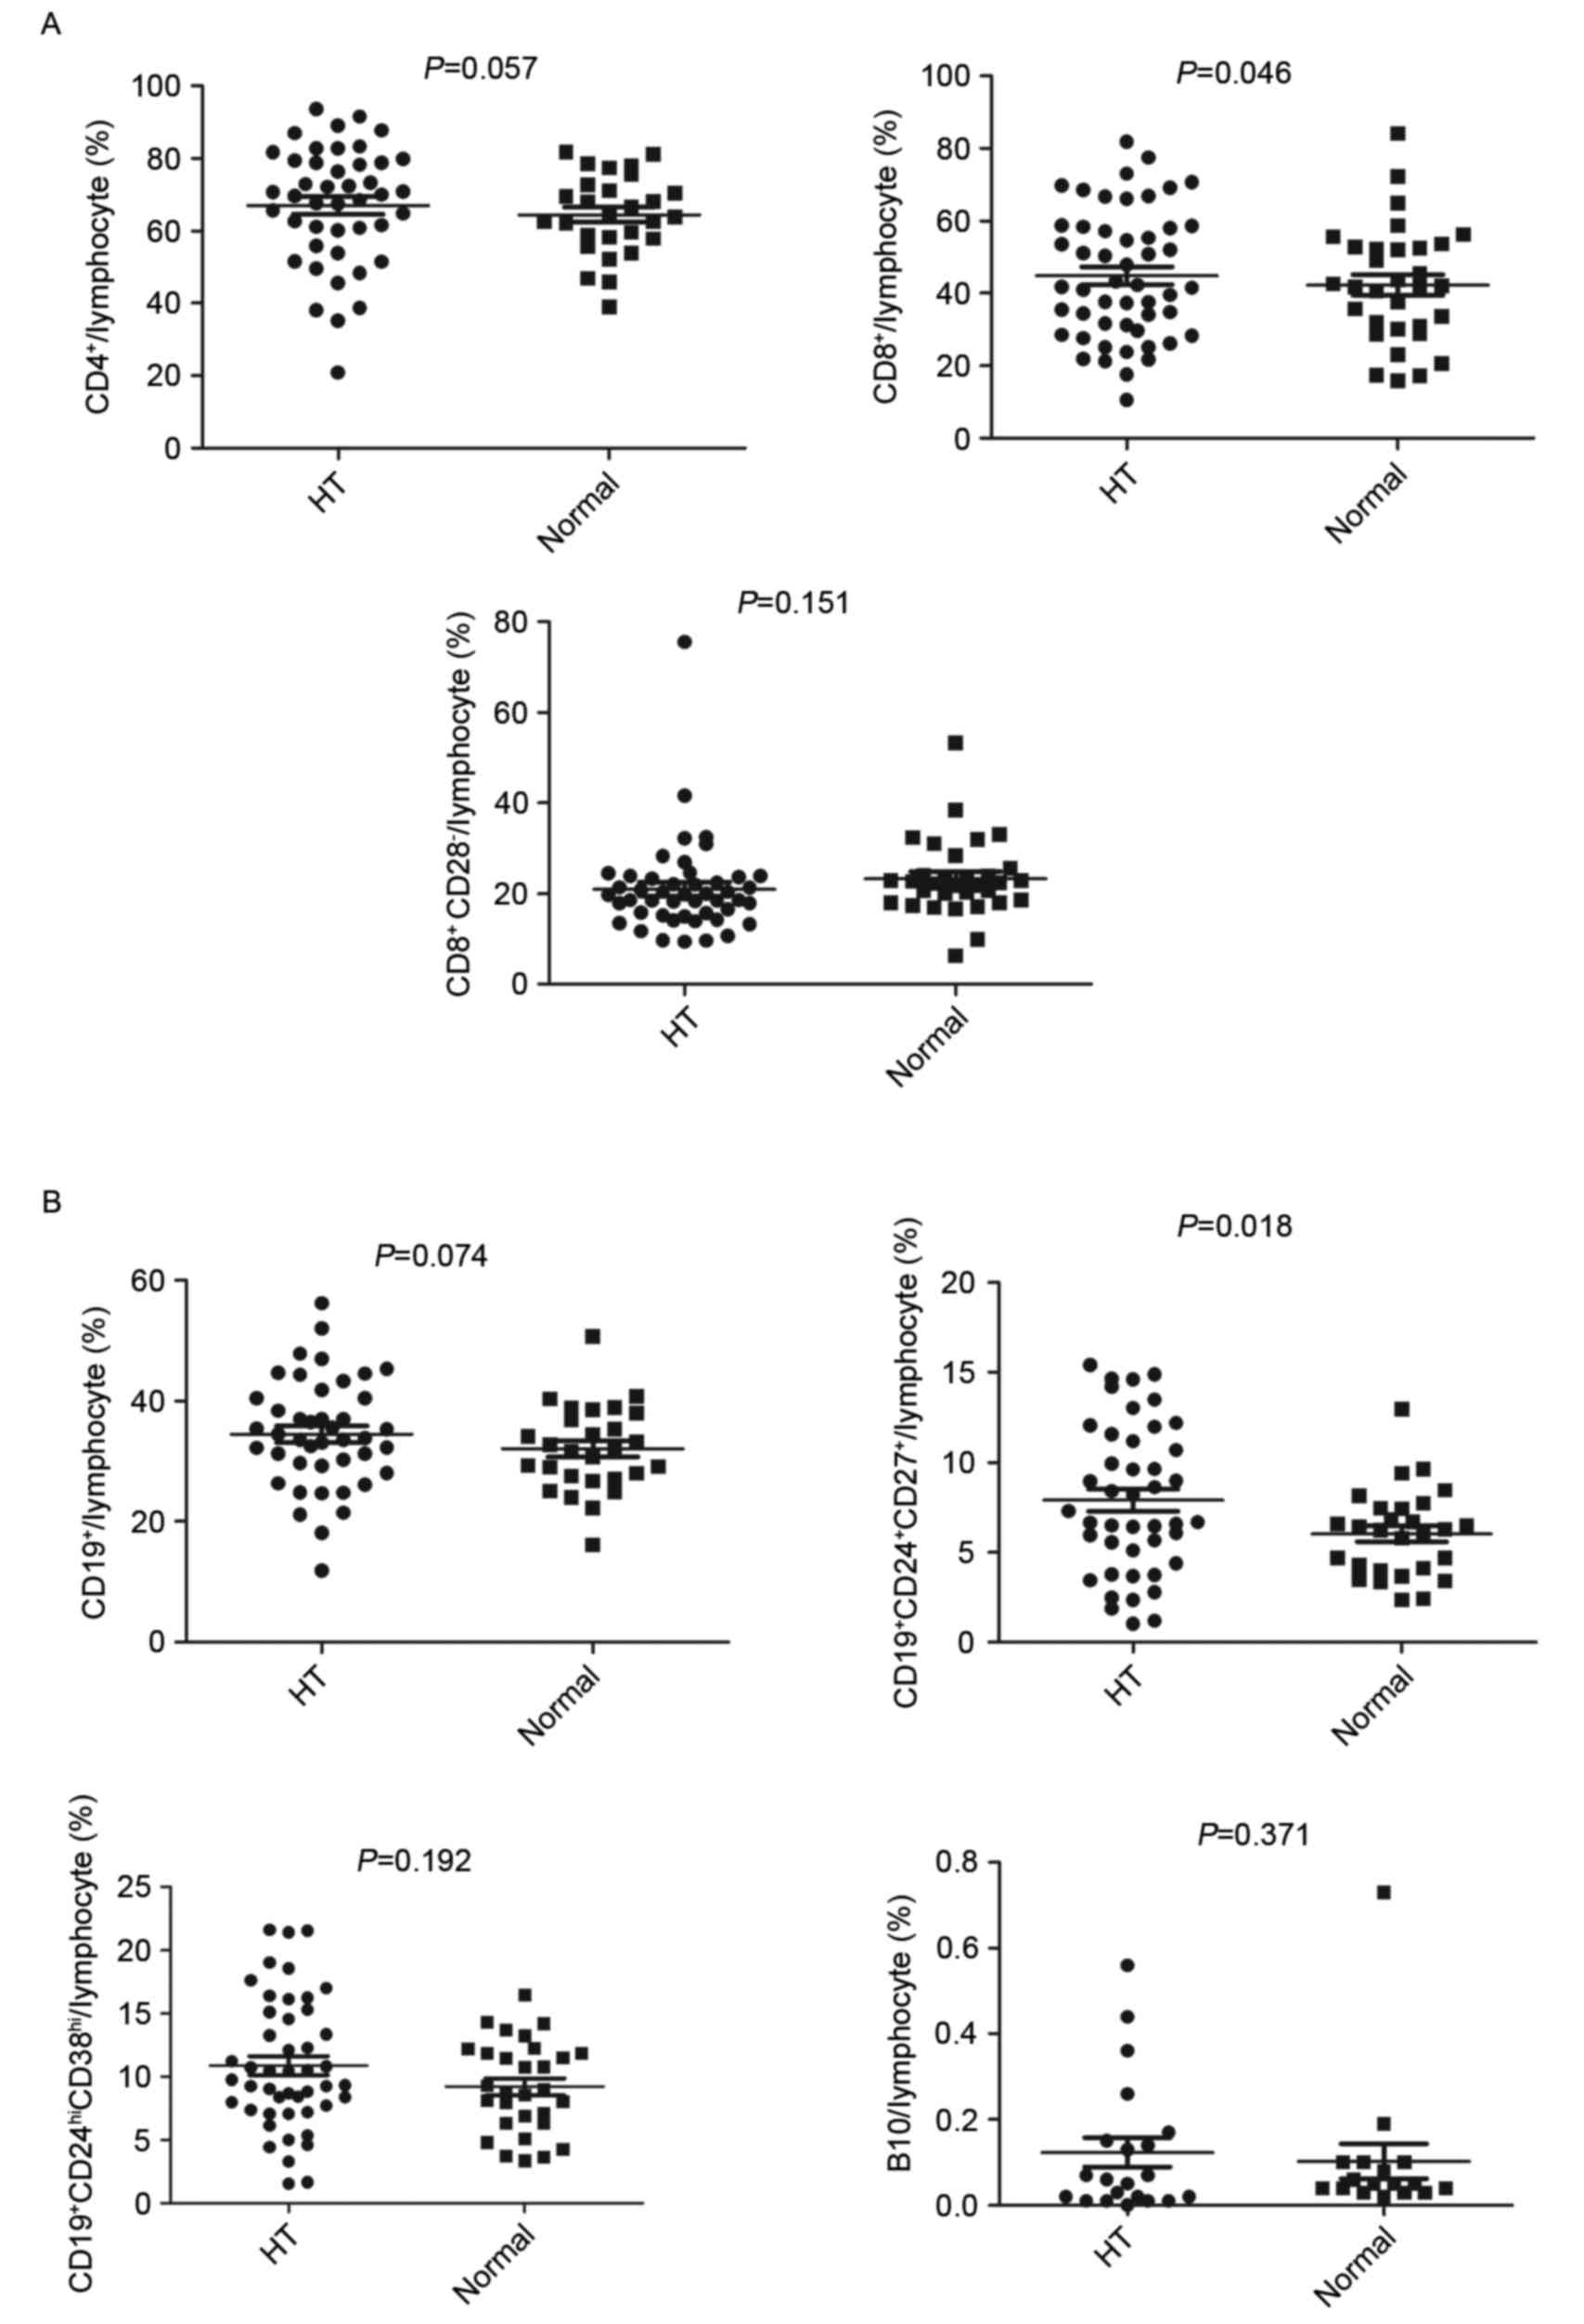
measured using flow cytometry. No significant differences in the
overall percentage of CD4+ T cells or the
CD8+CD28− TReg cell subset were observed
between the HT and control groups (Fig. 2A, upper left and lower panels).
However, patients in the HT group had an increased percentage of
CD8+ T cells, compared to the control group (P<0.05;
Fig. 2A, upper right panel).
To assess the percentages of different B cell
subsets, cells were stained with specific lineage markers. As shown
in Fig. 2B, the percentage of the
specific Breg cell subset,
CD19+CD24+CD27+, was significantly
higher in the HT group (P<0.05) (upper right panel). However, no
differences in the other regulatory Breg cell subset
(CD19+CD24hiCD38hi) or the B10
cells were found between the HT and control groups (lower
panels).
Correlation of
CD19+CD24+CD27+ Breg cells with
β-cell function and insulin sensitivity
To determine the correlation between the enhancement
of Bregs with insulin sensitivity, the study subjects were divided
into CD19+CD24+CD27+ Breg enhancer
and Breg control groups. A reference range for different subsets of
peripheral lymphocytes was set as the interquartile range (25–75th
percentile) of the percentages of lymphocyte subsets in the control
group. According to the reference range, all study subjects were
divided into two groups: Those with a higher percentage of
CD19+CD24+CD27+ Breg cells,
compared with the reference range (>7.4325%; elevated group),
and those with a percentage of
CD19+CD24+CD27+ Breg cells within
the reference range (≤7.4325%; normal group). Pancreatic β-cell
function and insulin sensitivity were compared between the two
groups. As shown in Fig. 3, HOMA-β
and HOMA-IR were significantly increased in the elevated group,
indicating that the insulin secretory capacity of β-cells and the
insulin resistance in the fasting state were enhanced in
individuals with an elevated level of
CD19+CD24+CD27+ Breg cells.
However, no differences were observed in the insulin secretion
index in the postprandial state (InsAuc30/GluAuc30 and
InsAuc120/GluAuc120) between groups.
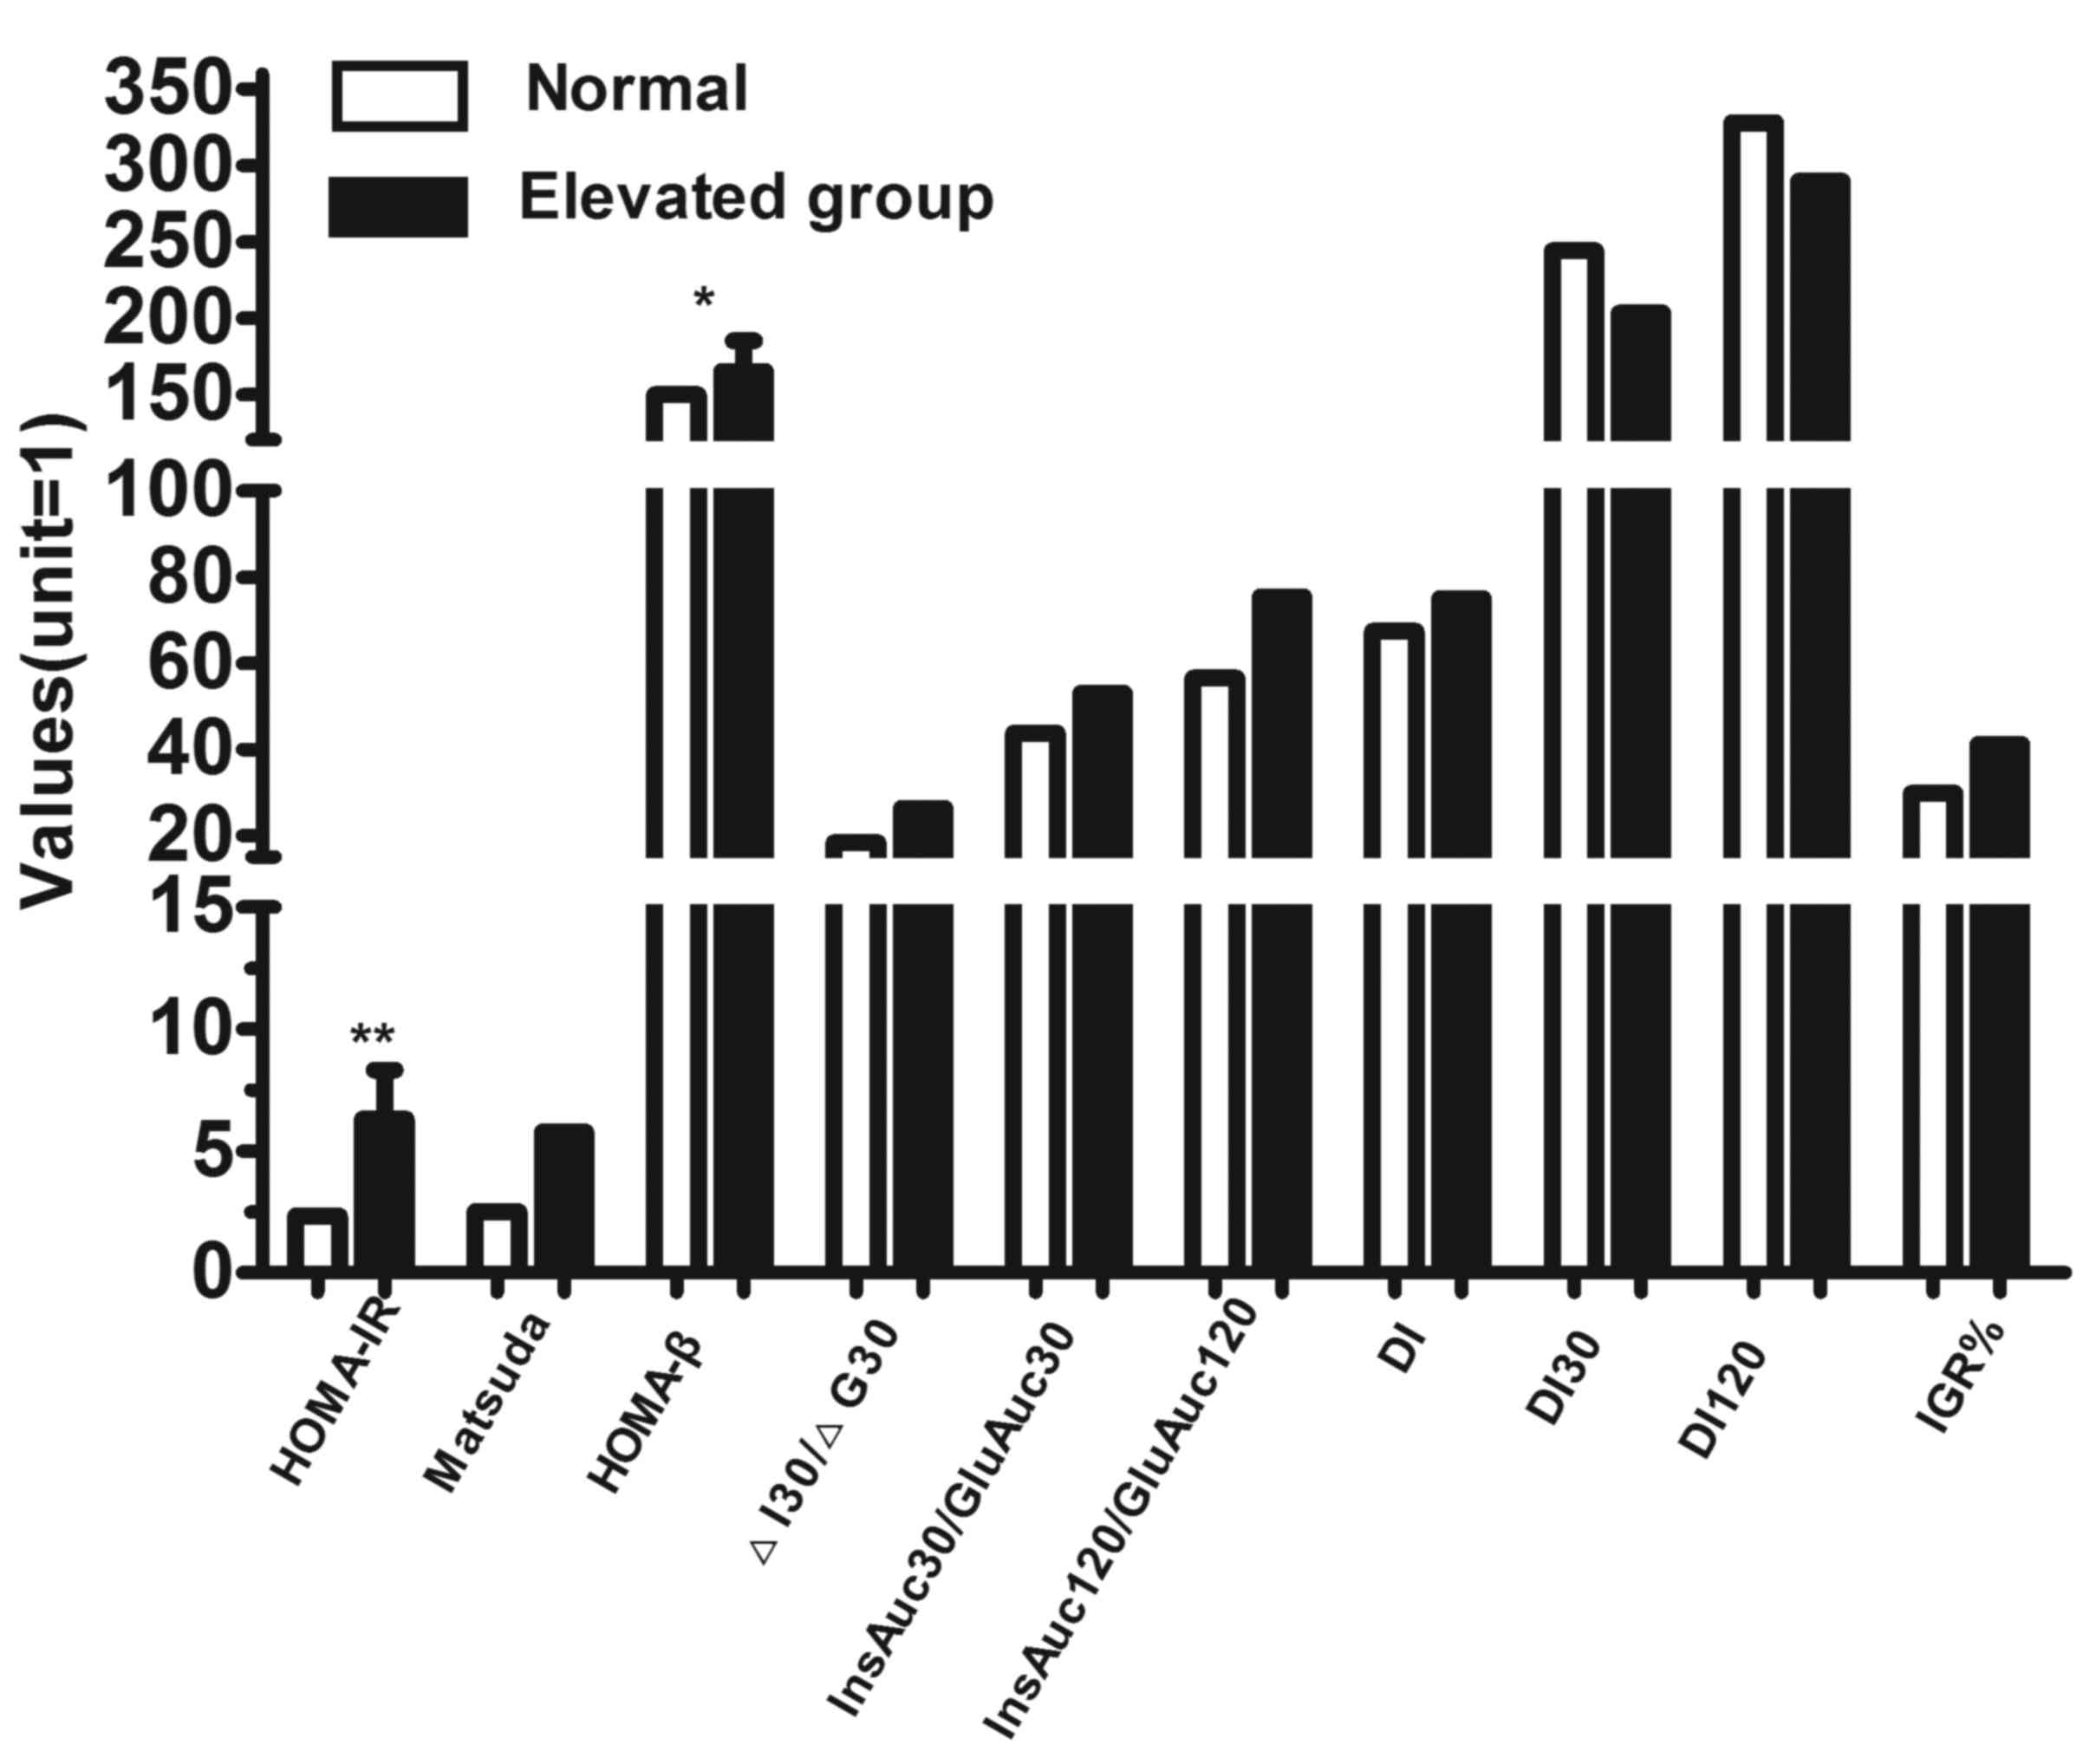 | Figure 3.Comparison of pancreatic parameters
for β-cell function and insulin sensitivity between individuals
with normal and elevated
CD19+CD24+CD27+ Breg cells. All
study subjects were divided according to their percentage of
CD19+CD24+CD27+ Breg cells. The
parameters for β-cell function and insulin sensitivity were
compared between the normal and elevated groups, and the values are
shown on the vertical axis. The incidence of subclinical diabetes,
in which the plasma glucose level reached the diagnostic criteria
for diabetes without other clinical symptoms, and the incidence of
IGR were calculated separately for each group. *P<0.05;
**P<0.01. Breg, regulatory B cell; OGTT, oral glucose tolerance
test; HOMA-IR, homeostasis model assessment of insulin resistance;
HOMA-β, homeostasis model assessment of β-cell function; ΔI30/ΔG30,
change in insulin and glucose ratio at 30 min OGTT;
InsAuc30/GluAuc30; early-phase insulin secretion at 30 min;
InsAuc120/GluAuc120, ratio of insulin to glucose area under the
curve values at 120 min; DI, disposition index; DI30: disposition
index at 30 min OGTT; DI120: disposition index at 120 min OGTT;
IGR, impaired glucose regulation. |
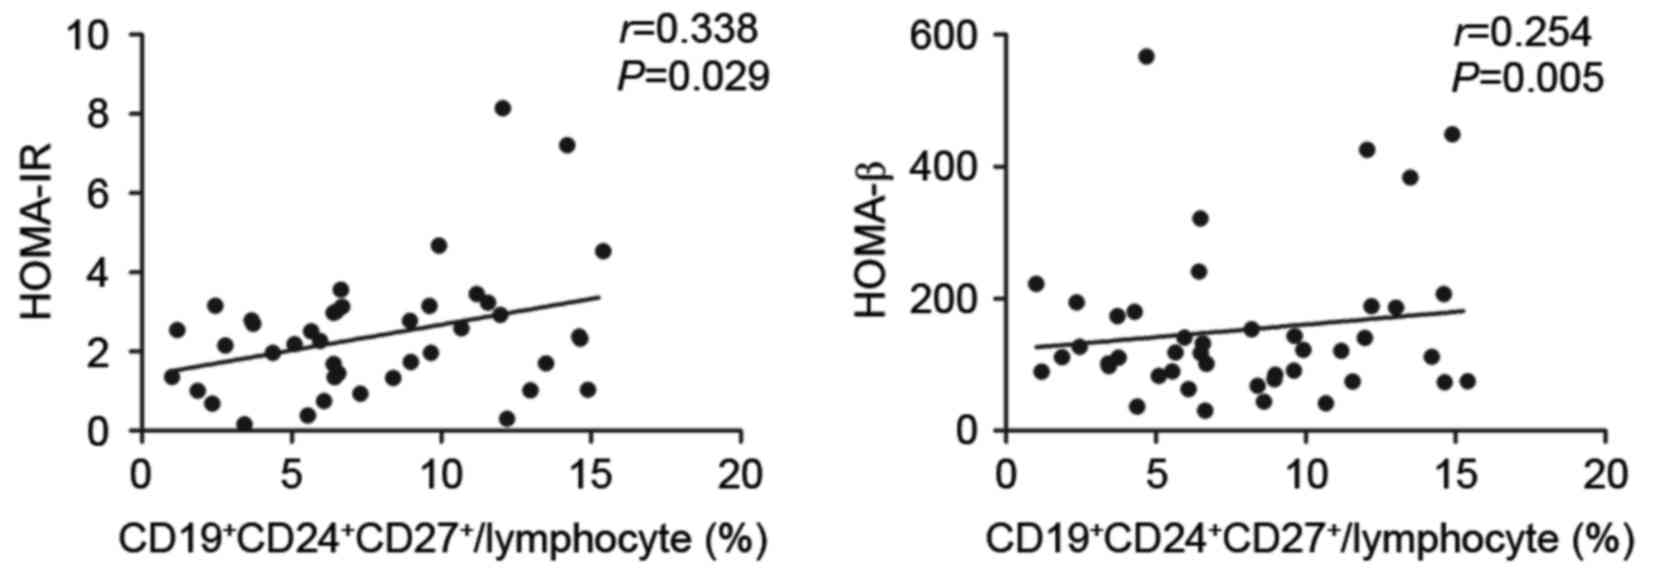
To investigate whether the elevated level of
CD19+CD24+CD27+ Breg cells was
associated with alterations in insulin secretion and insulin
sensitivity, correlation analysis was performed. The results
demonstrated that the
CD19+CD24+CD27+ Bregs were
positively correlated with HOMA-IR (r=0.338; P=0.029) and HOMA-β
(r=0.254; P=0.005; Fig. 4).
Insulin resistance is commonly observed in patients
with HT accompanied with clinical or subclinical hypothyroidism
(1). Previous investigations to
elucidate the mechanism of insulin resistance in patients with HT
have yielded inconclusive results. The present study demonstrated
for the first time, to the best of our knowledge, the action of
insulin in patients with type I HT with preserved normal thyroid
function. The results indicated that these patients had
insufficient insulin secretion following adjusting insulin
resistance (DI) and increased insulin secretion in the postprandial
state. An elevated level of
CD19+CD24+CD27+ Bregs was observed
in these patients, which was positively correlated with insulin
secretion and insulin resistance in the fasting state. These
results revealed a close association between immune dysregulation
and insulin resistance in type I HT.
The observation of a normal blood glucose level and
elevated insulin level, described as hyperinsulinemia, indicates
the presence of insulin resistance. Insulin resistance contributes
to the development of various medical conditions, including type 2
DM, metabolic syndromes, obesity, hypertension, dyslipidemia,
elevated free fatty acid and a deregulated stress responses
(25). In the present study, the
levels of plasma glucose remained normal during OGTT in the HT
group. However, the early-phase and total insulin secretion
increased significantly, compared with the levels in the control
group, indicating the possibility of postprandial insulin
resistance. The fasting insulin secretion and insulin resistance
levels in the HT group were normal, however, fasting β-cell
compensation function was impaired, as indicated by a significant
reduction in DI. DI reflects the ability of β-cells to compensate
for insulin resistance; a reduced DI indicates impaired
compensation. When insulin resistance increases, insulin secretion
consequently increases. However, if the insulin secreted from
β-cells is insufficient to compensate for insulin resistance, then
the DI decreases, indicating impaired β-cell compensation function
(26). In the present study, the
fasting DI was significantly decreased in the HT group, compared
with that in the control group, suggesting that the patients with
HT had impaired β-cell compensation function and that insulin
levels were not sufficient to compensate for the insulin
resistance.
Previously, immune components, including
CD8+ cytotoxic T lymphocytes, proinflammatory T cells,
and Tregs, have been shown to be important in the pathophysiology
of autoimmune HT. Notably, the present study found no significant
differences in CD4+ or CD8+CD28− T
cells, but found a decrease in the overall percentage of
CD8+ T cells. However, previous studies have shown that
the infiltration of proinflammatory T cells and overproduction of
inflammatory mediators are largely present in the liver and muscle
tissues of diabetic patients, which have been implicated in the
development of insulin resistance (27,28).
Under normal circumstances, the activation and proliferation of
these proinflammatory T cells are strictly regulated by their
interplay with Tregs, thus the immune balance is carefully
maintained.
The present study is the first, to the best of our
knowledge, to report on the involvement of
CD19+CD24+CD27+ Bregs in HT and
associated insulin resistance. The patients with HT had reduced DI,
and the elevated CD19+CD24+CD27+
Breg population was positively correlated with fasting insulin
secretion and insulin resistance. Although the regulatory mechanism
of Bregs remains to be elucidated, studies in diabetic patients may
provide insight to facilitate understanding of HT. Rather than
producing the anti-inflammatory cytokine IL-10, Bregs in diabetic
patients upregulate the expression of proinflammatory cytokines,
including IL-6 and IL-8, and promote inflammation (29,30).
In the present study of type I HT, the percentage of
CD19+CD24+CD27+ Bregs was elevated
significantly, compared with that in the healthy controls. This
increase in CD19+CD24+CD27+ Bregs
may also increase the expression of IL-6 and IL-8 in HT, promoting
increased autoimmune inflammation, and thereby increasing risk of
insulin resistance and decreased β-cell function. There may also be
a feedback mechanism by which the Bregs are activated and
proliferate in response to the tissue damage caused by infiltrating
inflammatory cells. The causal association between Breg
dysregulation and insulin resistance remains to be elucidated.
Further investigation is required to define the exact role of Bregs
in the development of HT.
In the patients with type I HT examined in the
present study, insulin resistance, indicated by increased
early-phase and total insulin secretion, but a normal glucose
response was observed during OGTT. The increase in the percentage
of CD19+CD24+CD27+ Breg cells was
correlated with insulin resistance in the fasting state and
homeostatic β-cell function. However, no significant association
was found between the postprandial secretion of insulin and
alterations in the CD19+CD24+CD27+
Breg population. These results indicated potential contributions
from other cellular components or immune factors acting during the
later phases of insulin sensitivity, which functioned with Bregs to
regulate insulin signaling in the postprandial state.
The patients with HT examined in the present study
showed increased postprandial insulin levels, but normal fasting
insulin levels. A possible explanation for these differences may be
due to the primary tissues involved in the action of insulin.
Fasting insulin resistance is associated with decreased glucose
uptake and utilization under the regulation of insulin in the
liver, whereas postprandial insulin resistance is associated with
reduced glucose uptake and utilization in muscle and adipose
tissues. The required insulin level for glucose uptake in muscle or
adipose tissues is substantially higher, compared with the level
required in the liver. Therefore, fasting and postprandial insulin
levels are increased in compensation in individuals with insulin
resistance, although the postprandial insulin level is increased to
a higher degree.
In conclusion, the present study demonstrated an
increase in postprandial insulin secretion and impaired fasting
β-cell compensation function, indicated by reduced DI, in patients
with type I HT. An increased percentage of
CD19+CD24+CD27+ Breg cells was
found in these patients, which was closely associated with β-cell
function and insulin resistance in the fasting state. These results
may assist in the development of novel therapeutic strategies,
which target the fundamental immune components involved in the
pathogenesis of HT.
Acknowledgements
This study was supported by the Scientific Research
Plan Project of Health and Family Planning Commission of Shanghai
(grant no. 201440514).
References
|
1
|
Maratou E, Hadjidakis DJ, Kollias A,
Tsegka K, Peppa M, Alevizaki M, Mitrou P, Lambadiari V, Boutati E,
Nikzas D, et al: Studies of insulin resistance in patients with
clinical and subclinical hypothyroidism. Eur J Endocrinol.
160:785–790. 2009. View Article : Google Scholar
|
|
2
|
Fernandez-Real JM, Lopez-Bermejo A, Castro
A, Casamitjana R and Ricart W: Thyroid function is intrinsically
linked to insulin sensitivity and endothelium-dependent
vasodilation in healthy euthyroid subjects. J Clin Endocrinol
Metab. 91:3337–3343. 2006. View Article : Google Scholar
|
|
3
|
Roos A, Bakker SJ, Links TP, Gans RO and
Wolffenbuttel BH: Thyroid function is associated with components of
the metabolic syndrome in euthyroid subjects. J Clin Endocrinol
Metab. 92:491–496. 2007. View Article : Google Scholar
|
|
4
|
Dimitriadis G, Mitrou P, Lambadiari V,
Boutati E, Maratou E, Panagiotakos DB, Koukkou E, Tzanela M,
Thalassinos N and Raptis SA: Insulin action in adipose tissue and
muscle in hypothyroidism. J Clin Endocrinol Metab. 91:4930–4937.
2006. View Article : Google Scholar
|
|
5
|
Jornayvaz FR, Lee HY, Jurczak MJ, Alves
TC, Guebre-Egziabher F, Guigni BA, Zhang D, Samuel VT, Silva JE and
Shulman GI: Thyroid hormone receptor-α gene knockout mice are
protected from diet-induced hepatic insulin resistance.
Endocrinology. 153:583–591. 2012. View Article : Google Scholar
|
|
6
|
Stanická S, Vondra K, Pelikánová T, Vlcek
P, Hill M and Zamrazil V: Insulin sensitivity and
counter-regulatory hormones in hypothyroidism and during thyroid
hormone replacement therapy. Clin Chem Lab Med. 43:715–720. 2005.
View Article : Google Scholar
|
|
7
|
Handisurya A, Pacini G, Tura A, Gessl A
and Kautzky-Willer A: Effects of T4 replacement therapy on glucose
metabolism in subjects with subclinical (SH) and overt
hypothyroidism (OH). Clin Endocrinol (Oxf). 69:963–969. 2008.
View Article : Google Scholar
|
|
8
|
Dessein PH, Joffe BI and Stanwix AE:
Subclinical hypothyroidism is associated with insulin resistance in
rheumatoid arthritis. Thyroid. 14:443–446. 2004. View Article : Google Scholar
|
|
9
|
Finucane JF: Carbohydrate tolerance in
autoimmune thyroiditis. Diabetes. 24:829–832. 1975. View Article : Google Scholar
|
|
10
|
Kornete M, Mason ES and Piccirillo CA:
Immune regulation in T1D and T2D: Prospective role of foxp3+ treg
cells in disease pathogenesis and treatment. Front Endocrinol
(Lausanne). 4:762013.
|
|
11
|
Herold KC, Hagopian W, Auger JA,
Poumian-Ruiz E, Taylor L, Donaldson D, Gitelman SE, Harlan DM, Xu
D, Zivin RA and Bluestone JA: Anti-CD3 monoclonal antibody in
new-onset type 1 diabetes mellitus. N Engl J Med. 346:1692–1698.
2002. View Article : Google Scholar
|
|
12
|
Penaranda C, Tang Q and Bluestone JA:
Anti-CD3 therapy promotes tolerance by selectively depleting
pathogenic cells while preserving regulatory T cells. J Immunol.
187:2015–2022. 2011. View Article : Google Scholar :
|
|
13
|
Herold KC, Gitelman S, Greenbaum C, Puck
J, Hagopian W, Gottlieb P, Sayre P, Bianchine P, Wong E,
Seyfert-Margolis V, et al: Treatment of patients with new onset
type 1 diabetes with a single course of anti-CD3 mAb Teplizumab
preserves insulin production for up to 5 years. Clin Immunol.
132:166–173. 2009. View Article : Google Scholar :
|
|
14
|
Pescovitz MD, Greenbaum CJ,
Krause-Steinrauf H, Becker DJ, Gitelman SE, Goland R, Gottlieb PA,
Marks JB, McGee PF, Moran AM, et al: Rituximab, B-lymphocyte
depletion, and preservation of beta-cell function. N Engl J Med.
361:2143–2152. 2009. View Article : Google Scholar
|
|
15
|
Winer DA, Winer S, Shen L, Wadia PP,
Yantha J, Paltser G, Tsui H, Wu P, Davidson MG, Alonso MN, et al: B
cells promote insulin resistance through modulation of T cells and
production of pathogenic IgG antibodies. Nat Med. 17:610–617. 2011.
View Article : Google Scholar :
|
|
16
|
Filaci G, Fravega M, Negrini S, Procopio
F, Fenoglio D, Rizzi M, Brenci S, Contini P, Olive D, Ghio M, et
al: Nonantigen specific CD8+ T suppressor lymphocytes originate
from CD8+CD28- T cells and inhibit both T-cell proliferation and
CTL function. Hum Immunol. 65:142–156. 2004. View Article : Google Scholar
|
|
17
|
Yang M, Rui K, Wang S and Lu L: Regulatory
B cells in autoimmune diseases. Cell Mol Immunol. 10:122–132. 2013.
View Article : Google Scholar :
|
|
18
|
Mizoguchi A, Mizoguchi E, Takedatsu H,
Blumberg RS and Bhan AK: Chronic intestinal inflammatory condition
generates IL-10-producing regulatory B cell subset characterized by
CD1d upregulation. Immunity. 16:219–230. 2002. View Article : Google Scholar
|
|
19
|
Mizoguchi A and Bhan AK: A case for
regulatory B cells. J Immunol. 176:705–710. 2006. View Article : Google Scholar
|
|
20
|
Kalampokis I, Yoshizaki A and Tedder TF:
IL-10-producing regulatory B cells (B10 cells) in autoimmune
disease. Arthritis Res Ther. 15 Suppl 1:S12013. View Article : Google Scholar :
|
|
21
|
Shi L, Bi M, Yang R, Zhou J, Zhao S, Fan
C, Shan Z, Li Y and Teng W: Defective expression of regulatory B
cells in iodine-induced autoimmune thyroiditis in non-obese
diabetic H-2(h4) mice. J Endocrinol Invest. 37:43–50. 2014.
View Article : Google Scholar
|
|
22
|
Lin Y and Sun Z: Thyroid hormone
potentiates insulin signaling and attenuates hyperglycemia and
insulin resistance in a mouse model of type 2 diabetes. Br J
Pharmacol. 162:597–610. 2011. View Article : Google Scholar :
|
|
23
|
Slatosky J, Shipton B and Wahba H:
Thyroiditis: Differential diagnosis and management. Am Fam
Physician. 61:1047–1052, 1054. 2000.
|
|
24
|
Alberti KG and Zimmet PZ: Definition,
diagnosis and classification of diabetes mellitus and its
complications. Part. 1:Diagnosis and classification of diabetes
mellitus provisional report of a WHO consultation. Diabet Med 15:
539–553. 1998.
|
|
25
|
Samuel VT and Shulman GI: Mechanisms for
insulin resistance: Common threads and missing links. Cell.
148:852–871. 2012. View Article : Google Scholar :
|
|
26
|
Bergman RN, Ader M, Huecking K and Van
Citters G: Accurate assessment of beta-cell function: The
hyperbolic correction. Diabetes. 51 Suppl 1:S212–S220. 2002.
View Article : Google Scholar
|
|
27
|
Kintscher U, Hartge M, Hess K,
Foryst-Ludwig A, Clemenz M, Wabitsch M, Fischer-Posovszky P, Barth
TF, Dragun D, Skurk T, et al: T-lymphocyte infiltration in visceral
adipose tissue: A primary event in adipose tissue inflammation and
the development of obesity-mediated insulin resistance.
Arterioscler Thromb Vasc Biol. 28:1304–1310. 2008. View Article : Google Scholar
|
|
28
|
Pickup JC: Inflammation and activated
innate immunity in the pathogenesis of type 2 diabetes. Diabetes
Care. 27:813–823. 2004. View Article : Google Scholar
|
|
29
|
Jagannathan M, McDonnell M, Liang Y,
Hasturk H, Hetzel J, Rubin D, Kantarci A, Van Dyke TE, Ganley-Leal
LM and Nikolajczyk BS: Toll-like receptors regulate B cell cytokine
production in patients with diabetes. Diabetologia. 53:1461–1471.
2010. View Article : Google Scholar :
|
|
30
|
DeFuria J, Belkina AC, Jagannathan-Bogdan
M, Snyder-Cappione J, Carr JD, Nersesova YR, Markham D, Strissel
KJ, Watkins AA, Zhu M, et al: B cells promote inflammation in
obesity and type 2 diabetes through regulation of T-cell function
and an inflammatory cytokine profile. Proc Natl Acad Sci USA.
110:pp. 5133–5138. 2013; View Article : Google Scholar :
|