Introduction
There were 485,000 women newly diagnosed with
cervical cancer worldwide in 2013, leading to 236,000 mortalities
(1). The incidence and mortality
of cervical cancer exhibits an uneven distribution across the
world; almost 85% of cases are identified in less developed
countries. Cervical cancer ranks second among the most diagnosed
cancers and is the third leading cause of mortality from cancer in
females in less developed countries (2).
It is well known that infection with human papilloma
virus is a major cause of cervical cancer (3). Although well-established screening
programs and intervention systems have significantly reduced the
incidence of cervical cancer in developed countries, patients are
still diagnosed with advanced cancer. Limited treatment options for
patients with advanced stages of cervical cancer results in a high
recurrence rate and a poor prognosis (2). Currently, the combination of
cisplatin chemotherapy and radiotherapy is the most common
treatment strategy for advanced cervical cancer patients; however,
the 5-year survival rate remains poor (<50%). Since the
development of pharmacogenomics and personalized medicine, target
therapy has dramatically increased the survival rate of cancer
patients (4). Treatment of
advanced cervical cancers would drastically benefit from the
identification of novel therapeutic targets.
With the development of next generation sequencing
technologies, RNA sequencing (RNA-Seq) has become a powerful tool
for analyzing cancer transcriptomes, detecting such items as
alternative splicing, isoform usage, gene fusions and novel
transcripts with greater accuracy and higher efficiency (5,6).
Initially, RNA-Seq was applied in the expression profile of yeast
(7) and human embryonic kidney and
B cell lines (8). RNA-Seq has wide
application in transcriptome profile analysis in multiple cancers
including breast (9) and colon
cancers (10). However, the
genomic landscape of cervical squamous cell cancer has yet to be
elucidated.
To provide an improved understanding of the
transcriptome of cervical squamous cell cancer, RNA-Seq of three
cervical squamous cell cancer and matched normal tissues was
performed. Differentially expressed genes (DEGs) were identified by
statistical analysis, and a subset of novel DEGs were validated by
reverse transcription-quantitative polymerase chain reaction
(RT-qPCR). In addition, Gene Ontology (GO) and Kyoto Encyclopedia
of Genes and Genomes (KEGG) pathway enrichment analysis was
performed.
Materials and methods
Patient samples
For human tissue samples, 27 cervical squamous tumor
samples (stage Ib-stage IIb) and matched adjacent normal tissues
were obtained from female patients undergoing curative surgery at
Fujian Cancer Hospital from April, 2013 to February, 2014 (Fuzhou,
China). The median age of the patients was 49 years, (range, 31–59
years). The number of patients in each staging was as follows:
Stage Ib (10), stage IIa
(12), stage IIb (5). None of the patients received
preoperative adjuvant radiotherapy or chemotherapy. All the samples
and matched clinical information were collected following written
informed consent from the patients.
RNA isolation and RT-qPCR
Total RNA from human cervical squamous cancer
tissues and corresponding normal tissues was prepared using TRIzol
reagent (Invitrogen; Thermo Fisher Scientific, Inc., Waltham, MA,
USA) according to the manufacturer's protocol. The RNA quality was
determined using an Agilent 2100 Bioanalyzer (Agilent Technologies
Inc., Santa Clara, CA, USA). Only RNA extracts with the following
criteria were used for RNA-Seq analysis: RNA integrity number, ≥7;
28S/18S ratio, >1.8; OD range, 1.9–2.1. For reverse
transcription, cDNA was synthesized using the ReverTra Ace qPCR RT
kit (Toyobo Co., Ltd., Osaka, Japan) with 1 µg of total RNA. qPCR
was performed using the SYBR Select Master Mix for CFX (Invitrogen;
Thermo Fisher Scientific, Inc.). The reaction consisted of 1 cycle
at 95°C for 15 min, followed by 40 cycles of 95°C for 15 sec, 55°C
for 30 sec and 70°C for 30 sec. Primer sequences are presented in
Table I. Relative quantification
was achieved by normalization to the amount of GAPDH using the
2−ΔΔCq method (11).
All measurements were repeated 3 times.
 | Table I.Primers used for reverse
transcription quantitative polymerase chain reaction. |
Table I.
Primers used for reverse
transcription quantitative polymerase chain reaction.
| Genes | Forward primer | Reverse primer |
|---|
| PRAC |
5′-ATTCTGGTCCCCACCTTTGC-3′ |
5′-GGAGGTAGTAAGATGGGCCG-3′ |
| EDN3 |
5′-AGACGGTGCCCTATGGACT-3′ |
5′GGTCCTTGACTTCAACCTCCTT-3′ |
| SOSTDC1 |
5′-AAGTGCAAGAGGTACACCCG-3′ |
5′-GGCTCTTTTCCGCTCTCTGT-3′ |
| KLK12 |
5′-GTAACCAGCAGCGTTCAACC-3′ |
5′-AGAGTGGAGTTGCAAATATAGGT-3′ |
| KLK13 |
5′-AGCAGGTGAGGGAAGTTGTC-3′ |
5′-GAAAGGGGCAGGGTTTGGAT-3′ |
| KLK5 |
5′-TTTTCAGAGTCCGTCTCGGC-3′ |
5′-GGATGGATTTGACCCCCTGG-3′ |
| KLK6 |
5′-ATAAGTTGGTGCATGGCGGA-3′ |
5′-GGAACTCTCCCTTTGCCGAA-3′ |
| OLIG2 |
5′-TCAAGATCAACAGCCGCGAG-3′ |
5′-GTAGATCTCGCTCACCAGTCG-3′ |
| GBX2 |
5′-AGGGCAAGGGAAAGACGAGT-3′ |
5′-GTAGTCCACATCGCTCTCCA-3′ |
| MUC16 |
5′-TGAGGAGAACATGTGGCCTG-3′ |
5′-GCTGCATGACGTTGTCTGTG-3′ |
| CCL1 |
5′-CAGCTCCATCTGCTCCAATGA-3′ |
5′-TTCTGTGCCTCTGAACCCATC-3′ |
| HTR1D |
5′-CCCTCGGTGTTGCTCATCAT-3′ |
5′-CAGAGCCTGTGATGAGGTGG-3′ |
| GAPDH |
5′-TGGTATCGTGGAAGGACT-3′ |
5′-AGGGATGATGTTCTGGAGA-3′ |
Transcriptome deep sequencing
Total RNA extracted from human samples was treated
with DNase I. Upon treatment, mRNA was isolated using Oligo d(T)25
Magnetic Beads (New England Biolabs, Inc., Ipswich, MA, USA). RNA
preparation was performed as previously described (12). The mRNA was digested into short
fragments and cDNA was synthesized using the mRNA fragments as
templates. Short fragments were purified and resolved with elution
buffer for end reparation and single nucleotide A (adenine)
addition. Then the short fragments were connected with adapters
and, following agarose gel electrophoresis, the suitable fragments
were selected for the PCR amplification as templates. During the
quality control steps, an Agilent 2100 Bioanalyzer (Agilent
Technologies, Inc., and an ABI StepOnePlus Real-Time PCR system
(Applied Biosystems; Thermo Fisher Scientific, Inc.) were used in
quantification and qualification of the sample library. The library
was sequenced using an Illumina HiSeq™ 2000 (Illumina, Inc., San
Diego, CA, USA).
Screening of DEGs
The method for screening of DEGs was developed by
Beijing Genomics Institute (BGI, Shenzhen, China) based on a
pervious study (13).
p(x)=e–λλxx!(λistherealtranscriptsofthegene)
The present study defined the number of unambiguous
clean tags (which means reads in RNA-Seq) from gene A as × and,
given that every gene's expression occupies only a small part of
the library, × yields to the Poisson distribution.
The total clean tag number of the sample 1 is N1 and
the total clean tag number of sample 2 is N2; gene A holds × tags
in sample 1 and y tags in sample 2. The probability of gene A
expressed equally between the two samples can be calculated
with:
2∑i=0i=yp(i|x)or2×(1–∑i=0i=yp(i|x))(if∑i=0i=yp(i|x)>0.5)p(y|x)=(N2N1)y(x+y)!x!y!(1+N2N1)(x+y+1)
A P-value corresponds to the differential gene
expression test. Since DEG analysis generates large multiplicity
problems in which thousands of hypotheses (as in whether gene × is
differentially expressed between the two groups) are tested
simultaneously, a correction for false positive (type I errors) and
false negative (type II) errors was performed using the false
discovery rate (FDR) method (14). This method assumed that R
differentially expressed genes have been selected in which S genes
really demonstrate differential expression and the other V genes
are false positives. If it is decided that the error ratio ‘Q=V/R’
must stay below a cutoff (e.g. 5%), then the FDR should be preset
to a number no larger than 0.05. FDR ≤0.001 (14) was used and the absolute value of
Log2Ratio≥1 as the threshold to judge the significance
of a gene expression difference.
GO analysis of DEGs
All DEGs were mapped to GO terms in the database
(http://www.geneontology.org/),
calculating gene numbers for every term. Then a hypergeometric was
used for the test to find significantly enriched GO terms in the
input list of DEGs, based on ‘GO:TermFinder’ (http://search.cpan.org/dist/GO-TermFinder). Then a
strict method was developed to perform this analysis:
P=1–∑i=0m–1(Mi)(N–Mn–i)(Nn)
Where N is the number of all genes with GO
annotation; n is the number of DEGs in N; M is the number of all
genes that are annotated to certain GO terms; and, m is the number
of DEGs in M. The calculated P-value was adjusted through a
Bonferroni Correction (15), and a
corrected P-value ≤0.05 was used as a threshold. GO terms
fulfilling this condition were defined as significantly enriched GO
terms in DEGs.
Pathway enrichment analysis of
DEGs
The formula was the same as that in GO analysis.
Here N is the number of all genes with KEGG annotation, n is the
number of DEGs in N, M is the number of all genes annotated to
specific pathways and m is the number of DEGs in M.
Statistical analysis
Results from qPCR were analysed using SPSS version
19.0 (SPSS Corp., Armonk, NY, USA). Student's t-test was used to
compare the differences in expression between cancer and normal
tissues. Cluster analysis was performed using Cluster 3.0
(http://bonsai.hgc.jp/~mdehoon/software/cluster/software.htm);
the R version 3.4.0 (R Foundation) with heatmap package (https://stat.ethz.ch/R-manual/R-devel/library/stats/html/heatmap.html)
was applied to the Pearson and Spearman clustering analysis.
P<0.05 was considered to indicate a statistically significant
result.
Results
Basic analysis of sequencing data
A basic analysis of sequencing data was performed,
whereby the data was compared with the human genome using TopHat
version 2.0.9 (https://ccb.jhu.edu/software/tophat/index.shtml);
48.47, 48.79 and 48.77 million clean reads were obtained from
cervical squamous cell cancer samples 1 (stage I b), 2 (stage II a)
and 3 (stage II b) with genome map rates (proportion of reads
mapped to a reference genome) of 85.04, 84.74 and 83.79%,
respectively. From the matched normal cervical samples 1–3, 47.31,
48.30 and 47.54 million clean reads were obtained with genome map
rates of 86.90, 86.33 and 86.03% respectively.
Analysis of DEGs
Next, the DEGs between cancer and normal tissue
samples were screened. The gene expression level was normalized and
measured by reads per kb of exon per million fragments mapped as
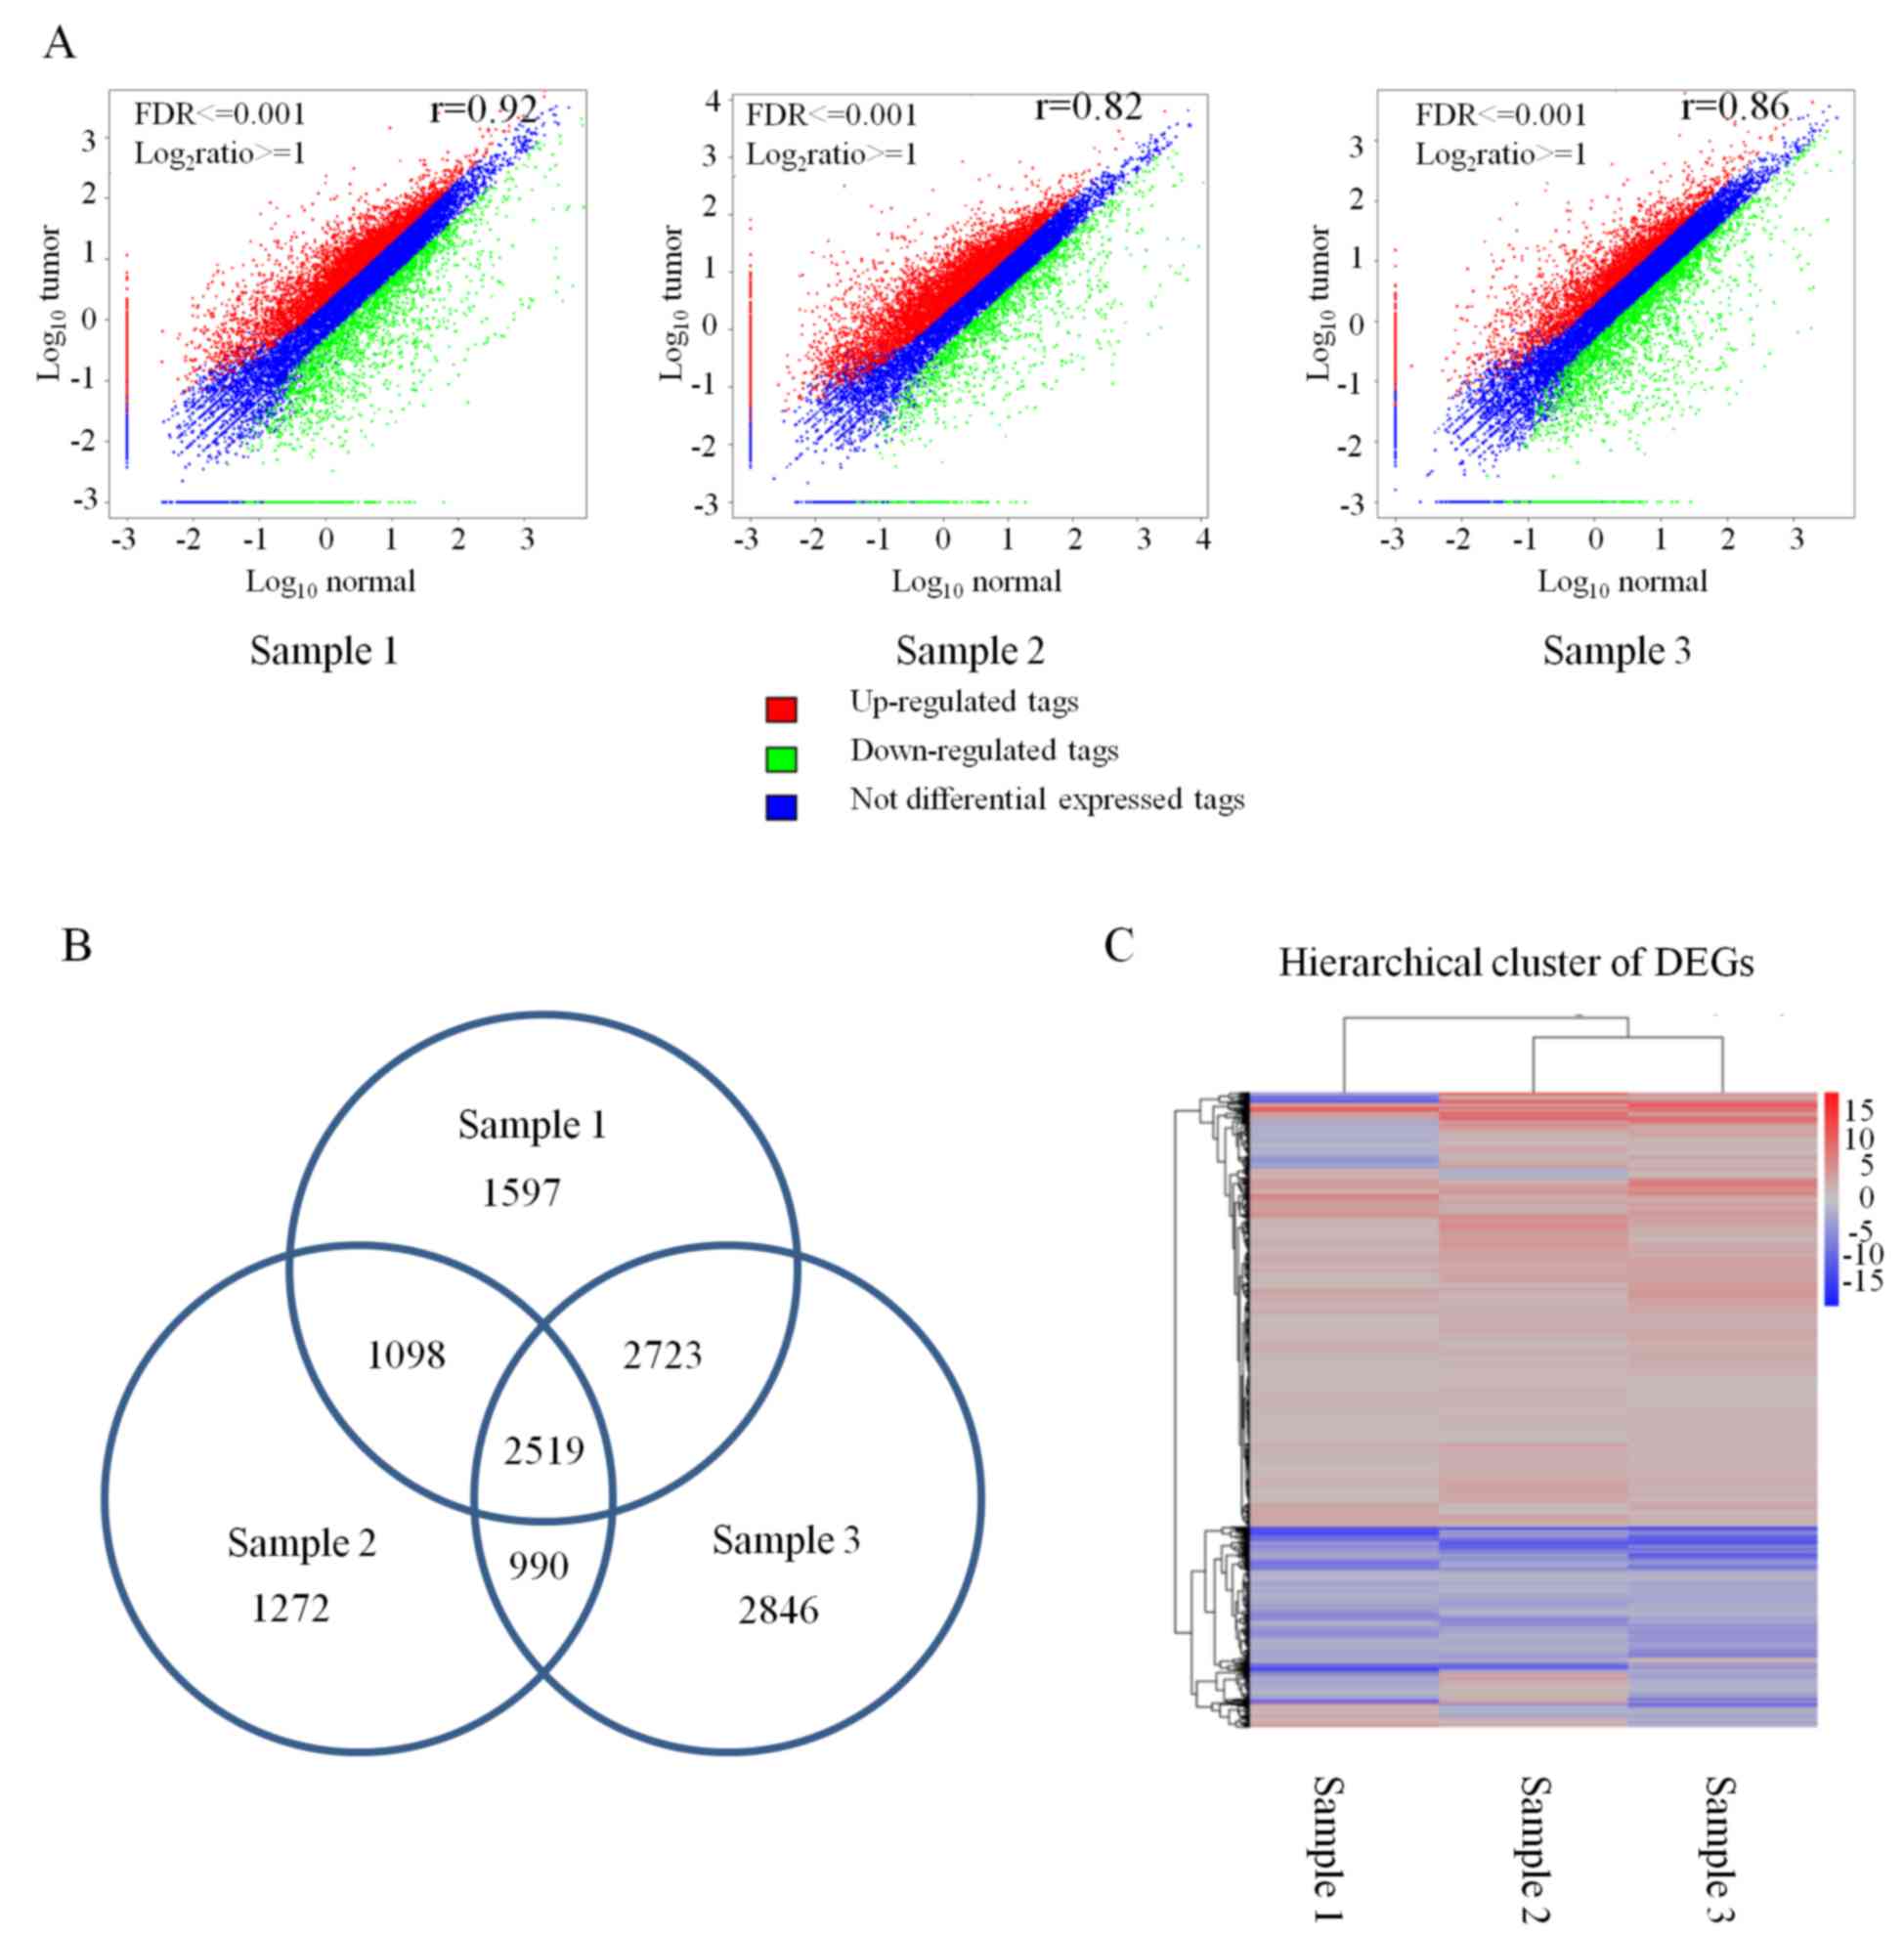
described above. In total, 7,936 DEGs were detected in
cancer/normal sample 1, 9,077 DEGs in cancer/normal sample 2, and
5,878 DEGs in cancer/normal sample 3 (Fig. 1A). Then, the overlapping DEGs in
three pairs of samples were calculated and resulted in 2,519
overlapping DEGs in which 1,450 genes were consistently upregulated
in the three cancer samples and 554 genes were consistently
downregulated in the three cancer samples (Fig. 1B). However, the rest of the 515
DEGs were not consistently expressed in all three pairs of samples
(Fig. 1B). Cluster analysis
revealed that 2,519 DEGs were identical in the three pairs of
samples (Fig. 1C). To screen for
the statistically significant DEGs, DEGs with fold changes ≥3 were
filtered out. With this threshold set, a total of 236 significant
DEGs were detected in the three sample pairs, among which 84 DEGs
were consistently upregulated and 152 DEGs were consistently
downregulated (Table II).
| Table II.List of significant differentially
expressed genes. |
Table II.
List of significant differentially
expressed genes.
| Gene symbol | Log2
(cancer vs. normal 1) | Log2
(cancer vs. normal 2) | Log2
(cancer vs. normal 3) | Average |
|---|
| GRP | 10.54868 |
9.411035 | 8.89707 | 9.61893 |
| NCRNA00313 |
9.817818 |
9.227841 |
9.280222 | 9.44196 |
| GBX2 |
8.452149 |
7.907159 | 11.89702 |
9.418777 |
| DUSP5P |
9.723775 | 8.01832 |
9.378824 |
9.040307 |
| OSTCL |
8.224955 | 9.28938 |
9.012454 |
8.842263 |
| SLC1A6 | 11.25474 |
6.720402 |
8.382081 |
8.785743 |
| MUC16 (CA125) |
9.088256 |
7.442924 |
9.262444 |
8.597873 |
| C8orf39 | 11.38619 | 10.93562 |
3.461771 |
8.594527 |
| CCL1 |
4.438704 |
9.430026 | 11.37549 | 8.41474 |
| HTR1D | 9.43695 | 7.39446 |
7.546875 |
8.126093 |
| SLFN12L |
5.035945 |
9.239662 |
9.971725 |
8.082443 |
| EN2 | 8.56846 |
5.597178 |
9.531558 |
7.899067 |
| OLIG2 |
6.906961 |
8.928602 |
7.520431 | 7.78533 |
| CAMP |
9.640688 |
9.946121 |
3.303074 | 7.62996 |
| SALL4 |
8.219391 | 10.70523 |
3.458123 |
7.460917 |
| TMED8 |
3.514758 | 12.33337 |
6.105627 | 7.31792 |
| FOXD3 |
3.729651 |
8.969243 | 9.12116 | 7.27335 |
| DNAJC5B |
9.583564 |
8.162562 |
3.478845 | 7.07499 |
| MMP3 |
7.707342 |
9.060809 |
4.216957 |
6.995037 |
| ONECUT2 |
8.016706 |
5.936664 |
6.709699 | 6.88769 |
| SLC24A2 |
7.428435 |
4.883445 |
8.076839 | 6.79624 |
| XIRP1 |
4.323227 |
6.049513 |
9.572409 |
6.648383 |
| TUBA3D |
4.153302 |
7.926962 |
7.772893 | 6.61772 |
| TM7SF4 |
7.775048 |
7.820021 |
4.203538 |
6.599537 |
| FOXD1 |
6.305949 | 8.09621 |
4.807546 |
6.403233 |
| DNAH5 |
7.543471 |
8.300234 |
3.291846 |
6.378517 |
| ZBED6 |
3.223498 |
8.059951 |
7.649948 |
6.311133 |
| INHBA | 5.49018 |
5.640679 |
7.472004 |
6.200953 |
| COL10A1 |
4.945116 | 9.64287 |
3.992286 |
6.193423 |
| CCL18 |
7.794751 |
7.065377 |
3.527205 | 6.12911 |
| HIST1H3G |
3.986192 | 10.74443 | 3.33624 |
6.022287 |
| ESM1 | 5.17567 |
7.531932 |
5.246043 |
5.984547 |
| PLA2G2F |
7.136285 |
7.286441 |
3.465107 | 5.96261 |
| GLDC |
5.663359 |
7.425411 |
4.524814 |
5.871193 |
| CSF2 (GMCSF) |
3.153302 | 10.14843 |
4.162211 |
5.821313 |
| GAS2L3 |
4.311731 |
8.448034 |
4.498861 |
5.752877 |
| FAM172BP |
3.960657 |
8.749995 |
4.269126 |
5.659927 |
| SCN8A |
8.282632 |
4.251928 |
4.299341 | 5.6113 |
| IL24 |
6.704049 |
5.178865 |
4.448351 |
5.443753 |
| AIM2 |
3.001299 |
9.176301 |
3.688599 |
5.288733 |
| KLHDC7B |
3.522536 |
6.009268 |
6.234041 | 5.25528 |
| DSCR6 |
8.119086 |
4.197481 |
3.278907 | 5.19849 |
| CXCL5 |
5.389794 |
5.913205 | 4.16949 |
5.157497 |
| TNNI3 |
4.841802 |
5.316369 |
5.269126 |
5.142433 |
| C1QL1 |
5.261826 |
3.796676 |
6.166828 | 5.07511 |
| DNAH11 |
5.814367 |
4.598159 |
4.538047 |
4.983523 |
| CELSR3 |
4.009208 |
6.425826 |
4.502799 |
4.979277 |
| PTPRR |
3.797158 |
7.448663 |
3.660185 | 4.96867 |
| MGAM |
5.090475 |
4.840449 |
4.606466 |
4.845797 |
| LOC100287559 |
6.917588 |
4.441899 |
3.124736 |
4.828073 |
| ITGB6 |
3.707891 |
7.290941 |
3.246702 | 4.74851 |
| C1orf152 |
3.551851 |
7.043164 |
3.615894 | 4.73697 |
| VWA3B |
3.908189 |
6.293915 |
3.985333 |
4.729147 |
| EPHB2 | 3.98941 |
6.179193 |
3.841365 | 4.66999 |
| LOC148696 |
3.153302 |
7.298488 | 3.33624 | 4.59601 |
| JPH2 |
3.888979 |
3.351702 |
6.529295 |
4.589993 |
| CDKN2A |
4.664062 |
5.672743 |
3.415469 | 4.58409 |
| TNNT1 |
5.645155 |
4.608629 |
3.449388 |
4.567723 |
| SIM2 |
5.530822 |
4.196787 |
3.783699 | 4.50377 |
| XIST |
3.744393 |
5.117718 |
4.556763 |
4.472957 |
| LOC100775107 |
3.563586 |
5.085756 |
4.595627 | 4.41499 |
| PLOD2 |
4.898069 |
4.881134 |
3.319208 |
4.366137 |
| CNGB1 |
4.806744 |
4.230395 |
3.852998 |
4.296713 |
| RSAD2 |
3.337828 |
4.916125 |
4.472057 |
4.242003 |
| FLJ43390 |
5.751652 |
3.737355 |
3.046734 | 4.17858 |
| EGFR |
5.416012 |
3.283692 | 3.41214 | 4.03728 |
| LOC100190986 |
3.642481 |
4.901331 |
3.562375 |
4.035397 |
| FAM63B |
3.302318 |
4.095168 |
4.669664 |
4.022383 |
| UBXN7 |
3.777425 |
4.331877 |
3.822488 |
3.977263 |
| LOC283299 | 3.47523 |
3.682908 |
4.577248 |
3.911797 |
| ARHGAP11B |
4.835126 |
3.582381 |
3.198737 | 3.87208 |
| BCAT1 | 4.92309 |
3.413721 |
3.162697 | 3.83317 |
| IGF2BP2 | 3.48637 |
4.974384 |
3.016948 | 3.8259 |
| IFIT3 | 3.33571 |
3.670937 |
4.105221 |
3.703957 |
| IFIT2 |
4.388168 |
3.335629 |
3.319752 |
3.681183 |
| GALNT4 |
4.730731 |
3.012215 |
3.124736 | 3.62256 |
| ATP13A3 | 3.28667 |
4.347695 |
3.224075 | 3.61948 |
| TRIO |
3.506362 |
3.683108 | 3.63553 |
3.608333 |
| KIAA0895 |
3.323227 | 3.2336 | 4.08545 |
3.547427 |
| PTPLB |
3.033159 | 4.04489 |
3.517358 |
3.531803 |
| WDR31 |
3.503799 |
3.477879 |
3.509077 |
3.496917 |
| ASPHD1 |
3.438704 |
3.304396 |
3.282801 |
3.341967 |
| FLJ34208 |
3.612733 |
3.230395 |
3.124736 |
3.322622 |
| IL1B |
3.113062 | 3.39834 |
3.179301 |
3.230234 |
| PRAC | −13.4151 | −13.6146 | −12.5618 | −13.1972 |
| EDN3 | −7.12592 | −15.8836 | −11.4601 | −11.4899 |
| FABP12 | −11.8695 | −10.8052 | −10.1364 | −10.937 |
| LOC644759 | −12.1577 | −10.3962 | −10.1672 | −10.907 |
| KLK12 | −9.45888 | −9.66283 | −12.3341 | −10.4853 |
| SOSTDC1 | −5.56369 | −13.3193 | −11.2345 | −10.0392 |
| PROK1 | −6.99645 | −8.77908 | −13.103 | −9.62617 |
| NCRNA00160 | −10.4406 | −9.28356 | −8.65661 | −9.46027 |
| HS3ST6 | −4.58141 | −14.2018 | −9.36341 | −9.3822 |
| LOC642366 | −9.06419 | −9.70611 | −8.97064 | −9.24697 |
| KLK5 | −6.72497 | −6.72175 | −14.0832 | −9.17663 |
| LGI3 | −9.66722 | −12.6499 | −4.90455 | −9.07387 |
| C18orf26 | −11.4915 | −8.05915 | −7.5957 | −9.0488 |
| KLK6 | −10.1991 | −6.49943 | −10.1097 | −8.93607 |
| FTLP10 | −9.17158 | −9.63008 | −7.80673 | −8.86947 |
| KRT13 | −7.04312 | −9.72684 | −9.80361 | −8.85787 |
| SDR9C7 | −8.99263 | −5.71915 | −11.7824 | −8.8314 |
| KLK13 | −7.35941 | −9.8484 | −8.89013 | −8.6993 |
| CYP4F22 | −7.35608 | −9.07243 | −9.50559 | −8.6447 |
| CWH43 | −8.37808 | −4.96987 | −12.2752 | −8.54107 |
| UPK1A | −8.75809 | −11.6327 | −5.03608 | −8.47563 |
| SPRR2C | −9.5305 | −6.16292 | −9.61626 | −8.43657 |
| ISL1 | −6.24758 | −11.9118 | −6.85564 | −8.33833 |
| CRNN | −9.03239 | −10.5285 | −5.43238 | −8.3311 |
| TMPRSS11BNL | −12.7646 | −7.64689 | −4.48074 | −8.29743 |
| SPRR3 | −9.08119 | −9.16385 | −6.62833 | −8.29113 |
| MUC21 | −7.66328 | −9.01786 | −7.95629 | −8.21247 |
| SFTA2 | −6.72934 | −6.03851 | −11.348 | −8.0386 |
| KRTDAP | −10.8126 | −9.41425 | −3.83469 | −8.0205 |
| HOXB13-AS1 | −9.26181 | −10.8682 | −3.93055 | −8.0202 |
| SPINK5 | −7.0192 | −8.64938 | −8.34653 | −8.00503 |
| ARSF | −12.2472 | −3.60249 | −8.14556 | −7.99843 |
| KRT4 | −6.28401 | −9.91166 | −7.48655 | −7.89407 |
| MAL | −9.13047 | −9.3469 | −5.19779 | −7.89173 |
| SPINK7 | −9.40574 | −9.496 | −4.58648 | −7.8294 |
| KLK11 | −5.43434 | −9.29366 | −8.63959 | −7.7892 |
| LOC144817 | −3.11972 | −10.3462 | −9.80503 | −7.757 |
| SPRR1B | −8.95135 | −5.98911 | −7.93974 | −7.62673 |
| SBSN | −8.96791 | −9.33194 | −4.57612 | −7.62533 |
| CLCA4 | −5.66679 | −5.92101 | −11.1121 | −7.56663 |
| TMPRSS11A | −5.85846 | −5.25567 | −11.315 | −7.4764 |
| TMPRSS11B | −8.1584 | −9.30062 | −4.81077 | −7.42327 |
| PRSS3 | −8.39642 | −8.84527 | −4.99691 | −7.41287 |
| PBMUCL1 | −8.68117 | −6.30909 | −7.22153 | −7.40393 |
| FADS6 | −7.76112 | −5.07643 | −9.35563 | −7.39773 |
| KLK9 | −8.21271 | −3.01753 | −10.9561 | −7.39543 |
| LRRTM4 | −6.356 | −7.06931 | −8.7054 | −7.3769 |
| ALOX12B | −9.21357 | −8.75139 | −4.12319 | −7.36273 |
| RHCG | −8.60154 | −4.29579 | −8.9801 | −7.29247 |
| RDH12 | −8.76324 | −7.91437 | −5.01249 | −7.23003 |
| TMPRSS11D | −5.68278 | −5.64144 | −10.3586 | −7.2276 |
| KLK10 | −4.85195 | −7.938 | −8.84348 | −7.21113 |
| DUOXA2 | −6.6414 | −7.13884 | −7.7198 | −7.16667 |
| KRT16P1 | −8.39166 | −6.41271 | −6.65457 | −7.15297 |
| WFDC5 | −5.94473 | −3.59185 | −11.6523 | −7.06297 |
| TMPRSS11F | −5.56643 | −4.27303 | −11.237 | −7.0255 |
| KRT78 | −8.71162 | −9.09812 | −3.24017 | −7.01663 |
| CYP2C18 | −5.67597 | −9.10234 | −6.21065 | −6.99633 |
| ENDOU | −8.373 | −6.00788 | −6.5908 | −6.99057 |
| TMPRSS11E | −7.36594 | −4.83162 | −8.75233 | −6.9833 |
| KLK8 | −5.28042 | −7.14018 | −8.49714 | −6.97257 |
| SLURP1 | −7.64971 | −9.05043 | −4.11415 | −6.9381 |
| HOXB13 | −11.8912 | −3.76729 | −5.14309 | −6.93387 |
| NR0B1 | −3.16863 | −8.78707 | −8.8382 | −6.9313 |
| DSG1 | −7.27882 | −9.56852 | −3.70815 | −6.85183 |
| OLFM4 | −4.41224 | −4.86631 | −11.2427 | −6.84043 |
| ASPG | −9.35845 | −5.80053 | −5.34926 | −6.83607 |
| SPRR2F | −11.0558 | −5.91653 | −3.44512 | −6.8058 |
| HCG22 | −6.72322 | −9.14481 | −4.41865 | −6.76223 |
| KRT16P3 | −6.29516 | −6.68591 | −7.20534 | −6.7288 |
| CPA6 | −4.97598 | −3.57612 | −11.5417 | −6.69793 |
| KRT6C | −7.20141 | −6.9751 | −5.85838 | −6.6783 |
| SCEL | −7.31534 | −4.10998 | −8.50819 | −6.6445 |
| CRHR1 | −4.20425 | −8.6737 | −6.95224 | −6.61007 |
| KLK7 | −4.16482 | −7.54068 | −8.07971 | −6.59507 |
| FABP4 | −3.60159 | −10.8444 | −5.24657 | −6.5642 |
| C18orf34 | −3.43166 | −8.03628 | −7.85036 | −6.43943 |
| IVL | −9.68789 | −3.53827 | −6.07053 | −6.43223 |
| SPRR2A | −8.33607 | −6.76353 | −4.16411 | −6.42123 |
| GJB6 | −5.78401 | −4.68417 | −8.7729 | −6.4137 |
| SPRR1A | −8.69142 | −5.35853 | −5.18329 | −6.41107 |
| CEACAM7 | −3.8467 | −6.03077 | −9.32939 | −6.4023 |
| PPP1R3C | −6.54484 | −9.23918 | −3.33717 | −6.37373 |
| C2orf54 | −8.04377 | −5.14492 | −5.76023 | −6.3163 |
| CCL14 | −3.97598 | −11.2998 | −3.62144 | −6.29907 |
| PRSS27 | −8.34943 | −4.60582 | −5.83476 | −6.26333 |
| FUT6 | −4.6948 | −6.47518 | −7.48074 | −6.2169 |
| LRP1B | −4.69219 | −8.09952 | −5.84579 | −6.2125 |
| KCNK10 | −4.25851 | −6.50135 | −7.80251 | −6.18747 |
| WISP2 | −5.54635 | −6.65683 | −6.06 | −6.08773 |
| SPRR2D | −8.64649 | −6.06525 | −3.46049 | −6.0574 |
| CYP2B7P1 | −4.29557 | −6.36724 | −7.48514 | −6.0493 |
| CLDN8 | −3.1579 | −5.95613 | −8.77604 | −5.96337 |
| GDF6 | −4.05615 | −7.32225 | −6.49891 | −5.9591 |
| TMEM45B | −5.61223 | −5.92896 | −6.3174 | −5.95287 |
| NEFL | −4.20425 | −3.92442 | −9.62952 | −5.9194 |
| DAPL1 | −5.71856 | −4.88481 | −7.14556 | −5.9163 |
| FAM3D | −5.63608 | −4.61094 | −7.45818 | −5.90173 |
| C10orf99 | −5.66475 | −3.59184 | −8.361 | −5.87253 |
| ATP13A4 | −4.13757 | −6.36183 | −7.11188 | −5.87043 |
| PSCA | −8.80031 | −5.31464 | −3.37421 | −5.82973 |
| GSTM5 | −4.86629 | −7.56056 | −4.82363 | −5.75017 |
| CRYM | −4.82557 | −7.89036 | −4.42697 | −5.7143 |
| ALOX12 | −6.72993 | −7.05622 | −3.27911 | −5.68843 |
| LYPD2 | −5.20351 | −6.50013 | −5.28866 | −5.6641 |
| DEGS2 | −3.47443 | −6.45172 | −6.87474 | −5.6003 |
| TP53AIP1 | −4.83451 | −6.02192 | −5.90829 | −5.58823 |
| APOD | −4.46756 | −8.75006 | −3.50099 | −5.57287 |
| PLA2G4F | −5.6344 | −3.88007 | −7.0168 | −5.51043 |
| TMEM132C | −3.09463 | −10.0647 | −3.37112 | −5.51017 |
| GJB2 | −6.73282 | −3.11385 | −6.60454 | −5.48373 |
| PTGDS | −5.8487 | −6.56155 | −4.02011 | −5.4768 |
| NCCRP1 | −6.9491 | −3.38815 | −6.05232 | −5.4632 |
| KRT16P2 | −4.82398 | −5.03598 | −6.48074 | −5.4469 |
| DUOX2 | −3.89572 | −4.21314 | −8.14256 | −5.41713 |
| LOC283392 | −3.65906 | −4.6075 | −7.9533 | −5.40663 |
| C21orf15 | −4.96246 | −7.22455 | −4.03008 | −5.4057 |
| HOPX | −4.52883 | −6.72314 | −4.68297 | −5.31163 |
| C7 | −4.26858 | −5.33946 | −6.24421 | −5.28407 |
| FXYD1 | −4.38736 | −8.16219 | −3.10047 | −5.21667 |
| VSIG10L | −5.64524 | −6.67538 | −3.28431 | −5.20163 |
| CXCL14 | −4.06317 | −4.69872 | −6.79264 | −5.18483 |
| C1orf177 | −7.12468 | −4.89746 | −3.40118 | −5.1411 |
| PGLYRP3 | −4.2413 | −5.30136 | −5.87213 | −5.13827 |
| NDRG4 | −3.11573 | −6.16805 | −6.10851 | −5.13077 |
| SH3GL2 | −3.43166 | −7.88472 | −4.03008 | −5.1155 |
| D4S234E | −6.32648 | −5.24772 | −3.58727 | −5.05383 |
| HSPB6 | −4.66679 | −6.44156 | −3.92896 | −5.01243 |
| KRT32 | −4.88012 | −4.74755 | −5.40859 | −5.0121 |
| C15orf59 | −3.52682 | −5.00472 | −6.41321 | −4.98157 |
| ECM1 | −5.89039 | −4.95876 | −3.74402 | −4.8644 |
| PKNOX2 | −3.80089 | −7.16728 | −3.44512 | −4.80443 |
| SLC22A3 | −5.01115 | −5.30293 | −4.01922 | −4.77777 |
| SCN2B | −3.37919 | −6.85042 | −3.98117 | −4.73693 |
| BNIPL | −3.30443 | −4.13255 | −6.42697 | −4.62133 |
| S100A12 | −5.68204 | −3.48731 | −4.64434 | −4.60457 |
| TPRG1 | −5.48765 | −5.09685 | −3.17304 | −4.58583 |
| F10 | −4.46875 | −5.39257 | −3.72098 | −4.52743 |
| KRT14 | −5.32 | −3.2456 | −5.00968 | −4.5251 |
| PGLYRP4 | −5.26736 | −3.75249 | −4.48259 | −4.5008 |
| CYP2F1 | −5.58817 | −3.60249 | −4.21065 | −4.4671 |
| SCARA5 | −3.8261 | −6.19246 | −3.34042 | −4.453 |
| DNASE1L3 | −4.77494 | −3.71102 | −4.65301 | −4.37967 |
| CD300LG | −5.09807 | −3.14682 | −4.72805 | −4.3243 |
| FABP5 | −3.59716 | −3.02627 | −6.02887 | −4.21743 |
| CORIN | −3.67113 | −5.92442 | −3.04919 | −4.2149 |
| TGM5 | −4.13436 | −3.93665 | −4.13218 | −4.06773 |
| TMPRSS2 | −3.3997 | −3.8615 | −4.73918 | −4.00013 |
| SCN4B | −3.0682 | −4.22699 | −4.44512 | −3.91343 |
| ANXA9 | −3.47853 | −3.71392 | −4.52455 | −3.90567 |
| NEFM | −4.29673 | −3.47696 | −3.66751 | −3.81373 |
| CD1E | −3.4358 | −3.40555 | −3.64926 | −3.49687 |
Validation of significant DEGs
To validate the transcriptome analysis data, RT-qPCR
was performed on cancer and normal tissue samples to examine the
mRNA expression levels for several DEGs identified in the present
study. First, established oncogenes and tumor suppressor genes in
other types of cancers were examined; gastrulation brain homeobox 2
(GBX2), mucin 16 (MUC16), C-C motif chemokine ligand 1 (CCL1),
5-hydroxytryptamine receptor 1D (HTR1D) and oligodendrocyte
transcription factor 2 (OLIG2) are putative oncogene candidates,
while PRAC1 small nuclear protein (PRAC), endothelin 3 (EDN3),
sclerostin domain containing 1 (SOSTDC1), kallikrein related
peptidase (KLK) 12, KLK5, KLK6 and KLK13 are putative tumor
suppressors. The mRNA expression levels for these genes were
validated in the 27 pairs of cervical squamous cancer samples and
matched normal tissue samples. As demonstrated in Fig. 2, expression of GBX2, MUC16, CCL1
and HTR1D was significantly upregulated in cancer samples compared
with normal tissues, while expression of PRAC, EDN3, SOSTDC1,
KLK12, KLK5, KLK6 and KLK13 was significantly downregulated in
cancer samples compared with normal tissues. However, no
significance change in expression of OLIG2 was observed in the 27
pairs of samples analysed. OLIG2 is a basic helix-loop-helix
transcription factor expressed in the developing central nervous
system (CNS) and the postnatal brain (16). OLIG2 is highly expressed in
glioblastoma cells, and in glioblastoma initiating cells in
particular (16), while expression
of OLIG2 is barely detected in other types of cancer.
Tissue-specific expression of OLIG2 in the CNS may explain why no
significant change in OLIG2 expression was observed in cervical
cancer samples.
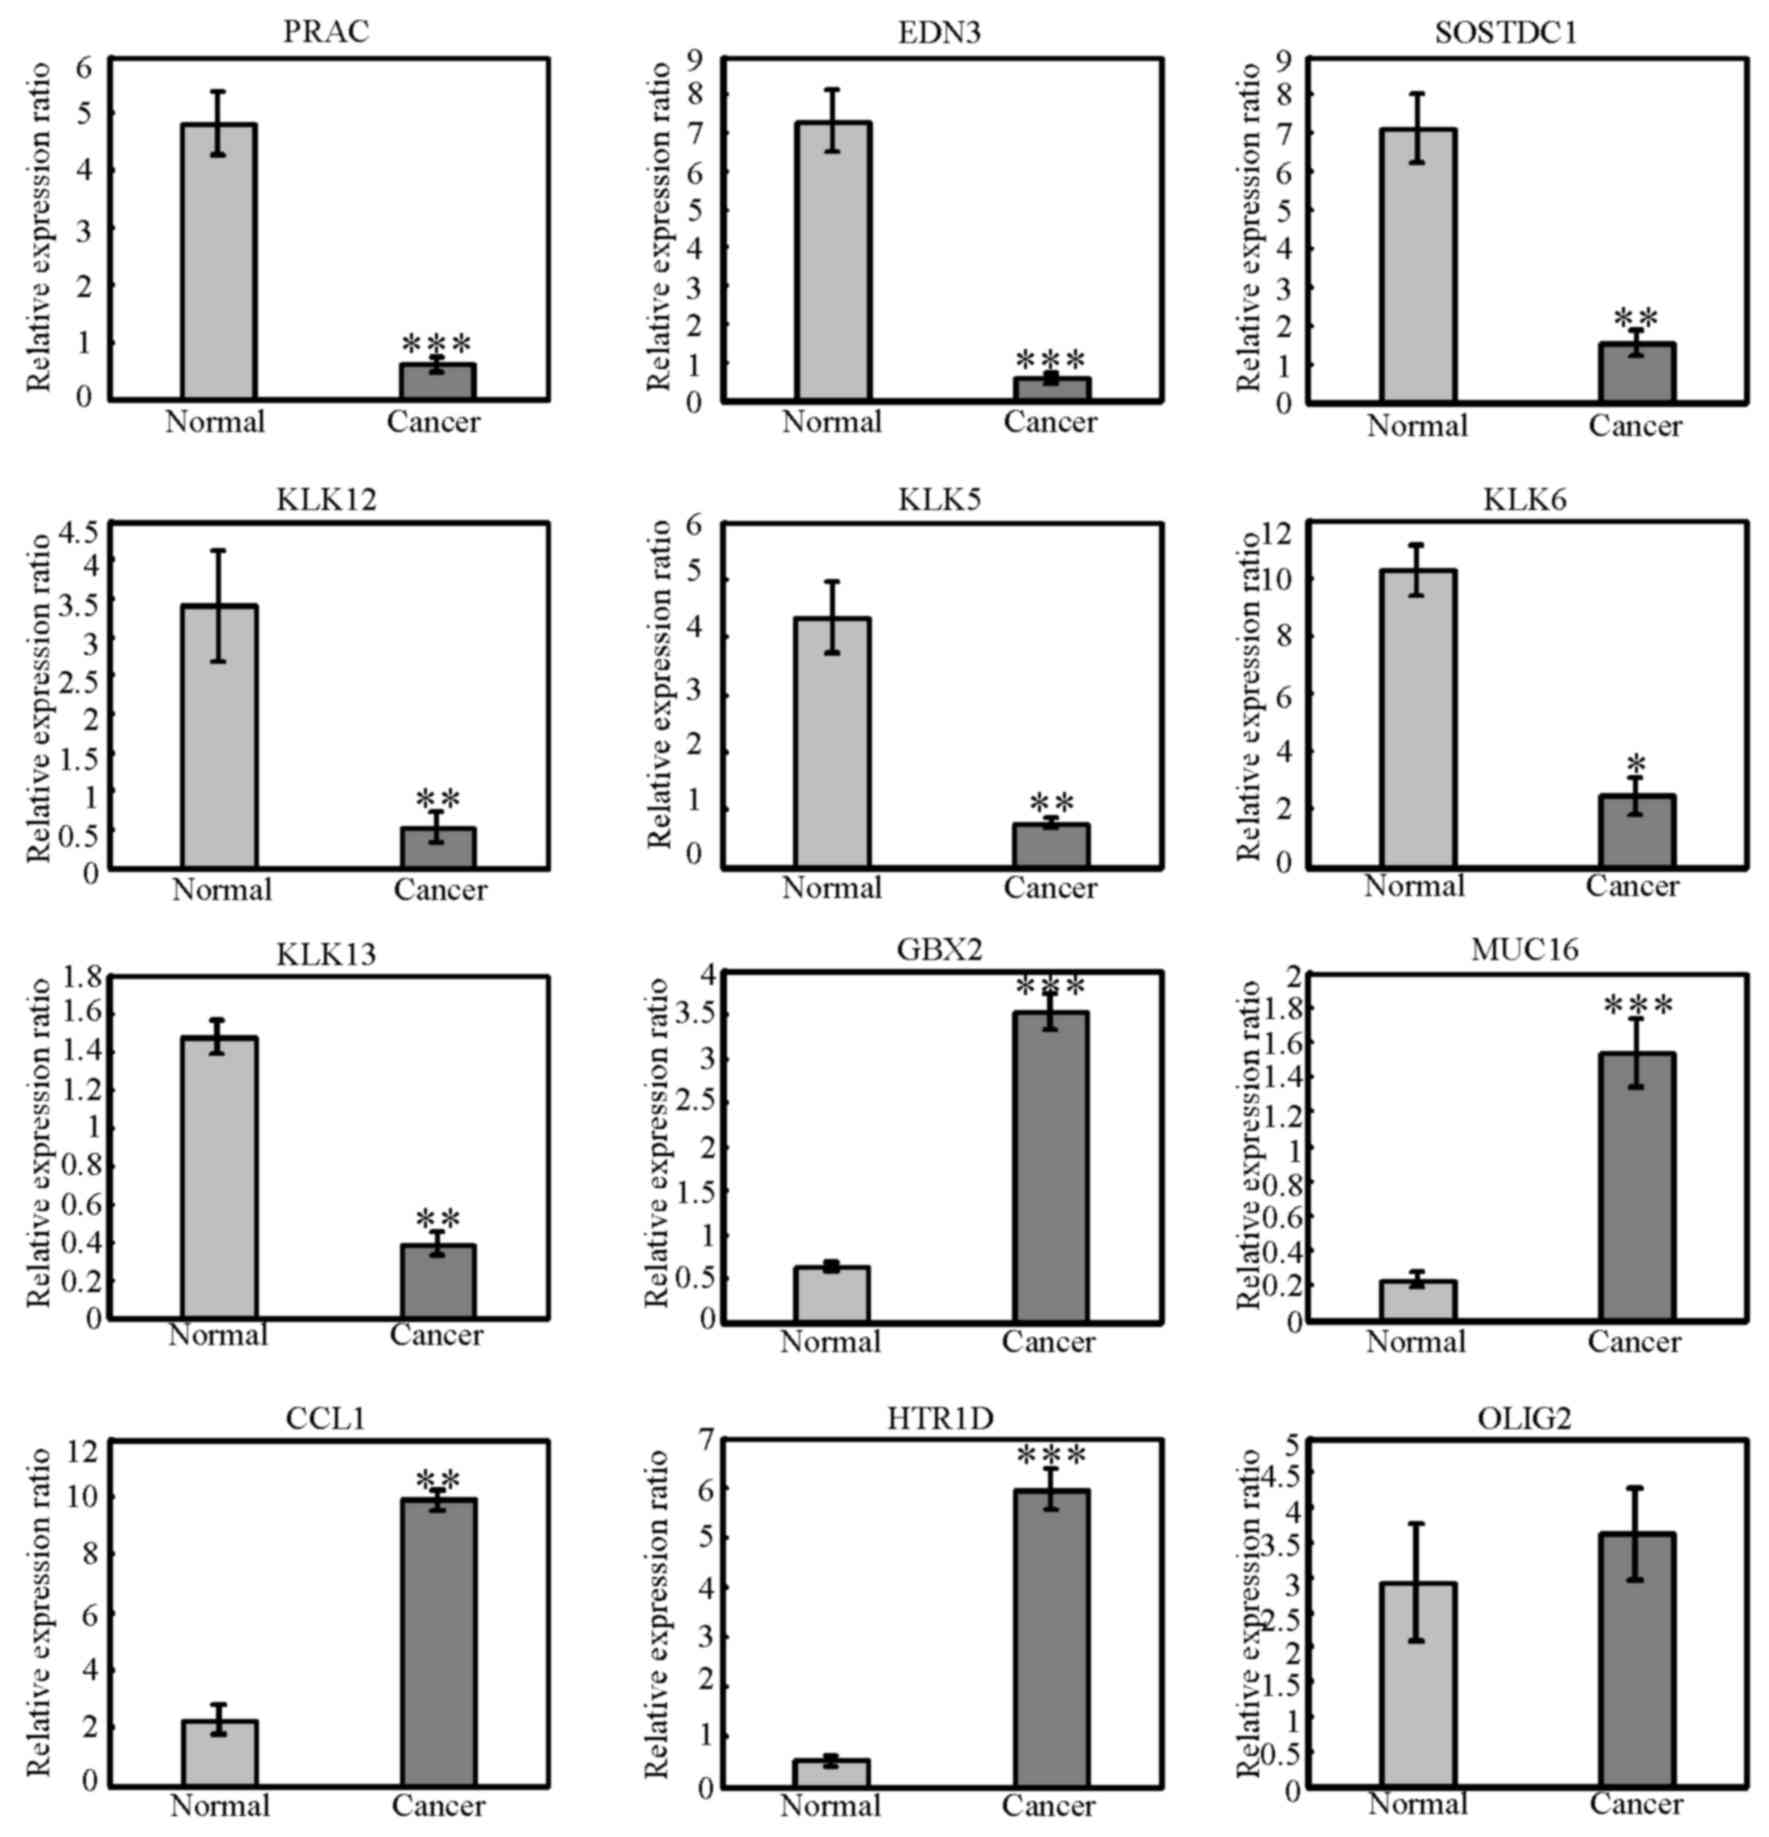 | Figure 2.Validation of differentially
expressed genes. The mRNA expression levels of PRAC, EDN3, SOSTDC1,
KLK12, KLK13, KLK5, KLK6, OLIG2, GBX2, MUC16, CCL1 and HTR1D were
examined by reverse transcription-quantitative polymerase chain
reaction in the 27 pairs of cancer and matched normal samples.
*P<0.05, **P<0.01 and ***P<0.001 vs. normal. PRAC, PRAC1
small nuclear protein; EDN3, endothelin 3; SOSTDC1, sclerostin
domain containing 1; KLK, kallikrein related peptidase; GBX2,
gastrulation brain homeobox 2; MUC16, mucin 16; CCL1, C-C motif
chemokine ligand 1; HTR1D, 5-hydroxytryptamine receptor 1D; OLIG2,
oligodendrocyte transcription factor 2. |
Functional enrichment analysis of
DEGs
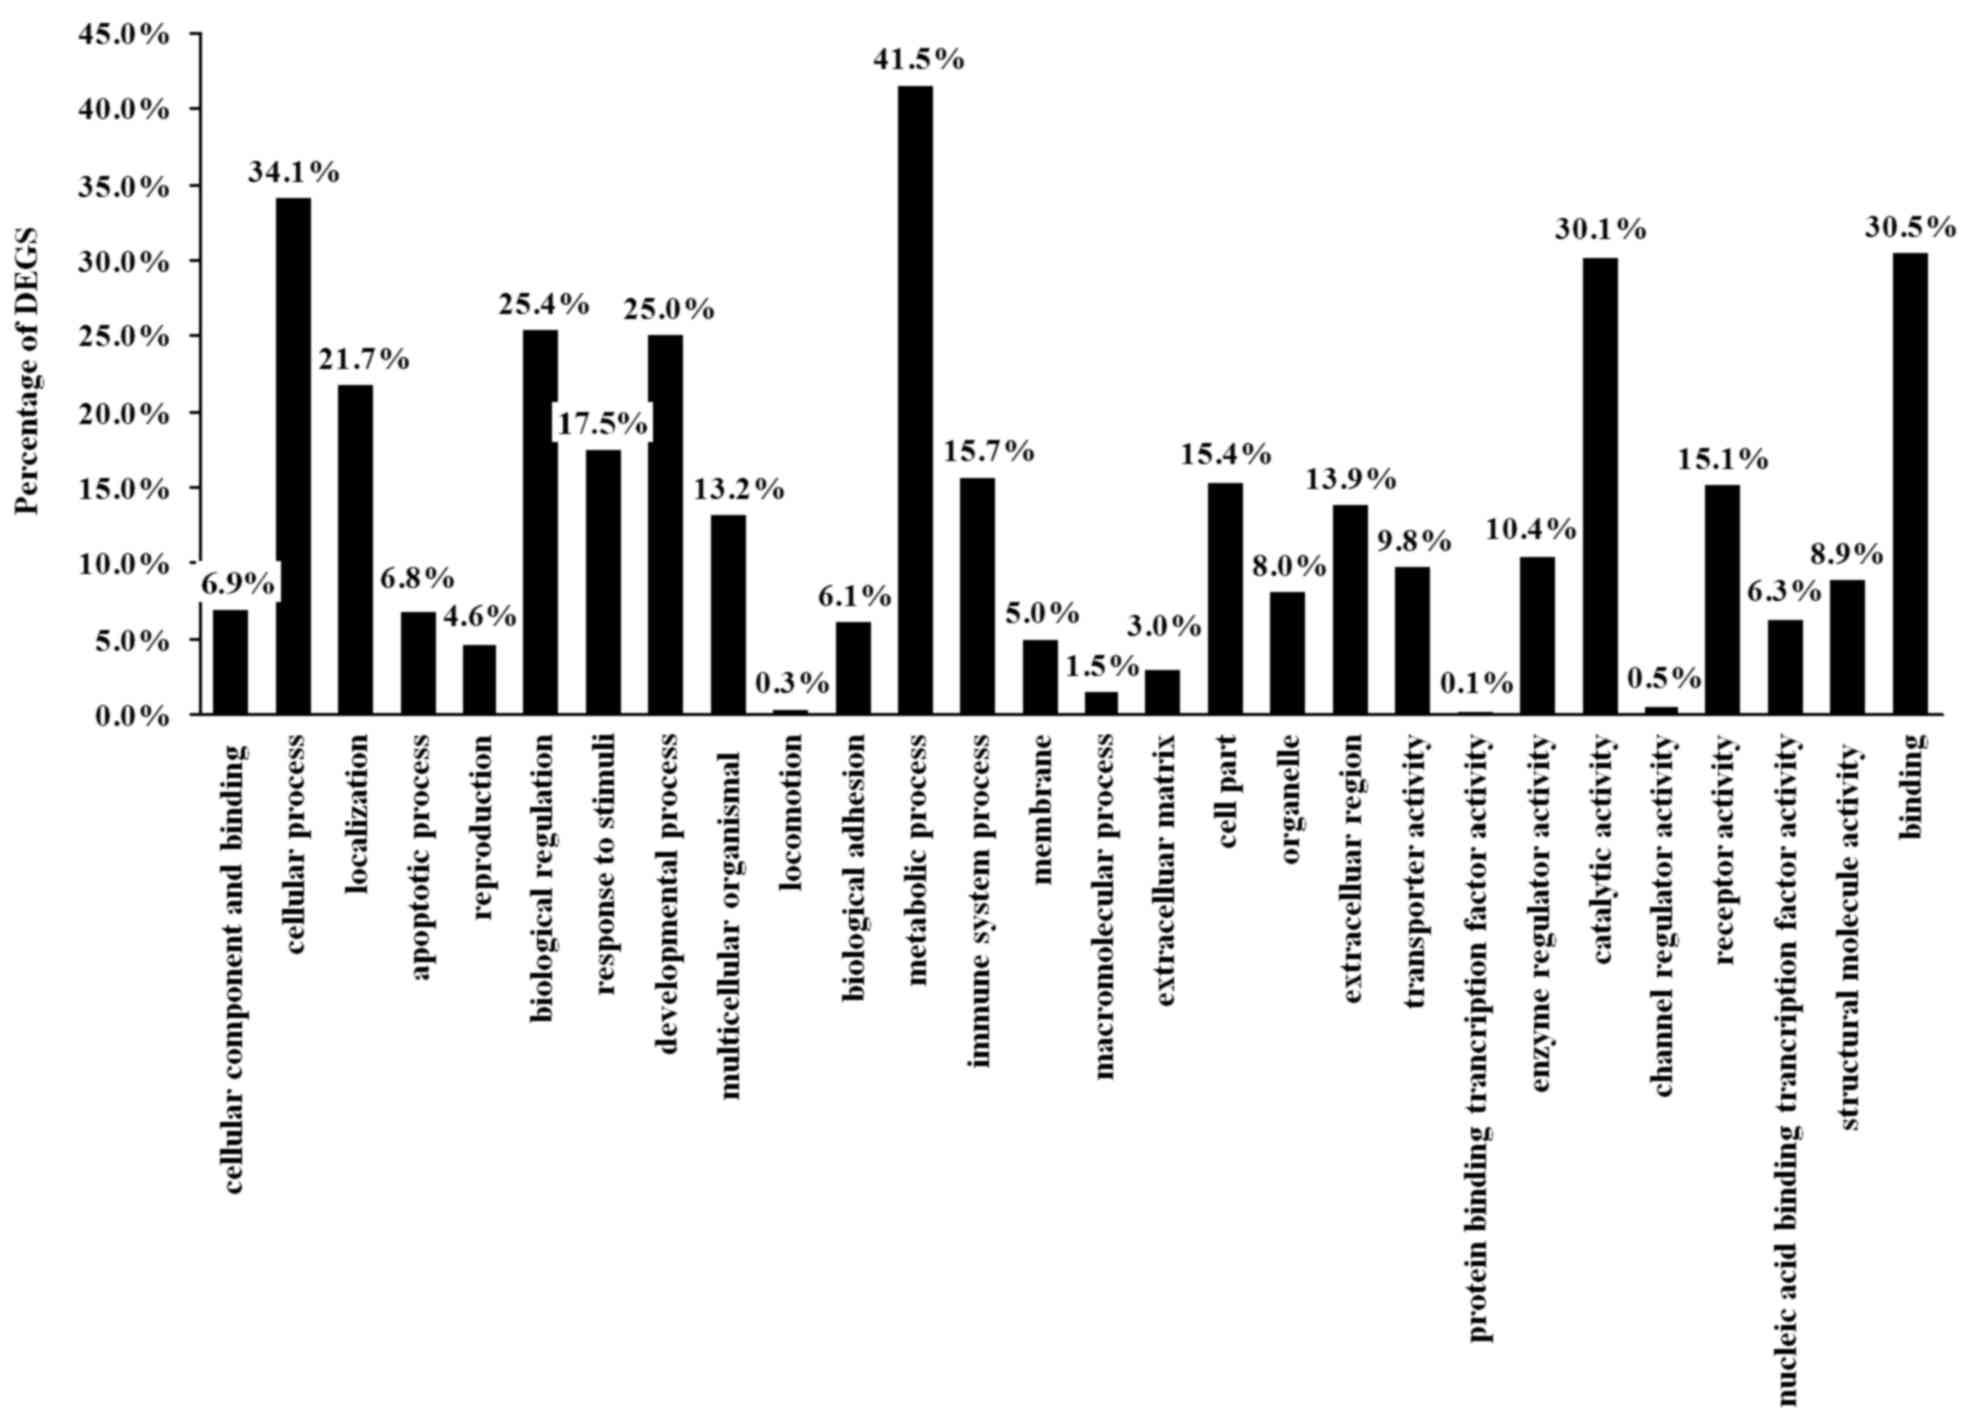
Next, GO analysis of DEGs was performed to obtain a
more comprehensive understanding of gene-related biological
functions. All DEGs were divided into three major categories based
on GO annotations: Biological processes, cellular components and
molecular functions. The present study identified that the 236 DEGS
were classified into 28 functional categories (Table III); 13 in biological processes,
9 in molecular functions and 6 in cellular components including
reproduction, cellular processes and metabolic processes
(P<0.05; Fig. 3).
| Table III.Detailed list of significant DEGs by
functional categories from GO analysis. |
Table III.
Detailed list of significant DEGs by
functional categories from GO analysis.
| Functional
category | Significant
DEGs |
|---|
| Binding
(GO:0005488) | EDN3, CXCL5, GBX2,
LRRTM4, TMPRSS11D, WFDC5, NR0B1, VWA3B, CELSR3, INHBA, ONECUT2,
OLIG2, PROK1, TMPRSS11B, KLK10, KLK7, PTGDS, F10, IL1β, CCL1, ISL1,
SPINK5, GDF6, FOXD3, CRNN, KLK11, TMPRSS11A, KLK9, TMPRSS11F,
TMPRSS11E, HOXB13, CCL14, S100A12, IGF2BP2, IL24, CCL18, KLK12,
KLK5, BNIPL, TMPRSS2, TNNI3, ESM1, FOXD1, CAMP, SPINK7, PRSS27,
WISP2, PGLYRP3, CNGB1, EN2, UPK1A, KLK8, DSG1, PPP1R3C, DAPL1,
PGLYRP4, CD1E, TRIO, SIM2, GAS2L3, SALL4 |
| Catalytic activity
(GO:0003824) | TMPRSS11D, WFDC5,
VWA3B, OLIG2, TMPRSS11B, KLK10, KLK7, PTGDS, F10, KLK11, TMPRSS11F,
TMPRSS11E, IGF2BP2, KLK12, KLK5, TMPRSS2, CAMP, SPINK7, PRSS27,
KLK8, PPP1R3C, DAPL1, TRIO |
| Enzyme regulator
activity | TMPRSS11D, WFDC5,
VWA3B, OLIG2, TMPRSS11B, KLK10, KLK7, PTGDS, F10, |
| (GO:0030234) | KLK11, TMPRSS11F,
TMPRSS11E, IGF2BP2, KLK12, KLK5, TMPRSS2, CAMP, SPINK7, PRSS27,
KLK8, PPP1R3C, DAPL1, TRIO |
| Nucleic acid
binding transcription factor activity (GO:0001071) | GBX2, NR0B1,
ONECUT2, OLIG2, ISL1, FOXD3, HOXB13, FOXD1, EN2, SIM2, SALL4 |
| Receptor activity
(GO:0004872) | LRRTM4, TMPRSS11D,
NR0B1, CELSR3, TMPRSS11B, KLK10, KLK7, F10, KLK11, TMPRSS11A KLK9,
TMPRSS11F, TMPRSS11E, KLK12, KLK5, TMPRSS2, PRSS27, UPK1A,
KLK8 |
| Structural molecule
activity (GO:0005198) | TNNI3, GAS2L3 |
| Transporter
activity (GO:0005215) | CNGB1 |
| Apoptotic process
(GO:0006915) | TMPRSS11D, INHBA,
TMPRSS11B, GDF6, KLK11, TMPRSS11A, KLK9 TMPRSS11F, TMPRSS11E,
IGF2BP2, PGL, YRP3, DAPL1, PGLYRP4 |
| Biological adhesion
(GO:0022610) | LRRTM4, CELSR3,
WISP2, UPK1A |
| Biological
regulation (GO:0065007) | EDN3, CXCL5, GBX2,
LRRTM4, MPRSS11D, WFDC5, NR0B1, VWA3B |
|
| INHBA, ONECUT2,
OLIG2, TMPRSS11B, KLK10, KLK7, F10, IL1B, ISL1, GDF6, FOXD3, KLK11,
TMPRSS11A, KLK9, TMPRSS11F, TMPRSS11E, HOXB13, IL24, KLK12, KLK5,
TMPRSS2, FOXD1, CAMP SPINK7, PRSS27, WISP2, CNGB1, EN2, KLK8,
PPP1R3C, DAPL1, TRIO, SIM2, SALL4 |
| Cellular component
organization or biogenesis (GO:0071840) | CELSR3 |
| Cellular process
(GO:0009987) | EDN3, CXCL5,
LRRTM4, CELSR3, INHBA, ONECUT2, PTGDS, IL1B CCL1, GDF6, FOXD3,
CRNN, CCL14, S100A12, IGF2BP2, IL24, CCL18, BNIPL, FOXD1, WISP2,
CNGB1, UPK1A, DSG1, DAPL1, TRIO, GAS2L3 |
| Developmental
process (GO:0032502) | GBX2, LRRTM4,
TMPRSS11D, NR0B1, CELSR3, INHBA, ONECUT2, OLIG2, PROK1, TMPRSS11B,
ISL1, GDF6, KLK11, TMPRSS11A, KLK9, TMPRSS11F, TMPRSS11E, HOXB13,
IGF2BP2, BNIPL, TMPRSS2, TNNI3, WISP2, PGL, YRP3, EN2, DAPL1,
PGLYRP4, SIM2, GAS2L3 |
| Immune system
process (GO:0002376) | CXCL5, TMPRSS11D,
TMPRSS11B, KLK10, KLK7, PTGDS, F10, KLK11, TMPRSS11A, KLK9,
TMPRSS11F, TMPRSS11E, IGF2BP2, KLK12, KLK5, TMPRSS2, PRSS27, CNGB1,
KLK8 |
| Localization
(GO:0051179) | CXCL5, TMPRSS11D,
TMPRSS11B, KLK10, KLK7, PTGDS, F10, KLK11, TMPRSS11A, KLK9,
TMPRSS11F, TMPRSS11E, IGF2BP2, KLK12, KLK5, TMPRSS2, PRSS27, CNGB1,
KLK8 |
| Locomotion
(GO:0040011) | CXCL5 |
| metabolic process
(GO:0008152) | GBX2, TMPRSS11D,
WFDC5, NR0B1, VWA3B INHBA, ONECUT2, OLIG2, TMPRSS11B, KLK10, KLK7,
PTGDS, F10, ISL1, GDF6, FOXD3 CRNN, KLK11, TMPRSS11A, KLK9,
TMPRSS11F, TMPRSS11E, HOXB13, S100A12, IGF2BP2, KLK12, KLK5,
TMPRSS2, FOXD1, CAMP, SPINK7 PRSS27, PGLYRP3, EN2, KLK8, PPP1R3C,
DAPL1 PGLYRP4, TRIO, SIM2. SALL4 |
| Multicellular
organismal process (GO:0032501) | TMPRSS11D, ONECUT2,
PROK1, TMPRSS11B, KLK11, TMPRSS11A, KLK9, TMPRSS11F, TMPRSS11E,
HOXB13, IGF2BP2, TMPRSS2, TNNI3, UPK1A, TRIO |
| Reproduction
(GO:0000003) | F10, HOXB13,
TMPRSS2, PRSS27, UPK1A |
| Response to
stimulus (GO:0050896) | CXCL5, TMPRSS11D,
INHBA, TMPRSS11B, KLK10, KLK7, F10, IL1β, CCL1, GDF6, KLK11,
TMPRSS11A, KLK9, TMPRSS11F, TMPRSS11E, CCL14, S100A12, IL24, CCL18,
KLK12, KLK5, TMPRSS2, CAMP, PRSS27, WISP2, CNGB1, UPK1A, KLK8,
TRIO |
| Cell part
(GO:0044464) | PGLYRP4, TRIO,
SIM2, SALL4 |
| Extracellular
matrix (GO:0031012) | LRRTM4, WISP2 |
| Extracellular
region (GO:0005576) | CXCL5, LRRTM4,
TMPRSS11D, INHBA, TMPRSS11B, KLK10, KLK7, F10, IL1β, GDF6, KLK11,
TMPRSS11A, KLK9, TMPRSS11F, TMPRSS11E, IL24, KLK12, KLK5, TMPRSS2,
PRSS27, WISP2, KLK8 |
| Macromolecular
complex (GO:0032991) | IGF2BP2 |
| Membrane
(GO:0016020) | CNGB1, DSG1,
CD1E |
| Organelle
(GO:0043226) | ONECUT2, FOXD3,
TNNI3, FOXD1 |
Pathway analysis of DEGs
To understand the functional pathways of significant
DEGs, pathway analysis was performed. The 236 significant DEGs (188
with pathway annotation) were involved in numerous key pathways in
cancer, including cytokine-cytokine receptor interactions,
metabolism of xenobiotics by cytochrome P450 and retinol metabolism
(Table IV). A total of 10
significant pathways was detected. The cytokine-cytokine receptor
pathway includes numerous chemokines which can link inflammation to
cancer. Cytochrome P450 members, which have been linked to
carcinogenesis, were also detected. The DEGs involved in these
pathways may serve important roles in cervical cancer.
| Table IV.KEGG pathway analysis of significant
DEGs. |
Table IV.
KEGG pathway analysis of significant
DEGs.
| KEGG pathway | Number of DEGs
involved in pathway | % of total DEGs
involved in pathway | P-value | DEGs |
|---|
| Arachidonic acid
metabolism | 8 | 4.26 |
1.8083×10⁻⁵ | ALOX12, TMEM242,
CYP2B7P, CYP2C18, CYP4F22, PLA2G2F, PLA2G4F, PTGDS |
| Cytokine-cytokine
receptor interaction | 11 | 5.85 | 0.0007 | CCL1, CCL14, CCL18,
CSF2, CXCL14, CXCL5, EGFR, GDF6, IL-1β, IL24, INHBA |
| Staphylococcus
aureus infection | 7 | 3.72 | 0.0008 | DSG1, KRT13, KRT14,
KRT16P1, KRT16P2, KRT16P3, KRT32, |
| Pathogenic
Escherichia coli infection | 9 | 4.79 | 0.0009 | CCDC178, CLDN8,
KRT13, KRT14, KRT16P1, KRT16P2, KRT16P3, KRT32, TUBA3D |
| Rheumatoid
arthritis | 5 | 2.66 | 0.0085 | CCL18, CSF2, CXCL5,
IL-1β, MMP3 |
| Linoleic acid
metabolism | 3 | 1.6 | 0.0137 | CYP2C18, PLA2G2F,
PLA2G4F |
| Metabolism of
xenobiotics by cytochrome P450 | 4 | 2.13 | 0.0139 | CYP2B7P, CYP2C18,
CYP2F1, GSTM5 |
| Retinol
metabolism | 4 | 2.13 | 0.0139 | CYP2B7P, CYP2C18,
RDH12, SDR9C7 |
| PPAR signaling
pathway | 5 | 2.66 | 0.0153 | C1QL1, COL10A1,
FABP12, FABP4, FABP5 |
| Cytosolic
DNA-sensing pathway | 3 | 1.6 | 0.0470 | AIM2, HCG22,
IL-1β |
Discussion
Tumor initiation and progression is a multiple
pathway, complicated process, comprising of various dynamic changes
in the genome. These genetic alternations contribute to the
malignant transformation of cells from normal to cancerous, in
addition to tumor progression and metastasis. Malignant cells can
acquire favorable genotypes through various biological processes;
genetic mutations, epigenetic modifications and non-mutational
regulation of gene expression (17). Therefore, genome instability and
genetic mutation can be regarded as a hallmark of cancer. With the
development of molecular biology and genetics, biologists have
gained an improved view of the landscape of the cancer genome by
utilizing novel methods including high-throughput genome
sequencing. The present study provided a comprehensive
transcriptome analysis of cervical squamous cancer tissue with
matched normal tissues by RNA-Seq. First, a basic analysis of the
sequencing data was performed to detect levels of DEGs. Then,
advanced analysis was conducted to give insights into the
biological functions and pathways that involved the DEGs. Thus, the
present study may aid in discovering novel diagnostic and
therapeutic targets for cervical cancer.
The present RNA-Seq analysis acquired ~290 million
reads, a number which is adequate for transcriptome sequencing.
Furthermore, the genome map rate of sequencing reads was ~85%,
indicating that the sequencing process met the criteria of the
initial quality control for RNA-Seq techniques (18). These data suggested that the
quality of the experimental method and data processing were
sufficient.
The significant DEGs were further analysed to
confirm whether the sequencing results were consistent with
previous research. Matrix metalloproteinase (MMP)3 has been
reported to be upregulated in cervical cancer by microarray
analysis and by immunohistochemistry (19,20).
MMP3 has also been reported to exhibit higher expression and enzyme
activity in breast cancer cells that metastatic to the brain and
during epithelial-to-mesenchymal transition (EMT) (21). The data from the present study
revealed that MMP3 (Table II) was
one of the overexpressed DEGs identified in three different
cervical cancer samples compared with normal tissues, which is
supported by previous studies (19,20).
SIX homeobox 1 (SIX1) protein is a transcription factor regulating
cell proliferation, apoptosis and organogenesis (22) and has been reported to serve an
important role in various human diseases, including cancer. SIX1 is
reported to be overexpressed in breast cancer and to promote EMT
and metastasis through transforming growth factor (TGF)-β signaling
(23). SIX1 also acts as a master
regulator of the cervical cancer initiation progression;
overexpression of SIX1 promotes DNA replication and
anchorage-independent growth of cervical cancer cells (24). Furthermore, high expression of SIX1
in cervical cancers enhances vascular endothelial growth factor C
expression by inhibiting TGF-β signaling, thus promoting
lymphangiogenesis and lymph node metastasis (25). The RNA-Seq data demonstrated that
SIX1 was significantly overexpressed in cervical cancer samples
with an average log2 change 6.478514 [P<0.05; the
reads per kilobase per million mapped reads data of the tumor and
normal samples were compared using the empirical Bayes hierarchical
model (26)]. Taken together, gene
expression patterns in the present study were highly consistent
with previous studies indicating that the RNA-Seq data was
valid.
In the present study, numerous novel DEGs were also
identified in cervical cancer. GBX2 is a homeobox gene that is
overexpressed in prostate cancer (27). Overexpression of GBX2 stimulates
expression of interleukin (IL)-6 at the transcription level,
through binding to an ATTA motif within the promoter of the IL-6
gene, to promote malignant growth of prostate cancer cells
(28). However, the function of
GBX2 in other types of cancers has yet to be studied. The results
of the present study revealed that GBX2 was significantly
upregulated in cervical cancer samples compared with normal
tissues. Further studies are required to illuminate the role of
GBX2 in cervical cancer. HTR1D belongs to the serotonin receptor
family. Knockdown of HTR1D expression in pancreatic cancer cells by
small interfering RNAs inhibits cell proliferation and invasion
(29). In addition, inhibition of
HTR1D suppresses the activity of urokinase plasminogen activator
receptor/MMP-2 signaling and integrin/Src/protein tyrosine kinase
2-mediated signaling, in addition to EMT master regulators zinc
finger E-box-binding homeobox 1 and Snail family transcriptional
repressor 1 (29). EDN signaling
serves an important role in cell differentiation, proliferation and
migration. EDN signaling is also involved in carcinogenesis,
through regulating cell survival and invasiveness (30). Epigenetic activation of EDN-3
through hypermethylation of the EDN3 promoter has been reported in
human colon and breast cancer, indicating that EDN3 is a tumor
suppressor (31,32). SOSTDC1 has been reported to be
downregulated in thyroid cancer cells, breast cancer and in adult
and pediatric renal tumors (33–35).
SOSTDC1 is a critical regulator of extracellular matrix, through
modulating Wnt family member 3A, bone morphogenetic protein (BMP)-2
and BMP-7 signaling in breast cancer cells (34). Serine proteases of the kallikrein
family are implicated in various human diseases, including cancer.
The expression of KLK family members varies in different types of
cancer. Higher expression of KLK13 in breast cancer is associated
with improved prognosis, indicating that KLK13 may be a tumor
suppressor in breast (36). KLK6
is highly expressed in human non-small cell lung cancer and
promotes cell growth and proliferation (37). KLK5 and KLK12 are downregulated in
human breast cancer and higher KLK5 and KLK12 expression are
associated with improved prognosis (38,39).
The data from the present study revealed that GBX2 and HTR1D were
overexpressed in cervical cancer tissues, while EDN3, SOSTDC1,
KLK5, KLK6, KLK12 and KLK13 were downregulated in cervical cancer
tissues, compared with normal tissues. Further functional studies
will need to be performed to elucidate the role of these novel DEGs
in cervical cancer.
In conclusion, the present study provided a
comprehensive transcriptome landscape of cervical cancer and
identified novel DEGs in cervical cancer tissues compared with
matched normal tissues. These novel genes may be useful for
improved understanding of the molecular mechanisms of cervical
cancer pathogenesis and potential identification of novel
biomarkers and therapeutic targets in the future.
Acknowledgements
This work was supported by the Fujian Province
Science and Technology Plan Key Project (grant no. 2013Y0030) and
the National Clinical Key Specialty Construction Program of
China.
References
|
1
|
Global Burden of Disease Cancer
Collaboration, ; Fitzmaurice C, Dicker D, Pain A, Hamavid H,
Moradi-Lakeh M, MacIntyre MF, Allen C, Hansen G, Woodbrook R, et
al: The global burden of cancer 2013. JAMA Oncol. 1:505–527. 2015.
View Article : Google Scholar : PubMed/NCBI
|
|
2
|
Torre LA, Bray F, Siegel RL, Ferlay J,
Lortet-Tieulent J and Jemal A: Global cancer statistics, 2012. CA
Cancer J Clin. 65:87–108. 2015. View Article : Google Scholar : PubMed/NCBI
|
|
3
|
Cogliano V, Baan R, Straif K, Grosse Y,
Secretan B and El Ghissassi F: WHO international agency for
research on cancer: Carcinogenicity of human papillomaviruses.
Lancet Oncol. 6:2042005. View Article : Google Scholar : PubMed/NCBI
|
|
4
|
Arteaga CL and Baselga J: Impact of
genomics on personalized cancer medicine. Clin Cancer Res.
18:612–618. 2012. View Article : Google Scholar : PubMed/NCBI
|
|
5
|
Ozsolak F and Milos PM: RNA sequencing:
Advances, challenges and opportunities. Nat Rev Genet. 12:87–98.
2011. View
Article : Google Scholar : PubMed/NCBI
|
|
6
|
Wang Z, Gerstein M and Snyder M: RNA-Seq:
A revolutionary tool for transcriptomics. Nat Rev Genet. 10:57–63.
2009. View
Article : Google Scholar : PubMed/NCBI
|
|
7
|
Nagalakshmi U, Wang Z, Waern K, Shou C,
Raha D, Gerstein M and Snyder M: The transcriptional landscape of
the yeast genome defined by RNA sequencing. Science. 320:1344–1349.
2008. View Article : Google Scholar : PubMed/NCBI
|
|
8
|
Sultan M, Schulz MH, Richard H, Magen A,
Klingenhoff A, Scherf M, Seifert M, Borodina T, Soldatov A,
Parkhomchuk D, et al: A global view of gene activity and
alternative splicing by deep sequencing of the human transcriptome.
Science. 321:956–960. 2008. View Article : Google Scholar : PubMed/NCBI
|
|
9
|
Stephens PJ, Tarpey PS, Davies H, van Loo
P, Greenman C, Wedge DC, Nik-Zainal S, Martin S, Varela I, Bignell
GR, et al: The landscape of cancer genes and mutational processes
in breast cancer. Nature. 486:400–404. 2012.PubMed/NCBI
|
|
10
|
Wu Y, Wang X, Wu F, Huang R, Xue F, Liang
G, Tao M, Cai P and Huang Y: Transcriptome profiling of the cancer,
adjacent non-tumor and distant normal tissues from a colorectal
cancer patient by deep sequencing. PLoS One. 7:e410012012.
View Article : Google Scholar : PubMed/NCBI
|
|
11
|
Livak KJ and Schmittgen TD: Analysis of
relative gene expression data using real-time quantitative PCR and
the 2(−Delta Delta C(T)) method. Methods. 25:402–408. 2001.
View Article : Google Scholar : PubMed/NCBI
|
|
12
|
Lv L, Jin Y, Zhou Y, Jin J, Ma Z and Ren
Z: Deep sequencing of transcriptome profiling of GSTM2 knock-down
in swine testis cells. Sci Rep. 6:382542016. View Article : Google Scholar : PubMed/NCBI
|
|
13
|
Audic S and Claverie JM: The significance
of digital gene expression profiles. Genome Res. 7:986–995. 1997.
View Article : Google Scholar : PubMed/NCBI
|
|
14
|
Benjamini Y and Yekutieli D: The control
of the false discovery rate in multiple testing under dependency.
Ann Statist. 29:1165–1188. 2001.
|
|
15
|
Abdi H: ‘Bonferroni and Sidak corrections
for multiple comparisons’. Encyclopedia of Measurement and
Statistics Thousand Oaks, CA: Sage; 2007
|
|
16
|
Meijer DH, Kane MF, Mehta S, Liu H,
Harrington E, Taylor CM, Stiles CD and Rowitch DH: Separated at
birth? The functional and molecular divergence of OLIG1 and OLIG2.
Nat Rev Neurosci. 13:819–831. 2012. View Article : Google Scholar : PubMed/NCBI
|
|
17
|
Hanahan D and Weinberg RA: Hallmarks of
cancer: The next generation. Cell. 144:646–674. 2011. View Article : Google Scholar : PubMed/NCBI
|
|
18
|
Conesa A, Madrigal P, Tarazona S,
Gomez-Cabrero D, Cervera A, McPherson A, Szcześniak MW, Gaffney DJ,
Elo LL, Zhang X and Mortazavi A: A survey of best practices for
RNA-seq data analysis. Genome Biol. 17:1812016. View Article : Google Scholar : PubMed/NCBI
|
|
19
|
Rajkumar T, Sabitha K, Vijayalakshmi N,
Shirley S, Bose MV, Gopal G and Selvaluxmy G: Identification and
validation of genes involved in cervical tumourigenesis. BMC
Cancer. 11:802011. View Article : Google Scholar : PubMed/NCBI
|
|
20
|
Hagemann T, Bozanovic T, Hooper S, Ljubic
A, Slettenaar VI, Wilson JL, Singh N, Gayther SA, Shepherd JH and
Van Trappen PO: Molecular profiling of cervical cancer progression.
Br J Cancer. 96:321–328. 2007. View Article : Google Scholar : PubMed/NCBI
|
|
21
|
Radisky DC, Levy DD, Littlepage LE, Liu H,
Nelson CM, Fata JE, Leake D, Godden EL, Albertson DG, Nieto MA, et
al: Rac1b and reactive oxygen species mediate MMP-3-induced EMT and
genomic instability. Nature. 436:123–127. 2005. View Article : Google Scholar : PubMed/NCBI
|
|
22
|
Wu W, Ren Z, Li P, Yu D, Chen J, Huang R
and Liu H: Six1: A critical transcription factor in tumorigenesis.
Int J Cancer. 136:1245–1253. 2015. View Article : Google Scholar : PubMed/NCBI
|
|
23
|
Micalizzi DS, Christensen KL, Jedlicka P,
Coletta RD, Barón AE, Harrell JC, Horwitz KB, Billheimer D,
Heichman KA, Welm AL, et al: The Six1 homeoprotein induces human
mammary carcinoma cells to undergo epithelial-mesenchymal
transition and metastasis in mice through increasing TGF-beta
signaling. J Clin Invest. 119:2678–2690. 2009. View Article : Google Scholar : PubMed/NCBI
|
|
24
|
Liu D, Zhang XX, Xi BX, Wan DY, Li L, Zhou
J, Wang W, Ma D, Wang H and Gao QL: Sine oculis homeobox homolog 1
promotes DNA replication and cell proliferation in cervical cancer.
Int J Oncol. 45:1232–1240. 2014.PubMed/NCBI
|
|
25
|
Liu D, Li L, Zhang XX, Wan DY, Xi BX, Hu
Z, Ding WC, Zhu D, Wang XL, Wang W, et al: SIX1 promotes tumor
lymphangiogenesis by coordinating TGFβ signals that increase
expression of VEGF-C. Cancer Res. 74:5597–5607. 2014. View Article : Google Scholar : PubMed/NCBI
|
|
26
|
Leng N, Dawson JA, Thomson JA, Ruotti V,
Rissman AI, Smits BM, Haag JD, Gould MN, Stewart RM and Kendziorski
C: EBSeq: An empirical Bayes hierarchical model for inference in
RNA-seq experiments. Bioinformatics. 29:1035–1043. 2013. View Article : Google Scholar : PubMed/NCBI
|
|
27
|
Gao AC and Isaacs JT: Expression of
homeobox gene-GBX2 in human prostatic cancer cells. Prostate.
29:395–398. 1996. View Article : Google Scholar : PubMed/NCBI
|
|
28
|
Gao AC, Lou W and Isaacs JT: Enhanced GBX2
expression stimulates growth of human prostate cancer cells via
transcriptional up-regulation of the interleukin 6 gene. Clin
Cancer Res. 6:493–497. 2000.PubMed/NCBI
|
|
29
|
Gurbuz N, Ashour AA, Alpay SN and Ozpolat
B: Down-regulation of 5-HT1B and 5-HT1D receptors inhibits
proliferation, clonogenicity and invasion of human pancreatic
cancer cells. PLoS One. 9:e1100672014. View Article : Google Scholar : PubMed/NCBI
|
|
30
|
Kawanabe Y and Nauli SM: Endothelin. Cell
Mol Life Sci. 68:195–203. 2011. View Article : Google Scholar : PubMed/NCBI
|
|
31
|
Wiesmann F, Veeck J, Galm O, Hartmann A,
Esteller M, Knüchel R and Dahl E: Frequent loss of endothelin-3
(EDN3) expression due to epigenetic inactivation in human breast
cancer. Breast Cancer Res. 11:R342009. View Article : Google Scholar : PubMed/NCBI
|
|
32
|
Wang R, Löhr CV, Fischer K, Dashwood WM,
Greenwood JA, Ho E, Williams DE, Ashktorab H, Dashwood MR and
Dashwood RH: Epigenetic inactivation of endothelin-2 and
endothelin-3 in colon cancer. Int J Cancer. 132:1004–1012. 2013.
View Article : Google Scholar : PubMed/NCBI
|
|
33
|
Liang W, Guan H, He X, Ke W, Xu L, Liu L,
Xiao H and Li Y: Down-regulation of SOSTDC1 promotes thyroid cancer
cell proliferation via regulating cyclin A2 and cyclin E2.
Oncotarget. 6:31780–31791. 2015.PubMed/NCBI
|
|
34
|
Clausen KA, Blish KR, Birse CE, Triplette
MA, Kute TE, Russell GB, D'Agostino RB Jr, Miller LD, Torti FM and
Torti SV: SOSTDC1 differentially modulates Smad and beta-catenin
activation and is down-regulated in breast cancer. Breast Cancer
Res Treat. 129:737–746. 2011. View Article : Google Scholar : PubMed/NCBI
|
|
35
|
Blish KR, Clausen KA, Hawkins GA, Garvin
AJ, Willingham MC, Turner JC, Torti FM and Torti SV: Loss of
heterozygosity and SOSTDC1 in adult and pediatric renal tumors. J
Exp Clin Cancer Res. 29:1472010. View Article : Google Scholar : PubMed/NCBI
|
|
36
|
Chang A, Yousef GM, Scorilas A, Grass L,
Sismondi P, Ponzone R and Diamandis EP: Human kallikrein gene 13
(KLK13) expression by quantitative RT-PCR: An independent indicator
of favourable prognosis in breast cancer. Br J Cancer.
86:1457–1464. 2002. View Article : Google Scholar : PubMed/NCBI
|
|
37
|
Nathalie HV, Chris P, Serge G, Catherine
C, Benjamin B, Claire B, Christelle P, Briollais L, Pascale R,
Marie-Lise J and Yves C: High kallikrein-related peptidase 6 in
non-small cell lung cancer cells: An indicator of tumour
proliferation and poor prognosis. J Cell Mol Med. 13:4014–4022.
2009. View Article : Google Scholar : PubMed/NCBI
|
|
38
|
Avgeris M, Papachristopoulou G,
Polychronis A and Scorilas A: Down-regulation of kallikrein-related
peptidase 5 (KLK5) expression in breast cancer patients: A
biomarker for the differential diagnosis of breast lesions. Clin
Proteomics. 8:52011. View Article : Google Scholar : PubMed/NCBI
|
|
39
|
Talieri M, Devetzi M, Scorilas A, Pappa E,
Tsapralis N, Missitzis I and Ardavanis A: Human kallikrein-related
peptidase 12 (KLK12) splice variants expression in breast cancer
and their clinical impact. Tumour Biol. 33:1075–1084. 2012.
View Article : Google Scholar : PubMed/NCBI
|