Introduction
Thalassemia is caused by copy number variants (CNVs)
and single nucleotide variants (SNVs) in the α-globin (HBA) or
β-globin (HBB) genes that result in the absence or lack of α- or
β-globin chains, and ultimately hemolytic anemia. It is estimated
that ~7% of the world population carries the gene for the disease
(1), and the birth rate of
children with hemoglobin (Hb) disorders is ≥2.4% per year (2). Thalassemia occurs most in the
Mediterranean region, East South Asia, and the subcontinents of
India and South China (2). At
present, the primary treatment methods are blood transfusion and
iron removal. Bone marrow transplantation is also used but is
expensive (3). Thalassemia
primarily includes α- and β-thalassemia. α-thalassemia is most
often caused by CNVs or SNVs in the HBA gene. The most common SNV
types in South China are Hb Constant Spring (HBA2:C.427T>C), Hb
Quong Sze (HBA2:c.377T>C) and Hb Westmead (HBA2:c.369C>G).
The most common CNV types are the Southeast Asian type
(−SEA), the right deletion type (−α3.7), and
the left deletion type (−α4.2). The -SEA/αα,
-α3.7/αα, -α4.2/αα, αCSα/αα, and
αQSα/αα types account for ~90% of all α-thalassemia
cases in this population (4).
Β-thalassemia is primarily caused by SNVs in the HBB gene; few
cases are caused by CNVs. At present, 889 SNV types have been found
(http://globin.3se.psu.edu/). In China,
>60 SNVs have been identified (5); the most common types are CD41-42
(-TCTT) (HBB:c.126-129delCrITIT), CDl7(A>T) (HBB:C.52A>T),
IVS-II-654(C>T) (HBB:c.316-197C>T), −28(A>G)
(HBB:c.78A>C), CD71/72(+A) (HBB:c.216-217insA), −29(A>G)
(HBB:c.-79A>G), and CD26(G>A) (HBB:c.79G>A). These
variants account for >90% of all β-thalassemia cases in China
(5).
The primary process for detecting thalassemia is
routine blood examination of hematological parameters, including Hb
content, mean corpuscular volume and mean corpuscular Hb, in
addition to Hb electrophoresis of HbA2 and abnormal Hb (6,7). The
molecular techniques used to diagnose thalassemia are primarily
gap-polymerase chain reaction (PCR) and reverse dot blot (RDB)
detection technology for target gene SNVs (8). These two methods are used in clinical
studies; however, they detect only ~20 known variants. Sanger
sequencing technology can detect unknown SNVs, however, the data
analysis is too complicated and the throughput is low. Fluorescence
quantitative-PRC (qPCR) analysis can determine CNVs but cannot
determine the breakpoint location. Multiplex ligation-dependent
probe amplification, which involves designing specific probes for
the globin gene cluster only, can detect 26 CNVs, however, the
accuracy and precision of the results are affected by the limited
number of fixed probes.
With the development of next-generation sequencing
(NGS) technologies, including the Roche 454 system, Illumina Miseq
and Hiseq systems, and Life Technologies Ion Torrent PGM and Proton
systems, there are numerous reports on the concurrent detection of
germline SNVs associated with a variety of monogenic diseases, or
somatic mutations associated with various types of cancer,
including non-small cell lung cancer (9) and colorectal cancer (10). Several studies have reported that a
single testing method can simultaneously detect CNVs and SNVs
(11–15). However, there are no related
reports on the simultaneous detection of CNVs and SNVs of
thalassemia.
In the present study, a method was established to
simultaneously detect α- and β-thalassemia using 82 multiplex PCR
and NGS and two analysis algorithms of CNV and SNV types in target
genes (HBB and HBA genes). The CNV type of each sample was
confirmed by gap-PCR. The SNV type was confirmed by Sanger
sequencing.
Materials and methods
Blood sample collection and DNA
extraction
A total of 128 blood samples of known thalassemia
genotypes were collected from Fujian Medical University Union
Hospital (Fujian, China) and the First Affiliated Hospital of Sun
Yat-sen University (Guangzhou, China). The Samples were collected
from October 2016 to January 2017. There were 79 female and 49 male
patients, with an age range of 4 months to 86 years (mean age, 26).
Peripheral blood samples (~5 ml) were collected into tubes that
contained ethylenediaminetetraacetic acid. For each sample, genomic
DNA was extracted from 100 µl whole blood using the DNeasy Blood
and Tissue kit (Qiagen, Inc., Germantown, MD, USA) according to the
manufacturer's protocol. Briefly, the blood samples were hydrated
with 200 µl Buffer AL and 20 µl proteinase K followed by incubation
for 10 min at 56°C, the contents were transferred to a DNeasy Mini
Spin Column placed in a 2-ml collection tube following the addition
of 200 µl ethanol (96–100%). The samples were centrifuged at 6,000
× g for 1 min at room temperature, at 6,000 × g for 1 min at room
temperature following the addition of Buffer AW1, and again at
20,000 × g for 3 min at room temperature following the addition of
Buffer AW2. Finally, the samples were eluted with 200 µl Buffer AE,
quantified on a Qubit® fluorometer (Life Technologies;
Thermo Fisher Scientific, Inc.), and stored at −20°C prior to
use.
Primer design
The primer sequences were designed using reference
sequences of the HBA2 and HBB gene loci [accession nos. NC_000016.9
(222846.223709) and NC_000011.9 (5246696.5248301)] from the NCBI
database (http://www.ncbi.nlm.nih.gov/nuccore/NC_000016.9 and
http://www.ncbi.nlm.nih.gov/nuccore/NC_000011.9) with
Ion AmpliSeq™ Designer (https://www.ampliseq.com/). The Ion AmpliSeq™
Thalassemia Panel, which consists of two primer pools made up of 82
pairs of primers (72 pairs of primers for HBA2 and 10 pairs of
primers for HBB), was designed by Life Technologies; Thermo Fisher
Scientific, Inc.
Library construction
Each sample was used to construct the library using
the Ion AmpliSeq™ Library Kit 2.0 (Life Technologies; Thermo Fisher
Scientific, Inc.). In brief, 10 ng genomic DNA, 4 µl 5X Ion
AmpliSeq™ HiFi mix, 10 µl 2X Ion AmpliSeq™ primer pool, and 4 µl
nuclease-free water were mixed to amplify the target regions.
Subsequently, 2 µl FuPa reagent was added to each amplified sample
to partially digest the primer sequences, and each library was
ligated into a unique barcode and a universal adapter provided in
the Ion Xpress™ barcode adapters (Life Technologies; Thermo Fisher
Scientific, Inc.). Each library was purified using AMPure XP beads
(Beckman Coulter, Inc., Brea, CA, USA). The purified libraries were
quantified on a Qubit® 3.0 fluorometer. The size
distributions of the libraries were verified using the Agilent High
Sensitivity DNA kit on a 2100 Bioanalyzer (Agilent Technologies,
Inc., Palo Alto, CA, USA).
Template preparation and
enrichment
Each library was diluted to 100 pM according to its
quantified concentration as determined on the Qubit® 3.0
fluorometer. Subsequently, one test making up 14 or 15 libraries of
100 pM was emulsion PCR-amplified with Ion PGM™ Hi-Q™ ion sphere
particles (ISPs) using the Ion OneTouch™ 2 Instrument (Life
Technologies; Thermo Fisher Scientific, Inc.) according to the
manufacturer's protocol. The template-positive ISPs were enriched
using the Ion OneTouch™ ES instrument (Life Technologies; Thermo
Fisher Scientific, Inc.) according to the manufacturer's
protocol.
NGS
The enriched templates were loaded onto one Ion 318™
chip V2 and sequenced on the Ion Torrent Personal Genome Machine
(PGM; Life Technologies; Thermo Fisher Scientific, Inc.), a
semiconductor sequencing platform.
Variant detection
Sequencing data was mapped to the human reference
sequence hg19 (Genome Reference Consortium GRCh37). The variants
were called (Torrent Suite v.4.4.3; Life Technologies; Thermo
Fisher Scientific, Inc.) using variant calling software with
optimized parameters for the thalassemia panel. The variants were
annotated using Annovar (16) and
the system's software. The detected variants were subjected to a
rigorous manual curation process, which included querying variant
databases, including the SNP database (www.ncbi.nlm.nih.gov/snp/), Exome Aggregation
Consortium (exac.broadinstitute.org/), 1000 Genomes database
(www.internationalgenome.org/1000-genomes-browsers) and
Clinvar database (www.ncbi.nlm.nih.gov/clinvar/) and a literature
review.
Alignment of sequencing reads
The CNV was calculated by counting the reads in each
amplicon with MAQ>10. The reads were first uniquely mapped to
the hg19 sequence from the RAW.bam file. The CIGAR index in each
read was then trimmed. The read counts with >50% uniquely mapped
in one amplicon were calculated. For certain amplicons, the reads
were calculated with MAQ>10, as their low mapping quality would
lead to multiple hits, which included amplicons in the HBA1 and
HBA2 genes. The same protocol was performed again using MAQ>0 as
the control group.
Statistical analysis for CNV
detection
A novel algorithm was developed to identify the CNV
types of α-thalassemia. In these cases, the target amplicons were
related to different types of α-thalassemia regions, as described
above. The algorithm consisted predominantly of four tests: A
ratio, which revealed the α-thalassemia-SEA deletion
type; B ratio, which revealed the α-thalassemia-α4.2
deletion type; C ratio, which revealed the
α-thalassemia-α3.7 deletion type; and D ratio, which
represented the compound heterozygous or homozygous deletion.
Initially, several basic parameters were defined,
including the sequence read numbers of the ith reference amplicon
(ref-reads-i) and the ith target amplicon (AMPL reads-i). The
ref-reads was defined as the average number of reads of the five
reference amplicons. The control reads ratio (AMPL-i) was defined
as AMPL-i=(AMPL reads-i/ref-reads), and 28 control reads ratio
values were obtained from 34 normal samples as a baseline. Other
parameters were defined as follows: Median (median value of a
cluster of numbers): Reads ref=Σ (ref-reads-i)/4 (i=3, 4, 8, 9 and
10); test reads ratio=(AMPL reads-i/ref-reads); A ratio=median
(test reads ratio/control reads ratio) (i=4, 7, 8, 9, 10, 12, 13,
15, 44, 45, 48, 49, 50, 51, 55, 57, 58, 60, 65, 66 and 67); B
ratio=median (test reads ratio/control reads ratio) (i=20, 21 and
22); C ratio=median (test reads ratio/control reads ratio) (i=32,
33 and 35); D ratio=median (test reads ratio/control reads ratio)
(i=27). GraphPad Prism (v. 5.0; GraphPad Software, Inc., La Jolla,
CA, USA) software was used for all statistical analyses. Data are
expressed as the mean ± standard error of the mean and were
analyzed using an unpaired Student's t-test (two tailed).
Gap-PCR validation
All samples were amplified using the α-Thalassemia
Genetic Diagnostic kit (gap-PCR method; DaAN Gene Co., Ltd., Sun
Yat-sen University, Guangzhou, China). The target products were
detected by agarose gel electrophoresis.
Sanger sequencing validation
The HBA2 and HBB target genes were amplified using
specific primers, and the target products were sequenced by Sanger
sequencing. New primers were designed using Primer Premier 5.0
software. The primer sequences for HBA2 were: Forward
5′-CCCCACATCCCCTCACCTACATTC-3′ and reverse
5′-CGGGCAGGAGGAACGGCTAC-3′; the primer sequences for HBB were:
Forward 5′-CAGAAGAGCCAAGGACAGGTACGGCT-3′ and reverse
5′-AAGGGCCTAGCTTGGACTCAGAATAATCC-3′.
Results
Sequencing bases and mean reads length
of 128 samples
The present study aimed to establish a method of
simultaneously detecting CNVs and SNVs of thalassemia that can be
applied to other diseases, including autism spectrum disorder
(ASD), spinal muscular atrophy (SMA), and Duchenne muscular
dystrophy (DMD). The samples for the study were selected with the
aim of including as many different types of thalassemia as
possible. Samples with sequencing reads ranging between 100 and 500
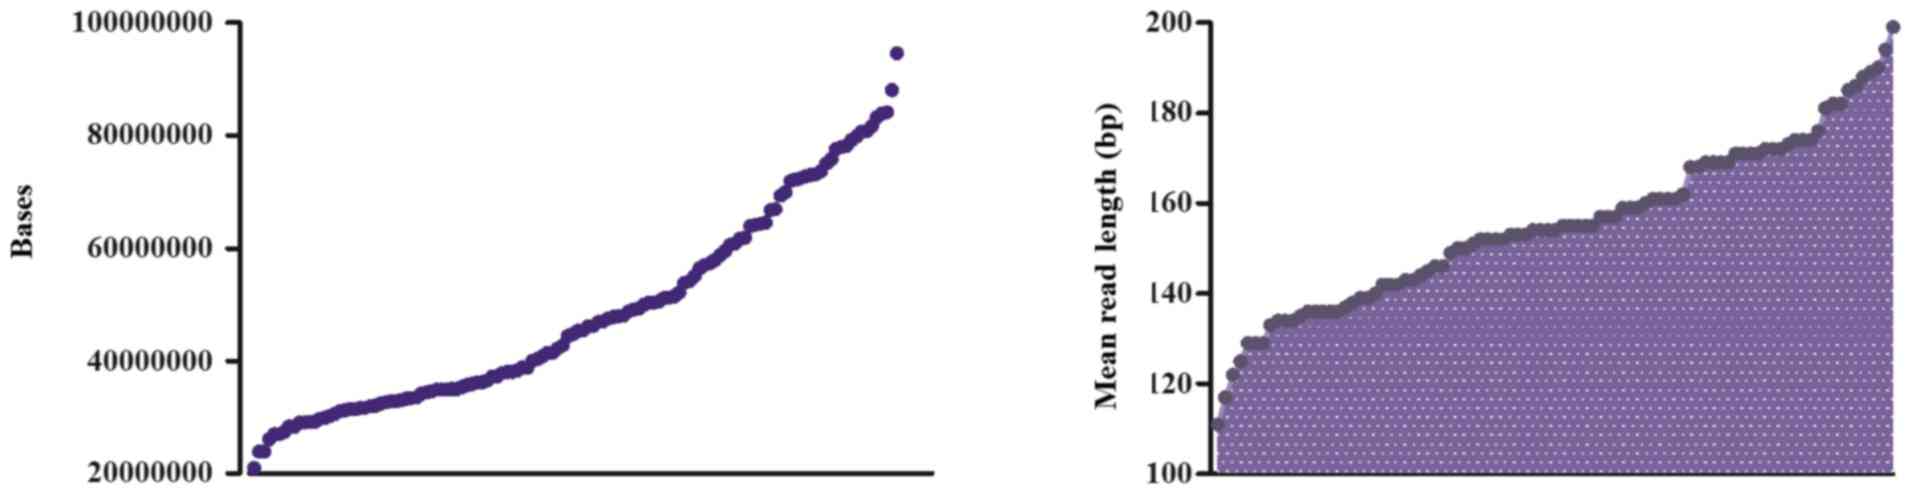
M were selected for analysis. The average number of total raw bases
was 45,236,536 (range: 22,632,244–100,007,680). The average read
length was 155 bp. The mean percentage of sequencing reads mapped
to the reference hg19 genome was 98%. Following filtering of the
low-quality reads, polyclonal reads and primer dimer reads,
sequenced bases with 3Q20 values ranged between
21,042,640 and 94,594,388 (Fig.
1).
SNV spectrum in HBA2 and HBB
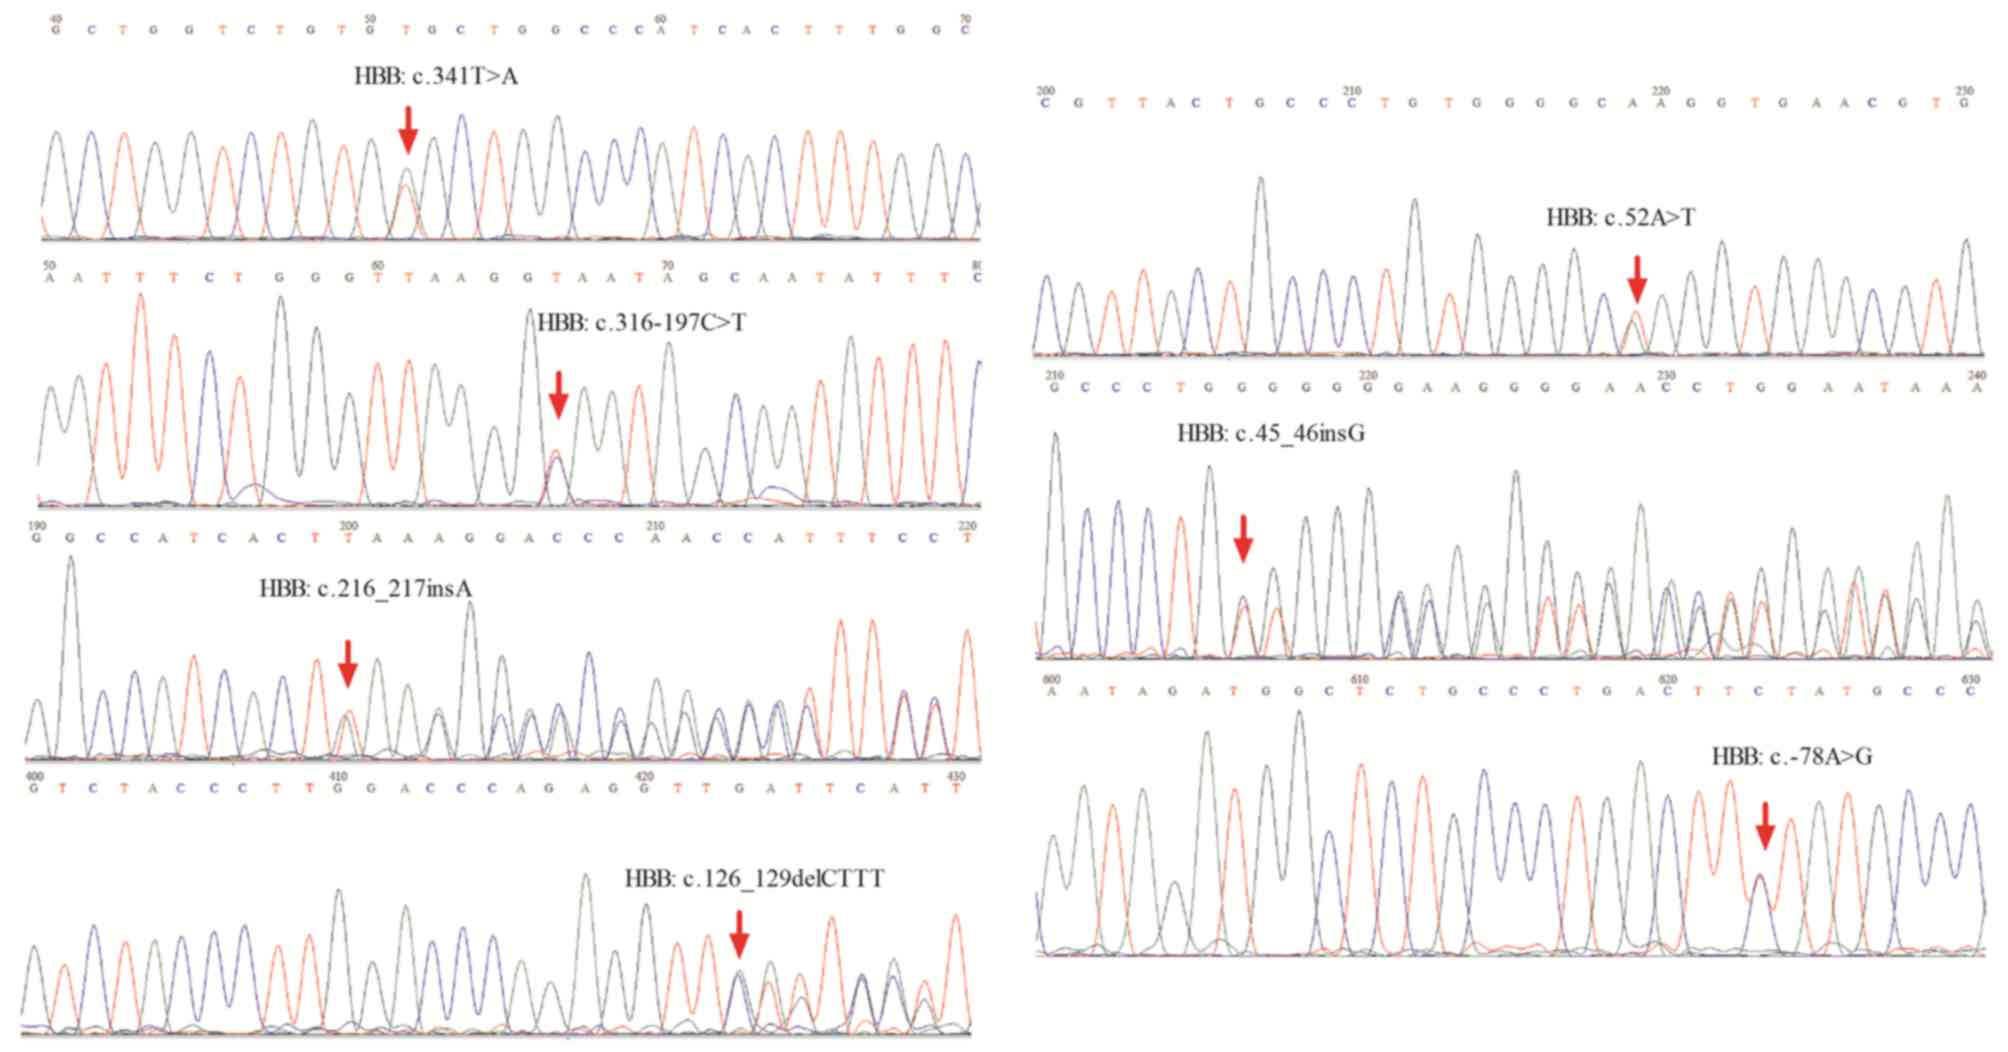
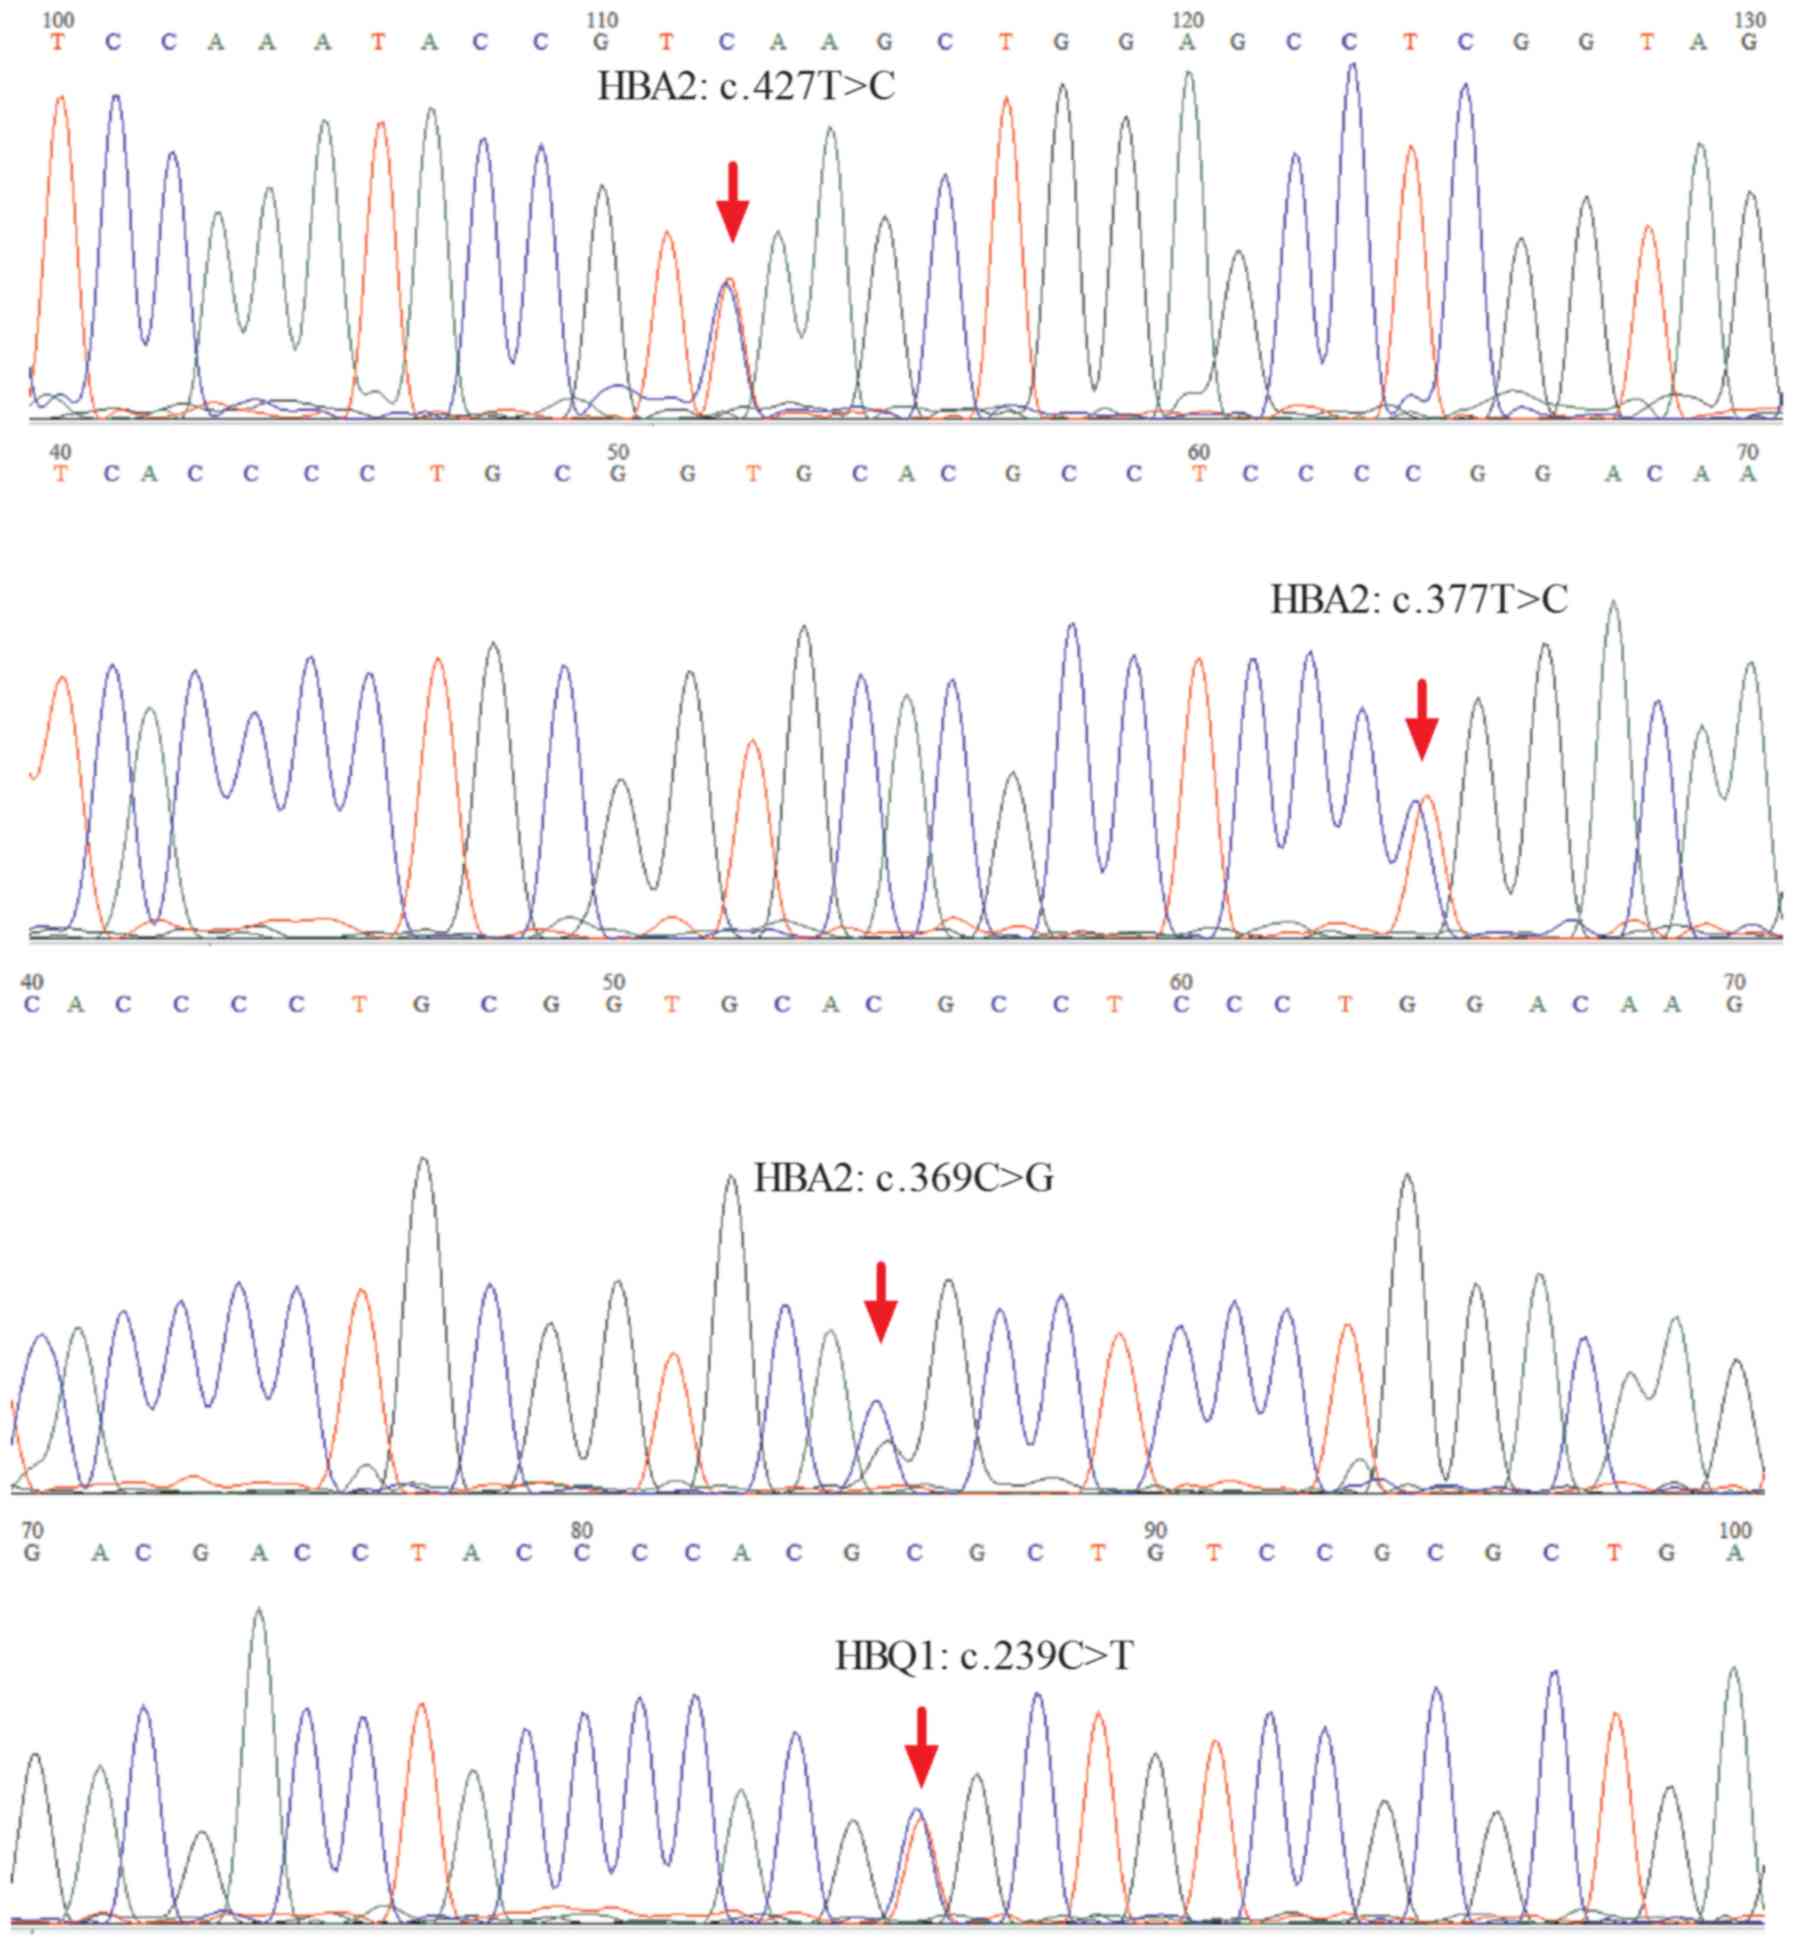
In the present study, SNVs were identified in the
target region. Approximately 11 SNVs were identified according to
the reference human genome hg19, including eight SNVs with clear
definition of pathogenic alleles recorded in the Clinvar database,
of which five SNVs were located in HBB exons, one in HBA2 exons,
and two in introns or upstream of the HBB gene. The most frequently
mutated gene locus was NM_000517.4:c.427T>C (HBA2), which
resulted in a termination codon mutation in the HBA2 gene to
glutamic acid, making it difficult to continue synthesis of the
polypeptide chain until the next stop password. Two samples carried
a nonsynonymous variant causing p.Val114Glu, and three samples
carried frameshift variants. The results were consistent with the
results of Sanger sequencing (Figs. 2A
and B and 3).
There were three other nonsynonymous variants
identified in exons which were not recorded in the Clinvar
database. The SIFT score (17–19),
Polyphen2_HDIV_score, Polyphen2_HVAR_score (17,18),
and PROVEAN score (20), which
were used to predict whether an amino acid substitution or indel
affected the biological function of a protein, were calculated to
evaluate the possible adverse effects (i.e., deleterious or
possibly damaging nature) of the nonsynonymous variants on protein
function. However, the SNV carriers exhibited symptoms of
thalassemia, supporting the prediction results (Tables I and II).
 | Table I.Pathogenic alleles or likely
pathogenic alleles detected by next-generation sequencing. |
Table I.
Pathogenic alleles or likely
pathogenic alleles detected by next-generation sequencing.
| dbSNP ID | cDNA change | Amino acid
change | Function | Gene | Exonic
function | Clinical
significance |
1000g2015-aug_all | ExAC_ALL | Sample number |
|---|
| rs34484056 |
NM_000518.4:c.341T>A |
NP_000509.1:p.Val114Glu | Exonic | HBB | Nonsynonymous | With pathogenic
allele | – | 0.0000165 | 2 |
| rs34451549 |
NM_000518.4:c.316-197C>T | – | Intronic | HBB | – | With pathogenic
allele |
|
| 1 |
| rs33969853 |
NM_000518.4:c.216_217insA |
NP_000509.1:p.Ser73Lysfs | Exonic | HBB | Frameshift
insertion | With pathogenic
allele | – | – | 1 |
| rs281864900 |
NM_000518.4:c.126_129delCTTT |
NP_000509.1:p.Phe42Leufs | Exonic | HBB | Frameshift
deletion | With pathogenic
allele | 0.0010 | 0.0003 | 1 |
| rs33986703 |
NM_000518.4:c.52A>T |
NP_000509.1:p.Lys18Ter | Exonic | HBB | Stopgain | With pathogenic
allele | 0.0012 | 0.0000165 | 1 |
| rs35383398 |
NM_000518.4:c.45_46insG |
NP_000509.1:p.Trp16Valfs | Exonic | HBB | Frameshift
insertion | With pathogenic
allele | – | – | 1 |
| rs33931746 |
NM_000518.4:c.-78A>G | – | Upstream | HBB | – | With pathogenic
allele | – | – | 5 |
| rs41464951 |
NM_000517.4:c.427T>C |
NP_000508.1:p.Ter143Glu | Exonic | HBA2 | Stopgain | With pathogenic
allele | 0.0002 |
| 14 |
| rs41397847 |
NM_000517.4:c.377T>C |
NP_000508.1:p.Leu126Pro | Exonic | HBA2 | Nonsynonymous | – | – | 0.0001 | 5 |
| rs41479347 |
NM_000517.4:c.369C>G |
NP_000508.1:p.His123Gln | Exonic | HBA2 | Nonsynonymous | – | 0.0002 | 0.0001 | 3 |
| rs184435680 |
NM_005331.4:c.239C>T |
NP_005322.1:p.Ala80Val | Exonic | HBQ1 | Nonsynonymous | NA | 0.0026 | 0.0013 | 2 |
| Table II.Prediction of amino acid changes that
affect the protein function of likely pathogenic alleles. |
Table II.
Prediction of amino acid changes that
affect the protein function of likely pathogenic alleles.
| dbSNP ID | SIFT_score |
Polyphen2_HDIV_score |
Polyphen2_HVAR_score | PROVEAN_score |
|---|
| rs184435680 | 0.001 | 0.979 | 0.162 | −3.47 |
| rs41397847 | 0 | 1 | 0.997 | −5.01 |
| rs41479347 | 0 | 0.866 | 0.76 | −5.74 |
| Categorical
prediction | D: deleterious
(sift<=0.05); T: tolerated (sift>0.05) | D: probably
damaging (>=0.957), P: possibly damaging
(0.453<=pp2_hdiv<=0.956); B: benign (pp2_hdiv<=0.452) | D: probably
damaging (>=0.909), P: possibly damaging
(0.447<=pp2_hdiv<=0.909); B: benign (pp2_hdiv<=0.446) | D: deleterious
(provean<=−2.5); T: tolerated (provean>-2.5)
(‘polymorphism_automatic’) |
An additional 66 SNVs were identified that did not
result in an amino acid change and were located in an intron, an
intergenic region, or upstream or downstream of genes. The minor
allele frequency (MAF) value of 20 SNVs in the 1000 Genomes
database was <0.01, indicating that these SNVs occur less
frequently in the normal population. However, their potential
adverse effects require further evaluation. The MAF value of 32
additional SNVs in the 1000 Genomes database was >0.01,
indicating a probable polymorphism, and 1–94 of the 128 samples in
the present study carried these SNVs. These SNVs may form their own
polymorphism in Chinese individuals, providing evidence for gene
haplotype and crowd site distribution. Of these SNVs, 14 had no
information in the 1000 Genomes database or other databases
(Table III).
| Table III.Alleles with unclear clinical
significance or polymorphisms. |
Table III.
Alleles with unclear clinical
significance or polymorphisms.
| dbSNP ID | Location | Gene | MAF
(1000g2015aug_all) | Sample number |
|---|
| rs184435680 | Intronic | HBQ1 | T=0.0026/13 | 2 |
| rs2541669 | Upstream | HBA2 | T=0.3423/1714 | 3 |
| rs281864524 | Downstream | HBB | T=0.0006/3 | 1 |
| rs565600725 | Intergenic | HBM, HBA2 | T=0.0002/1 | 1 |
| rs180783444 | Downstream | HBB | A=0.0016/8 | 1 |
| rs551376957 | Upstream | HBA1 | C=0.0002/1 | 1 |
| rs571103784 | Intergenic | HBQ1, LUC7L | C=0.0002/1 | 1 |
| rs75154897 | Intergenic | HBQ1, LUC7L | A=0.0014/7 | 1 |
| rs570069684 | Upstream | HBA2 | C=0.0004/2 | 2 |
| rs529931134 | Intronic | HBB | G=0.0006/3 | 1 |
| rs556749777 | Intergenic | HBQ1, LUC7L | A=0.0006/3 | 2 |
| rs14010613 | Intergenic | HBM, HBA2 | A=0.0012/6 | 1 |
| rs75154897 | Intergenic | HBQ1, LUC7L | A=0.0014/7 | 2 |
| rs76306358 | Upstream | HBB | C=0.0018/9 | 2 |
| rs189144293 | Intronic | HBQ1 | A=0.0024/12 | 1 |
| rs181879924 | Intronic | HBQ1 | A=0.0024/12 | 1 |
| rs376289816 | Intergenic | HBQ1, LUC7L | T=0.0036/18 | 2 |
| rs200410739 | Intergenic | HBQ1, LUC7L | −=0.0046/23 | 1 |
| rs181734727 | Intergenic | HBA2, HBA1 | A=0.0068/34 | 1 |
| rs193110122 | Intergenic | HBQ1, LUC7L | A=0.0080/40 | 11 |
|
chr11:5247070G>T | Intronic | HBB | – | 1 |
| rs11431675 | Intronic | HBM | – | 81 |
| rs377158360 | Intergenic | HBM, HBA2 | – | 1 |
|
chr16:220861delC | Intergenic | HBM, HBA2 | – | 1 |
| rs373693318 | Intronic | HBA2 | – | 3 |
|
chr16:223997C>G | Downstream | HBA2 | – | 1 |
|
chr16:228779A>C | Intergenic | HBA1, HBQ1 | – | 1 |
|
chr16:229068T>C | Intergenic | HBA1, HBQ1 | – | 1 |
| rs117470710 | Upstream | HBQ1 | – | 1 |
|
chr16:230614C>A | Intronic | HBQ1 | – | 1 |
| rs5018713 | Intergenic | HBQ1, LUC7L | – | 126 |
|
chr16:233238G>C | Intergenic | HBQ1, LUC7L | – | 1 |
|
chr16:233605C>T | Intergenic | HBQ1, LUC7L | – | 1 |
| rs67113805 | Intergenic | HBQ1, LUC7L | – | 41 |
| rs3760046 | Downstream | HBA1 | C=0.0120/60 | 7 |
| rs75368786 | Utr3 | HBM | A=0.0198/99 | 13 |
| rs2238370 | Downstream | HBA2 | A=0.0304/152 | 13 |
| rs72763686 | Intergenic | HBQ1, LUC7L | A=0.0389/195 | 1 |
| rs72763688 | Intergenic | HBQ1, LUC7L | T=0.0413/207 | 1 |
| rs72763685 | Intergenic | HBA2, HBA1 | A=0.0425/213 | 1 |
| rs72763684 | Intergenic | HBA2, HBA1 | T=0.0447/224 | 1 |
| rs28444102 | Intergenic | HBM, HBA2 | T=0.0561/281 | 1 |
| rs78502923 | Intergenic | HBQ1, LUC7L | T=0.0405/203 | 15 |
| rs12574989 | Downstream | HBB | T=0.0465/233 | 25 |
| rs1203834 | Downstream | HBQ1 | T=0.0703/352 | 15 |
| rs7946748 | Intronic | HBB | A=0.0992/497 | 6 |
| rs2685118 | Intergenic | HBQ1, LUC7L | A=0.1645/824 | 21 |
| rs11639532 | Intergenic | HBA2, HBA1 | A=0.1975/989 | 21 |
| rs1203833 | Intergenic | HBM, HBA2 | C=0.2196/1100 | 15 |
| rs2858016 | Intergenic | HBQ1, LUC7L | T=0.2466/1235 | 13 |
| rs10837631 | Downstream | HBB | A=0.2480/1242 | 54 |
| rs2541677 | Upstream | HBM | A=0.2943/1474 | 4 |
| rs2858935 | Upstream | HBM | C=0.3181/1593 | 19 |
| rs3859140 | Intergenic | HBQ1, LUC7L | C=0.3379/1692 | 65 |
| rs2238369 | Downstream | HBA2 | C=0.3550/1778 | 57 |
| rs78928216 | Downstream | HBB | C=0.3614/1810 | 33 |
| rs7480526 | Intronic | HBB | C=0.3690/1848 | 52 |
| rs56308933 | Intergenic | HBQ1, LUC7L | T=0.4077/2042 | 94 |
| rs3859139 | Intergenic | HBQ1, LUC7L | C=0.4225/2116 | 63 |
| rs57397665 | Intergenic | HBM, HBA2 | T=0.4637/2322 | 50 |
| rs28673162 | Intergenic | HBQ1, LUC7L | A=0.4858/2433 | 38 |
| rs2974771 | Intergenic | HBM, HBA2 | T=0.4748/2378 | 85 |
| rs10742583 | Upstream | HBB | G=0.2817/1411 | 94 |
| rs2858942 | Upstream | HBA1 | A=0.2616/1310 | 69 |
| rs11863726 | Intronic | HBQ1 | G=0.2039/1021 | 11 |
| rs2541675 | Intergenic | HBM, HBA2 | A=0.2560/1282 | 70 |
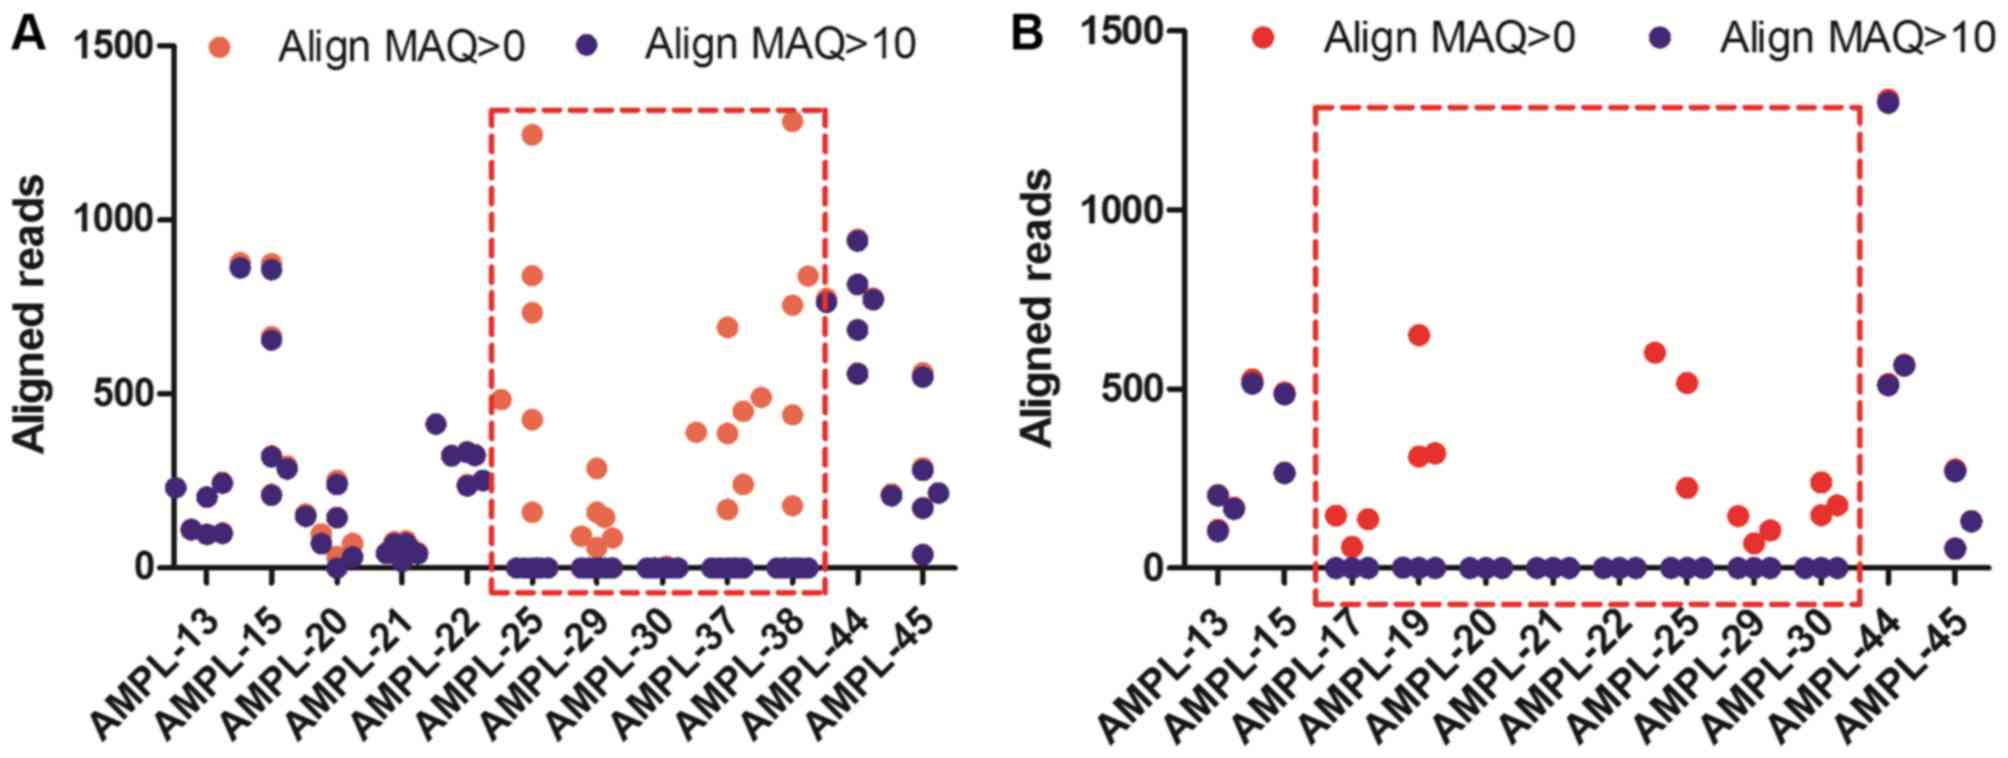
Determination of the quality of the
sequencing reads
The human HBA gene cluster, located on chromosome
16, spans ~30 kb and includes seven loci:
5′-zeta-pseudo-zeta-mu-pseudo-alpha-1-alpha-2-alpha-1-theta-3′. The
α-2 (HBA2) and α-1 (HBA1) coding sequences are identical. The
similarity of these gene sequences is almost 97%. They differ only
marginally in their 5′untranslated region and introns and differ
significantly in their 3′untranslated region. The target CNVs of
HBA2 depend on an accurate alignment algorithm to avoid ambiguity
between HBA2 and HBA1.
The present study introduced the concept of mapping
quality, a measure of the confidence that a read actually comes
from the position it is aligned to by the mapping algorithm. Align
MAQ can build assemblies by mapping shotgun short reads to a
reference genome using quality scores to derive genotype calls of
the consensus sequence of a diploid genome (21). In the present study, six
-SEA/-α3.7 samples and three
-SEA/-α4.2 samples were analyzed using Align
MAQ=10. The aligned reads of AMPL-25, AMPL-29, AMPL-30, AMPL-37,
and AMPL-38 in the -SEA/-α3.7 samples using
Align MAQ>10 were close to 0 compared with those using Align
MAQ=0 (Fig. 4A and B). Similar
results were found in the -SEA/-α4.2
samples.
Evaluation of the performance of the
reference gene amplicons by NGS
Applying reference amplicons is key to constructing
an algorithm to detect CNVs. For an algorithm to be accurate, the
reference gene region should be a stable diploid with minimal
variation in the amplicon sequencing depth of different samples.
According to thalassemia disease-associated genes, regions of the
HBB gene (ref-03-chr11: 5246753–5246986, ref-04-chr11:
5246976–5247184, ref-08-chr: 5248047–5248296, ref-09-chr11:
5248286–5248485, and ref-10-chr11: 5248475–5248641, hg19), which
encodes β-globin, were selected as reference amplicons. The HBB
gene was used as the endogenous reference gene as β-thalassemia is
predominantly caused by SNVs in the HBB gene, rather than a CNV.
For thalassemia of the HBB CNV types, other genes require selection
as the reference gene. The sequencing depth at each base pair
position in these five regions was counted in all 128 samples
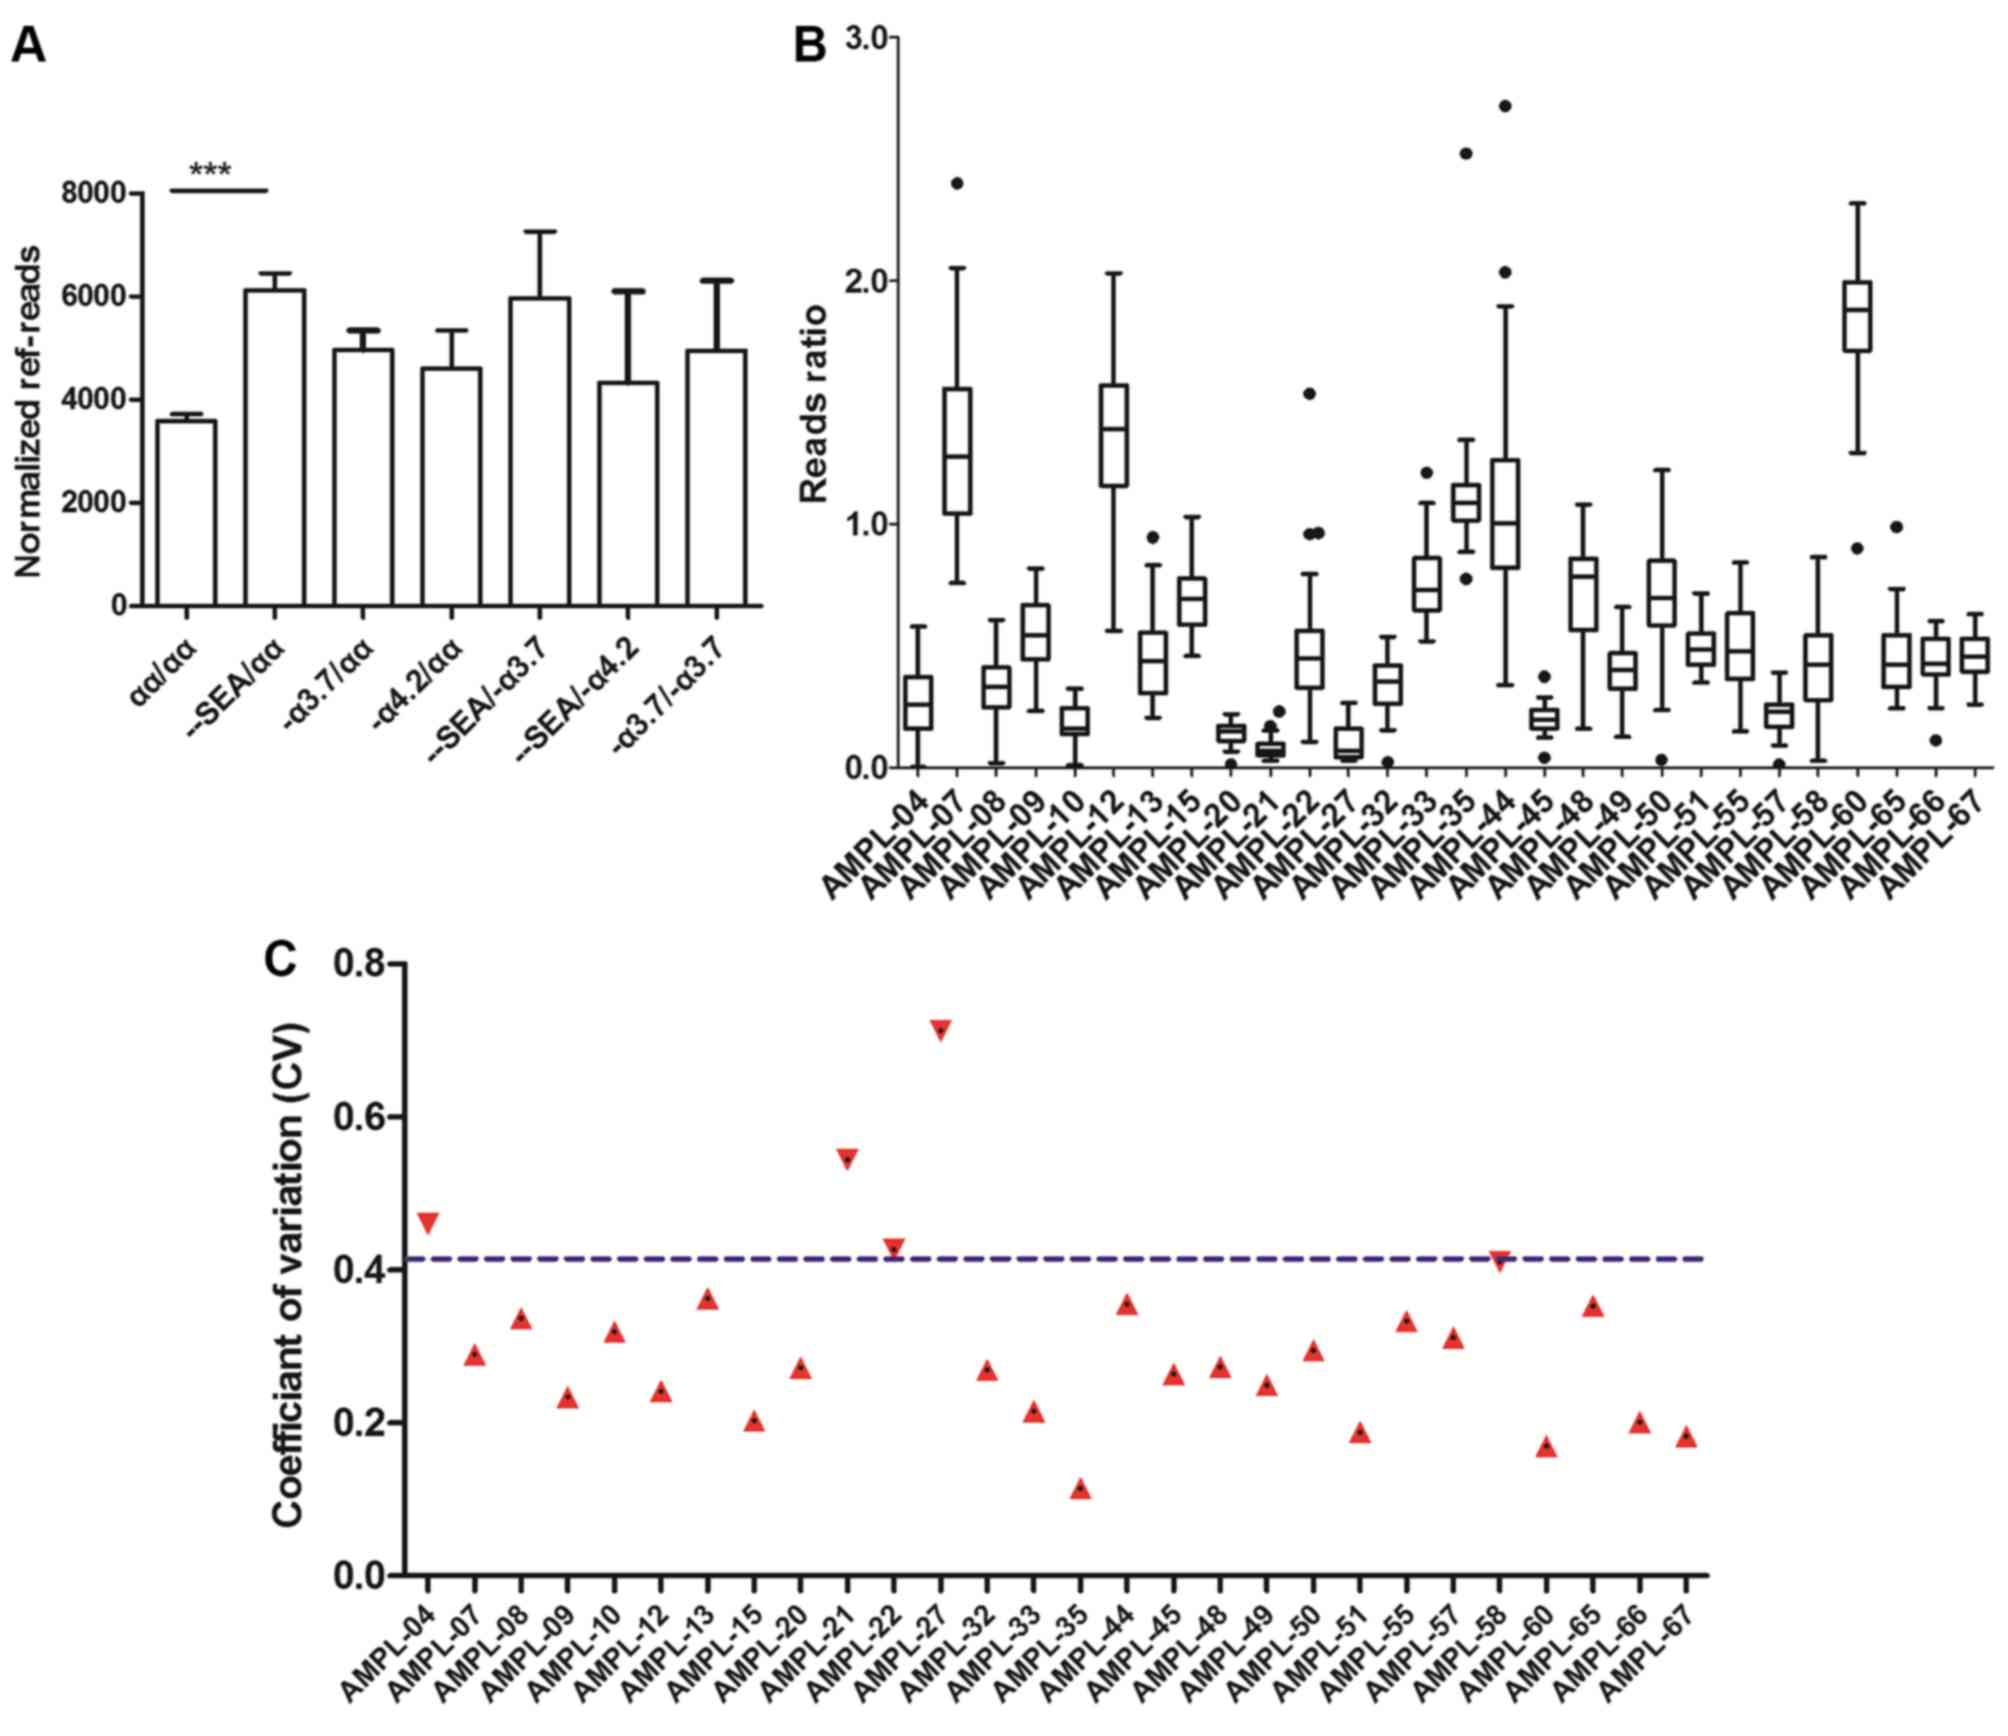
divided by seven different groups. Normalized ref-reads were
generated and are shown for each sample. The values varied between
1,136 and 13,282, with no significant differences in the amplicon
sequencing depth among the samples in the seven groups, with the
exception of -SEA/αα (Fig.
5A). The abnormal value in the -SEA/αα group may
have been caused by deletions in the HBA2 gene region, although
without influence on the final results.
The following step was to investigate the
consistency of the samples. A cluster of reference reads ratios of
28 amplicons were built as a baseline across 33 normal samples
(Fig. 5B). The reads ratio was
defined as the ratio of the target region reads to the reference
region reads of each sample. Examination of the coefficient of
variation (CV) of the reference samples revealed that 24 of the 28
amplicons had CVs with values <41.1% (Fig. 5C).
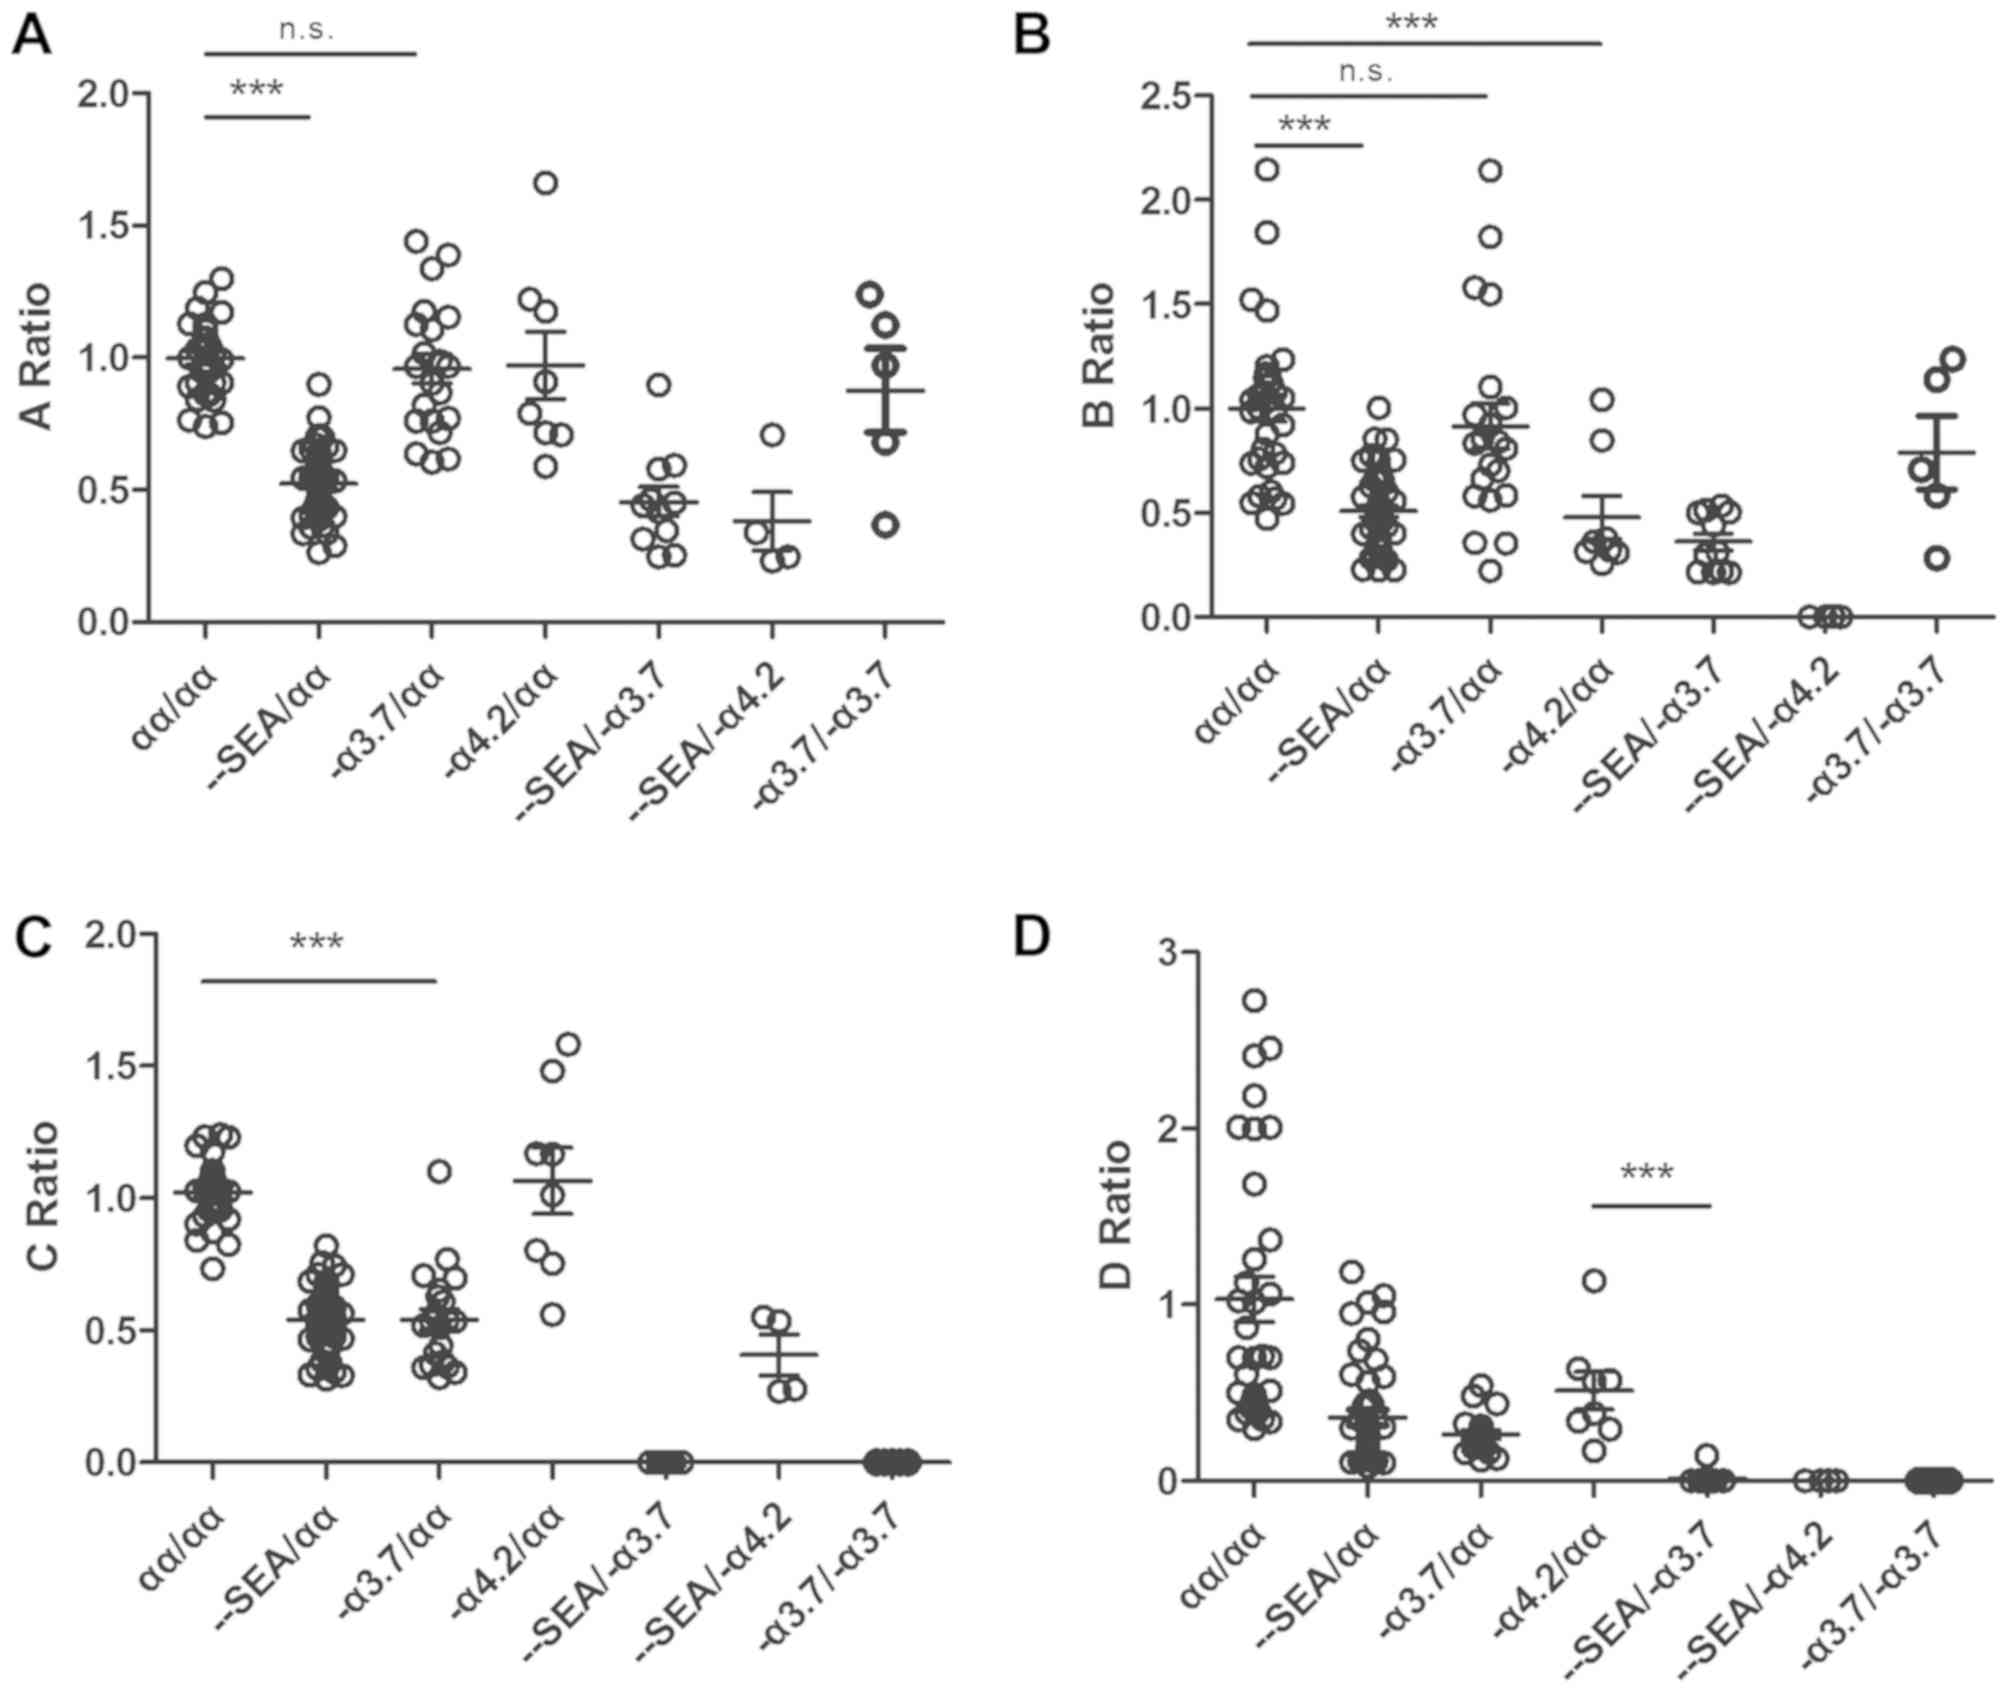
CNV detection by NGS
To identify an indicator for CNV detection, a novel
algorithm was developed based on the ratio of the median reads
ratio of the target sample to that of the reference. The median
ratio value, but not the mean ratio value, was used to evaluate the
CNV type as the middle value is less vulnerable to a deviation as a
result of a sequencing error. The A ratio, B ratio, C ratio and D
ratio revealed the copy numbers of the region related to the
Southeast Asia deletion, the -α4.2 deletion, the
-α3.7 deletion, and the compound deletion type of
α-thalassemia, respectively. The A ratio ranged between 0.741 and
1.298 in the normal group, between 0.263 and 0.899 in the
-SEA/αα group, between 0.246 and 0.898 in the
-SEA/-α3.7 group, and between 0.232 and 0.707
in the -SEA/-α4.2 group. The discrepancy in
the A ratio was significant (P<0.0001) between the normal
(αα/αα) samples and heterozygous Southeast Asia deletion type
(−SEA/αα) samples according to Student's t-test
(Fig. 6A). Consistent with the
heterozygous Southeast Asia deletion type (−SEA/αα,
-SEA/-α4.2, and
-SEA/-α3.7), the fluctuations in the B ratio
and C ratio associated with the -α4.2 deletion and
-α3.7 deletion were similar to that of the A ratio. The
discrepancies were also significant (Fig. 6B and C). The D ratio was defined as
the ratio of the AMPL-27 reads ratio of the target sample to the
reference median reads ratio. The AMPL-27 ranged between chr16:
223333 and chr16: 223548 in the HBA2 gene (HBA1 and HBA2 genes
encode ~97% of the total Hb). A homozygous deletion in this region
indicates a severe type of thalassemia. AMPL-27 is a common
deletion region in these three types. Therefore, the D ratios in
the -α3.7/-α3.7,
-SEA/-α3.7, and
-SEA/-α4.2 groups were close to zero
(Fig. 6D).
Targeted CNVs detected by NGS
The Southeast Asia, -α4.2, and
-α3.7 deletions were identified using the following
criteria: A ratio <0.8, B ratio <0.4, and C ratio <0.8,
respectively. Subsequently, gap-PCR was used to evaluate the
sensitivity and specificity of the approach. A total of 61
heterozygous Southeast Asia deletion (−SEA/αα,
-SEA/-α4.2, and
-SEA/-α3.7) samples were detected with 96.72%
(59/61) sensitivity and 93.94% (31/33) specificity, 12 heterozygous
-α4.2 deletion (−α4.2/αα and
-SEA/-α4.2) samples were detected with 83.33%
(10/12) sensitivity and 100% (33/33) specificity, and 38
-α3.7 deletion (−α3.7/αα,
-α3.7/-α3.7, and
-SEA/-α3.7) samples were detected with 97.37%
sensitivity (37/38) and 93.94% (31/33) specificity. Compound
homozygous thalassemia was identified using the following
criterion: D ratio <0.002. In total, 20 homozygous deletions of
AMPL-27 were detected with 95% (19/20) sensitivity and 100%
specificity (33/33).
Correlation between target CNVs and
SNVs
As NGS technology is able to simultaneously detect
target gene CNVs and SNVs, their correlation was investigated in
the present study. When a gene exhibits a loss of heterozygosity,
only a haploid gene exists, not a diploid. Once this gene acquires
SNVs, 100% frequency can be detected; this abnormal sample is
defined as a compound heterozygous CNV and SNV. In the present
study, certain samples had compound heterozygous CNVs and SNVs
(e.g., -SEA/αα and CD122).
Discussion
Human genetic diseases are generally caused by
changes in genetic material that are considered to affect
performance by controlling the expression of traits. These changes
include SNVs and structural variations, which are operationally
defined as CNVs, inversions and translocations (22–31).
There are different detection methods for different diseases. SNVs
are usually detected by Sanger sequencing, Southern blotting
(32), PCR-RDB (33,34)
or matrix-assisted laser desorption ionization time-of-flight mass
spectrometry (35). Partial CNVs,
including deletions and duplications, are often detected by qPCR
(36), array comparative genomic
hybridization (37) and massively
parallel DNA sequencing (38).
However, the genetic profile is so complex that the concurrent
detection of an SNV and a structural chromosomal abnormality is
difficult. In previous years, with the development of NGS
technologies, several reports have described a single testing
method that can simultaneously detect an SNV and an CNV (11–15).
These reports provide insight into novel methods of detecting
inherited diseases. However, in the majority of studies, massive
probes have been used to capture target gene regions, following
which the target DNA was detected by massively parallel sequencing
or NGS. In other studies, the whole genome was sequenced and only
the target gene region was analyzed. The use of massive probes or
the whole genome requires higher costs and labor requirements
compared with the use of multiple primers to capture target gene
regions.
In the present study, α- and β-thalassemia was used
as the study model, including CNVs and SNVs in the HBA gene or SNVs
in the HBB gene. Multiplex PCR-NGS technology can detect CNVs and
SNVs in disease-specific genes. For the detection of SNVs, the
coincidence rate using gold-standard generation sequencing was
100%. For the detection of CNVs, although 100% accuracy was not
achieved in the present study, there were few false negatives, and
false positives could be reduced using a subsequent validation
technique, including Sanger sequencing and/or gap-PCR technology.
Furthermore, the technology can also detect CNVs and SNVs in the
entire region in addition to the specific region. This method has
similar accuracy to Sanger sequencing for detecting SNVs. In the
present study, a novel algorithm was developed to detect target
CNVs and SNVs simultaneously using NGS data. In this algorithm,
Align MAQ=10 was used to align the sequencing reads at a specific
position and to remove mismatches, which may lead to the false
detection of variants. The results indicated that the method was
accurate, with high sensitivity and specificity, using MAQ=10.
The reference gene region was selected to normalize
the PCRs for the quantity of genomic DNA added to the sequencing
reactions. A ratio was set using the reads in the target gene
relative to that in the reference gene. The read count data were
converted into a standardized normal score. In the present study,
the HBB gene was used as the endogenous reference gene for
detecting the α-thalassemia CNV type, as β-thalassemia is
predominantly caused by an SNV in the HBB gene, not a CNV. For
thalassemia of the HBB CNV type, other genes require selection as
the reference gene. In the present study, an algorithm was
developed based on a previously reported relative qPCR method
(39). However, standard
housekeeping genes, including GAPDH and β-actin, are typically used
as internal control genes (40,41).
Suitable internal controls for algorithm building are necessary.
Some bias of the normalized ref-reads (Fig. 5A) remained present in the
-SEA/αα group (i.e., expression of the reference gene
region in the -SEA/αα group was significantly higher
than in other groups). Therefore, based on the algorithm built in
the present study, the reference gene can be used instead of other
housekeeping genes, and the results are likely to be more
accurate.
The present study also provides an example of CNV
detection that can be exploited for other CNV-related diseases.
Several diseases are related to target CNVs and SNVS; these include
neurological disorders, including ASD (42) and schizophrenia (43), muscular disorders including SMA
(44) and DMD (45), and certain types of cancer
(46–48) However, only a few uncommon
diagnostic methods can simultaneously resolve these problems. The
ability to combine CNV and SNV analyses using one method can save
on labor costs.
In conclusion, the simultaneous detection of target
CNVs and SNVs of thalassemia by multiplex PCR and next-generation
sequencing is a valid strategy for thalassemia studies. The
previous method for SNV detection involves PCR-RDB or Sanger
sequencing. These methods are currently used in clinical studies;
however, they detect only known variants. Sanger sequencing
technology can detect unknown gene SNVs, but the data analysis is
too complicated and the throughput is low. The present study used
multiplex PCR and next-generation sequencing to detect novel
mutations and target SNVs. For CNV detection, the previous method
of gap-PCR can detect the -SEA, -α4.2, and
-α3.7 deletion type with good accuracy, but samples
require re-testing, which increases labor. Therefore, the present
study built a novel algorithm for CNV detection. The use of a
cluster of control values to build a baseline and the ratios of the
target amplicons to the reference amplicons increased the precision
of the algorithm. Overall, the present study demonstrates the
feasibility of using NGS data to detect both targeted CNVs and
CNVs. This strategy allows for the use of multiplex PCR and NGS as
routine methods, however, further computational and technological
developments are required.
Acknowledgements
Not applicable.
Funding
This study received financial assistance from the
Science and Technology Program of Guangdong (grant no.
2015A030401040), the Key Program for Health Care Collaborative
Innovation of Guangzhou (grant no. 201500000004-4), the Science and
Technology Program of Guangzhou (grant no. 201704020114) and the
Medical Scientific Research Foundation of Guangdong Province, China
(grant no. A2017518).
Availability of data and materials
The datasets used or analyzed during the current
study are available from the corresponding author on reasonable
request.
Authors' contributions
DMF XY, XXY and ML conceived and designed the study.
DMF and LMH performed the experiments. DMF, XY and LMH wrote the
paper. XXY and ML improved the manuscript. DMF, XY and GJO analyzed
the data. All authors read and approved the manuscript.
Ethics approval and consent to
participate
The study protocol was approved by the Medical
Ethics Committee of Shenzhen Hospital of Southern Medical
University (Shenzhen, China), and the Committee on Human Research,
Publications and Ethics of School of Laboratory Medicine and
Biotechnology, Southern Medical University. Prior to recruitment
and sample collection, meetings were held to explain in detail the
purpose and procedures of the study. The inconveniences involved,
including blood sampling, were also explained to the participants.
Written informed consent was obtained from each participant or
participant's guardian. The study was undertaken according to the
principles of the Helsinki Declaration of 1975 (as revised
2008).
Patient consent for publication
Not applicable.
Competing interests
The authors declare that they have no competing
interests.
Glossary
Abbreviations
Abbreviations:
|
NGS
|
next-generation sequencing
|
|
CNV
|
copy number variant
|
|
SNV
|
single nucleotide variant
|
References
|
1
|
Modell, Bernadette and World Health
Organization, . Hereditary Diseases Programme. Guidelines for the
control of haemoglobin disorders/edited by Bernadette Modell. World
Health Organization. (Geneva). 1994.
|
|
2
|
Angastiniotis M and Modell B: Global
epidemiology of hemoglobin disorders. Ann N Y Acad Sci.
850:251–269. 1998. View Article : Google Scholar : PubMed/NCBI
|
|
3
|
Mohamed SY: Thalassemia Major:
Transplantation or transfusion and chelation. Hematol Oncol Stem
Cell Ther. 10:290–298. 2017. View Article : Google Scholar : PubMed/NCBI
|
|
4
|
Zheng CG, Liu M, Du J, Chen K, Yang Y and
Yang Z: Molecular spectrum of α- and β-globin gene mutations
detected in the population of Guangxi Zhuang Autonomous Region,
People's Republic of China. Hemoglobin. 35:28–39. 2011. View Article : Google Scholar : PubMed/NCBI
|
|
5
|
Yang Y and Zhang J: Research progress on
thalassemia in Southern China-review. Zhongguo Shi Yan Xue Ye Xue
Za Zhi. 25:276–280. 2017.(In Chinese). PubMed/NCBI
|
|
6
|
Batterbee H, De la Salle B, Wild B,
McTaggart P, Dore´ C, Porter N and Hyde K: Evaluation of the
validity of UK NEQAS Hb A2 data for the NHS Sickle Cell and
Thalassaemia Screening Programme. Br J Haematol. 149:S1–S96.
2010.
|
|
7
|
Ryan K, Bain BJ, Worthington D, James J,
Plews D, Mason A, Roper D, Rees DC, de la Salle B, Streetly A, et
al: Significant haemoglobinopathies: Guidelines for screening and
diagnosis. Brit J Haematol. 149:35–49. 2010. View Article : Google Scholar
|
|
8
|
Tang W, Zhang C, Lu F, Tang J, Lu Y, Cui
X, Qin X and Li S: Spectrum of α-thalassemia and β-thalassemia
mutations in the Guilin Region of southern China. Clin Biochem.
48:1068–1072. 2015. View Article : Google Scholar : PubMed/NCBI
|
|
9
|
Zhang K, Zhang M, Zhu J and Hong W:
Screening of gene mutations associated with bone metastasis in
nonsmall cell lung cancer. J Cancer Res Ther. 12 (Suppl):C186–C190.
2016. View Article : Google Scholar : PubMed/NCBI
|
|
10
|
Gallego CJ, Shirts BH, Bennette CS,
Guzauskas G, Amendola LM, Horike-Pyne M, Hisama FM, Pritchard CC,
Grady WM, Burke W, et al: Next-Generation sequencing panels for the
diagnosis of colorectal cancer and polyposis syndromes: A
cost-effectiveness analysis. J Clin Oncol. 33:2084–2091. 2015.
View Article : Google Scholar : PubMed/NCBI
|
|
11
|
Tuononen K, Mäki-Nevala S, Sarhadi VK,
Wirtanen A, Rönty M, Salmenkivi K, Andrews JM, Telaranta-Keerie AI,
Hannula S, Lagström S, et al: Comparison of targeted
next-generation sequencing (NGS) and real-time PCR in the detection
of EGFR, KRAS, and BRAF mutations on formalin-fixed,
paraffin-embedded tumor material of non-small cell lung
carcinoma-superiority of NGS. Genes Chromosomes Cancer. 52:503–511.
2013. View Article : Google Scholar : PubMed/NCBI
|
|
12
|
Shen W, Szankasi P, Sederberg M,
Schumacher J, Frizzell KA, Gee EP, Patel JL, South ST, Xu X and
Kelley TW: Concurrent detection of targeted copy number variants
and mutations using a myeloid malignancy next generation sequencing
panel allows comprehensive genetic analysis using a single testing
strategy. Br J Haematol. 173:49–58. 2016. View Article : Google Scholar : PubMed/NCBI
|
|
13
|
Kim SY, Kim JH and Chung YJ: Effect of
combining multiple CNV defining algorithms on the reliability of
CNV calls from SNP genotyping data. Genomics Inform. 10:194–199.
2012. View Article : Google Scholar : PubMed/NCBI
|
|
14
|
Marenne G, Real FX, Rothman N,
Rodríguez-Santiago B, Pérez-Jurado L, Kogevinas M, García-Closas M,
Silverman DT, Chanock SJ, Génin E and Malats N: Genome-wide CNV
analysis replicates the association between GSTM1 deletion and
bladder cancer: A support for using continuous measurement from
SNP-array data. BMC Genomics. 13:3262012. View Article : Google Scholar : PubMed/NCBI
|
|
15
|
Peterson RE, Maes HH, Lin P, Kramer JR,
Hesselbrock VM, Bauer LO, Nurnberger JI Jr, Edenberg HJ, Dick DM
and Webb BT: On the association of common and rare genetic
variation influencing body mass index: A combined SNP and CNV
analysis. BMC Genomics. 15:3682014. View Article : Google Scholar : PubMed/NCBI
|
|
16
|
Wang K, Li M and Hakonarson H: ANNOVAR:
Functional annotation of genetic variants from high-throughput
sequencing data. Nucleic Acids Res. 38:e1642010. View Article : Google Scholar : PubMed/NCBI
|
|
17
|
Galehdari H, Saki N, Mohammadi-Asl J and
Rahim F: Meta-analysis diagnostic accuracy of SNP-based
pathogenicity detection tools: A case of UTG1A1 gene mutations. Int
J Mol Epidemiol Genet. 4:77–85. 2013.PubMed/NCBI
|
|
18
|
Kumar P, Henikoff S and Ng PC: Predicting
the effects of coding non-synonymous variants on protein function
using the SIFT algorithm. Nat Protoc. 4:1073–1081. 2009. View Article : Google Scholar : PubMed/NCBI
|
|
19
|
Ng PC and Henikoff S: SIFT: Predicting
amino acid changes that affect protein function. Nucleic Acids Res.
31:3812–3814. 2003. View Article : Google Scholar : PubMed/NCBI
|
|
20
|
Choi Y, Sims GE, Murphy S, Miller JR and
Chan AP: Predicting the functional effect of amino acid
substitutions and indels. PLoS One. 7:e466882012. View Article : Google Scholar : PubMed/NCBI
|
|
21
|
Li H, Ruan J and Durbin R: Mapping short
DNA sequencing reads and calling variants using mapping quality
scores. Genome Res. 18:1851–1858. 2008. View Article : Google Scholar : PubMed/NCBI
|
|
22
|
Wong KK, deLeeuw RJ, Dosanjh NS, Kimm LR,
Cheng Z, Horsman DE, MacAulay C, Ng RT, Brown CJ, Eichler EE and
Lam WL: A comprehensive analysis of common copy-number variations
in the human genome. Am J Hum Genet. 80:91–104. 2007. View Article : Google Scholar : PubMed/NCBI
|
|
23
|
Cheng Z, Ventura M, She X, Khaitovich P,
Graves T, Osoegawa K, Church D, DeJong P, Wilson RK, Pääbo S, et
al: A genome-wide comparison of recent chimpanzee and human
segmental duplications. Nature. 437:88–93. 2005. View Article : Google Scholar : PubMed/NCBI
|
|
24
|
Conrad DF, Andrews TD, Carter NP, Hurles
ME and Pritchard JK: A high-resolution survey of deletion
polymorphism in the human genome. Nat Genet. 38:75–81. 2006.
View Article : Google Scholar : PubMed/NCBI
|
|
25
|
McCarroll SA, Hadnott TN, Perry GH, Sabeti
PC, Zody MC, Barrett JC, Dallaire S, Gabriel SB, Lee C, Daly MJ, et
al: Common deletion polymorphisms in the human genome. Nat Genet.
38:86–92. 2006. View
Article : Google Scholar : PubMed/NCBI
|
|
26
|
Hinds DA, Kloek AP, Jen M, Chen X and
Frazer KA: Common deletions and SNPs are in linkage disequilibrium
in the human genome. Nat Genet. 38:82–85. 2006. View Article : Google Scholar : PubMed/NCBI
|
|
27
|
Iafrate AJ, Feuk L, Rivera MN, Listewnik
ML, Donahoe PK, Qi Y, Scherer SW and Lee C: Detection of
large-scale variation in the human genome. Nat Genet. 36:949–951.
2004. View
Article : Google Scholar : PubMed/NCBI
|
|
28
|
Tuzun E, Sharp AJ, Bailey JA, Kaul R,
Morrison VA, Pertz LM, Haugen E, Hayden H, Albertson D, Pinkel D,
et al: Fine-scale structural variation of the human genome. Nat
Genet. 37:727–732. 2005. View
Article : Google Scholar : PubMed/NCBI
|
|
29
|
Redon R, Ishikawa S, Fitch KR, Feuk L,
Perry GH, Andrews TD, Fiegler H, Shapero MH, Carson AR, Chen W, et
al: Global variation in copy number in the human genome. Nature.
444:444–454. 2006. View Article : Google Scholar : PubMed/NCBI
|
|
30
|
Sebat J, Lakshmi B, Troge J, Alexander J,
Young J, Lundin P, Månér S, Massa H, Walker M, Chi M, et al:
Large-scale copy number polymorphism in the human genome. Science.
305:525–528. 2004. View Article : Google Scholar : PubMed/NCBI
|
|
31
|
Sharp AJ, Locke DP, Mcgrath SD, Cheng Z,
Bailey JA, Vallente RU, Pertz LM, Clark RA, Schwartz S, Segraves R,
et al: Segmental duplications and copy-number variation in the
human genome. Am J Hum Genet. 77:78–88. 2005. View Article : Google Scholar : PubMed/NCBI
|
|
32
|
Southern E: Southern blotting. Nat Protoc.
1:518–525. 2006. View Article : Google Scholar : PubMed/NCBI
|
|
33
|
Huang G, Li P, Li YX and Ye LZ:
Coexistence of two β-globin gene deletions in a Chinese Girl with
β-thalassemia Minor. Hemoglobin. 38:70–72. 2014. View Article : Google Scholar : PubMed/NCBI
|
|
34
|
Long J, Ye X, Lao K, Pang W, Weng X, Fu K,
Yan S and Sun L: Detection of three common α-thalassemia in
non-deletion types and six common thalassemia in deletion types by
QF-PCR. Clin Biochem. 46:1860–1864. 2013. View Article : Google Scholar : PubMed/NCBI
|
|
35
|
Soler L, Labas V, Thélie A, Grasseau I,
Teixeira-Gomes AP and Blesbois E: Intact cell MALDI-TOF MS on
sperm: A molecular test for male fertility diagnosis. Mol Cell
Proteomics. 169:1998–2010. 2016. View Article : Google Scholar
|
|
36
|
Plengvidhya N, Chanprasert K,
Tangjittipokin W, Thongnoppakhun W and Yenchitsomanus PT: Detection
of CAPN10 copy number variation in Thai patients with type 2
diabetes by denaturing high performance liquid chromatography and
real-time quantitative polymerase chain reaction. J Diabetes
Invest. 6:632–639. 2015. View Article : Google Scholar
|
|
37
|
Hussein IR, Magbooli A, Huwait E,
Chaudhary A, Bader R, Gari M, Ashgan F, Alquaiti M, Abuzenadah A
and AlQahtani M: Genome wide array-CGH and qPCR analysis for the
identification of genome defects in Williams' syndrome patients in
Saudi Arabia. Mol Cytogenet. 9:652016. View Article : Google Scholar : PubMed/NCBI
|
|
38
|
Miyagawa M, Nishio SY, Hattori M, Moteki
H, Kobayashi Y, Sato H, Watanabe T, Naito Y, Oshikawa C and Usami
S: Mutations in the MYO15A gene are a significant cause of
nonsyndromic hearing loss: Massively parallel DNA sequencing-based
analysis. Ann Otol Rhinol Laryngol. 124 (Suppl 1):158S–168S. 2015.
View Article : Google Scholar : PubMed/NCBI
|
|
39
|
Livak KJ and Schmittgen TD: Analysis of
relative gene expression data using real-time quantitative PCR and
the 2(-Delta Delta C(T)) method. Methods. 25:402–408. 2001.
View Article : Google Scholar : PubMed/NCBI
|
|
40
|
Piorkowski G, Baronti C, de Lamballerie X,
de Fabritus L, Bichaud L, Pastorino BA and Bessaud M: Development
of generic Taqman PCR and RT-PCR assays for the detection of DNA
and mRNA of β-actin-encoding sequences in a wide range of animal
species. J Virol Methods. 202:101–105. 2014. View Article : Google Scholar : PubMed/NCBI
|
|
41
|
Yang J, Lin Q, Lin J and Ye X: Selection
and validation of reference genes for quantitative Real-time
polymerase chain reaction studies in mossy maze polypore, Cerrena
unicolor (Higher Basidiomycetes). Int J Med Mushrooms. 18:165–175.
2016. View Article : Google Scholar : PubMed/NCBI
|
|
42
|
Merikangas AK, Segurado R, Heron EA, Anney
RJ, Paterson AD, Cook EH, Pinto D, Scherer SW, Szatmari P, Gill M,
et al: The phenotypic manifestations of rare genic CNVs in autism
spectrum disorder. Mol Psychiatry. 20:1366–1372. 2015. View Article : Google Scholar : PubMed/NCBI
|
|
43
|
Rudd DS, Axelsen M, Epping EA, Andreasen
NC and Wassink TH: A genome-wide CNV analysis of schizophrenia
reveals a potential role for a multiple-hit model. Am J Med Genet B
Neuropsychiatr Genet 165B. 619–626. 2014. View Article : Google Scholar
|
|
44
|
Wain LV, Pedroso I, Landers JE, Breen G,
Shaw CE, Leigh PN, Brown RH, Tobin MD and Al-Chalabi A: The role of
copy number variation in susceptibility to amyotrophic lateral
sclerosis: Genome-wide association study and comparison with
published loci. PLoS One. 4:e81752009. View Article : Google Scholar : PubMed/NCBI
|
|
45
|
White SJ and den Dunnen JT: Copy number
variation in the genome; the human DMD gene as an example.
Cytogenet Genome Res. 115:240–246. 2006. View Article : Google Scholar : PubMed/NCBI
|
|
46
|
Chen W, Ding J, Long J, Liu Z, Zhou X and
Shi D: DNA copy number profiling in microsatellite-stable and
microsatellite-unstable hereditary non-polyposis colorectal cancers
by targeted CNV array. Funct Integr Genomics. 17:85–96. 2017.
View Article : Google Scholar : PubMed/NCBI
|
|
47
|
Yang L, Liu B, Qiu F, Huang B, Li Y, Huang
D, Yang R, Yang X, Deng J, Jiang Q, et al: The effect of functional
MAPKAPK2 copy number variation CNV-30450 on elevating
nasopharyngeal carcinoma risk is modulated by EBV infection.
Carcinogenesis. 35:46–52. 2014. View Article : Google Scholar : PubMed/NCBI
|
|
48
|
Chen Y, Tan X, Ding Y, Mai B, Huang X, Hu
G and Luo X: WWOX CNV-67048 functions as a risk factor for
epithelial ovarian cancer in chinese women by negatively
interacting with oral contraceptive use. Biomed Res In.
2016:65940392016.
|