Introduction
Prostate cancer is the second most common type of
cancer in men worldwide and accounts for an annual mortality rate
of >250,000 (1). The most
common subtype of prostate cancer is prostate adenocarcinoma
(PRAD), which expresses the androgen receptor, while other
categories of prostate cancer, including mucinous carcinoma, signet
ring cell carcinoma, neuroendocrine prostate cancer, adenosquamous
and squamous cell carcinoma, are relatively rare (2,3).
Prostate tumours are biologically heterogeneous diseases, with some
patients succumbing to mortality from metastases within 2–3 years
and others surviving for 10–20 years following diagnosis with
localised disease.
Over the last 10 years, characterization of the
prostate cancer transcriptome and genome has revealed recurrent
somatic mutations, chromosomal rearrangements, and copy number
gains and losses, enhancing understanding of PRAD tumorigenesis.
Barbieri et al performed exome-sequencing on 112 cases of
prostate adenocarcinoma and found that the most frequently mutated
genes in primary prostate cancer were SPOP, TP53, FOXA1 and
PTEN. Prostate cancer with mutant SPOP lacks
ETS family gene rearrangements and exhibits a distinct
pattern of genomic alterations, characterised by the enrichment of
both 5q21 and 6q21 deletions (4).
A comprehensive molecular analysis of 333 samples of primary
prostate carcinoma revealed that 53% of tumours had ETS
family gene fusions, and TMPRSS2 was the most frequent
fusion partner among all ETS fusions (5). PRAD can be classified into seven
distinct subtypes, defined by ERG fusions,
ETV1/ETV4/FLI1 fusions or overexpression, or by SPOP,
FOXA1 and IDH1 mutations (6). Taylor et al found that the
nuclear receptor coactivator NCOA2 functions as an oncogene
in 11% of PRAD tumours. The combined loss of 13q and 18q, focal
amplification of two distinct 5p regions (5p13 or 5p15), and focal
deletion of 5q21.1 are each significantly associated with negative
clinical outcome (5).
Previous studies have mainly focused on genes that
are recurrently mutated in PRAD samples; however, several driver
genes may occur at a low frequency. For example, certain cancer
drivers are mutated in a small fraction (e.g., <1%) of tumours
(7). Therefore, investigations may
overlook potential drivers that are mutated at a low frequency in
PRAD, and no investigations have been conducted on the
classification of patients with PRAD using low mutation frequency
genes. In the present study, integrated analyses were performed on
332 PRAD samples using diverse omics data types from The Cancer
Genome Atlas (TCGA) database (6).
The results revealed a list of novel driver genes and driver
pathways, and revealed three distinct subgroups of patients with
PRAD, providing a better understanding of this disease and
suggesting potential therapeutic targets in PRAD.
Materials and methods
Classification of somatic mutations in
PRAD
A total of 12,348 somatic mutations of 332 pairs of
PRAD tumour/normal samples were accessed from the Broad Institute
(http://gdac.broadinstitute.org/)
(6). The Ensembl Variant Effect
Predictor (https://asia.ensembl.org/info/docs/tools/vep/index.html)
was used to assess the functional impact of somatic mutations
(8) and the mutations were then
divided into nine groups based on their functional impact,
including frame shift indels, in-frame indels, missense mutation,
nonsense mutation, nonstop mutation, RNA, silent, splice site and
translation start site (TSS). RNA indicated mutation in the
5′untranslated region (UTR) or 3′UTR that may be functional but
likely via effects on the RNA level.
Prediction of driver genes and
pathways in PRAD
OncodriveCLUST groups protein positions with a
number of mutations expected by chance to form mutation clusters.
Each cluster is scored with a value proportional to the percentage
of gene mutations that are enclosed within that cluster and
inversely related to its length. A gene clustering score is the sum
of the scores of all clusters (if any) found in that gene.
OncodriveCLUST 0.4.1 (https://www.intogen.org/analysis/) constructs the
background model by assessing coding-silent mutations and
identifies genes with a significant bias towards mutation
clustering within the protein sequence (9). OncodriveFM 0.0.1 (https://www.intogen.org/analysis/) (10) first uses three tools, SIFT
(11), PolyPhen2 (12) and MutationAssessor (13), to compute the functional impact
score of a somatic mutation. These functional scores are then
transformed into a uniform score that measures the damaging impact
of somatic mutations using transFIC (14). OncodriveFM computes bias towards
the accumulation of variants with high functional impact to
identify drivers by comparing the actual functional impact with a
null distribution model generated by 1,000,000 permutations. Genes
with Q<0.05 are considered driver genes by OncodriveCLUST and
OncodriveFM.
The integrated CAncer GEnome Score (iCAGES,
http://wglab.org/software/11-icages)
developed by Wang Genomics Lab is a novel statistical framework
that infers driver variants by integrating contributions from
coding, noncoding and structural variants, identifying driver genes
by combining genomic information and prior biological knowledge to
generate prioritised drug treatments (15). iCAGES consists of three consecutive
layers. The first layer prioritises personalised cancer driver
coding, noncoding and structural variations. The second layer
associates these mutations to genes using a statistical model with
prior biological knowledge of cancer driver genes for specific
subtypes of cancer. The third layer generates a list of drugs
targeting the repertoire of these potential driver genes. Genes
with iCAGESGeneScores >0.5 are determined as drivers by
iCAGES.
DrGaP 0.1.0 (http://code.google.com/p/drgap/) developed by Dr Lu's
lab at the Medical College of Wisconsin (16) comprises statistical methods and
several auxiliary bioinformatics tools to detect driver genes and
driver signalling pathways in cancer genome-sequencing. The
statistical methods use a Poisson process to model the random
nature of somatic mutations and a Bayesian model to estimate
background mutation rates. A likelihood ratio test is conducted to
determine the significance of driver genes and pathways. DrGaP
integrates biological knowledge of the mutational process in
tumours, including the length of protein-coding regions, transcript
isoforms, variation in mutation types, differences in background
mutation rates, redundancy of the genetic code and multiple
mutations in one gene. Genes or pathways with P-values <0.05 are
regarded as driver genes or pathways by DrGaP.
Gene Ontology (GO) and Kyoto
Encyclopaedia of Genes and Genomes (KEGG) pathway enrichment
analyses in PRAD
The GO terms and KEGG pathway enrichment analyses
were performed with GO (http://geneontology.org) (17) and Search Tool for the Retrieval of
Interacting Genes/Proteins (STRING 10.5; http://string.embl.de) (18), respectively, to characterise the
functional enrichment of all driver genes. The driver genes were
considered to be significantly enriched in GO terms or KEGG
pathways using the cut-offs of P<0.05 or false discovery rate
(FDR) <0.05.
Coexpression network analyses in
PRAD
Coexpression networks were constructed using the R
package of weighted correlation network analysis (WGCNA; http://horvath.genetics.ucla.edu/html/CoexpressionNetwork/Rpackages/WGCNA/)
with RNA-seq expression data expressed as normalised read counts of
driver genes in 497 patients with PRAD (19). All parameters were set to default
values, with the exception of softpower (7). The minimum number of genes was set as
10 to ensure reliability of the results. Genes with a high
intramodular connectivity are considered intramodular hub genes.
The clinical traits of 497 patients with PRAD were obtained from
the TCGA database. Module-trait associations were estimated using
the correlation between the module eigengene and clinical traits,
which enables easy identification of modules showing high
correlation with clinical features.
Copy number variation (CNV) analyses
in PRAD
Focal CNVs and genes with significant gains and
losses in 492 PRAD samples were detected using the GISTIC algorithm
(20) and accessed at the Broad
Institute (6). Unsupervised
hierarchical clustering of 20 driver genes with CNVs at the highest
frequency was conducted using the function heatmap.2 of the R
package of gplots (21). Patient
age, number of positive lymph nodes, cancer stage, and Gleason
scores were compared among patients in the three clusters using the
Wilcoxon sum rank test. Kaplan-Meier curves were plotted using the
R package of survival (22), and
survival rates were compared among patients in the three clusters
using the log-rank test. P<0.05 was predefined as statistically
significant.
Clinical features analyses in
PRAD
The clinical features of 497 patients with PRAD were
downloaded from the Broad Institute and included patient outcome,
number of positive lymph nodes, Gleason scores and pathologic
stages. For survival analysis, a log-rank test in univariate Cox
regression analysis with a proportional hazards model (23) was used to estimate the P-values,
comparing quantile intervals using the ‘coxph’ function in R
(22). Driver genes were
considered to be significantly associated with survival at
P<0.05. For the number of positive lymph nodes, Gleason scores
and pathologic stages, Spearman's rank correlation was performed
between each feature type and gene expression (log2 normalised read
count) using the ‘cor.test’ function in R. Driver genes were
considered to be significantly associated with positive lymph
nodes, Gleason scores, or pathologic stages at P<0.05 and
q<0.05.
Validation of randomised selection of
patients with PRAD
The datasets used for the somatic mutation,
coexpression network, clinical feature and CNV analyses were
distinct patient cohorts. To evaluate heterogeneity across the
different cohorts, clinical characteristics were compared among the
three cohorts of patients with PRAD. Patient age, number of
positive lymph nodes and Gleason scores were compared using the
Wilcoxon sum rank test. Cancer stages were compared using Pearson's
χ2 test. Kaplan-Meier curves were plotted using the R
package of survival (22), and
survival rates were compared among patients in the three cohorts
using the log-rank test. P<0.05 was predefined as statistically
significant.
Results
Somatic mutations, driver genes and
pathways in PRAD
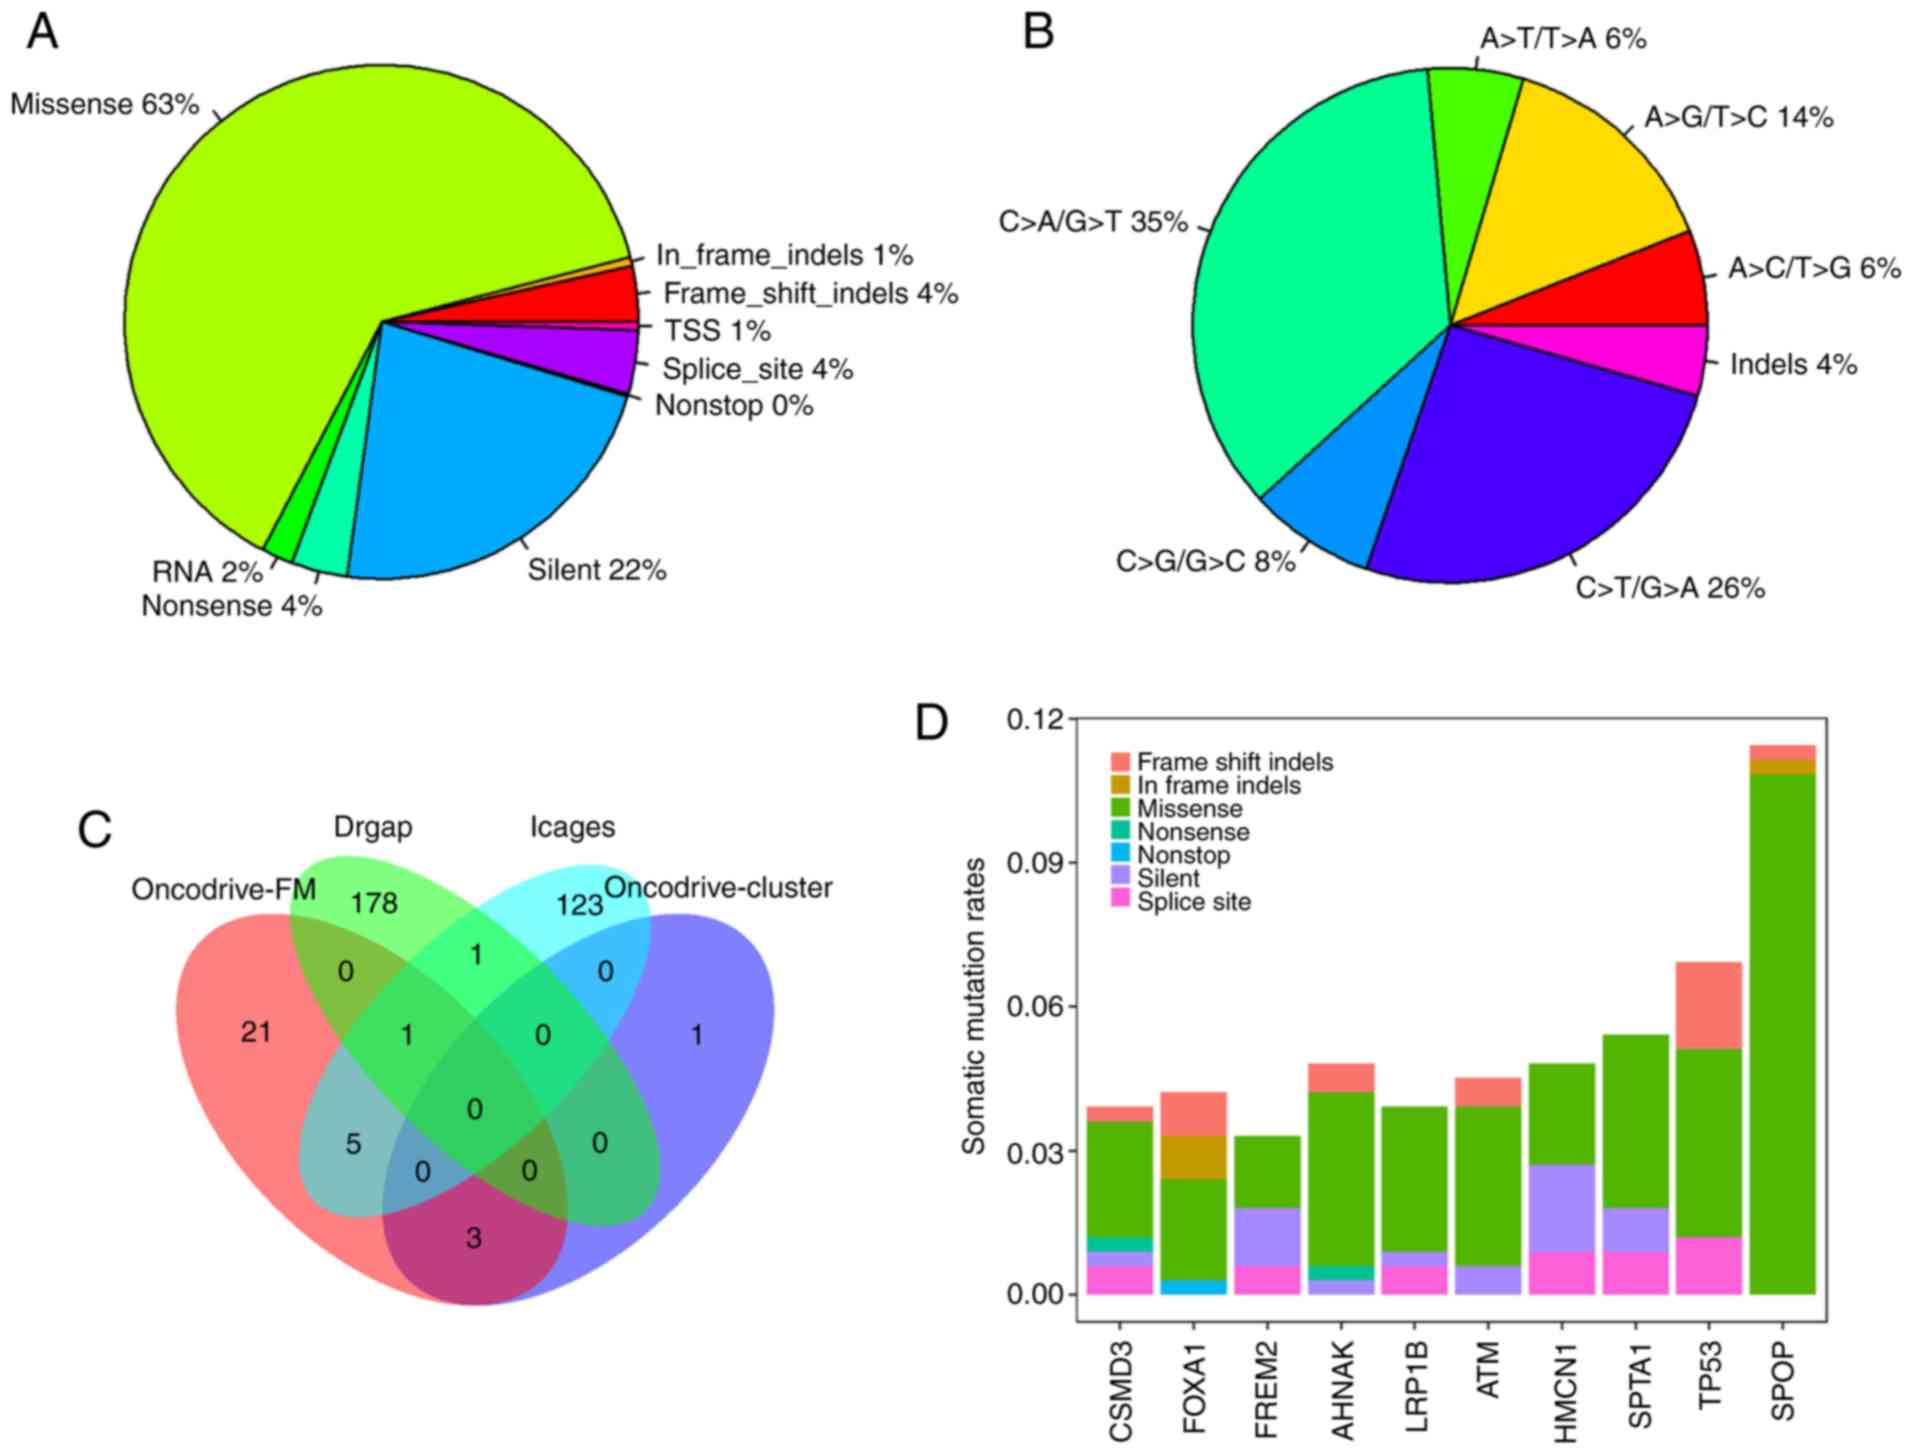
In total, 12,348 somatic mutations were detected in
332 PRAD samples, with an average mutation density of 0.29 somatic
mutations per megabase per sample, which is lower than that
observed in other cancer types, including melanoma and lung cancer
(24). The somatic mutations
comprised 7,816 missense, 2,779 silent, 496 splice-site, 433
nonsense, 246 RNA, 64 TSS, and 12 nonstop mutations, and 402
insertions or deletions (indels). Of the 402 indels, 334 caused
reading frame shifts, and 68 indels were located in open reading
frames. Nonsynonymous mutations accounted for 63.3% (7,816/12,348)
of the variants in PRAD (Fig. 1A).
C>T/G>A, C>T/G>A and A>G/T>C were the three
predominant transitions, with mutation rates of 35.4, 25.8 and
14.4%, respectively (Fig. 1B).
Overall, 7,471 genes were mutated in at least one
PRAD sample. There were four, 30, 130 and 180 driver genes
predicted by OncodriveCLUST, OncodriveFM, iCAGES and DrGaP,
respectively (data not shown). Combining the four sets of driver
genes, a total of 333 unique driver genes were detected by all four
tools. SPOP, FOXA1 and MED12 were overlapping genes
identified by OncodriveCLUST and OncodriveFM. TP53, BRAF,
CTNNB1, BRCA2, SMAD4 and AKT1 were common to OncodriveFM
and iCAGES. ERBB3 and TP53 were common driver genes
to iCAGES and DrGaP. TP53 was the only driver gene predicted
by OncodriveFM, iCAGES and DrGaP (Fig.
1C). Among the 333 driver genes, SPOP, TP53, SPTA1, AHNAK,
HMCN1, ATM, FOXA1, CSMD3, LRP1B and FREM2 were the 10
most recurrently mutated genes in PRAD, with mutation rates of
11.45, 6.93, 5.42, 4.82, 4.82, 4.52, 4.22, 3.92, 3.92 and 3.31%,
respectively, across all PRAD samples (Fig. 1D). By contrast, the majority of
driver genes were low-frequency mutated genes in PRAD, with an
average mutation rate of 0.83% (data not shown). In addition to the
list of driver genes, DrGaP identified 66 driver pathways in PRAD,
including the p53 signalling pathway, the wnt signalling pathway,
the MAPK signalling pathway, glioma, thyroid cancer, apoptosis, and
pathways in cancer (data not shown).
GO terms and KEGG pathway enrichment
analyses
The enrichment of GO terms and KEGG pathways was
analysed for 333 driver genes using the GO and STRING tools. GO
enrichment analysis indicated that driver genes were significantly
overrepresented in 1,563 biological processes (adjusted P<0.05,
data not shown). The main GO biological processes exhibited a wide
spectrum of functional processes, including cell proliferation,
regulation of mitotic cell cycle, cell differentiation, regulation
of apoptotic processes, regulation of cell death, and regulation of
cellular metabolic processes. STRING also revealed 135 KEGG
pathways significantly enriched for driver genes, including
pathways in cancer, chronic myeloid leukaemia, pancreatic cancer,
prostate cancer, melanoma, colorectal cancer, endometrial cancer,
the HIF-1 signalling pathway, the PI3K-Akt signalling
pathway, the mTOR signalling pathway, apoptosis, and cell
cycle (FDR<0.05, data not shown).
Coexpression network analyses in
PRAD
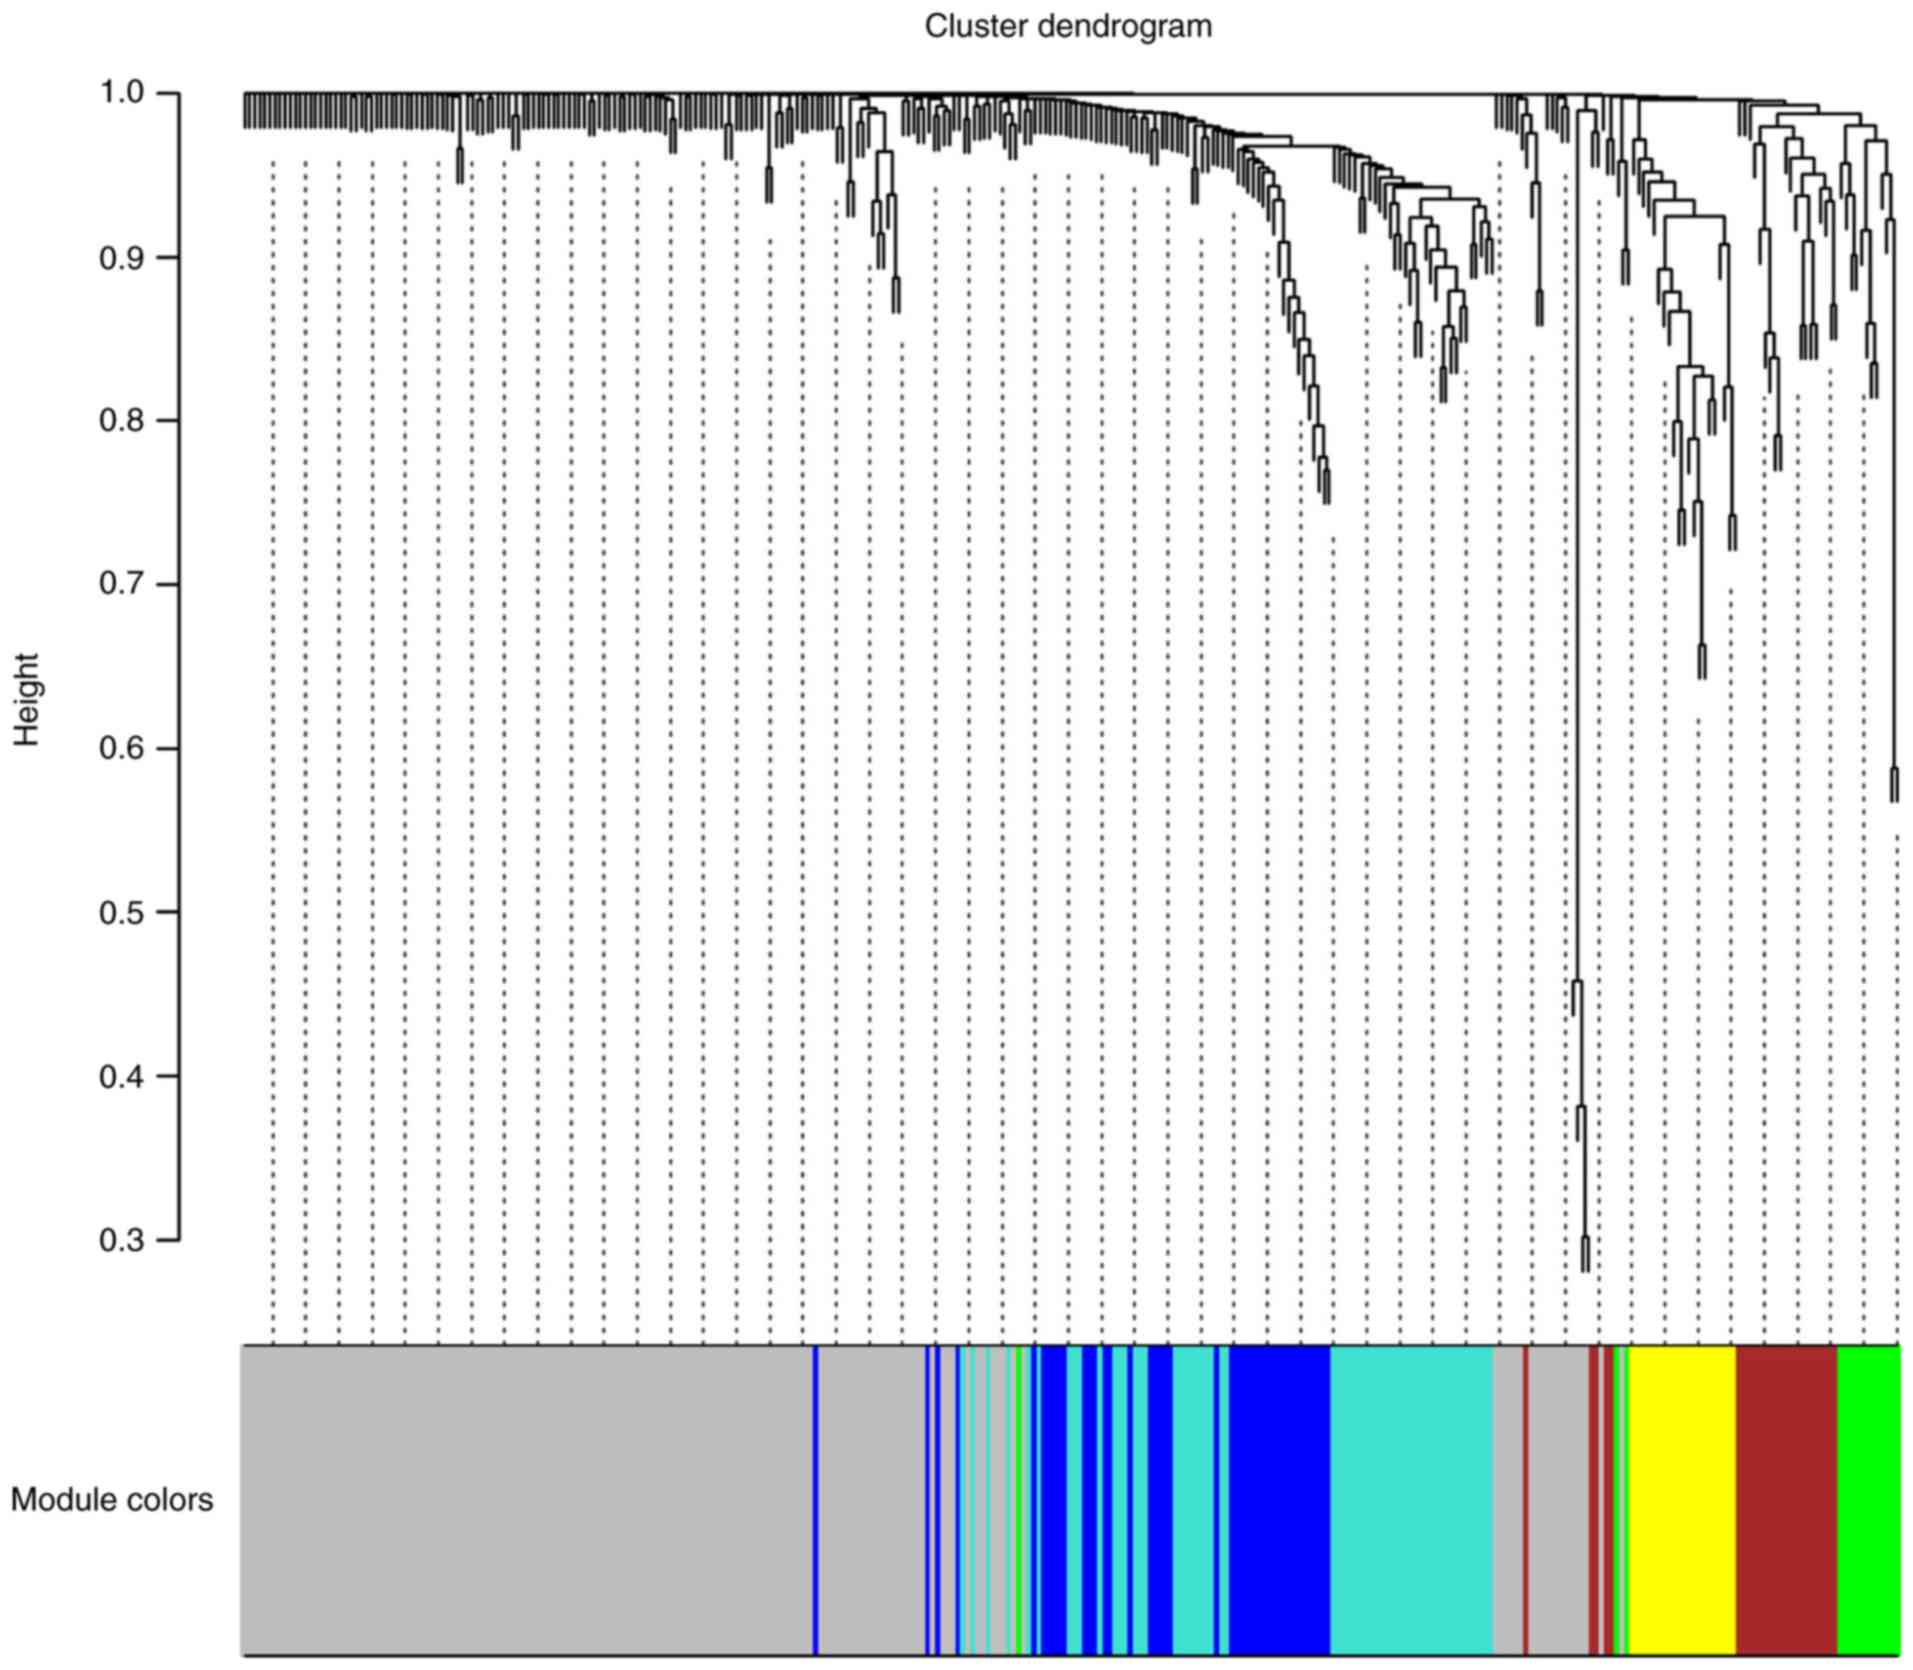
To characterise the coexpression networks of the 333
identified driver genes, WGCNA coexpression networks were
constructed based on the expression correlation between driver
genes in the 497 PRAD samples. As shown in Fig. 2, WGCNA analysis identified six
distinct gene coexpression modules in PRAD. These coexpression
modules are shown in different colours and are arranged from large
to small by the number of genes they included, with 166, 58, 42,
25, 21 and 15 in the grey, turquoise, blue, brown, yellow and green
modules, respectively (Fig. 2).
The module-trait association analysis indicated that the yellow
module was significantly positively correlated with the number of
positive lymph nodes (P<0.05, data not shown). ITGAL, TAGAP,
SIGLEC10, RAC2 and ITGA4 were the top five hub genes in
the yellow module.
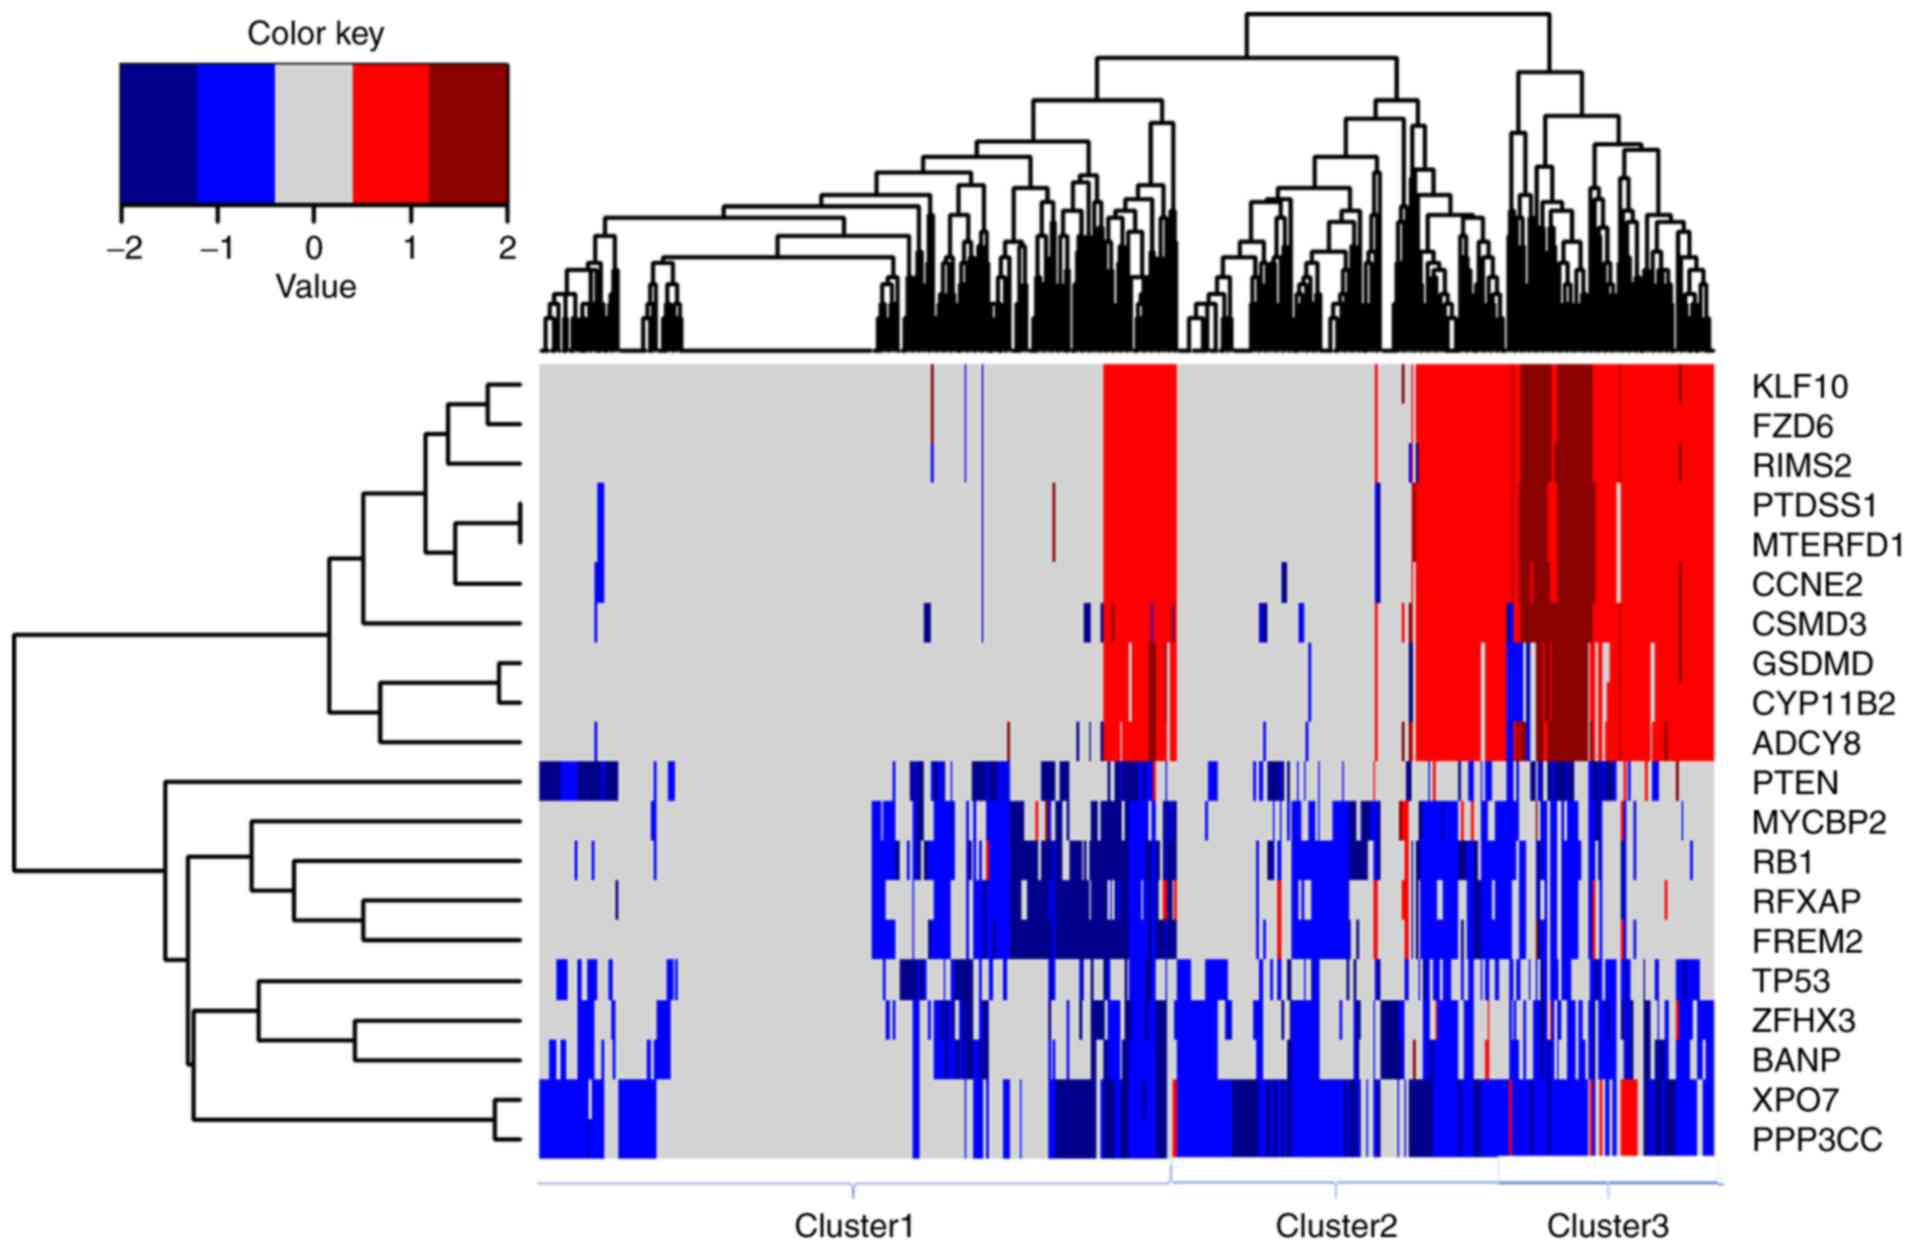
CNV analyses in PRAD
Focal CNVs were obtained for 492 PRAD samples from
the Broad Institute. Significant focal gains and deletions
(Q<0.25) were found at 63 loci (28 amplifications and 35
deletions) in 90.45% (445/492) of the PRAD samples. Among them,
deletions at 8p21.3, 13q14.13, 16q24.1, 16q22.3 and 6q14.3 were the
most frequent CNVs in PRAD, with occurrence rates of 59.15%
(291/492), 45.53% (224/492), 42.68% (210/492), 38.21% (188/492) and
35.98% (177/492), respectively (data not shown). PPP3CC, XPO7,
RB1, BANP, ZFHX3, FREM2, RFXAP, TP53, MYCBP2 and PTEN
were the 10 most frequently deleted driver genes in PRAD, whereas
KLF10, FZD6, MTERFD1, PTDSS1, RIMS2, CCNE2, CSMD3, ADCY8,
CYP11B2 and GSDMD were the 10 most frequently amplified
driver genes in PRAD (Fig. 3).
Hierarchical clustering analysis of these 20 genes revealed three
subgroups of patients with PRAD: Those with minimal CNVs (cluster
1), those with intermediate CNVs (cluster 2) and those with
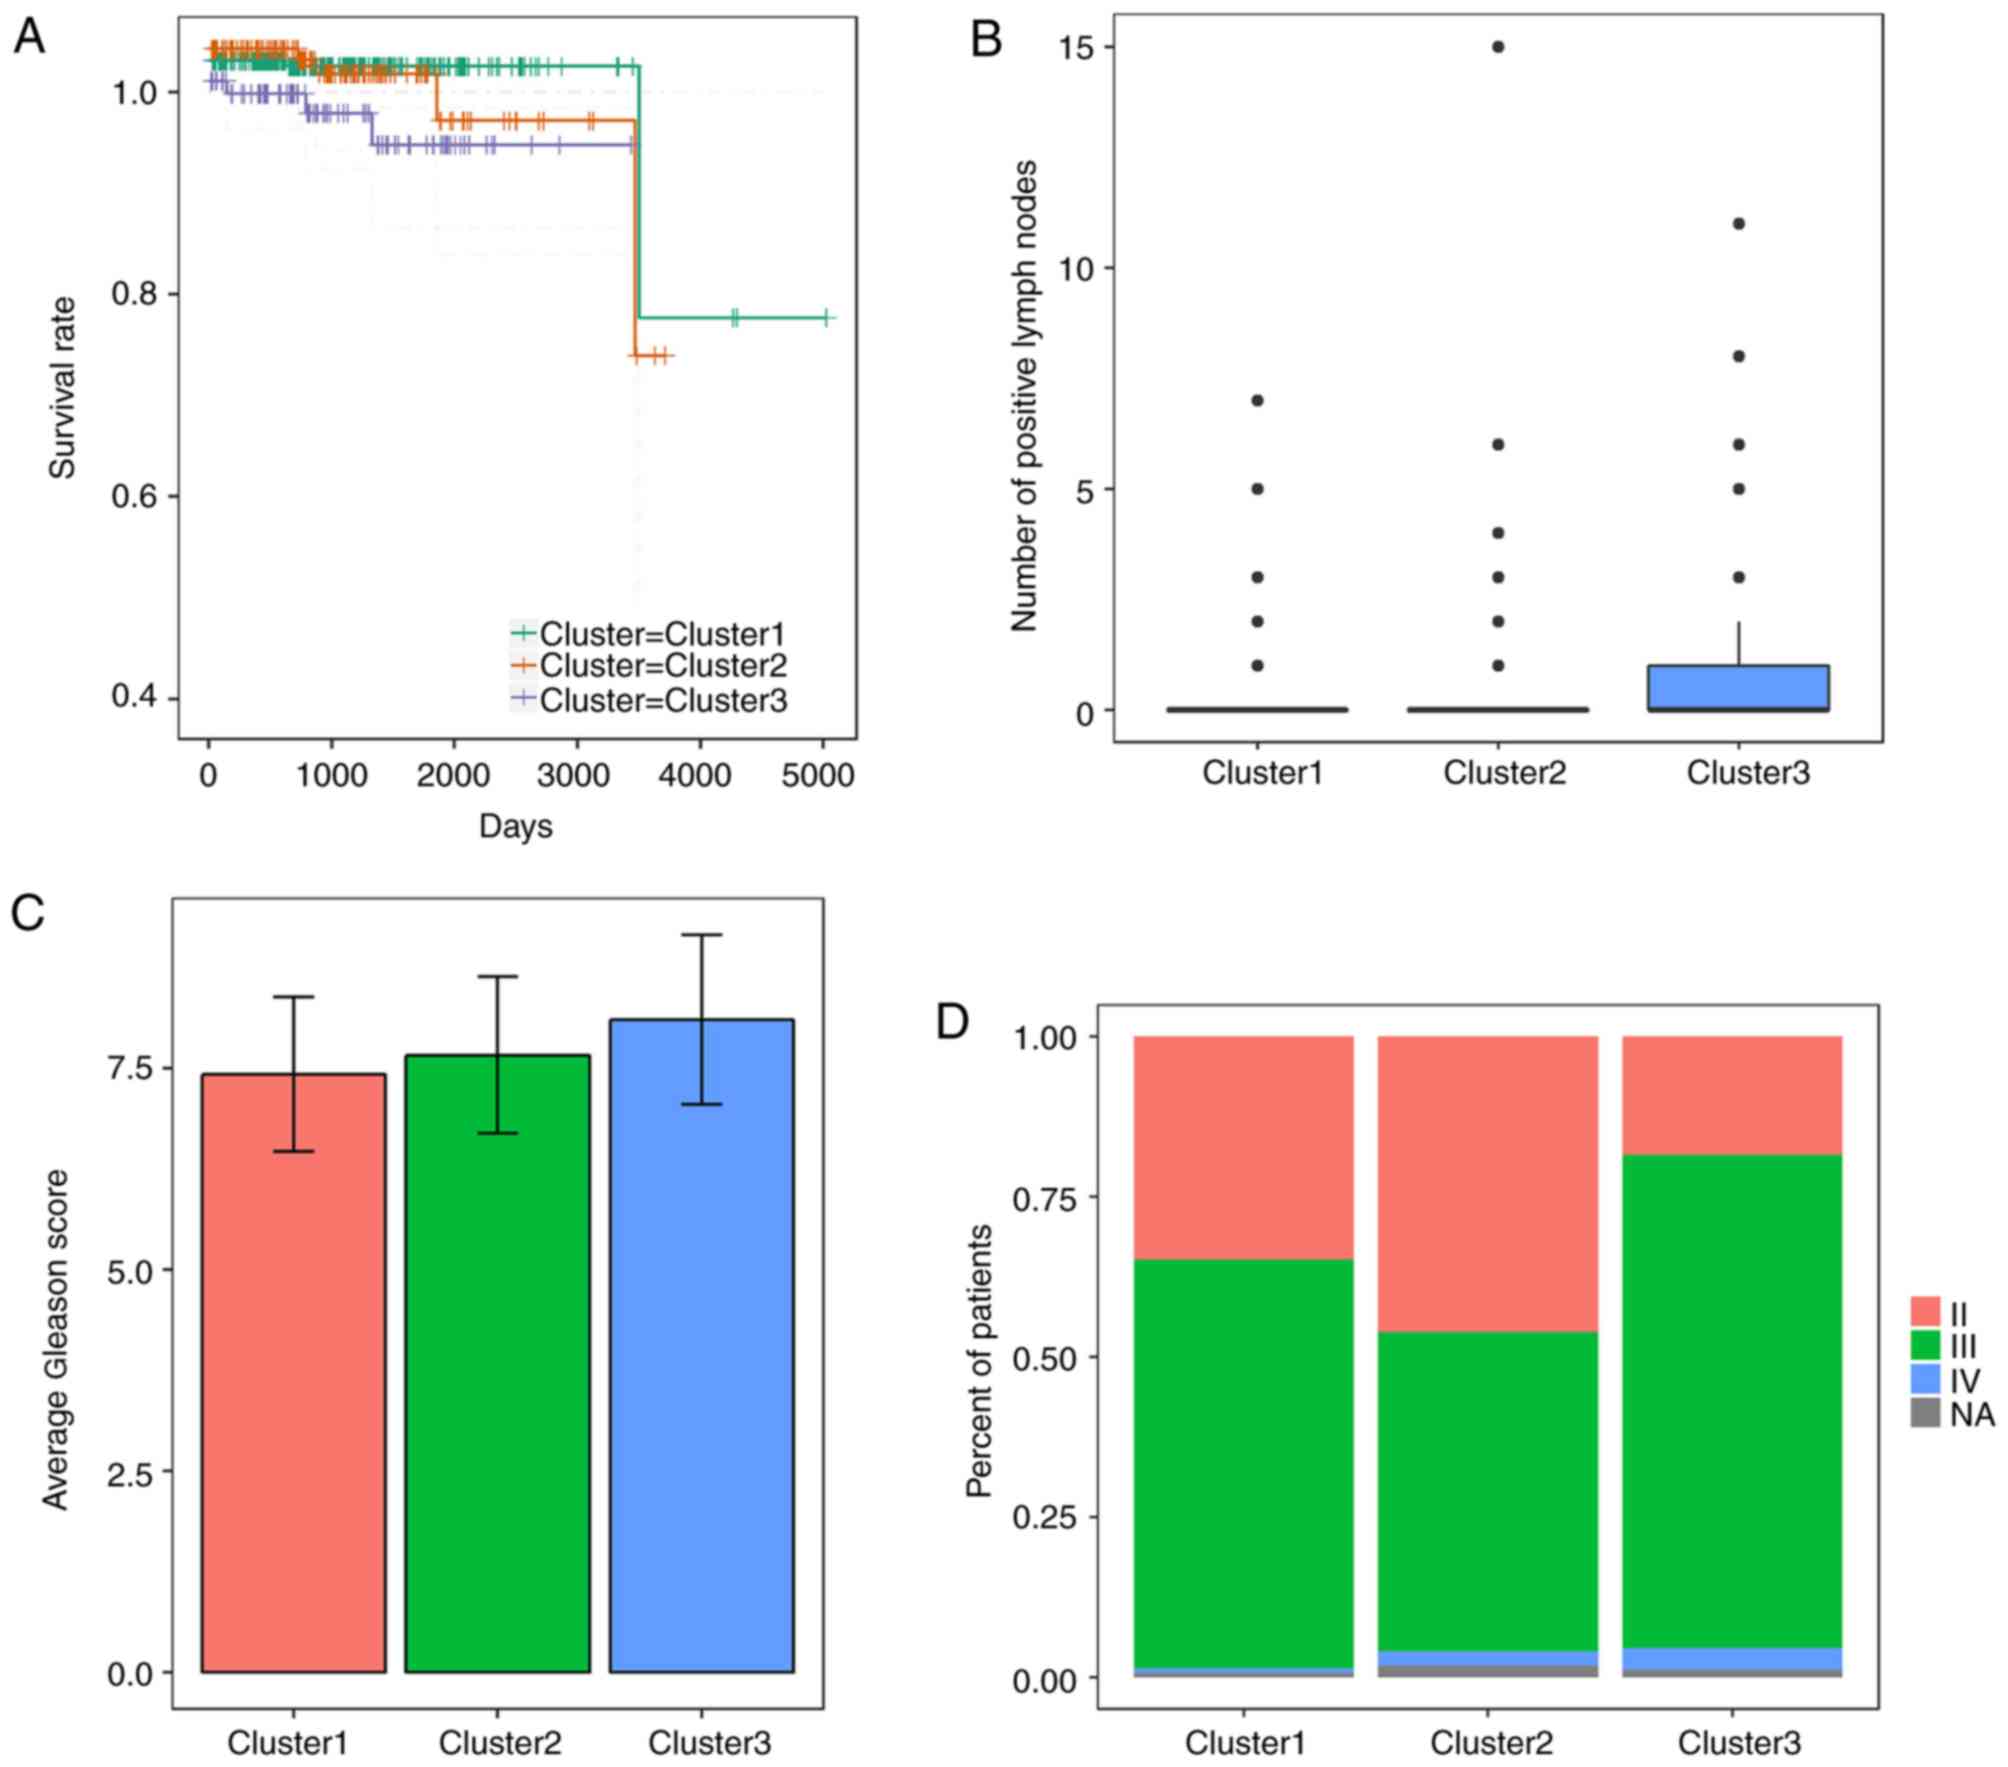
substantial CNVs (cluster 3), as shown in Fig. 3. Patients in the substantially
altered cluster 3 exhibited significantly poorer survival rates
compared with patients in the minimally altered cluster 1 (P=0.02,
log-rank test, Fig. 4A). In
addition, the tumours in cluster 3 exhibited significantly higher
numbers of positive lymph nodes, higher Gleason scores and more
advanced cancer stages than those in clusters 2 or 3 (P<0.05 for
all cases, Wilcoxon sum rank test, Fig. 4B-D).
Clinical features analyses in
PRAD
RNA-seq and clinical features data were acquired
from the TCGA database to evaluate associations between the mRNA
expression of driver genes and the clinical features of patients
with PRAD. Overall, 18 driver genes were significantly correlated
with patient outcome at the cut-off of P<0.05; and TP53 was
frequently deleted in PRAD and significantly associated with
patient prognosis (data not shown). There were a large number of
driver genes negatively correlated with the number of positive
lymph nodes (20 genes, data not shown), Gleason score (51 genes,
data not shown), and pathologic stage (36 genes, data not shown).
Similarly, several genes were positively correlated with the number
of positive lymph nodes (38 genes, data not shown), Gleason score
(101 genes, data not shown), and pathologic stage (78 genes, data
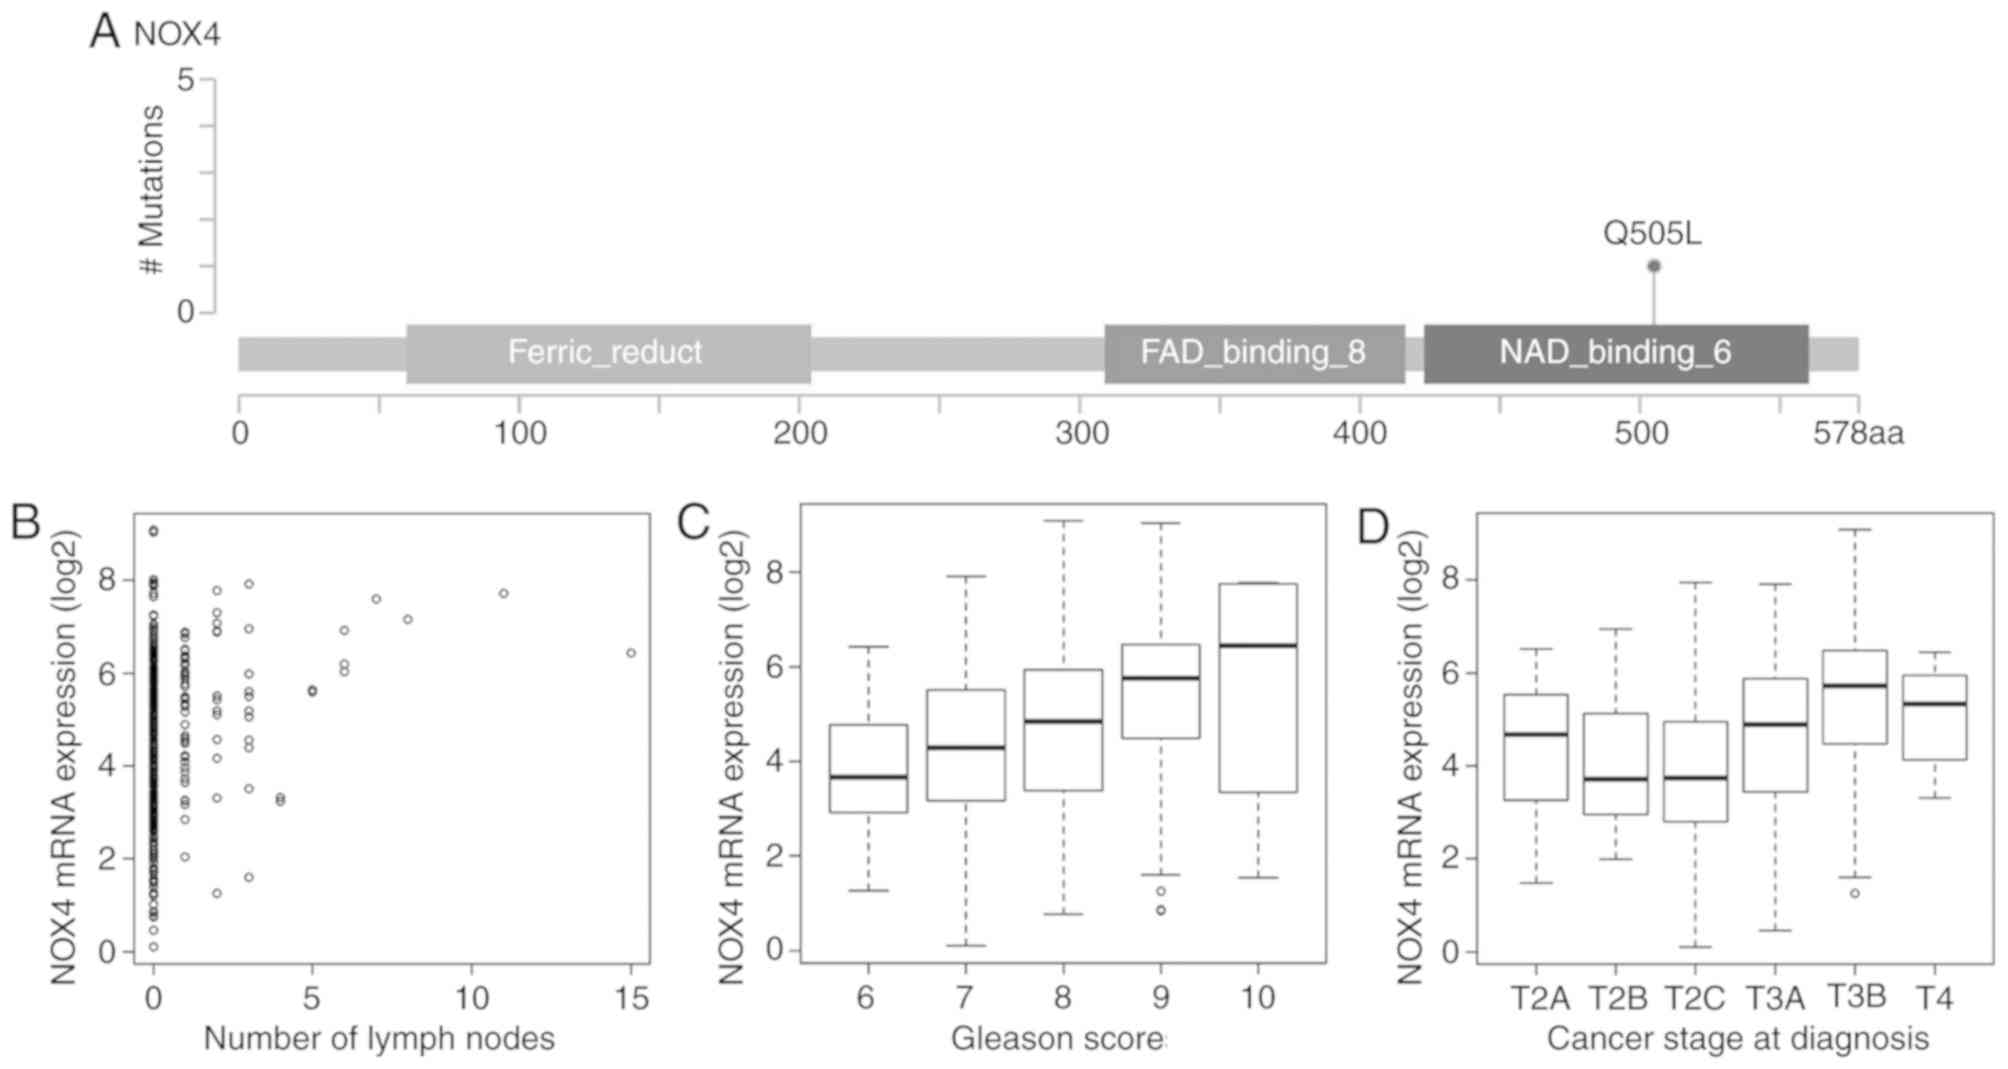
not shown). A total of 48 genes were significantly associated with
the number of positive lymph nodes, Gleason scores, and pathologic
stage, including NOX4, SPOP, BRCA1, BRCA2, SMAD4 and
TMED10 (Fig. 5A-D, Table I), suggesting that they may
represent potential druggable targets for patients with PRAD.
 | Table I.Associations between clinical
features and expression of NOX4, SPOP, BRCA1, BRCA2, SMAD4
and TMED10. |
Table I.
Associations between clinical
features and expression of NOX4, SPOP, BRCA1, BRCA2, SMAD4
and TMED10.
|
| Number of lymph
nodes | Gleason score | Cancer stage |
|---|
|
|
|
|
|
|---|
| Gene | Correlation
coefficient | P-value | Q-value | Correlation
coefficient | P-value | Q-value | Correlation
coefficient | P-value | Q-value |
|---|
| NOX4 | 0.21 | <0.01 | <0.01 | 0.34 | <0.01 | <0.01 | 0.33 | <0.01 | <0.01 |
| SPOP | −0.18 | <0.01 | <0.01 | −0.24 | <0.01 | <0.01 | −0.13 | <0.01 | 0.02 |
| BRCA1 | 0.15 | <0.01 | 0.02 | 0.22 | <0.01 | <0.01 | 0.15 | <0.01 | 0.01 |
| BRCA2 | 0.16 | <0.01 | 0.01 | 0.25 | <0.01 | <0.01 | 0.21 | <0.01 | <0.01 |
| SMAD4 | −0.18 | <0.01 | 0.01 | −0.18 | <0.01 | 0.01 | −0.13 | <0.01 | 0.02 |
| TMED10 | −0.17 | <0.01 | 0.01 | −0.27 | <0.01 | <0.01 | −0.19 | <0.01 | <0.01 |
Validation of randomised selection of
patients with PRAD
The datasets used for somatic mutation, coexpression
network, clinical feature and CNV analyses were distinct patient
cohorts. To evaluate heterogeneity across the different cohorts,
clinical characteristics were compared among the three cohorts of
patients with PRAD. There were no significant differences in
patient age, number of positive lymph nodes, Gleason scores
(P>0.05 for all cases, Wilcoxon sum rank test, Table II), patient cancer stage (P=1,
Pearson's χ2 test, Table
II) or survival status (P>0.05 for all cases, log-rank test,
Table II and data not shown).
These results suggested that the cohorts of patients with PRAD were
randomly selected and did not significantly affect the findings of
the present study.
| Table II.Comparison of clinical
characteristics among three cohorts of patients with prostate
adenocarcinoma for analysis of somatic mutation, WGCNA, clinical
features and CNVs. |
Table II.
Comparison of clinical
characteristics among three cohorts of patients with prostate
adenocarcinoma for analysis of somatic mutation, WGCNA, clinical
features and CNVs.
| Dataset | Age (years) | Cancer stage
(number of patients) T2A/T2B/T2C/T3A/T3B/T4 | Number of lymph
nodes | Gleason score | Survival (patients
alive/deceased) |
|---|
| Dataset for somatic
mutation analysis (332 patients) | 60.63±6.88 |
9/7/111/111/83/6 | 0.4±1.3 | 7.58±0.98 | 7/325 |
| Dataset for WGCNA
and clinical feature analyses (497 patients) | 61.04±6.81 |
13/10/164/158/135/10 | 0.45±1.37 | 7.61±1.01 | 10/487 |
| Dataset for CNV
analysis (492 patients) | 60.98±6.8 |
13/10/164/156/132/10 | 0.43±1.36 | 7.61±1.01 | 9/483 |
| Statistical
results | P>0.05 for all
cases | P=1.00 | P>0.05 for all
cases | P>0.05 for all
cases | P>0.05 for all
cases |
Discussion
Cancer is a disease caused by the acquisition of
somatic driver mutations that confer a growth advantage to cells
(25). Genes carrying driver
mutations serve a pivotal role in the formation and progression of
cancer and have become a focus of investigations in cancer genomics
(4,26–29).
The common approach for detecting driver genes attempts to identify
genes that are significantly mutated in a cohort of cancer samples
compared with the background mutation rate (24,30).
However, current understanding of driver genes with low mutation
frequencies remains limited. In the present study, four
computational tools were used to identify 333 cancer driver genes
in 332 PRAD samples. In line with previously published studies,
SPOP, TP53, FOXA1, PTEN, RB1, PIK3CA and MED12 were
found to be driver genes in PRAD (4,26).
TP53, PTEN and RB1, which are prostate cancer tumour
suppressors, were commonly altered in PRAD but primarily through
copy-number loss rather than point mutations. Compared with
annotated oncogene (31) and
tumour suppressor gene (32)
databases, the present study identified several known oncogenes,
including BRAF, CTNNB1, PIK3CA, EGFR, HRAS and CDH1,
and tumour suppressor genes, including ATM, BRCA1, BRCA2,
BAP1 and LRP1B. The majority of driver genes exhibited
low mutation frequencies, with an average mutation rate of 0.83%,
and were identified as driver genes in PRAD for the first time, to
the best of our knowledge; these included BCOR, FRG1B,
GABRA6 and LRP1B. Four computational tools were used to
determine driver genes based on complementary principles
independent of mutation recurrence, enabling the identification of
recurrent and rarely mutated driver genes in a more comprehensive
manner than using MutSig alone, as in a previous study (26). These newly identified driver genes
pave the way for further experimental validation in future
investigations.
In the present study, six coexpressed modules were
identified, of which the yellow module was associated with the
number of positive lymph nodes. ITGAL, TAGAP, SIGLEC10, RAC2
and ITGA4 were the top five hub genes in the yellow module,
suggesting that these genes have a large number of interactions
with other genes. Therefore, these genes may act as key genes in
the coexpression network. Hierarchical clustering analysis of 20
genes that were most frequently deleted or amplified revealed three
subgroups of patients with PRAD. Cluster 3 tumours exhibited
substantial CNVs in 20 driver genes and were associated with
increased numbers of positive lymph nodes, Gleason scores and
cancer stages, and a poor prognosis. Therefore, CNV analysis of
these 20 genes may be of clinical value in the near future.
Cytologic or surgical specimens of PRAD exhibiting high levels of
CNVs in these 20 genes are expected to be associated with a poor
prognosis. Therefore, more aggressive treatment or frequent
follow-up may be recommended for these patients.
Finally, 48 genes were significantly associated with
the number of positive lymph nodes, Gleason scores and pathologic
stage, including NOX4, SPOP, BRCA1, BRCA2, SMAD4 and
TMED10. The NOX4 gene encodes a member of the NOX
family of enzymes that functions as the catalytic subunit in the
NADPH oxidase complex. The encoded protein localises to
nonphagocytic cells, where it acts as an oxygen sensor and
catalyses the reduction of molecular oxygen to various reactive
oxygen species (33). NOX4
gene deletions are frequent in patients with hepatocellular
carcinoma, correlating with higher tumour grade. The loss of
NOX4 increases actomyosin levels and favours an epithelial
to amoeboid transition, contributing to tumour aggressiveness
(34). The increased expression of
NOX4 enhances cancer growth, progression and metastasis in
HeLa cells (35), renal cell
carcinoma (36) and glioma
(37). The expression of
NOX4 is upregulated in prostate cancer (38), and the NOX4 inhibitor
diphenyliodonium inhibits reactive oxygen species generation, which
decreases cell proliferation and cell migration and induces G2-M
cell cycle arrest in prostate cancer cells (39). The results obtained in the present
study, in combination with previously published reports, indicate
that NOX4 exerts oncogenic functions in cancer.
Acknowledgements
Not applicable.
Funding
No funding was received.
Availability of data and materials
The datasets generated and/or analysed in the
present study are available from the corresponding author on
reasonable request.
Authors' contributions
RJ designed and guided the study. GL, YC and HY
downloaded multiple omics data of somatic mutations, RNA-seq, CNVs
and patient clinical features from TCGA. XZ and YL predicted driver
genes and pathways using four computational tools, and conducted
WGCNA co-expression, CNV and clinical features analyses. LX and HL
conducted the validation of randomized selection of PRAD patients
and provided statistical advice. XZ, LX and HL wrote the
manuscript. All authors read and approved the final manuscript.
Ethics approval and consent to
participate
Not applicable.
Patient consent for publication
Not applicable.
Competing interests
The authors declare that they have no competing
interests.
Glossary
Abbreviations
Abbreviations:
|
PRAD
|
prostate adenocarcinoma
|
|
TCGA
|
The Cancer Genome Atlas
|
|
TSS
|
transcription start site
|
|
iCAGES
|
integrated CAncer GEnome Score
|
|
GO
|
Gene Ontology
|
|
WGCNA
|
weighted correlation network
analysis
|
|
KEGG
|
Kyoto Encyclopaedia of Genes and
Genomes
|
|
STRING
|
Search Tool for the Retrieval of
Interacting Genes/Proteins
|
|
CNV
|
copy number variation
|
|
FDR
|
false discovery rate
|
References
|
1
|
Jemal A, Bray F, Center MM, Ferlay J, Ward
E and Forman D: Global Cancer Statistics. CA Cancer J Clin.
61:69–90. 2011. View Article : Google Scholar : PubMed/NCBI
|
|
2
|
Grignon DJ: Unusual subtypes of prostate
cancer. Mod Pathol. 17:316–327. 2004. View Article : Google Scholar : PubMed/NCBI
|
|
3
|
Shen MM and Abate-Shen C: Molecular
genetics of prostate cancer: New prospects for old challenges.
Genes Dev. 24:1967–2000. 2010. View Article : Google Scholar : PubMed/NCBI
|
|
4
|
Barbieri CE, Baca SC, Lawrence MS,
Demichelis F, Blattner M, Theurillat JP, White TA, Stojanov P, Van
Allen E, Stransky N, et al: Exome sequencing identifies recurrent
SPOP, FOXA1 and MED12 mutations in prostate cancer. Nat Genet.
44:685–689. 2012. View
Article : Google Scholar : PubMed/NCBI
|
|
5
|
Taylor BS, Schultz N, Hieronymus H,
Gopalan A, Xiao Y, Carver BS, Arora VK, Kaushik P, Cerami E, Reva
B, et al: integrative genomic profiling of human prostate cancer.
Cancer Cell. 18:11–22. 2010. View Article : Google Scholar : PubMed/NCBI
|
|
6
|
Cancer Genome Atlas Research Network, .
The molecular taxonomy of primary prostate cancer. Cell.
163:1011–1025. 2015. View Article : Google Scholar : PubMed/NCBI
|
|
7
|
Wood LD, Parsons DW, Jones S, Lin J,
Sjöblom T, Leary RJ, Shen D, Boca SM, Barber T, Ptak J, et al: The
genomic landscapes of human breast and colorectal cancers. Science.
318:1108–1113. 2007. View Article : Google Scholar : PubMed/NCBI
|
|
8
|
Chen Y, Cunningham F, Rios D, McLaren WM,
Smith J, Pritchard B, Spudich GM, Brent S, Kulesha E, Marin-Garcia
P, et al: Ensembl variation resources. BMC Genomics. 11:2932010.
View Article : Google Scholar : PubMed/NCBI
|
|
9
|
Tamborero D, Gonzalez-perez A and
Lopez-bigas N: Genome analysis OncodriveCLUST: Exploiting the
positional clustering of somatic mutations to identify cancer
genes. Bioinformatics. 29:2238–2244. 2013. View Article : Google Scholar : PubMed/NCBI
|
|
10
|
Gonzalez-Perez A and Lopez-Bigas N:
Functional impact bias reveals cancer drivers. Nucleic Acids Res.
40:e1692012. View Article : Google Scholar : PubMed/NCBI
|
|
11
|
Sim NL, Kumar P, Hu J, Henikoff S,
Schneider G and Ng PC: SIFT web server: Predicting effects of amino
acid substitutions on proteins. Nucleic Acids Res 40 (Web Server
Issue). W452–W457. 2012. View Article : Google Scholar
|
|
12
|
Adzhubei IA, Schmidt Peshkin L, Ramensky
VE, Gerasimova A, Bork P, Kondrashov AS and Sunyaev SR: A method
and server for predicting damaging missense mutations. Nat Methods.
7:248–249. 2010. View Article : Google Scholar : PubMed/NCBI
|
|
13
|
Reva B, Antipin Y and Sander C: Predicting
the functional impact of protein mutations: Application to cancer
genomics. Nucleic Acids Res. 39:e1182011. View Article : Google Scholar : PubMed/NCBI
|
|
14
|
González-Pérez A and López-Bigas N:
Improving the assessment of the outcome of nonsynonymous SNVs with
a consensus deleteriousness score, Condel. Am J Hum Genet.
88:440–449. 2011. View Article : Google Scholar : PubMed/NCBI
|
|
15
|
Dong C, Guo Y, Yang H, He Z, Liu X and
Wang K: iCAGES: integrated cancer genome score for comprehensively
prioritizing driver genes in personal cancer genomes. Genome Med.
8:1352016. View Article : Google Scholar : PubMed/NCBI
|
|
16
|
Hua X, Xu H, Yang Y, Zhu J, Liu P and Lu
Y: DrGaP: A powerful tool for identifying driver genes and pathways
in cancer sequencing studies. Am J Hum Genet. 93:439–451. 2013.
View Article : Google Scholar : PubMed/NCBI
|
|
17
|
The Gene Ontology Consortium, ; Ashburner
M, Ball CA, Blake JA, Botstein D, Butler H, Cherry JM, Davis AP,
Dolinski K, Dwight SS, et al: Tool for the unification of biology.
Nat Genet. 25:25–29. 2000. View
Article : Google Scholar : PubMed/NCBI
|
|
18
|
Szklarczyk D, Morris JH, Cook H, Kuhn M,
Wyder S, Simonovic M, Santos A, Doncheva NT, RothA, BorkP, et al:
The STRING database in 2017: Quality-controlled protein-protein
association networks, made broadly accessible. Nucleic Acids Res 45
(Database Issue). D362–D368. 2017. View Article : Google Scholar
|
|
19
|
Langfelder P and Horvath S: WGCNA: An R
package for weighted correlation network analysis. BMC
Bioinformatics. 9:5592008. View Article : Google Scholar : PubMed/NCBI
|
|
20
|
Mermel CH, Schumacher SE, Hill B, Meyerson
ML, Beroukhim R and Getz G: GISTIC2.0 facilitates sensitive and
confident localization of the targets of focal somatic copy-number
alteration in human cancers. Genome Biol. 12:R412011. View Article : Google Scholar : PubMed/NCBI
|
|
21
|
Warnes G, Bolker B, Bonebakker L,
Gentleman R, Huber W, Liaw A, Lumley T, Mächler M, Magnusson A and
Möller S: gplots: Various R programming tools for plotting data.
2005.
|
|
22
|
Therneau TM: Survival analysis. https://cran.r-project.org/web/packages/survival/survival.pdfNovember
27–2018
|
|
23
|
Andersen PK and Gill RD: Cox's regression
model for counting processes: A large sample study. Ann Stat.
10:1100–1120. 1982. View Article : Google Scholar
|
|
24
|
Lawrence MS, Stojanov P, Polak P, Kryukov
GV, Cibulskis K, Sivachenko A, Carter SL, Stewart C, Mermel CH,
Roberts SA, et al: Mutational heterogeneity in cancer and the
search for new cancer-associated genes. Nature. 499:214–218. 2013.
View Article : Google Scholar : PubMed/NCBI
|
|
25
|
Greenman C, Stephens P, Smith R, Dalgliesh
GL, Hunter C, Bignell G, Davies H, Teague J, Butler A, Stevens C,
et al: Patterns of somatic mutation in human cancer genomes.
Nature. 446:153–158. 2007. View Article : Google Scholar : PubMed/NCBI
|
|
26
|
Grasso CS, Wu YM, Robinson DR, Cao X,
Dhanasekaran SM, Khan AP, Quist MJ, Jing X, Lonigro RJ, Brenner JC,
et al: The mutational landscape of lethal castration-resistant
prostate cancer. Nature. 487:239–243. 2012. View Article : Google Scholar : PubMed/NCBI
|
|
27
|
Cancer Genome Atlas Research Network, .
Comprehensive molecular profiling of lung adenocarcinoma. Nature.
511:543–550. 2014. View Article : Google Scholar : PubMed/NCBI
|
|
28
|
Sato Y, Yoshizato T, Shiraishi Y, Maekawa
S, Okuno Y, Kamura T, Shimamura T, Sato-Otsubo A, Nagae G, Suzuki
H, et al: Integrated molecular analysis of clear-cell renal cell
carcinoma. Nat Genet. 45:860–867. 2013. View Article : Google Scholar : PubMed/NCBI
|
|
29
|
Cancer Genome Atlas Research Network, .
Integrated genomic characterization of papillary thyroid carcinoma.
Cell. 159:676–690. 2014. View Article : Google Scholar : PubMed/NCBI
|
|
30
|
Dees ND, Zhang Q, Kandoth C, Wendl MC,
Schierding W, Koboldt DC, Mooney TB, Callaway MB, Dooling D, Mardis
ER, et al: MuSiC: Identifying mutational significance in cancer
genomes. Genome Res. 22:1589–1598. 2012. View Article : Google Scholar : PubMed/NCBI
|
|
31
|
Liu Y, Sun J and Zhao M: ONGene: A
literature-based database for human oncogenes. J Genet Genomics.
44:119–121. 2017. View Article : Google Scholar : PubMed/NCBI
|
|
32
|
Zhao M, Sun J and Zhao Z: TSGene: A web
resource for tumor suppressor genes. Nucleic Acids Res 41 (Database
Issue). D970–D976. 2013. View Article : Google Scholar
|
|
33
|
Nisimoto Y, Diebold BA, Constentino-Gomes
D and Lambeth JD: Nox4: A hydrogen peroxide-generating oxygen
sensor. Biochemistry. 53:5111–5120. 2014. View Article : Google Scholar : PubMed/NCBI
|
|
34
|
Crosas-Molist E, Bertran E,
Rodriguez-Hernandez I, Herraiz C, Cantelli G, Fabra À, Sanz-Moreno
V and Fabregat I: The NADPH oxidase NOX4 represses epithelial to
amoeboid transition and efficient tumour dissemination. Oncogene.
36:3002–3014. 2017. View Article : Google Scholar : PubMed/NCBI
|
|
35
|
Jafari N, Kim H, Park R, Li L, Jang M,
Morris AJ, Park J and Huang C: CRISPR-Cas9 mediated NOX4 knockout
inhibits cell proliferation and invasion in HeLa cells. PLoS One.
12:e01703272017. View Article : Google Scholar : PubMed/NCBI
|
|
36
|
Gregg JL, Turner RM II, Chang G, Joshi D,
Zhan Y, Chen L and Maranchie JK: NADPH oxidase NOX4 supports renal
tumorigenesis by promoting the expression and nuclear accumulation
of HIF2α. Cancer Res. 74:3501–3511. 2014. View Article : Google Scholar : PubMed/NCBI
|
|
37
|
Shono T, Yokoyama N, Uesaka T, Kuroda J,
Takeya R, Yamasaki T, Amano T, Mizoguchi M, Suzuki SO, Niiro H, et
al: Enhanced expression of NADPH oxidase Nox4 in human gliomas and
its roles in cell proliferation and survival. Int J Cancer.
123:787–792. 2008. View Article : Google Scholar : PubMed/NCBI
|
|
38
|
Meitzler JL, Makhlouf HR, Antony S, Wu Y,
Butcher D, Jiang G, Juhasz A, Lu J, Dahan, Jansen-Dürr P, et al:
Decoding NADPH oxidase 4 expression in human tumors. Redox Biol.
13:182–195. 2017. View Article : Google Scholar : PubMed/NCBI
|
|
39
|
Kumar B, Koul S, Khandrika L, Meacham RB
and Koul HK: Oxidative stress is inherent in prostate cancer cells
and is required for aggressive phenotype. Cancer Res. 68:1777–1785.
2008. View Article : Google Scholar : PubMed/NCBI
|