Introduction
Macrosomia is a common perinatal complication that
has been defined as a full-term infant with a birth weight of
≥4,000 g. In recent decades, the incidence of macrosomia has been
increasing, affecting 15–45% of newborns of women with gestational
diabetes mellitus and 12% of newborns of women without gestational
diabetes mellitus (1). Compared
to normal infants, macrosomia increases the risk of childhood
obesity, adult obesity, hypertension, diabetes and other
age-related diseases (2,3). Diabetes is a risk factor for the
development of macrosomia (1,4);
however, an effective possible strategy for the prevention and
treatment of non-diabetic fetal macrosomia (NDFMS) has not yet been
proposed, at least to the best of our knowledge. The underlying
pathogenesis of NDFMS remains unclear and further studies are
required.
The placenta is composed of the amniotic membrane,
leaf-shaped chorion and maternal decidua. The placenta is the
interface of nutrition exchange between the mother and fetus, which
is essential for the maintenance of the normal functional fetal
development (5,6). Therefore, abnormal placental
development and placental dysfunction adversely affect fetal growth
(7–9). The proliferation and apoptosis of
placental trophoblasts play a key role in the development and
maturation of the placenta during pregnancy. Previous studies have
demonstrated that the excessive proliferation and reduced apoptosis
of placental trophoblasts result in the occurrence of diabetic
fetal macrosomia (10,11). However, there is only limited
information available regarding the molecular mechanisms of
placental development in NDFMS (12,13).
Long non-coding RNAs (lncRNAs), which have a length
of >200 nucleotides, play a crucial role in disease development,
by regulating the mechanisms of DNA methylation, histone
modification, post-transcriptional regulation, RNA interference,
imprinted genes and microRNA regulation (14–17). Previous studies have reported that
lncRNAs may potentially participate in the pathogenesis of
placental development (18–22); however, the specific biological
effects of lncRNAs remain largely unknown, particularly concerning
the regulatory role of ubiquitin-specific peptidase 2 antisense RNA
1 (USP2-AS1) in NDFMS.
In the present study, the expression profiles of
lncRNAs in the placentas of pregnant women with NDFMS group and
healthy controls were examined using an Agilent Human LncRNA
Microarray, containing 40,916 lncRNA probes. Subsequently, 10
lncRNAs (|FC| ≥4.0, signal value ≥50) from the microarray results
were selected for validation using reverse
transcription-quantitative polymerase chain reaction (RT-qPCR).
Furthermore, the function of lncRNA USP2-AS1 was
investigated using HTR-8/SVneo, a trophoblast cell line. The
present study aimed to provide new insight into the potential
pathogenesis of NDFMS by analyzing the role of lncRNAs in placental
development.
Materials and methods
Sample collection
The placental tissues used in the present study were
provided by Changzhou Maternal and Child Health Care Hospital
during the period from September, 2014 to June, 2015. A total of 96
participants were enrolled in the present study, including 48
pregnant women with NDFMS (newborn weight, ≥4,000 g) and 48 women
with normal pregnancies (newborn birth weight, ≥2,500 g and
<4,000 g). All participants were monotocous primigravida with
full-term birth (≥37 weeks and <42 weeks). The mothers in both
groups were free of diabetes or other complications (placental
abruption, gestational hypertension, placenta previa, and other
complications) during pregnancy. Following the removal of the
placental tissue fetal membranes, three sections of placental
tissues were randomly collected. Subsequently, the placental
tissues were immediately stored at −80°C. The present study was
conducted in compliance with the Declaration of Helsinki, and the
protocol was approved by the Institutional Review Board of Nanjing
Medical University (approval no. FWA00001501). Written informed
consent was obtained from all pregnant women prior to their
participation in the present study.
RNA extraction and RT-qPCR
Total RNA was extracted from the placental tissues
and cultured cells using TRIzol® reagent (Invitrogen;
Thermo Fisher Scientific, Inc.), according to the manufacturer's
protocol. Placental tissues of appropriate size were placed in
TRIzol® for RNA extraction. All procedures were
performed on ice, to prevent RNA degradation. The concentration and
purity of the RNA were measured using a NanoDrop 2000
spectrophotometer (Thermo Fisher Scientific, Inc.), and
electrophoresis with 1.5% denaturing agarose gels was used to
assess RNA integrity. The PrimeScript RT reagent kit (Takara Bio,
Inc.) was used to reverse transcribe the RNA samples into cDNA
(RR036A; Takara Bio, Inc.), and qPCR was performed using
SYBR® Premix Ex Taq™ on a LightCycler 480 II real-time
fluorescent quantitative PCR system (Roche Diagnostics). For
reverse transcription, the thermal cycling conditions were: 37°C
for 15 min, 85°C for 5 sec and 4°C to end the reaction. For qPCR,
the thermal cycling conditions consisted of a step of denaturation
at 95°C for 10 min, 40 cycles at 95°C for 15 sec and 60°C for 1
min. The 2−∆ΔCq method was used for the calculation of
lncRNA relative expression levels. GAPDH was used as an
internal control for lncRNA quantification (23). All the reactions were run in
triplicate. The primer sequences for RT-qPCR are listed in Table I.
 | Table I.Sequences of primers for lncRNAs used
in RT-qPCR. |
Table I.
Sequences of primers for lncRNAs used
in RT-qPCR.
| lncRNA ID | Gene symbol | Primers | Sequences
(5′-3′) |
|---|
|
ENST00000580048.1 |
ENSG00000264247.1 | Forward |
TCACATCCCATGGCCAGAAG |
|
|
| Reverse |
GCCACAGGTAGAGCTGACAC |
|
ENST00000453774.1 |
ENSG00000228262.2 | Forward |
GGCCATGGCTTCAACTAGACT |
|
|
| Reverse |
AGAAAAGGAAGTGAGCACGGG |
|
ENST00000604250.1 |
ENSG00000228262.4 | Forward |
TGCAAGAGCATGTGGGTCAA |
|
|
| Reverse |
ACTCCCAGCCACTATGCATTC |
| NR_002791.2 | EMX2OS | Forward |
ACGATCCACTCCCTGGTACA |
|
|
| Reverse |
CGGAAAAGGGTTGGTGCAAG |
| uc011fns.2 |
HLA-DQA1 | Forward |
AAGCCACCCAGCTACCTAATTC |
|
|
| Reverse |
ACATTTCTGAGCCAAAGGCAGAG |
| NR_034160.1 |
USP2-AS1 | Forward |
GGAACTCACAACACACGGGA |
|
|
| Reverse |
TTGCACAAGATGACAGGGCT |
| HIT000332651 |
HIX0040474 | Forward |
AGAGTGTGAGACCTGTGGAG |
|
|
| Reverse |
CAACAAGTTCGTGACCGTGC |
| LIT3502 | LIT3502 | Forward |
ATGAAGGTGGCCTGGGTAGA |
|
|
| Reverse |
TCCCATGTACTCTATAAGCAGCTC |
| TCONS_00001644 |
XLOC_000983 | Forward |
GAAACACGACGGGGGACTTA |
|
|
| Reverse |
AAGGTCCATCGGATTCCACA |
|
ENST00000587085.1 |
ENSG00000228262.2 | Forward |
TCTAAGCCCTGGTGAATGCTG |
|
|
| Reverse |
AGTGTGTCCTGAACCCCATT |
|
| GAPDH | Forward |
GCACCGTCAAGGCTGAGAAC |
|
|
| Reverse |
GGATCTCGCTCCTGGAAGATG |
lncRNA microarray analysis
A total of eight samples from the NDFMS group and
eight samples from the control group were prepared into two merged
RNA samples, one per each group, for microarray screening. RNA
labeling and microarray hybridization were performed according to
the manufacturer's protocol using the Agilent Human LncRNA
Microarray V4.0 (Agilent Technologies, Inc.), which contains
~77,000 probes that can detect 40,916 lncRNAs. All sequence
information was selected from public curated transcriptome
databases [including RefSeq (https://www.ncbi.nlm.nih.gov/refseq/), UCSC known
genes (http://genome.ucsc.edu) and GENCODE
(https://www.gencodegenes.org)]. The
datasets are available in the NCBI GEO repository database
(GSE199148).
The reverse transcribed cDNA products were used as
templates, and random sequence primers were used. The products were
quantitatively labeled for microarray hybridization. Each dot array
was hybridized with a mixed sample, using 2 dot matrices in total.
The hybridized arrays were washed, fixed and scanned using the
Agilent DNA Microarray Scanner (G2565CA; Agilent Technologies,
Inc.). Agilent Feature Extraction software (version 11.0.1.1;
Agilent Technologies, Inc.) was used to analyze the acquired array
images. Quantile normalization and subsequent data processing were
performed using the GeneSpring GX v12.1 software package (Agilent
Technologies, Inc.). The differential expression of lncRNAs between
the two groups was screened by fold change (FC) filtering (|FC|
≥2.0). Differentially expressed lncRNAs (|FC| ≥4.0, signal value
≥50) identified in the microarray were selected using RT-qPCR.
Cells and cell culture
HTR-8/SVneo cells were generously provided by
Professor Yanling Wang (Institute of Zoology, Chinese Academy of
Sciences, Beijing, China). The HTR-8/SVneo cell line (https://web.expasy.org/cellosaurus/CVCL_7162) was
initially developed by Graham et al (24). The HTR-8/SVneo cell line was
generated using freshly isolated evCTB from a first-trimester
placenta, which was transfected with a plasmid containing the
simian virus 40 large T antigen (SV40). A recent study demonstrated
that this cell line contains two distinct populations, one of
epithelial origin and one of mesenchymal origin (25). The trophoblasts were cultured in
RPMI-1640 medium (Shanghai Basal Media Technologies Co., Ltd.)
supplemented with 10% fetal bovine serum (Gibco; Thermo Fisher
Scientific, Inc.), 100 U/ml penicillin and 100 U/ml streptomycin
(Biosharp Life Sciences) in humidified air at 37°C with 5%
CO2. Fresh medium was replaced every 2 days, depending
on the cell status.
Vector construction and cell
transfection
The lncRNA USP2-AS1 overexpression lentiviral
vector plasmid (Shanghai OBiO Technology Corp., Ltd.) was
constructed to overexpress full-length lncRNA USP2-AS1. The
pLenti-EF1a-EGFP-F2A-Puro-CMV-USP2-AS1 overexpression plasmid (4
µg) was transfected into the HTR-8/SVneo cells using Lipofectamine
2000® (Invitrogen, Thermo Fisher Scientific, Inc.). The
control was an empty vector. Cells were collected to determine
infection efficiency following 48 h incubation at 37°C. The
infection efficiency were verified by analyzing the relative
expression of lncRNA USP2-AS1.
Cell viability assay
The Cell Counting Kit-8 (CCK-8; Vazyme Biotech Co.,
Ltd.) assay was used to determine cell viability. After the
transfected cells were cultured at 37°C for 24 h, they were counted
and transferred to a 96-well orifice plate to ensure that the
number of cells in each sample was the same. After 12 h, the
serum-free RPMI-1640 medium (PM150110; Procell Life Science &
Technology Co., Ltd.) without penicillin and streptomycin was
replaced, and the cells were cultured at 37°C for an additional 4
h. CCK-8 (10 µl) was then added to each well, and the ultraviolet
absorbance value was measured at a wavelength of 450 nm using an
enzyme standard instrument (Infinite M200 Pro; Tecan Group, Ltd.)
after 10 and 30 min.
Cell apoptosis assay
The cells were seeded in 6-well plates
(1×10³ cells/well). Following a 24-h transfection, the
treated cells were washed twice with cold PBS. Cell suspensions
(5×10⁶ cells in 400 µl of combination solution) were
stained with FITC-labeled Annexin V (C1062S; Annexin V-FITC
apoptosis detection kit; Beyotime Institute of Biotechnology) and
PI (P-CA-201; Procell Life Science & Technology Co., Ltd.) for
15 min at room temperature in the dark. Binding buffer (400 µl;
C1062S; Beyotime Institute of Biotechnology) was then added, and
the cells were analyzed using flow cytometry (BD FACSCalibur and
CellQuest Pro, v6.0; BD Biosciences). Annexin V-positive and
PI-positive cells were considered apoptotic cells.
Cell cycle assay
Following a 24-h transfection, the cells were washed
twice with PBS. The supernatant was discarded, and 1 ml pre-cooled
75% ethanol was added to the cell pellet. The cells were mixed and
incubated at 4°C for >12 h for fixation. The cells were then
washed twice with PBS (Gibco; Thermo Fisher Scientific, Inc.) and
centrifuged at 111 × g at 4°C for 5 min. Cells were resuspended in
100 µl PBS (Gibco; Thermo Fisher Scientific, Inc.) and 50–100 µl of
PI (P-CA-201; Procell Life Science & Technology Co., Ltd.) were
then added, followed by incubation at room temperature in the dark
for 30 min. The cell cycle phase was determined using flow
cytometry (BD CellQuest Pro, Version 6.0; BD Biosciences).
Statistical analysis
Data are presented as the mean ± SD. If data were in
normal distribution, the Student's t-test was used to compare two
groups. Otherwise, the Mann-Whitney U-test was used. The maternal
age, gestational age, pre-pregnant BMI, gravidity, pregnant weight
gain, placental weight, birth weight between two groups were
analyzed using Student's t-test. The infant sex was analyzed using
Mann-Whitney U test. Statistical analyses were performed using
GraphPad Prism version 5.01 (GraphPad Software Inc.). In all cases,
P<0.05 was considered to indicate a statistically significant
difference.
Results
Patient clinical characteristics
The maternal and infant clinical characteristics of
the study cohorts are summarized in Table II. The median maternal age of
NDFMS and control group were 26. The age range (minimum-maximum) of
NDFMS and control group were 21–26 and 21–34, respectively. Birth
weight, placental weight and weight gain during pregnancy were
significantly higher in the NDFMS group than in the control group
(P<0.05). A significant difference was also found between the
NDFMS group and the control group regarding the sex of the infants
(P<0.05). However, maternal age, gestational age, pre-pregnancy
body mass index and gravidity did not differ significantly between
the two groups (P>0.05).
| Table II.Clinical characteristics of the study
population. |
Table II.
Clinical characteristics of the study
population.
| Characteristic | Control (n=48) | NDFMS (n=48) | P-values |
|---|
| Maternal age
(years) | 26.33±2.68 | 26.88±3.27 | 0.69 |
| Gestational age
(weeks) | 39.66±1.01 | 39.74±0.95 | 0.63 |
| Pre-pregnant BMI
(kg/m2) | 20.06±2.64 | 21.21±3.90 | 0.08 |
| Gravidity | 1.25±0.60 | 1.34±0.73 | 0.51 |
| Pregnant weight
gain (kg) | 16.84±4.11 | 19.83±4.89 | 0.002 |
| Placental weight
(g) | 593.33±102.31 | 760.73±124.14 | <0.001 |
| Birth weight
(g) | 3322.29±309.60 | 4238.04±235.86 | <0.001 |
| Infant sex, n
(%) |
|
| 0.008 |
|
Male | 21 (43.75) | 34 (70.83) |
|
|
Female | 27 (56.25) | 14 (29.17) |
|
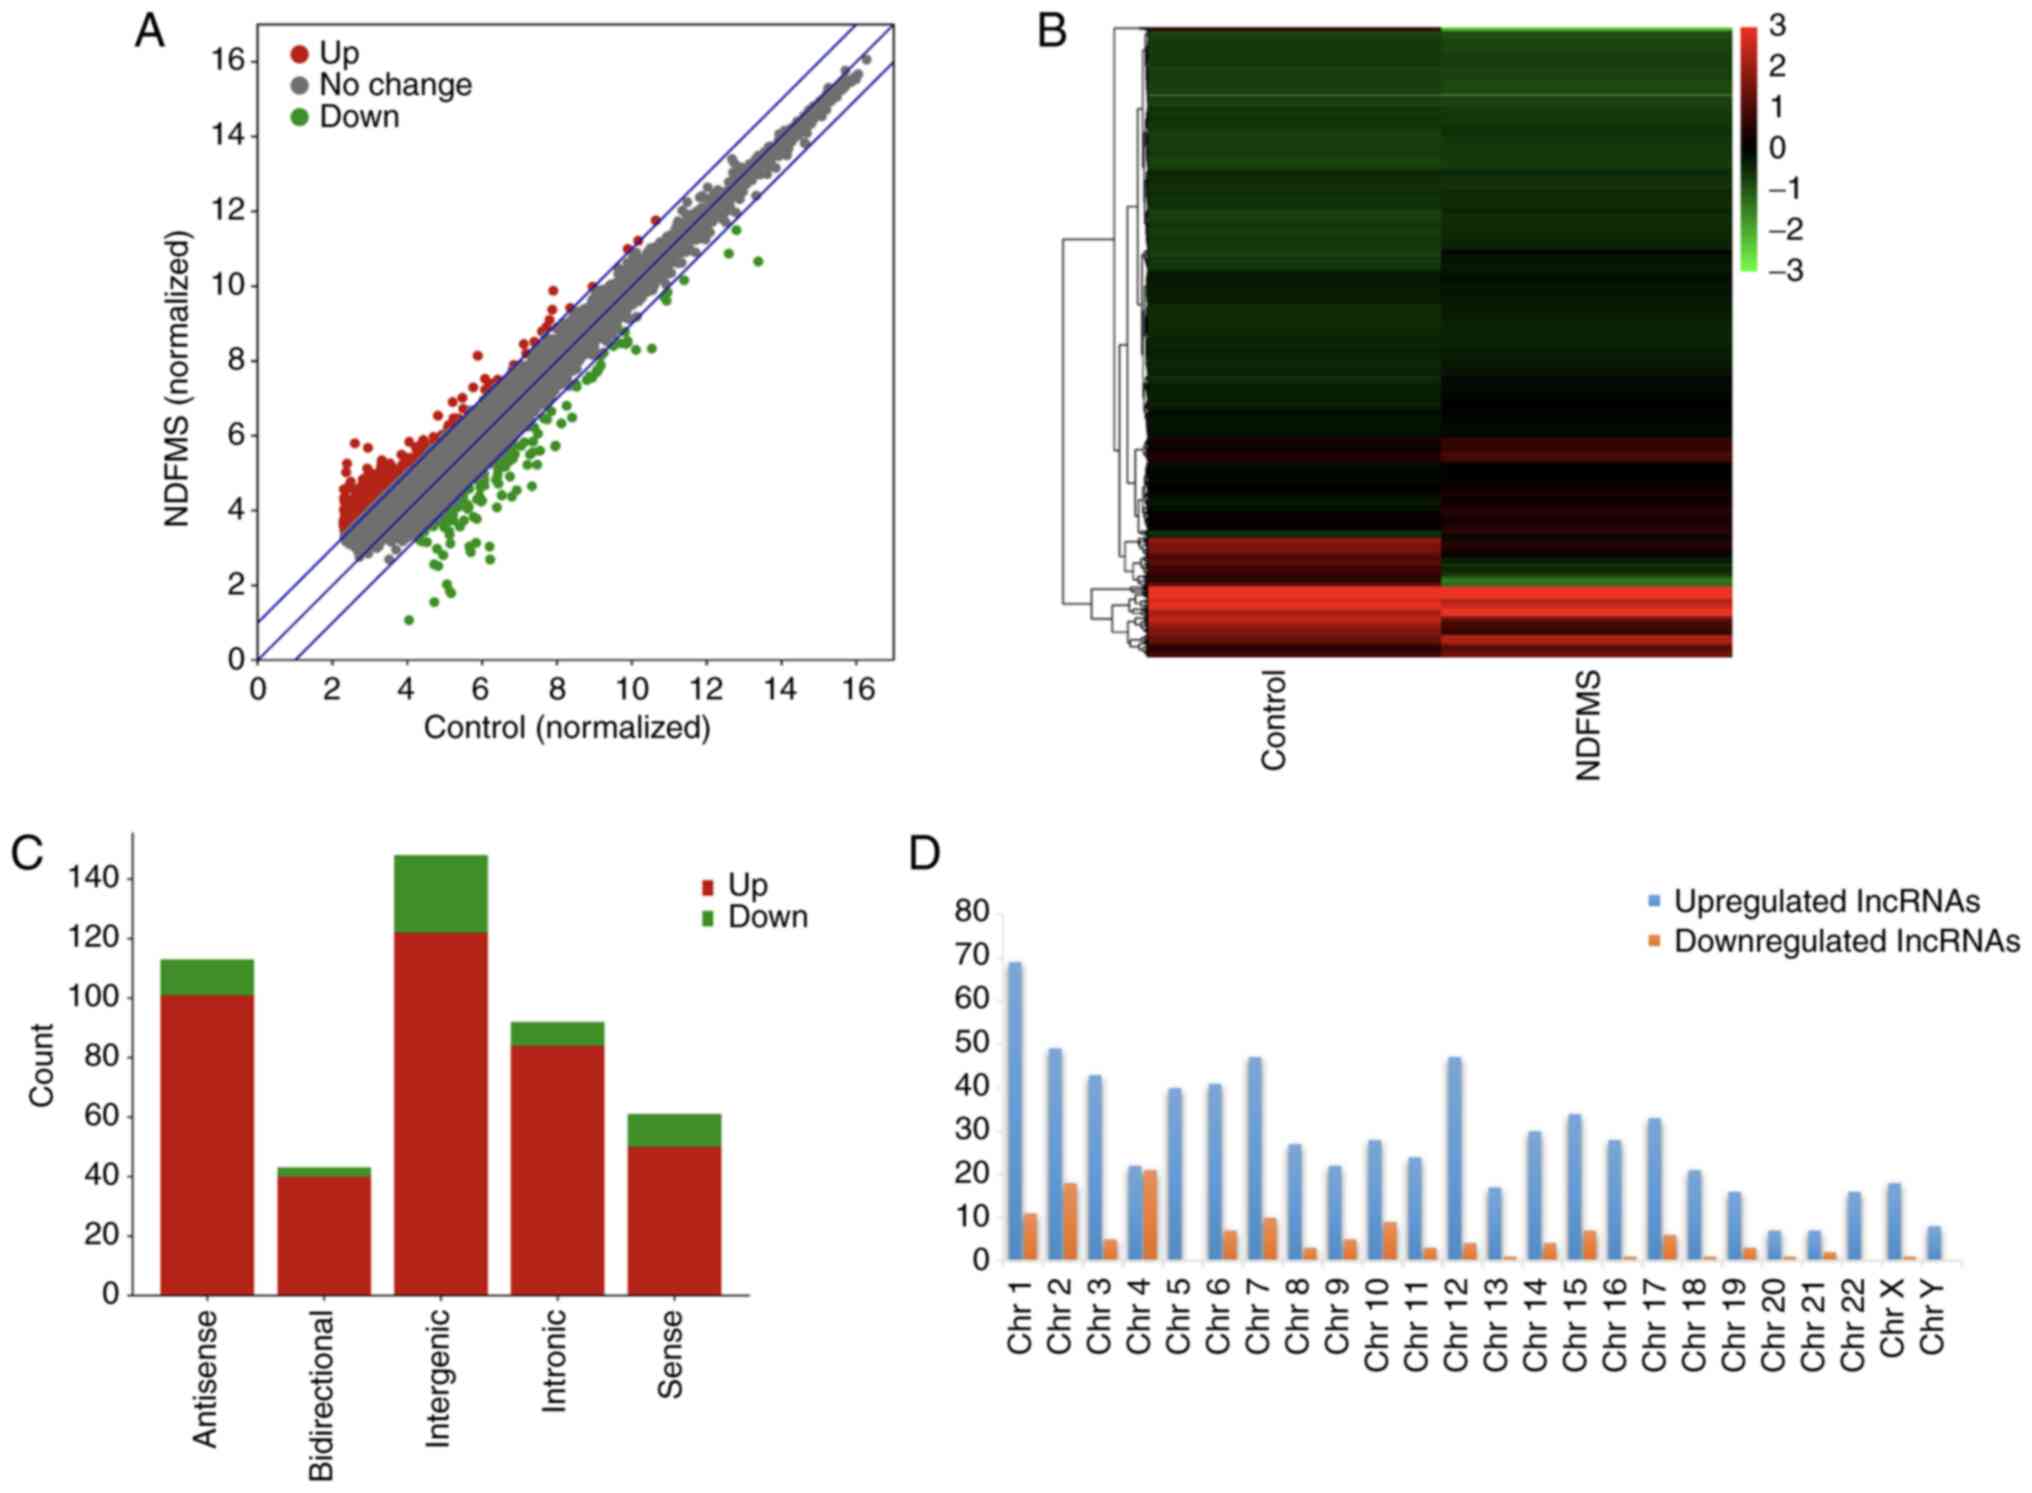
lncRNA microarray analysis
To investigate the potential role of lncRNAs in
NDFMS, an Agilent Human LncRNA Microarray (potential to detect
40,916 lncRNAs) was used to analyze the lncRNA expression profiles
in the NDFMS group and control group. In total, 892 (2.18%,
892/40,916) differentially expressed lncRNAs were identified with
763 (85.54%, 763/892) significantly upregulated lncRNAs (FC≥2) and
129 (14.46%, 129/892) significantly downregulated lncRNAs (FC ≤-2)
in the placentas of women in the NDFMS group in comparison with the
control placentas. A scatter plot was drawn to demonstrate the
changes in lncRNA expression between the two groups (Fig. 1A), and cluster analysis revealed
the clustering association of differentially expressed lncRNAs
between the two groups (Fig. 1B).
A total of eight samples from the NDFMS group and eight samples
from the control group were prepared into two merged RNA samples.
Therefore, it was not possible to calculate a P-value for the
statistics. The lncRNA with the largest FC, among the upregulated
lncRNAs, was HIT000075832 (FC=9.19), and the lncRNA with the lowest
FC among the downregulated lncRNAs was ENST00000513672.1
(FC=−11.48). The top 10 upregulated and downregulated lncRNAs in
the placentas of women in the NDFMS group are presented in Table III. Subsequently, the lncRNA
microarray data were further screened, and the genomic locations of
differentially expressed lncRNAs were classified and analyzed
(Fig. 1C). The distribution of
differentially expressed lncRNAs in gene sites may imply the
potential role of lncRNAs. According to their positions in the
genome, lncRNAs can be divided into five categories, as follows:
bidirectional, antisense, sense, intergenic and intronic. Among the
892 differentially expressed lncRNAs between the two groups, a
total of 364 out of 892 (40.81%) lncRNAs were classified into these
five categories. Intergenic lncRNAs accounted for the largest
proportion in the classification of differentially expressed
lncRNAs. Intergenic lncRNAs have a higher evolutionary conservatism
and tissue specificity, and they demonstrate active transcriptional
activities. lncRNAs in other genomic locations may also play a
variety of important potential biological roles, including gene
regulation, cell differentiation and chromatin remodeling (26). Additionally, the chromosome
distribution of upregulated and downregulated lncRNAs is
demonstrated in Fig. 1D.
| Table III.The top 10 upregulated and
downregulated lncRNAs in NDFMS, compared with the control. |
Table III.
The top 10 upregulated and
downregulated lncRNAs in NDFMS, compared with the control.
| lncRNA ID | Gene symbol | FCa | Regulation | Chromosome |
|---|
| HIT000075832 |
HIX0114733 | 9.19 |
Up | 7 |
|
ENST00000567862.1 |
ENSG00000261310.1 | 7.31 |
Up | 16 |
| TCONS_00007242 |
XLOC_003223 | 6.64 |
Up | 3 |
| HIT000067251 |
HIX0030109 | 6.32 |
Up | 2 |
|
ENST00000430463.1 |
ENSG00000215498.4 | 4.87 |
Up | 22 |
| uc011fns.2 |
HLA-DQA1 | 4.80 |
Up | 6 |
| TCONS_00006281 |
XLOC_002882 | 4.80 |
Up | 3 |
|
ENST00000503357.1 |
ENSG00000249290.1 | 4.78 |
Up | 3 |
|
ENST00000433249.1 |
ENSG00000236556.1 | 4.60 |
Up | 10 |
| uc021vkt.1 | abParts | 4.54 |
Up | 2 |
|
ENST00000513672.1 |
ENSG00000248322.1 | −11.48 | Down | 1 |
|
ENST00000607437.1 |
ENSG00000228262.4 | −10.41 | Down | 2 |
|
ENST00000415714.1 |
ENSG00000235142.2 | −9.81 | Down | 6 |
|
ENST00000610239.1 |
ENSG00000272727.1 | −9.00 | Down | 4 |
|
ENST00000594455.1 |
ENSG00000230768.2 | −8.94 | Down | 1 |
|
ENST00000564381.1 |
ENSG00000261045.1 | −8.17 | Down | 16 |
|
ENST00000598737.1 |
ENSG00000228486.3 | −7.87 | Down | 2 |
| TCONS_00001693 |
XLOC_001052 | −7.02 | Down | 1 |
|
ENST00000433965.1 |
ENSG00000235142.2 | −6.87 | Down | 6 |
|
ENST00000580048.1 |
ENSG00000264247.1 | −6.58 | Down | 18 |
lncRNA RT-qPCR verification
In general, when the signal value of the microarray
was >50, the detection result was reliable. A total of 12
differentially expressed lncRNAs (|FC| ≥4.0, signal value ≥50) are
depicted in Table IV. The two
lncRNA (RNA147334|p0438_imsncRNA843 and LIT3501) could not be
amplified with RT-qPCR using the designed primers. The remaining 10
differentially expressed lncRNAs were selected for verification.
RT-qPCR verification was divided into two stages. Firstly, samples
analyzed using an lncRNA microarray (n=8 vs. 8) were used for phase
I RT-qPCR verification (Table V).
Subsequently, more placental tissue samples from the NDFMS and
control group (n=48 vs. 48) were used for phase II lncRNA
expression verification (Fig. 2).
The two-stage RT-qPCR verification results shared a consistent
similar trend as compared with the microarray expression data
results (the expression trend of 10 lncRNAs was consistent with the
microarray data). Among these, ubiquitin-specific peptidase 2
antisense RNA 1 (USP2-AS1) demonstrated a significantly
decreased expression in both microarray and two-stage RT-qPCR
verification results. Therefore, USP2-AS1 was selected as
the candidate lncRNA for the subsequent experiments.
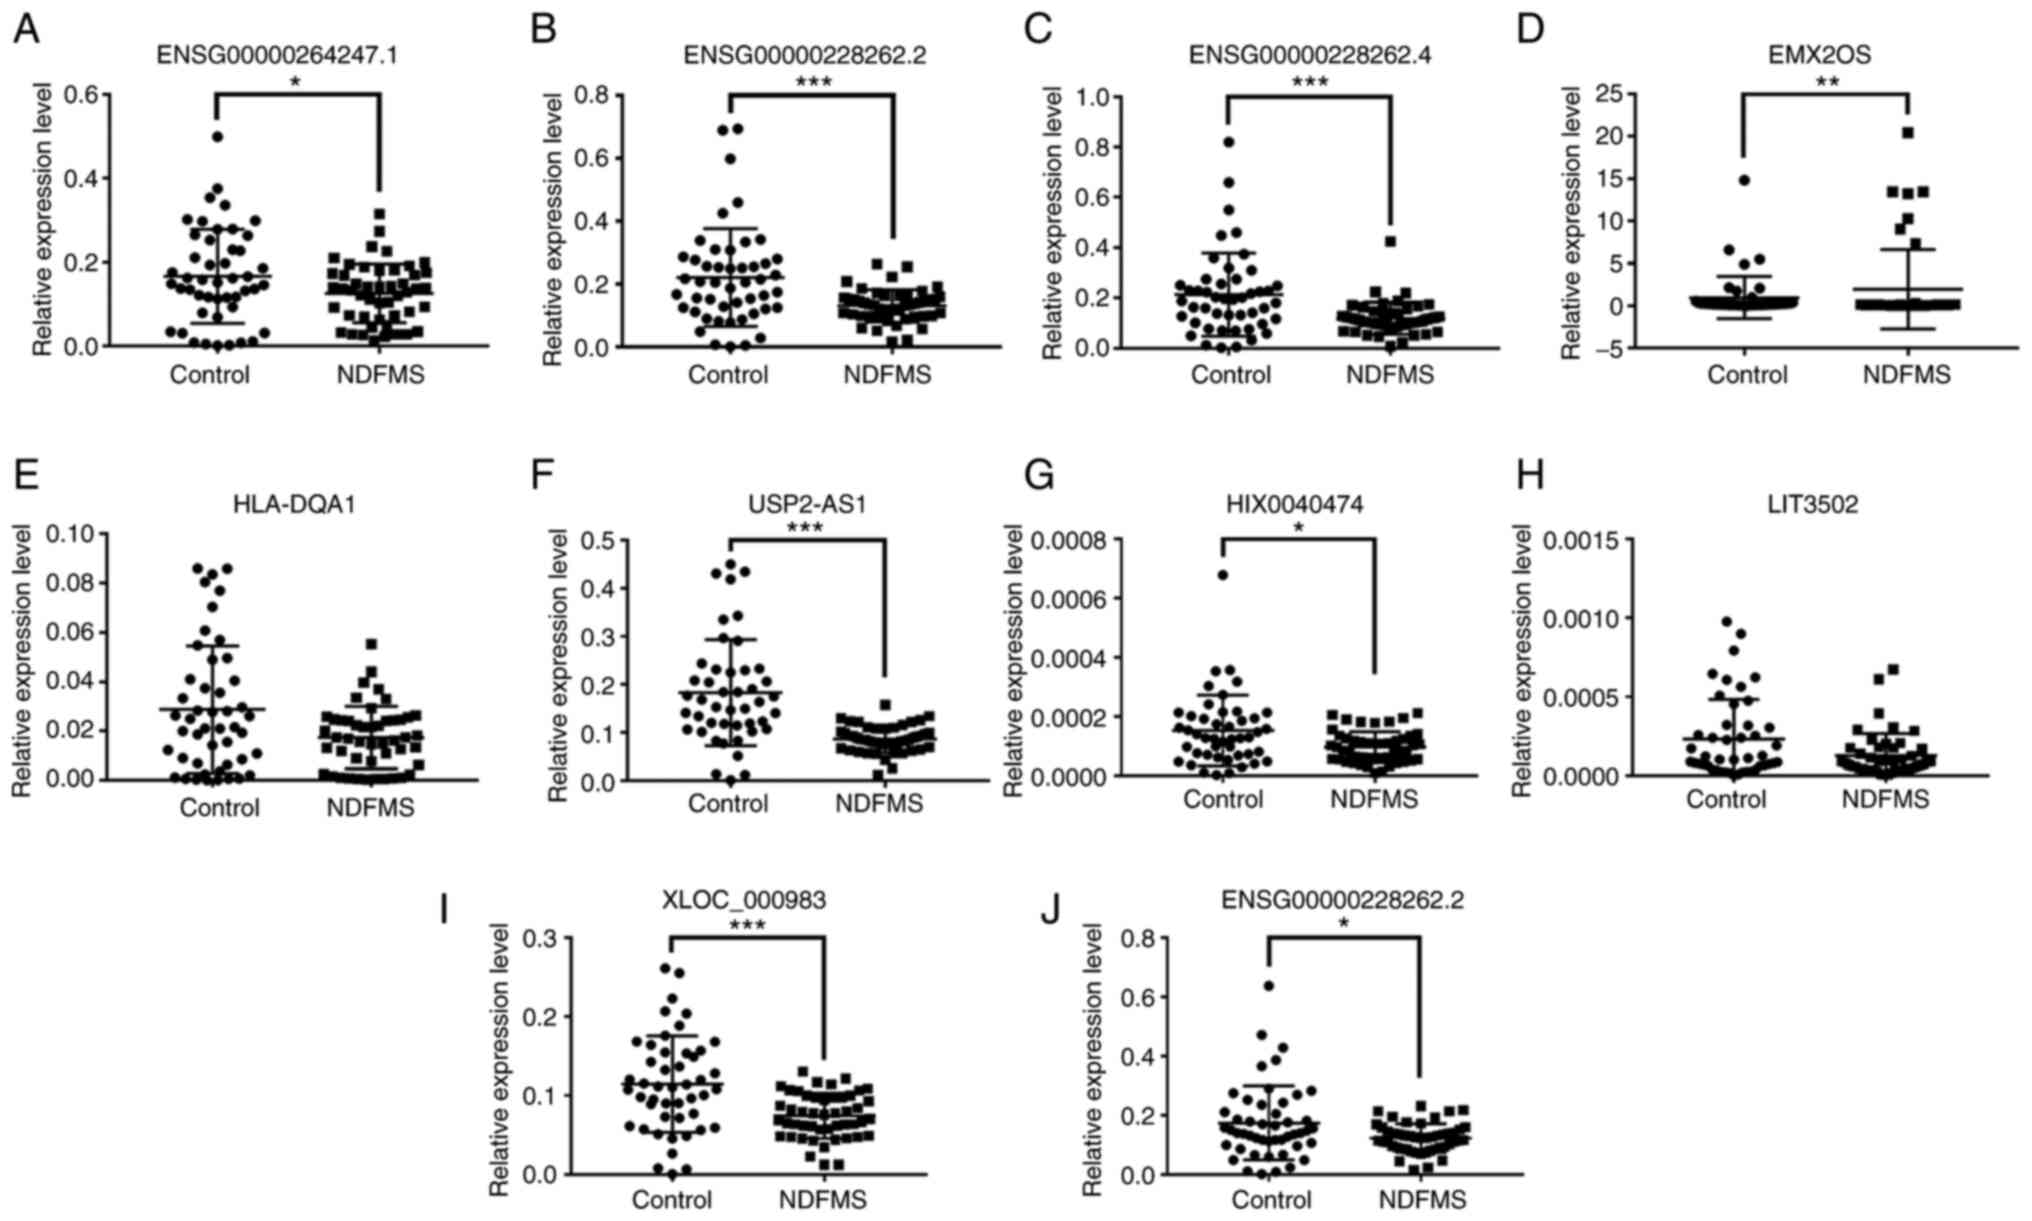 | Figure 2.Verification results of expression
levels of lncRNAs in the placental tissues of women in the NDFMS
group and control group. Expression levels of 10 lncRNAs in
placental tissues of women in the NDFMS group and control group:
(A) ENSG00000264247.1, (B) ENSG00000228262.2 (lncRNA
ID: ENST00000453774.1), (C) ENSG00000228262.4, (D)
EMX2OS, (E) HLA-DQA1, (F) USP2-AS1, (G)
HIX0040474, (H) LIT3502, (I) XLOC_000983, (J)
ENSG00000228262.2 (lncRNA ID: ENST00000587085.1).
*P<0.05, **P<0.01, ***P<0.001, vs. the control group.
lncRNA, long non-coding RNA; NDFMS, non-diabetic fetal
macrosomia. |
| Table IV.List of differentially expressed
lncRNAs in the Agilent Human LncRNA Microarray results. |
Table IV.
List of differentially expressed
lncRNAs in the Agilent Human LncRNA Microarray results.
| lncRNA
IDa | Gene symbol | FCb | Regulation |
|---|
|
ENST00000580048.1 |
ENSG00000264247.1 | −6.58 | Down |
|
RNA147334|p0438_imsncRNA843 | Null | −6.41 | Down |
|
ENST00000453774.1 |
ENSG00000228262.2 | −5.36 | Down |
|
ENST00000604250.1 |
ENSG00000228262.4 | −5.21 | Down |
| NR_002791.2 | EMX2OS | −4.96 | Down |
| uc011fns.2 |
HLA-DQA1 | 4.80 |
Up |
| NR_034160.1 |
USP2-AS1 | −4.73 | Down |
| LIT3501 | LIT3501 | −4.71 | Down |
| HIT000332651 |
HIX0040474 | −4.68 | Down |
| LIT3502 | LIT3502 | −4.60 | Down |
| TCONS_00001644 |
XLOC_000983 | −4.34 | Down |
|
ENST00000587085.1 |
ENSG00000228262.2 | −4.22 | Down |
| Table V.Expression of lncRNAs in 8 placental
tissues of women in the NDFMS and control group. |
Table V.
Expression of lncRNAs in 8 placental
tissues of women in the NDFMS and control group.
| Gene symbol | Control (n=8) | NDFMS (n=8) | P-value |
|---|
|
ENSG00000264247.1 | 0.104±0.074 | 0.031±0.008 | 0.172 |
|
ENSG00000228262.2 | 0.115±0.054 | 0.141±0.026 | 0.142 |
|
ENSG00000228262.4 | 0.155±0.070 | 0.110±0.029 | 0.208 |
| EMX2OS | 0.115±0.045 | 0.087±0.057 | 0.600 |
|
HLA-DQA1 | 0.002±0.002 | 0.034±0.011 | 0.0008 |
|
USP2-AS1 | 0.344±0.416 | 0.087±0.018 | 0.002 |
|
HIX0040474 |
0.00006±0.00002 |
0.00009±0.00004 | 0.075 |
| LIT3502 | 0.0007±0.001 |
0.00007±0.00003 | 0.916 |
|
XLOC_000983 | 0.109±0.57 | 0.064±0.016 | 0.093 |
|
ENSG00000228262.2 | 0.122±0.023 | 0.105±0.024 | 0.093 |
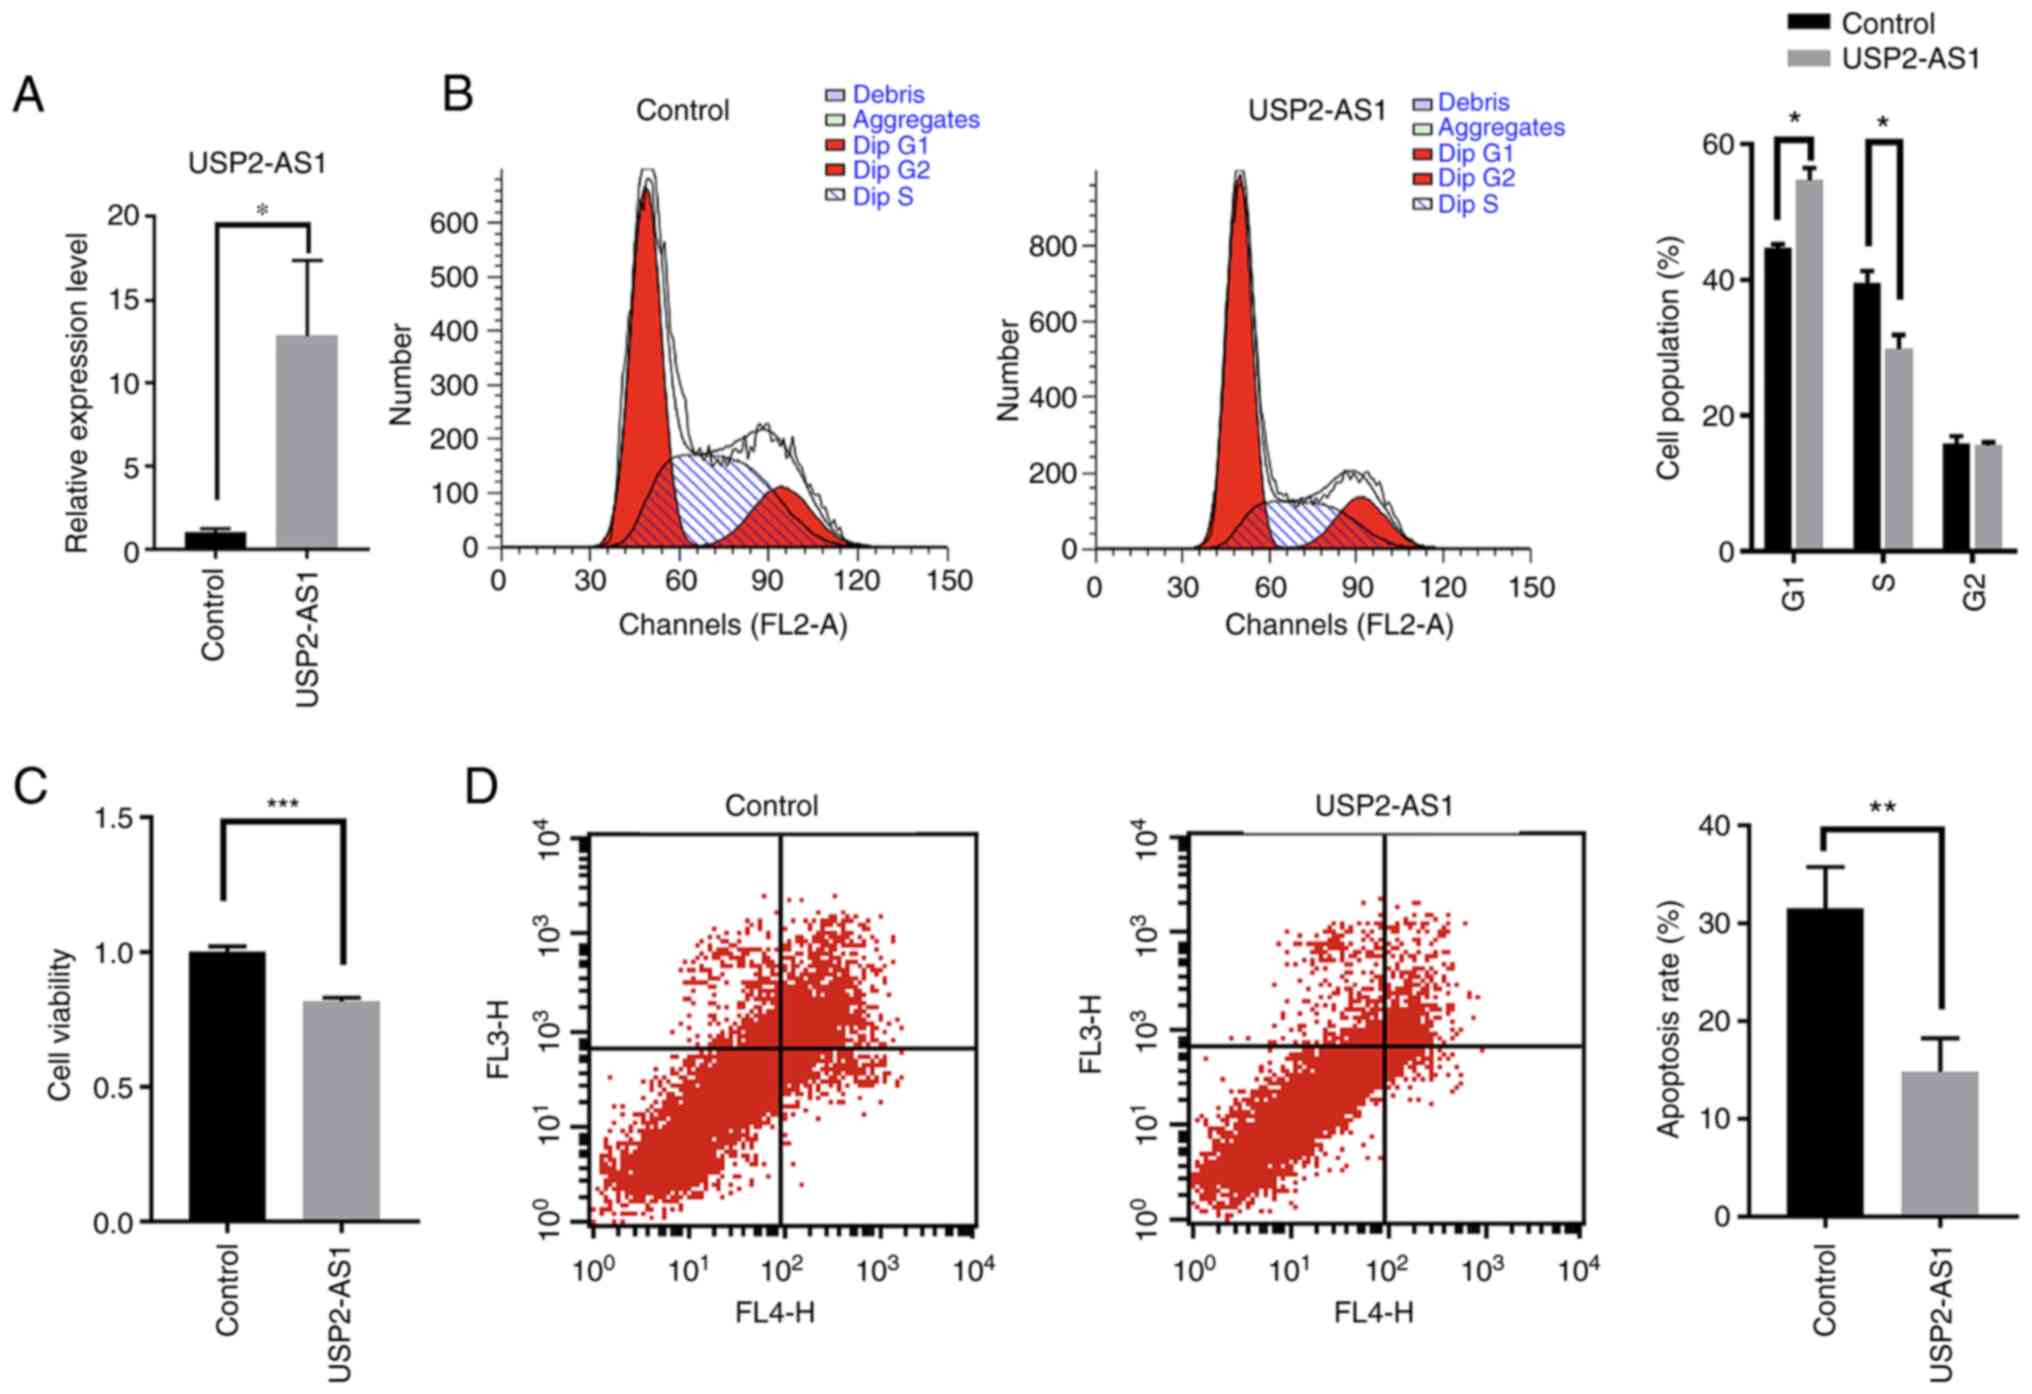
Effects of lncRNA USP2-AS1 on human
chorionic trophoblasts
The proliferation and apoptosis of trophoblasts are
fundamental for the development of the placenta and the
pathogenesis of NDFMS. In the present study, HTR-8/SVneo cells were
used to elucidate the role of lncRNA USP2-AS1 in placental
development. The transfection efficiency of lncRNA USP2-AS1
was first examined. Compared with the control group, the
USP2-AS1 expression levels in HTR-8/SVneo cells in the
USP2-AS1 overexpression group were significantly increased
following transfection (Fig. 3A).
The overexpression of lncRNA USP2-AS1 arrested the cells in
the G1 phase and reduced the number of cells entering the S phase
(Fig. 3B). The overexpression of
lncRNA USP2-AS1 also significantly decreased cell viability
(Fig. 3C). However, the
overexpression of lncRNA USP2-AS1 significantly decreased
cell apoptosis compared with the control group (Fig. 3D).
Discussion
The occurrence of macrosomia is dependent on various
factors. For environmental factors, including the occurrence of
diabetes in pregnant women, the probability of producing macrosomia
is ~26%, and the probability of producing macrosomia of pregnant
women without diabetes is limited to 5–8% (1). Pregnant women with excessive
nutrition, obese pregnant women and overweight pregnant women have
been reported to also be susceptible to macrosomia (27–29). Normal placental function exists in
only a few overdue pregnancies, and the fetal weight increases with
the period of pregnancy. The incidence of a large amount of
amniotic fluid in pregnant women is high. Genetic factors also have
a certain effect on the weight of the fetus (30). Usually, the incidence of fetal
macrosomia is high in tall parents (31). Among these confounding factors,
the policy of encouraging one child in family planning implemented
by the Chinese government and the corresponding inclusion and
exclusion criteria of the present study were effectively
controlled. However, after controlling the aforementioned factors,
there is still a certain risk for macrosomia: the weight of the
placenta is a variable exerting marked influence on the occurrence
of macrosomia (32). A comparison
of the data suggested that the weight of the placenta was
associated with fetal birth weight. The size of the placenta has
been demonstrated to affect the birth weight of the fetus (33).
All the nutrients required for the growth of the
fetus are supplied by the mother through the placenta. However, the
purpose of the placenta is not merely for material exchange; it
also has a number of other functions, as follows: i) defense
function: it functions as a barrier against a number of bacteria,
pathogens and drugs (34); ii)
cooperative function: chorionic gonadotropin, placental lactogen,
estrogen, progesterone, oxytocin enzyme, thermostable alkaline
phosphatase, cytokines and growth factors are secreted (34); iii) storage function: a large
number of nutrients (protein, glycogen, calcium and iron) are
stored in placental cells for fetal growth requirements (35); and iv) metabolic regulation
function: the placenta may regulate the metabolism of the body
similar to that of the liver (36). Previous research results by the
authors revealed that the placental weights of the macrosomia group
were significantly higher than those of the normal group (12). Thus, it was considered worthy of
investigation to define which factors lead to the overdevelopment
of placentas and the occurrence of macrosomia.
lncRNAs are non-coding RNAs with a length of >200
nucleotides, and are related to numerous pregnancy complications,
including gestational diabetes (37). In the present study, the
expression profiles of lncRNAs in the placentas of pregnant women
with NDFMS were investigated using an Agilent Human LncRNA
Microarray V4.0. In the placentas of the women in the NDFMS group,
763 lncRNAs were upregulated and 129 lncRNAs were downregulated.
Subsequently, 10 differentially expressed lncRNAs were selected to
validate the preliminary results, and the two-stage RT-qPCR
verifications were consistent with the microarray results. In
addition, lncRNA USP2-AS1 exhibited a significant
downregulation in both the microarray data and second-stage RT-qPCR
verification. Therefore, lncRNA USP2-AS1 was the most
prominent candidate lncRNA, and was used for subsequent
analysis.
lncRNA USP2-AS1, located on the human
chromosome 11q23.3, is a lncRNA with a length of 2,486 nucleotides.
A previous study revealed that USP2-AS1 promotes the growth
and metastasis of colon adenocarcinoma cells and may play a
carcinogenic effect in colon adenocarcinoma (38). In addition, lncRNA USP2-AS1
has been demonstrated to be upregulated in ovarian cancer.
Mechanistic analysis have revealed that USP2-AS1 promotes
ovarian cancer progression via the miR-520d-3p/KIAA1522 axis
(39). lncRNAs have also been
revealed to play vital biological regulatory effects in the
development of the placenta (18–22); however, the role and mechanisms of
action of USP2-AS1 in NDFMS remain unclear.
The growth patterns of placental cells bear
similarities to those of tumor cells, which are often referred to
as ‘pseudotumors’. Therefore, the present study focused on the key
molecules that regulate the biological function of placental cells.
Firstly, a cell model in which the target lncRNA was overexpressed
in a trophoblast cell line was generated, and the viability and
apoptosis of the cells was evaluated. Following USP2-AS1
overexpression, the cells were blocked in the G1 phase, and the
cell viability and apoptotic rates were decreased. It was
hypothesized that the decrease in the apoptosis of HTR-8/SVneo
cells overexpressing USP2-AS1 may have been a compensation effect.
These results suggested that USP2-AS1 mainly promotes
placental development by affecting the proliferative activity of
placental cells, which may lead to NDFMS. However, further studies
are required for the elucidation of the precise molecular
mechanisms of USP2-AS1 in the placentas of pregnant women
with macrosomia. The combination of basic and clinical research
will provide a breakthrough point for the research of non-diabetic
macrosomia and a theoretical basis for the prevention and treatment
of clinical non-diabetic macrosomia.
The present study had several limitations. Firstly,
the subjects were women who resided in the vicinity of Jiangsu
Province, resulting in regional limitations. Secondly, the present
study did not predict the lncRNA target genes or explore their
functions in NDFMS. Finally, the function of aberrantly expressed
lncRNA USP-AS1 was not verified further with the use of an
animal model. In a follow-up project by the authors, the biological
functions of lncRNA USP-AS1 in macrosomia will be further
explored in vivo and also by applying molecular mechanism
research.
In conclusion, the present study identified the
expression profile of lncRNAs in the placentas of women with NDFMS
and revealed for the first time, to the best of our knowledge, that
lncRNA USP2-AS1 participates in the pathogenesis of NDFMS by
regulating cell function. The present study provides new insight
into exploring the post-transcriptional regulatory mechanisms of
NDFMS, suggesting potential biological targets for future clinical
treatment of NDFMS.
Acknowledgements
Not applicable.
Funding
The present study was supported by the National Natural Science
Foundation of China (grant nos. 81771597, 81971405), Major Project
of University Natural Science Research Project of Jiangsu Province
(grant no. 20KJA330001), Medical Scientific Research Project of
Jiangsu Provincial Health Commission (grant no. Z2019010), and the
Priority Academic Program for the Development of Jiangsu Higher
Education Institutions (Public Health and Preventive Medicine).
Availability of data and materials
The datasets generated and/or analyzed during the
current study are available in the NCBI GEO repository database
(GSE199148), [https://www.ncbi.nlm.nih.gov/geo/query/acc.cgi?acc=GSE199148].
Authors' contributions
WW and HJ were involved in the conceptualization and
design of the study. DG and QT were involved in the acquisition of
data. YL and YC were involved in data analysis. YL, ML, YC, WW and
HJ were involved in the interpretation of the data. YL, SY, DG and
ZF performed the experiments. WW, QT and HJ contributed
materials/analysis tools. YL and YC were involved in the
preparation of the original draft. WW and HJ were involved in the
reviewing and editing of the manuscript. YL, ZF and QT confirm the
authenticity of all the raw data. All authors have read and
approved the final manuscript.
Ethics approval and consent to
participate
The present study was supervised and approved by the
Institutional Review Board of Nanjing Medical University
(FWA00001501). Written informed consent was obtained from all
pregnant women prior to their participation in the present
study.
Patient consent for publication
Not applicable.
Competing interests
The authors declare that they have no competing
interests.
References
|
1
|
Kc K, Shakya S and Zhang H: Gestational
diabetes mellitus and macrosomia: A literature review. Ann Nutr
Metab. 66 (Suppl 2):S14–S20. 2015. View Article : Google Scholar
|
|
2
|
Linder N, Lahat Y, Kogan A, Fridman E,
Kouadio F, Melamed N, Yogev Y and Klinger G: Macrosomic newborns of
non-diabetic mothers: Anthropometric measurements and neonatal
complications. Arch Dis Child Fetal Neonatal Ed. 99:F353–F358.
2014. View Article : Google Scholar : PubMed/NCBI
|
|
3
|
Koyanagi A, Zhang J, Dagvadorj A, Hirayama
F, Shibuya K, Souza JP and Gülmezoglu AM: Macrosomia in 23
developing countries: An analysis of a multicountry,
facility-based, cross-sectional survey. Lancet. 381:476–483. 2013.
View Article : Google Scholar
|
|
4
|
Valvi D, Oulhote Y, Weihe P, Dalgård C,
Bjerve KS, Steuerwald U and Grandjean P: Gestational diabetes and
offspring birth size at elevated environmental pollutant exposures.
Environ Int. 107:205–215. 2017. View Article : Google Scholar
|
|
5
|
Jansson T and Powell TL: Role of placental
nutrient sensing in developmental programming. Clin Obstet Gynecol.
56:591–601. 2013. View Article : Google Scholar
|
|
6
|
Jansson T and Powell TL: Role of the
placenta in fetal programming: Underlying mechanisms and potential
interventional approaches. Clin Sci (Lond). 113:1–13. 2007.
View Article : Google Scholar : PubMed/NCBI
|
|
7
|
Tian FY, Wang XM, Xie C, Zhao B, Niu Z,
Fan L, Hivert MF and Chen WQ: Placental surface area mediates the
association between FGFR2 methylation in placenta and full-term low
birth weight in girls. Clin Epigenetics. 10:392018. View Article : Google Scholar : PubMed/NCBI
|
|
8
|
Ilekis JV, Tsilou E, Fisher S, Abrahams
VM, Soares MJ, Cross JC, Zamudio S, Illsley NP, Myatt L, Colvis C,
et al: Placental origins of adverse pregnancy outcomes: Potential
molecular targets: An executive workshop summary of the eunice
Kennedy Shriver National institute of child health and human
development. Am J Obstet Gynecol. 215 (Suppl 1):S1–S46. 2016.
View Article : Google Scholar
|
|
9
|
Longtine MS and Nelson DM: Placental
dysfunction and fetal programming: The importance of placental
size, shape, histopathology, and molecular composition. Semin
Reprod Med. 29:187–196. 2011. View Article : Google Scholar : PubMed/NCBI
|
|
10
|
Lunghi L, Ferretti ME, Medici S, Biondi C
and Vesce F: Control of human trophoblast function. Reprod Biol
Endocrinol. 5:62007. View Article : Google Scholar
|
|
11
|
Ishihara N, Matsuo H, Murakoshi H,
Laoag-Fernandez J, Samoto T and Maruo T: Changes in proliferative
potential, apoptosis and Bcl-2 protein expression in
cytotrophoblasts and syncytiotrophoblast in human placenta over the
course of pregnancy. Endocr J. 47:317–327. 2000. View Article : Google Scholar : PubMed/NCBI
|
|
12
|
Guo D, Jiang H, Chen Y, Yang J, Fu Z, Li
J, Han X, Wu X, Xia Y, Wang X, et al: Elevated microRNA-141-3p in
placenta of non-diabetic macrosomia regulate trophoblast
proliferation. EBioMedicine. 38:154–161. 2018. View Article : Google Scholar : PubMed/NCBI
|
|
13
|
Li J, Fu Z, Jiang H, Chen L, Wu X, Ding H,
Xia Y, Wang X, Tang Q and Wu W: IGF2-derived miR-483-3p contributes
to macrosomia through regulating trophoblast proliferation by
targeting RB1CC1. Mol Hum Reprod. 24:444–452. 2018. View Article : Google Scholar : PubMed/NCBI
|
|
14
|
Lai J, Chen B, Zhang G, Li X, Mok H and
Liao N: Molecular characterization of breast cancer: A potential
novel immune-related lncRNAs signature. J Transl Med. 18:4162020.
View Article : Google Scholar : PubMed/NCBI
|
|
15
|
Sun QM, Hu B, Fu PY, Tang WG, Zhang X,
Zhan H, Sun C, He YF, Song K, Xiao YS, et al: Long non-coding RNA
00607 as a tumor suppressor by modulating NF-κB p65/p53 signaling
axis in hepatocellular carcinoma. Carcinogenesis. 39:1438–1446.
2018. View Article : Google Scholar : PubMed/NCBI
|
|
16
|
Liang H, Yu T, Han Y, Jiang H, Wang C, You
T, Zhao X, Shan H, Yang R, Yang L, et al: LncRNA PTAR promotes EMT
and invasion-metastasis in serous ovarian cancer by competitively
binding miR-101-3p to regulate ZEB1 expression. Mol Cancer.
17:1192018. View Article : Google Scholar : PubMed/NCBI
|
|
17
|
Knauss JL, Miao N, Kim SN, Nie Y, Shi Y,
Wu T, Pinto HB, Donohoe ME and Sun T: Long noncoding RNA Sox2ot and
transcription factor YY1 co-regulate the differentiation of
cortical neural progenitors by repressing Sox2. Cell Death Dis.
9:7992018. View Article : Google Scholar : PubMed/NCBI
|
|
18
|
Jiang S, Chen Q, Liu H, Gao Y and Yang X,
Ren Z, Gao Y, Xiao L, Zhong M, Yu Y and Yang X:
Preeclampsia-Associated lncRNA INHBA-AS1 regulates the
proliferation, invasion, and migration of placental trophoblast
cells. Mol Ther Nucleic Acids. 22:684–695. 2020. View Article : Google Scholar : PubMed/NCBI
|
|
19
|
Chen Q, Jiang S, Liu H, Gao Y, Yang X, Ren
Z, Gao Y, Xiao L, Hu H, Yu Y, et al: Association of lncRNA
SH3PXD2A-AS1 with preeclampsia and its function in invasion and
migration of placental trophoblast cells. Cell Death Dis.
11:5832020. View Article : Google Scholar : PubMed/NCBI
|
|
20
|
Ma Y, Liang X, Wu H, Zhang C and Ma Y:
Long noncoding RNA NR_002794 is upregulated in pre-eclampsia and
regulates the proliferation, apoptosis and invasion of trophoblast
cells. Mol Med Rep. 20:4567–4575. 2019.PubMed/NCBI
|
|
21
|
Pengjie Z, Xionghui C, Yueming Z, Ting X,
Na L, Jianying T and Zhice X: LncRNA uc003fir promotes CCL5
expression and negatively affects proliferation and migration of
trophoblast cells in preeclampsia. Pregnancy Hypertens. 14:90–96.
2018. View Article : Google Scholar : PubMed/NCBI
|
|
22
|
Zhang Y, Jin F, Li XC, Shen FJ, Ma XL, Wu
F, Zhang SM, Zeng WH, Liu XR, Fan JX, et al: The YY1-HOTAIR-MMP2
signaling axis controls trophoblast invasion at the maternal-fetal
interface. Mol Ther. 25:2394–2403. 2017. View Article : Google Scholar : PubMed/NCBI
|
|
23
|
Livak KJ and Schmittgen TD: Analysis of
relative gene expression data using real-time quantitative PCR and
the 2(−Delta Delta C(T)) method. Methods. 25:402–408. 2001.
View Article : Google Scholar : PubMed/NCBI
|
|
24
|
Graham CH, Hawley TS, Hawley RG,
MacDougall JR, Kerbel RS, Khoo N and Lala PK: Establishment and
characterization of first trimester human trophoblast cells with
extended lifespan. Exp Cell Res. 206:204–211. 1993. View Article : Google Scholar : PubMed/NCBI
|
|
25
|
Abou-Kheir W, Barrak J, Hadadeh O and
Daoud G: HTR-8/SVneo cell line contains a mixed population of
cells. Placenta. 50:1–7. 2017. View Article : Google Scholar
|
|
26
|
Dhanoa JK, Sethi RS, Verma R, Arora JS and
Mukhopadhyay CS: Long non-coding RNA: Its evolutionary relics and
biological implications in mammals: A review. J Anim Sci Technol.
60:252018. View Article : Google Scholar
|
|
27
|
Du MC, Ouyang YQ, Nie XF, Huang Y and
Redding SR: Effects of physical exercise during pregnancy on
maternal and infant outcomes in overweight and obese pregnant
women: A meta-analysis. Birth. 46:211–221. 2019. View Article : Google Scholar : PubMed/NCBI
|
|
28
|
Poblete JA and Olmos P: Obesity and
Gestational diabetes in pregnant care and clinical practice. Curr
Vasc Pharmacol. 19:154–164. 2021. View Article : Google Scholar
|
|
29
|
Yang W, Han F, Gao X, Chen Y, Ji L and Cai
X: Relationship between gestational weight gain and pregnancy
complications or delivery outcome. Sci Rep. 7:125312017. View Article : Google Scholar : PubMed/NCBI
|
|
30
|
Lucarini N, Bottini FG, Borgiani P, Amante
A, Gerlini G and Bottini E: Genetic and non genetic factors in the
outcome of diabetic pregnancy. J Perinat Med. 22:379–385. 1994.
View Article : Google Scholar : PubMed/NCBI
|
|
31
|
Wilcox MA, Newton CS and Johnson IR:
Paternal influences on birthweight. Acta Obstet Gynecol Scand.
74:15–18. 1995. View Article : Google Scholar : PubMed/NCBI
|
|
32
|
Tanaka K, Matsushima M, Izawa T, Furukawa
S, Kobayashi Y and Iwashita M: Influence of maternal obesity on
fetal growth at different periods of pregnancies with normal
glucose tolerance. J Obstet Gynaecol Res. 44:691–696. 2018.
View Article : Google Scholar : PubMed/NCBI
|
|
33
|
Wallace JM, Horgan GW and Bhattacharya S:
Placental weight and efficiency in relation to maternal body mass
index and the risk of pregnancy complications in women delivering
singleton babies. Placenta. 33:611–618. 2012. View Article : Google Scholar
|
|
34
|
Burton GJ and Jauniaux E: What is the
placenta? Am J Obstet Gynecol. 213 (Suppl 4):S6 e1S6-82015.
View Article : Google Scholar
|
|
35
|
Gude NM, Roberts CT, Kalionis B and King
RG: Growth and function of the normal human placenta. Thromb Res.
114:397–407. 2004. View Article : Google Scholar : PubMed/NCBI
|
|
36
|
Burton GJ and Fowden AL: The placenta: A
multifaceted, transient organ. Philos Trans R Soc Lond B Biol Sci.
370:201400662015. View Article : Google Scholar
|
|
37
|
Li T, Hu D and Gong Y: Identification of
potential lncRNAs and co-expressed mRNAs in gestational diabetes
mellitus by RNA sequencing. J Matern Fetal Neonatal Med. Feb
22–2021.(Epub ahead of print). View Article : Google Scholar
|
|
38
|
Li D, Bao J, Yao J and Li J: lncRNA
USP2-AS1 promotes colon cancer progression by modulating Hippo/YAP1
signaling. Am J Transl Res. 12:5670–5682. 2020.PubMed/NCBI
|
|
39
|
Guo B, Yu L, Sun Y, Yao N and Ma L: Long
Non-Coding RNA USP2-AS1 accelerates cell proliferation and
migration in ovarian cancer by sponging miR-520d-3p and
Up-Regulating KIAA1522. Cancer Manag Res. 12:10541–10550. 2020.
View Article : Google Scholar : PubMed/NCBI
|