Introduction
Acute pancreatitis is a detrimental disease
characterized by local and systemic inflammatory symptoms (1). Inflammatory disorders with increased
levels of proinflammatory mediators, including interleukin-6
(IL-6), are a critical feature of acute pancreatitis, which is
associated with the premature activation of zymogens, such as
trypsinogen and chymotrypsinogen, within pancreatic acinar cells
(2,3). Oxidative stress and obesity are risk
factors for poor outcomes in acute pancreatitis. Obese patients
with acute pancreatitis exhibit higher inflammatory responses than
non-obese patients (4,5). Despite accumulating evidence
regarding the pathogenesis of acute pancreatitis, unresolved
questions concerning the relationship among obesity, adipohormones,
and the disease remain unaddressed.
The cholecystokinin (CCK) analog cerulein can induce
symptoms similar to those of human acute pancreatitis. Treatment
with high amounts of cerulein results in dysregulated digestive
enzyme production, cytoplasmic vacuolization, edema formation and
inflammatory cell infiltration into the pancreas (6,7).
Therefore, cerulein-induced acute pancreatitis is widely employed
to investigate the pathological mechanisms underlying acute
pancreatitis.
Resistin is a cysteine-rich adipocytokine secreted
by adipocytes and macrophages (8). Serum resistin levels increase with
obesity (9). Bokarewa et al
(10) have revealed that resistin
upregulates proinflammatory mediators such as tumor necrosis
factor-α (TNF-α) and IL-6 in human peripheral blood mononuclear
cells and mice joints under arthritic conditions. Resistin can
increase TNF-α in macrophages (11) and activate nuclear factor-κB
(NF-κB) to induce IL-6 expression in pancreatic acinar cells
(12). These studies suggested
that resistin is associated with major local and systemic
inflammatory responses. Jiang and Wang (13) have demonstrated that resistin
aggravates TNF-α and IL-6 expression in cerulein-treated pancreatic
acinar cells. Previously, it was demonstrated that resistin, which
binds to toll-like receptor 4, can amplify the effects of cerulein,
that binds to CCK receptor, for IL-6 expression via NADPH
oxidase-mediated reactive oxygen species (ROS) production in
pancreatic acinar cells (14).
In a clinical study, serum levels of resistin, IL-8
and C-reactive protein, which are inflammatory indices, were higher
in 32 patients with acute pancreatitis than in 30 healthy
individuals (15). Kibar et al
(16) have examined the
relationship between the severity of acute pancreatitis and serum
resistin levels in 59 patients with acute pancreatitis. C-reactive
protein and resistin levels were measured, along with other blood
parameters. Patients were divided into two groups: mild and
moderate/severe acute pancreatitis. It was found that the level of
serum resistin was an improved inflammatory marker than that of
C-reactive protein for determining the severity of acute
pancreatitis in humans. Similarly, Ściskalska et al (17) identified that the plasma levels of
resistin were 2-fold higher in 35 patients with acute pancreatitis
than those in 95 healthy individuals. Plasma levels of advanced
oxidation protein product (AOPP), mainly formed from oxidized
albumin (a predominant antioxidant in plasma), were higher in
patients with acute pancreatitis than in healthy individuals.
Accordingly, these findings suggested that increased resistin and
decreased albumin levels in plasma induce prooxidative effects of
resistin, resulting in enhanced levels of AOPP in patients with
acute pancreatitis. Taken together, increased resistin levels may
aggravate the severity of acute pancreatitis. Accordingly,
overproduction of obesity-associated resistin may aggravate the
severity of acute pancreatitis.
α-lipoic acid is an endogenous 6,8-dithiol-octanoic
acid, which is naturally synthesized in small amounts in humans
(18). During fatty acid
synthesis, α-lipoic acid is synthesized in the mitochondria from
octanoic acid, which binds to the acyl-carrier protein (19). In food sources, α-lipoic acid is
present in the form of lipoyllysine, a lipoic acid covalently bound
to lysine in proteins. Lipoyllysine-rich animal tissues include the
heart, kidneys, and liver, while broccoli and spinach are
vegetables enriched in lipoyllysine (20). Consumption of lipoyllysine-rich
food does not increase plasma levels of free lipoic acid (21,22). However, supplementation with free
α-lipoic acid (50 to 600 mg, as dose 1,000 times greater than the
dietary content) increases plasma levels of free α-lipoic acid
(23). Typically, plasma
concentrations of α-lipoic acid peak within ≤1 h, as it is rapidly
metabolized and excreted after oral ingestion (24–26).
α-lipoic acid reportedly functions as a powerful
antioxidant, distinguished by its remarkable biological activities,
such as scavenging of reactive oxygen and nitrogen species,
regeneration of other antioxidants, metal ion chelation and
activation of antioxidant signaling pathways (21,27–29). Hence, there is a surge of interest
in the pharmacological properties of α-lipoic acid, with an
increasing number of studies confirming its therapeutic effect in
several diseases, including diabetes, atherosclerosis,
neurodegeneration and acquired immune deficiency syndrome (30). In an acute pancreatitis model,
intraperitoneal injection of α-lipoic acid reduces the ratio of
pancreatic weight/body weight and serum levels of amylase, lipase
and cytokines (IL-1β, IL-6, TNF-α) in rats subcutaneously injected
with CCK (31). These studies
demonstrated the potentially protective effect of α-lipoic acid
against acute pancreatitis. However, whether α-lipoic acid can
ameliorate acute pancreatitis by reducing the production of
proinflammatory cytokines via the antioxidant signaling pathway
remains unclear.
Peroxisome proliferator-activated receptors (PPARs)
are transcription factors that represent the ligand-activated
nuclear receptors family, a member of the steroid receptor
superfamily (32,33). All subtypes of the PPAR family
(PPAR-α, -γ, and -β/δ) activate their target genes by forming
heterodimers with the retinoid X receptor and binding to PPAR
response elements (PPREs) of those genes (34). Each PPAR subtype displays various
biological functions. For example, PPAR-γ regulates lipid
metabolism and adipocyte differentiation. PPAR-γ plays a pivotal
role in regulating inflammation (35–37). Previously, it was revealed that
the PPAR-γ ligand troglitazone reduces IL-6 expression level by
inhibiting Janus kinase 2 (JAK2)/signal transducer and activator of
transcription 3 (STAT3) signaling in pancreatic acinar cells
(38). Furthermore, PPAR-γ acts
as a transcription factor for heme oxygenase 1 (HO-1) and catalase
by binding to PPREs in the target gene promoters. HO-1 is a
rate-limiting enzyme that protects cells against oxidative stress
(39,40). Krönke et al (41) have indicated that PPAR-γ, upon
ligand binding, is translocated to the nucleus, where it binds to
the HO-1 promoter to induce HO-1 expression. HO-1 supports the
protective role of PPAR-γ activation against various stressors
(42,43). Catalase mediates the protective
effects of PPAR-γ ligands against oxidative damage (44). Based on these studies, PPAR-γ is a
crucial regulator of redox signaling and exerts a protective effect
via the transcriptional activation of antioxidant genes.
In the present study, it was aimed to determine
whether α-lipoic acid inhibits the cerulein/resistin-induced
increase in ROS levels and IL-6 expression level by activating
PPAR-γ and upregulating its target genes HO-1 and catalase in
pancreatic acinar AR42J cells.
Materials and methods
Materials
Dichlorofluorescein diacetate (DCF-DA; cat. no.
D399), resistin, cerulein, α-lipoic acid and PPAR-γ antagonist
GW9662 were purchased from Sigma-Aldrich; Merck KGaA. HO-1
inhibitor protoporphyrin (ZnPP; cat. no. sc-691550) was purchased
from Santa Cruz Biotechnology, Inc. Resistin was dissolved in
distilled water to (final concentration: 100 µg/ml). Cerulein was
dissolved in phosphate-buffered saline containing 0.1% bovine serum
albumin (Gibco; Thermo Fisher Scientific, Inc.; final concentration
10−4 M). α-lipoic acid was dissolved in 0.5 M ethanol as
a solvent (final concentration, 250 mM). The PPAR-γ antagonist
GW9662 (Sigma-Aldrich; Merck KGaA) and the HO-1 inhibitor ZnPP were
both dissolved in dimethyl sulfoxide (DMSO; final concentration,
100 and 1 mM, respectively). All products were stored at −20°C
until use. Cells incubated with vehicle alone (<0.1%) served as
the control.
Cell line and culture conditions
Rat pancreatic acinar AR42J cells (pancreatoma, cat.
no. CRL-1492) were obtained from the American Type Culture
Collection and cultured as previously described (14).
Experimental protocol
First, to determine whether α-lipoic acid activates
PPAR-γ, cells were treated with α-lipoic acid (5 µM) alone for 1,
2, and 3 h, and protein levels of PPAR-γ and its target genes
catalase and HO-1 were assessed. To investigate the inhibitory
effect of α-lipoic acid on cerulein/resistin-induced alterations,
cells were pretreated with α-lipoic acid (2 or 5 µM) for 2 h. Then
the cells were pre-stimulated with resistin (2 ng/ml) for 30 min
prior to the addition of cerulein (10−8 M). Cells were
stimulated with cerulein/resistin for 45 min (for determination of
intracellular ROS, protein levels of PPAR-γ, catalase and HO-1, and
immunocytochemistry of PPAR-γ and catalase activity), 4 h (for IL-6
mRNA expression), and 24 h (for IL-6 protein levels). To determine
the role of PPAR-γ or HO-1 in mediating the protective effect of
α-lipoic acid on cerulein/resistin-induced changes, cells were
pretreated with the PPAR-γ antagonist GW9662 (10 µM) or the HO-1
inhibitor ZnPP (1 µM) with or without α-lipoic acid. After 2 h, the
cells were stimulated with cerulein/resistin. For each experiment,
the amount of a vehicle was less than 0.1%. A control experiment,
in which the vehicle alone was added, was performed simultaneously.
Pretreatment time, α-lipoic acid concentration and incubation time
of cerulein/resistin for determining ROS and IL-6 protein levels
were adapted from our previous studies (14,45).
Determination of intracellular ROS
levels
To measure intracellular ROS levels, cells
(2×10⁵ cells/well) in six-well plates were treated with
α-lipoic acid for 2 h and stimulated with cerulein/resistin for 45
min at 37°C. Intracellular ROS levels were determined by assessing
the intensity of DCF-DA as previously described (14).
Reverse transcription-quantitative
(RT-q) PCR analysis
mRNA expression of IL-6 was assessed using RT-qPCR,
as previously described (14).
Total RNA was isolated using the TRI reagent (RNA/DNA/Protein
isolation reagent, Molecular Research Center, Inc.). Total RNA (2
µg) was used for cDNA synthesis, and 100 Units MuLV reverse
transcriptase (Promega Corporation), 0.23 µl random hexamers (500
pg/ml; Promega Corporation), 1.25 µl dNTPs (10 mM), 0.63 µl RNasin
(40 U/ml) and 5 ml 5X reaction buffer [containing 50 mM Tris-HCl
(pH 8.3), 75 mM KCl, 3 mM MgCl2 and 10 mM DTT] were
added to the reaction. The 25-µl cDNA synthesis reaction mixture
was incubated at 23°C for 10 min, 37°C for 60 min and 95°C for 5
min. cDNA was used for qPCR with specific primers for IL-6 and
β-actin. Sequences of the IL-6 (accession number M26745) primers
used to produce the desired 242-bp PCR product were: forward,
5′-GCCCTTCAGGAACAGCTATGA-3′ and reverse,
5′-TGTCAACAACATCAGTCCCAAGA-3′. Sequences of the β-actin (accession
number XM_032887061.1) primers used to produce the desired 353-bp
PCR product were: forward, 5′-ACCAACTGGGACGATATGGAG-3′ and reverse,
5′-GTCAGGATCTTCATGAGGTAGTC-3′. cDNA was added in a SYBR Green
Realtime PCR Master Mix (Toyobo Life Science) containing 10 pg/ml
forward and reverse primers for IL-6 and β-actin. For PCR
amplification, the cDNA was amplified using the following
thermocycling conditions: 45 repeat cycles of denaturation at 95°C
for 30 sec, annealing at 53°C for 30 sec and extension at 72°C for
30 sec. During the first cycle, the denaturation step at 95°C was
extended to 3 min. Amplification specificity was validated by
melting curve analysis generated at the end of each reaction. All
genes presented a single peak in the melting curve, indicating the
absence of primer-dimer formation during the reaction and the
specificity of the amplification. Relative changes in gene
expression between untreated cells and treated cells were
determined using the 2−ΔΔCq method (46). Levels of the target transcript
were normalized to β-actin endogenous control and were constantly
expressed in the group.
Preparation of whole-cell extracts and
nuclear extracts
Whole cell extracts, cytosolic extracts and nuclear
extracts were prepared as previously described (47). Cells were harvested using
trypsin-ethylenediaminetetraacetic acid (EDTA), followed by
centrifugation at 1,000 × g for 5 min at 4°C. The pellets were
resuspended in lysis buffer containing 10 mM Tris (pH 7.4), 150 µM
NaCl, 1% Nonidet P-40, 0.5% sodium deoxycholate, 0.1% sodium
dodecyl sulfate and 1 tablet/50 ml complete protease inhibitor
(Roche Diagnostics GmbH). The cells were then lysed by drawing the
cells through a 1-ml syringe with several rapid strokes. The lysate
was incubated on ice for 30 min and then centrifuged at 13,000 × g
for 15 min at 4°C. The supernatants were collected as whole-cell
extracts. Cytosolic and nuclear extracts were prepared using a
NE-PER® nuclear and cytoplasmic extraction kit (Thermo
Fisher Scientific, Inc.) according to the manufacturer's
instructions. Briefly, the cells were suspended in cytoplasmic
extraction reagent containing protease inhibitor and vortexed for
15 sec, followed by centrifugation at 13,000 × g for 10 min at 4°C.
The supernatant was used as the cytosolic extract. The nuclear
pellets were resuspended in nuclear extraction reagent, vortexed,
and centrifuged at 13,000 × g for 10 min at 4°C. The supernatants
were collected and used as nuclear extracts. The specificity of the
nuclear extract was confirmed by the presence of lamin B1 in the
nuclear fraction. Protein concentrations were determined using the
Bradford assay (Bio-Rad Laboratories, Inc.). A standard curve was
developed using a series of bovine serum albumin (Sigma-Aldrich;
Merck KGaA). The specificities of the nuclear and cytosolic
extracts were confirmed by the predominant presence of lamin B1 in
the nuclear extracts and aldolase A in cytosolic extracts,
respectively.
Western blotting
Whole-cell extracts (10–40 µg protein/lane) were
loaded onto 8–12% sodium dodecyl sulfate-polyacrylamide gels and
separated by electrophoresis, and then transferred onto
nitrocellulose membranes (Amersham, Inc.) by electroblotting and
stained with Ponceau S for 5 min at 20–25°C. The membranes were
blocked with 3% non-fat dry milk in Tris-buffered saline and 0.2%
Tween-20 (TBS-T) for 1 h at 20–25°C and then incubated with
antibodies against PPAR-γ (cat. no. sc-7273; dilution 1/1,000;
Santa Cruz Biotechnology, Inc.), catalase (cat. no. ab16731;
dilution 1/1,000; Abcam), HO-1 (cat. no. ADI-SPA-895; dilution
1/1,000; Enzo Life Science, Inc.), lamin B1 (cat. no. ab16048;
dilution 1/500; Abcam), aldolase A (cat. no. sc-390733; dilution
1/1,000; Santa Cruz Biotechnology, Inc.) and actin (sc-1615;
dilution 1/2,000; Santa Cruz Biotechnology, Inc.) overnight at 4°C.
This was followed by incubation with secondary antibodies
[anti-goat (cat. no. sc-2354; dilution 1/3,000), anti-mouse (cat.
no. sc-2005; dilution 1/3,000) or anti-rabbit (cat. no. sc-2357;
dilution 1/3,000) conjugated to horseradish peroxidase; Santa Cruz
Biotechnology, Inc.] for 2 h at 20–25°C. Proteins were visualized
using an enhanced chemiluminescence detection system (Santa Cruz
Biotechnology, Inc.) and an EZ-Capture ST imaging system (ATTO
Corporation).
The intensity of each protein band was
densitometrically quantified using the ImageJ software version 1.47
(National Institutes of Health). Densitometry data represent the
mean ± standard error (SE) from three immunoblots and are shown as
the relative density of the protein bands normalized to the loading
control actin level. The ratio of the control group (cells without
cerulein/resistin stimulation and without α-lipoic acid treatment)
was set at 1.
Immunofluorescence staining
To measure the nuclear translocation of PPAR-γ,
cells on coverslips placed in six-well plates were pretreated with
α-lipoic acid for 2 h and then stimulated with cerulein/resistin
for 45 min. Immunofluorescence staining was performed as previously
described (48). Briefly, cells
were fixed with 4% formaldehyde for 10 min at 20–25°C,
permeabilized with 0.2% Triton X-100 for 10 min at 20–25°C, blocked
with blocking buffer containing 1% BSA and 0.1% gelatin for 1 h at
20–25°C, and then incubated with the primary antibody against
PPAR-γ (dilution 1/200) for 1 h at 20–25°C. After washing, the
cells were incubated with donkey anti-mouse IgG-fluorescein
isothiocyanate (FITC) (cat. no. sc-2099; dilution 1/200; Santa Cruz
Biotechnology, Inc.) for 1 h at 20–25°C. The cells were then washed
and covered with the antifade medium Vectashield containing
4′,6-diamidino-2-phenylindole (DAPI) for 30 min. Cells stained with
FITC were examined using a laser scanning confocal microscope
(Zeiss LSM 900; Carl Zeiss AG) and then images were captured. For
each coverslip, six fields were measured. Results were obtained
from four independent measurements (n=4 for each group). The
intensity ratio of green (PPAR-γ) to blue (DAPI) was assessed using
ImageJ v.5.0 (National Institutes of Health).
Enzyme-linked immunosorbent assay
(ELISA)
Briefly, cells (2×10⁵ cells/well) were
seeded in six-well plates. Then, cells were pretreated with or
without α-lipoic acid for 4 h and then stimulated with
cerulein/resistin for 24 h. IL-6 levels in the medium were
determined using an ELISA kit (cat no. #BMS625; Invitrogen; Thermo
Fisher Scientific, Inc.).
Determination of catalase
activities
Catalase activity was measured using a catalase
assay kit according to the manufacturer's instructions (cat. no.
ab83464; Abcam). Changes in H2O2 levels in
whole-cell extracts were measured by fluorometry (excitation and
emission at 535 and 587 nm) and used to calculate catalase
activities defined in units/mg protein.
Statistical analysis
Data values are expressed as the mean ± standard
error (n=12 for each group). Statistical analysis was performed
using one-way ANOVA followed by individual comparisons with Tukey's
post-hoc test. Data analysis was performed using the SPSS software
version 22.0 (IBM Corp.). P≤0.05 was considered to indicate a
statistically significant difference.
Results
α-lipoic acid increases the expression
levels of PPAR-γ and its target genes HO-1 and catalase in AR42J
cells
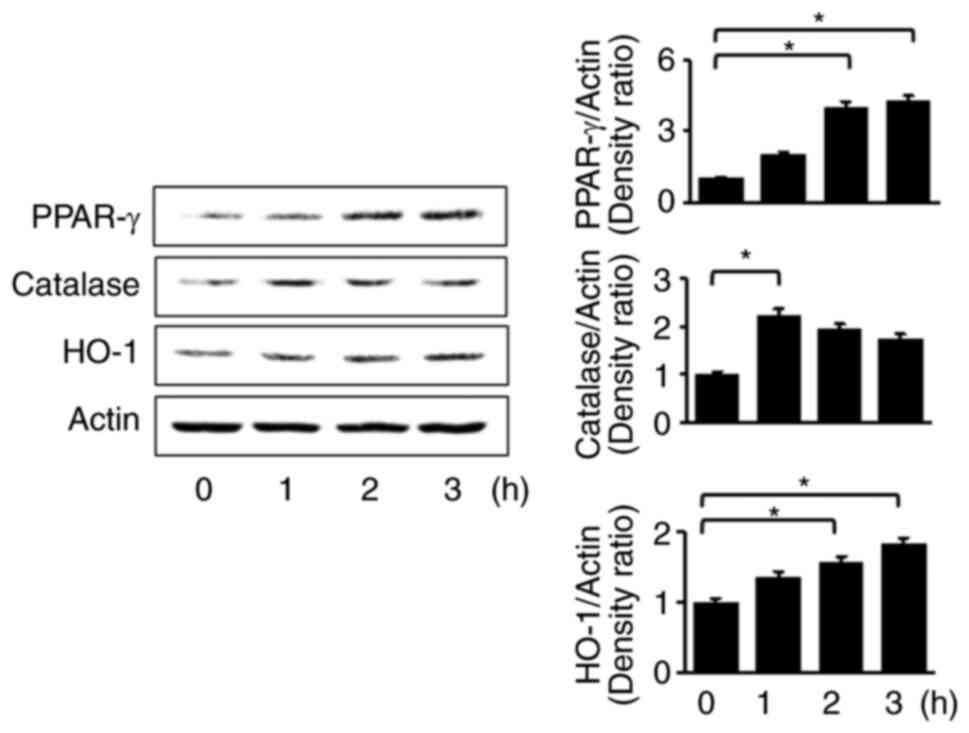
First, it was determined whether α-lipoic acid
induces the expression of PPAR-γ and its target genes HO-1 and
catalase in AR42J cells by measuring protein levels of PPAR-γ, HO-1
and catalase using western blot analysis. As revealed in Fig. 1, α-lipoic acid increased the
protein levels of PPAR-γ, HO-1 and catalase. Levels of both PPAR-γ
and HO-1 steadily increased until 3 h, while catalase levels
increased at 1 h and decreased during 3 h of incubation. Overall,
these results suggested that α-lipoic acid induces the expression
of HO-1 and catalase, possibly by activating PPAR-γ in AR42J cells.
Further study is necessary to determine whether α-lipoic acid
induces mRNA expression of PPAR-γ, HO-1 and catalase in AR42J
cells.
α-lipoic acid increases nuclear
translocation and expression levels of PPAR-γ and its target genes
HO-1 and catalase in cerulein/resistin-stimulated AR42J cells
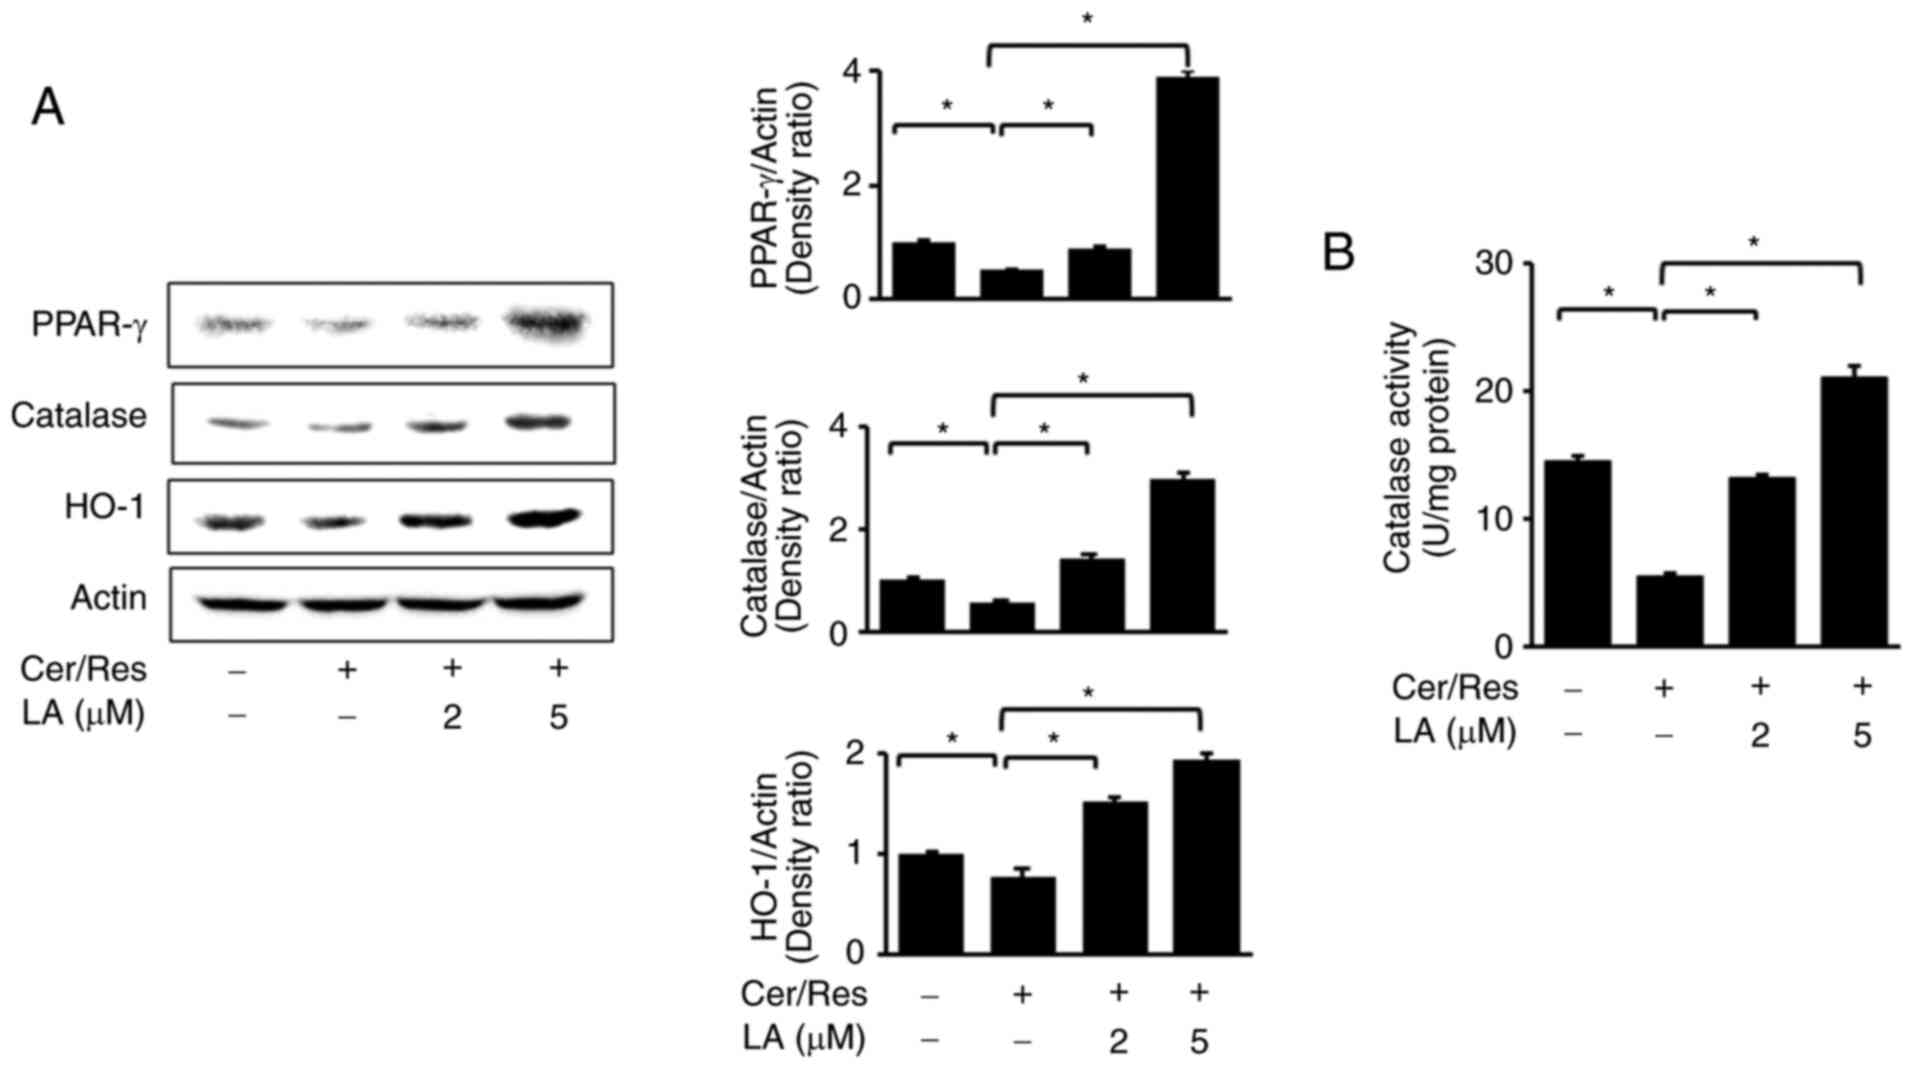
It was determined whether cerulein/resistin
decreased levels of PPAR-γ, HO-1 and catalase and whether α-lipoic
acid could inhibit these alterations. Protein levels of PPAR-γ,
HO-1 and catalase were determined by western blot analysis in
cerulein/resistin-stimulated cells. It was revealed that
cerulein/resistin decreased protein levels of PPAR-γ and its target
genes, HO-1 and catalase, in AR42J cells (Fig. 2A). Treatment with α-lipoic acid
reversed the cerulein/resistin-induced reduction in PPAR-γ, HO-1
and catalase in a dose-dependent manner. α-lipoic acid restored
catalase activity, which was decreased by cerulein/resistin
stimulation (Fig. 2B).
Using immunofluorescence staining, it was next
examined whether cerulein/resistin decreased nuclear levels of
PPAR-γ and whether α-lipoic acid reversed the nuclear level of
PPAR-γ in cerulein/resistin-stimulated cells (Fig. 3A). PPAR-γ is localized in the
cytosol of unstimulated cells, with minimal to no expression
detected in the nuclei. Cerulein/resistin treatment decreased the
nuclear level of PPAR-γ, which was increased by α-lipoic acid.
Additionally, cerulein/resistin stimulation reduced the nuclear and
cytosolic levels of PPAR-γ, which was prevented by α-lipoic acid
treatment (Fig. 3B). The indices
of cytosolic and nuclear extracts, aldolase A and lamin B1, were
not changed by treatment of cerulein/resistin with or without
α-lipoic acid in AR42J cells.
α-lipoic acid inhibits
cerulein/resistin-induced increases in intracellular ROS levels and
IL-6 expression levels in AR42J cells
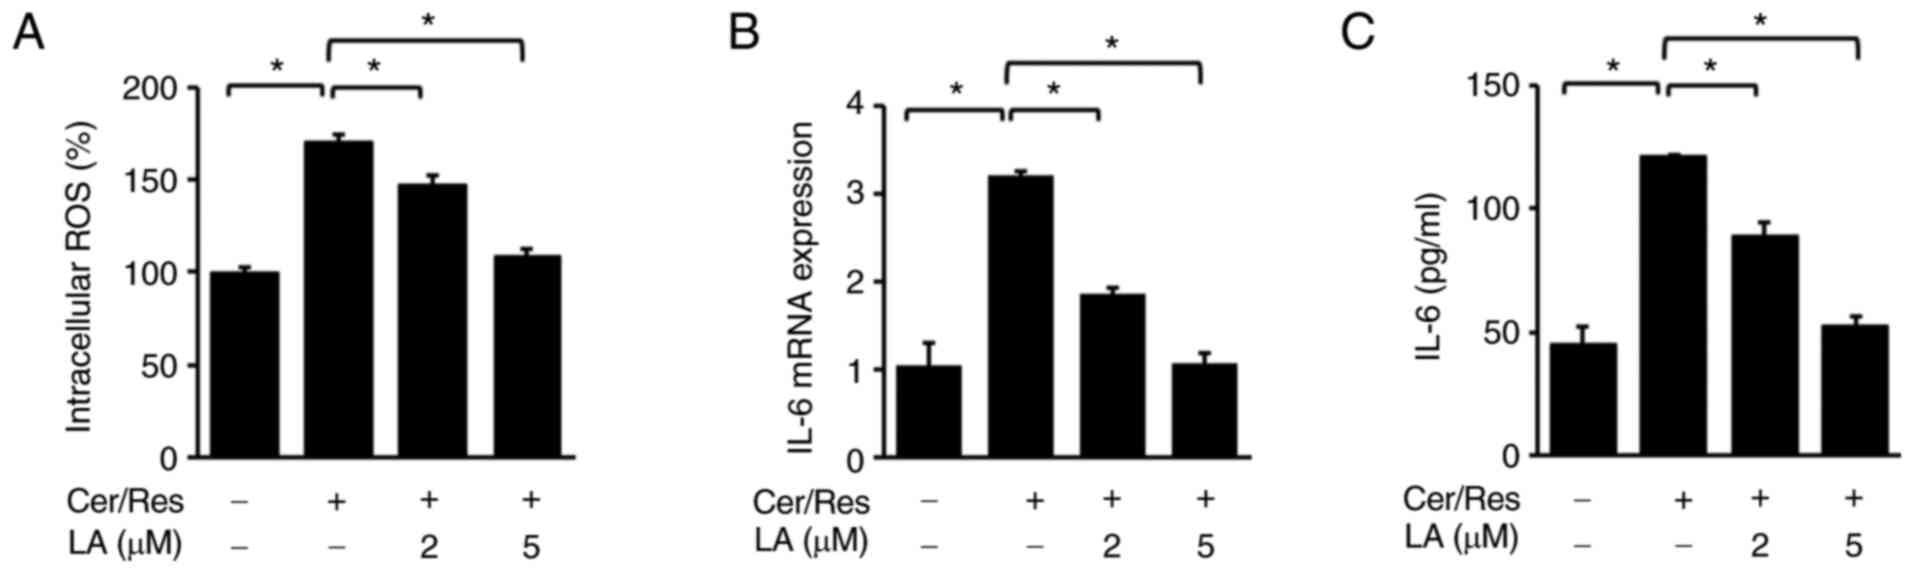
Next, the effect of α-lipoic acid on the
cerulein/resistin-induced increase in ROS levels and IL-6
expression level in AR42J cells was investigated. Cells were
stimulated with cerulein and resistin for 45 min (for intracellular
ROS levels, Fig. 4A), 4 h (for
IL-6 mRNA expression, Fig. 4B),
or 24 h (for IL-6 levels in the medium, Fig. 4C) in the absence or presence of
α-lipoic acid (2 or 5 µM). α-lipoic acid decreased intracellular
ROS levels in cerulein/resistin-stimulated cells in a
dose-dependent manner (Fig. 4A).
In addition, α-lipoic acid dose-dependently inhibited the
cerulein/resistin-induced increase in IL-6 mRNA and protein levels
(Fig. 4B and C).
GW9662 abolishes the effect of
α-lipoic acid on intracellular ROS levels and expression of IL-6,
HO-1 and catalase in cerulein/resistin-stimulated AR42J cells
To confirm the role of PPAR-γ in the antioxidant
mechanism of α-lipoic acid, cells were simultaneously treated with
the PPAR-γ antagonist GW9662 and α-lipoic acid (5 µM) for 2 h prior
to stimulation with resistin and cerulein for 45 min (for
intracellular ROS levels, western blot analysis and catalase
activity; Fig. 5A, C and D,
respectively) or 24 h (for IL-6 levels in the medium, Fig. 5B). In the presence of GW9662, the
ability of α-lipoic acid to ameliorate the
cerulein/resistin-induced increase in intracellular ROS levels
(Fig. 5A) and IL-6 protein levels
(Fig. 5B) was decreased. In
addition, GW9662 hindered the α-lipoic acid-induced increase in
HO-1 and catalase expression levels (Fig. 5C) and catalase activity (Fig. 5D). These findings provided
corroborating evidence that PPAR-γ is responsible for mediating the
α-lipoic acid-induced downregulation of IL-6 expression, decreased
ROS levels, and upregulation of HO-1 and catalase expression in
cerulein/resistin-stimulated cells.
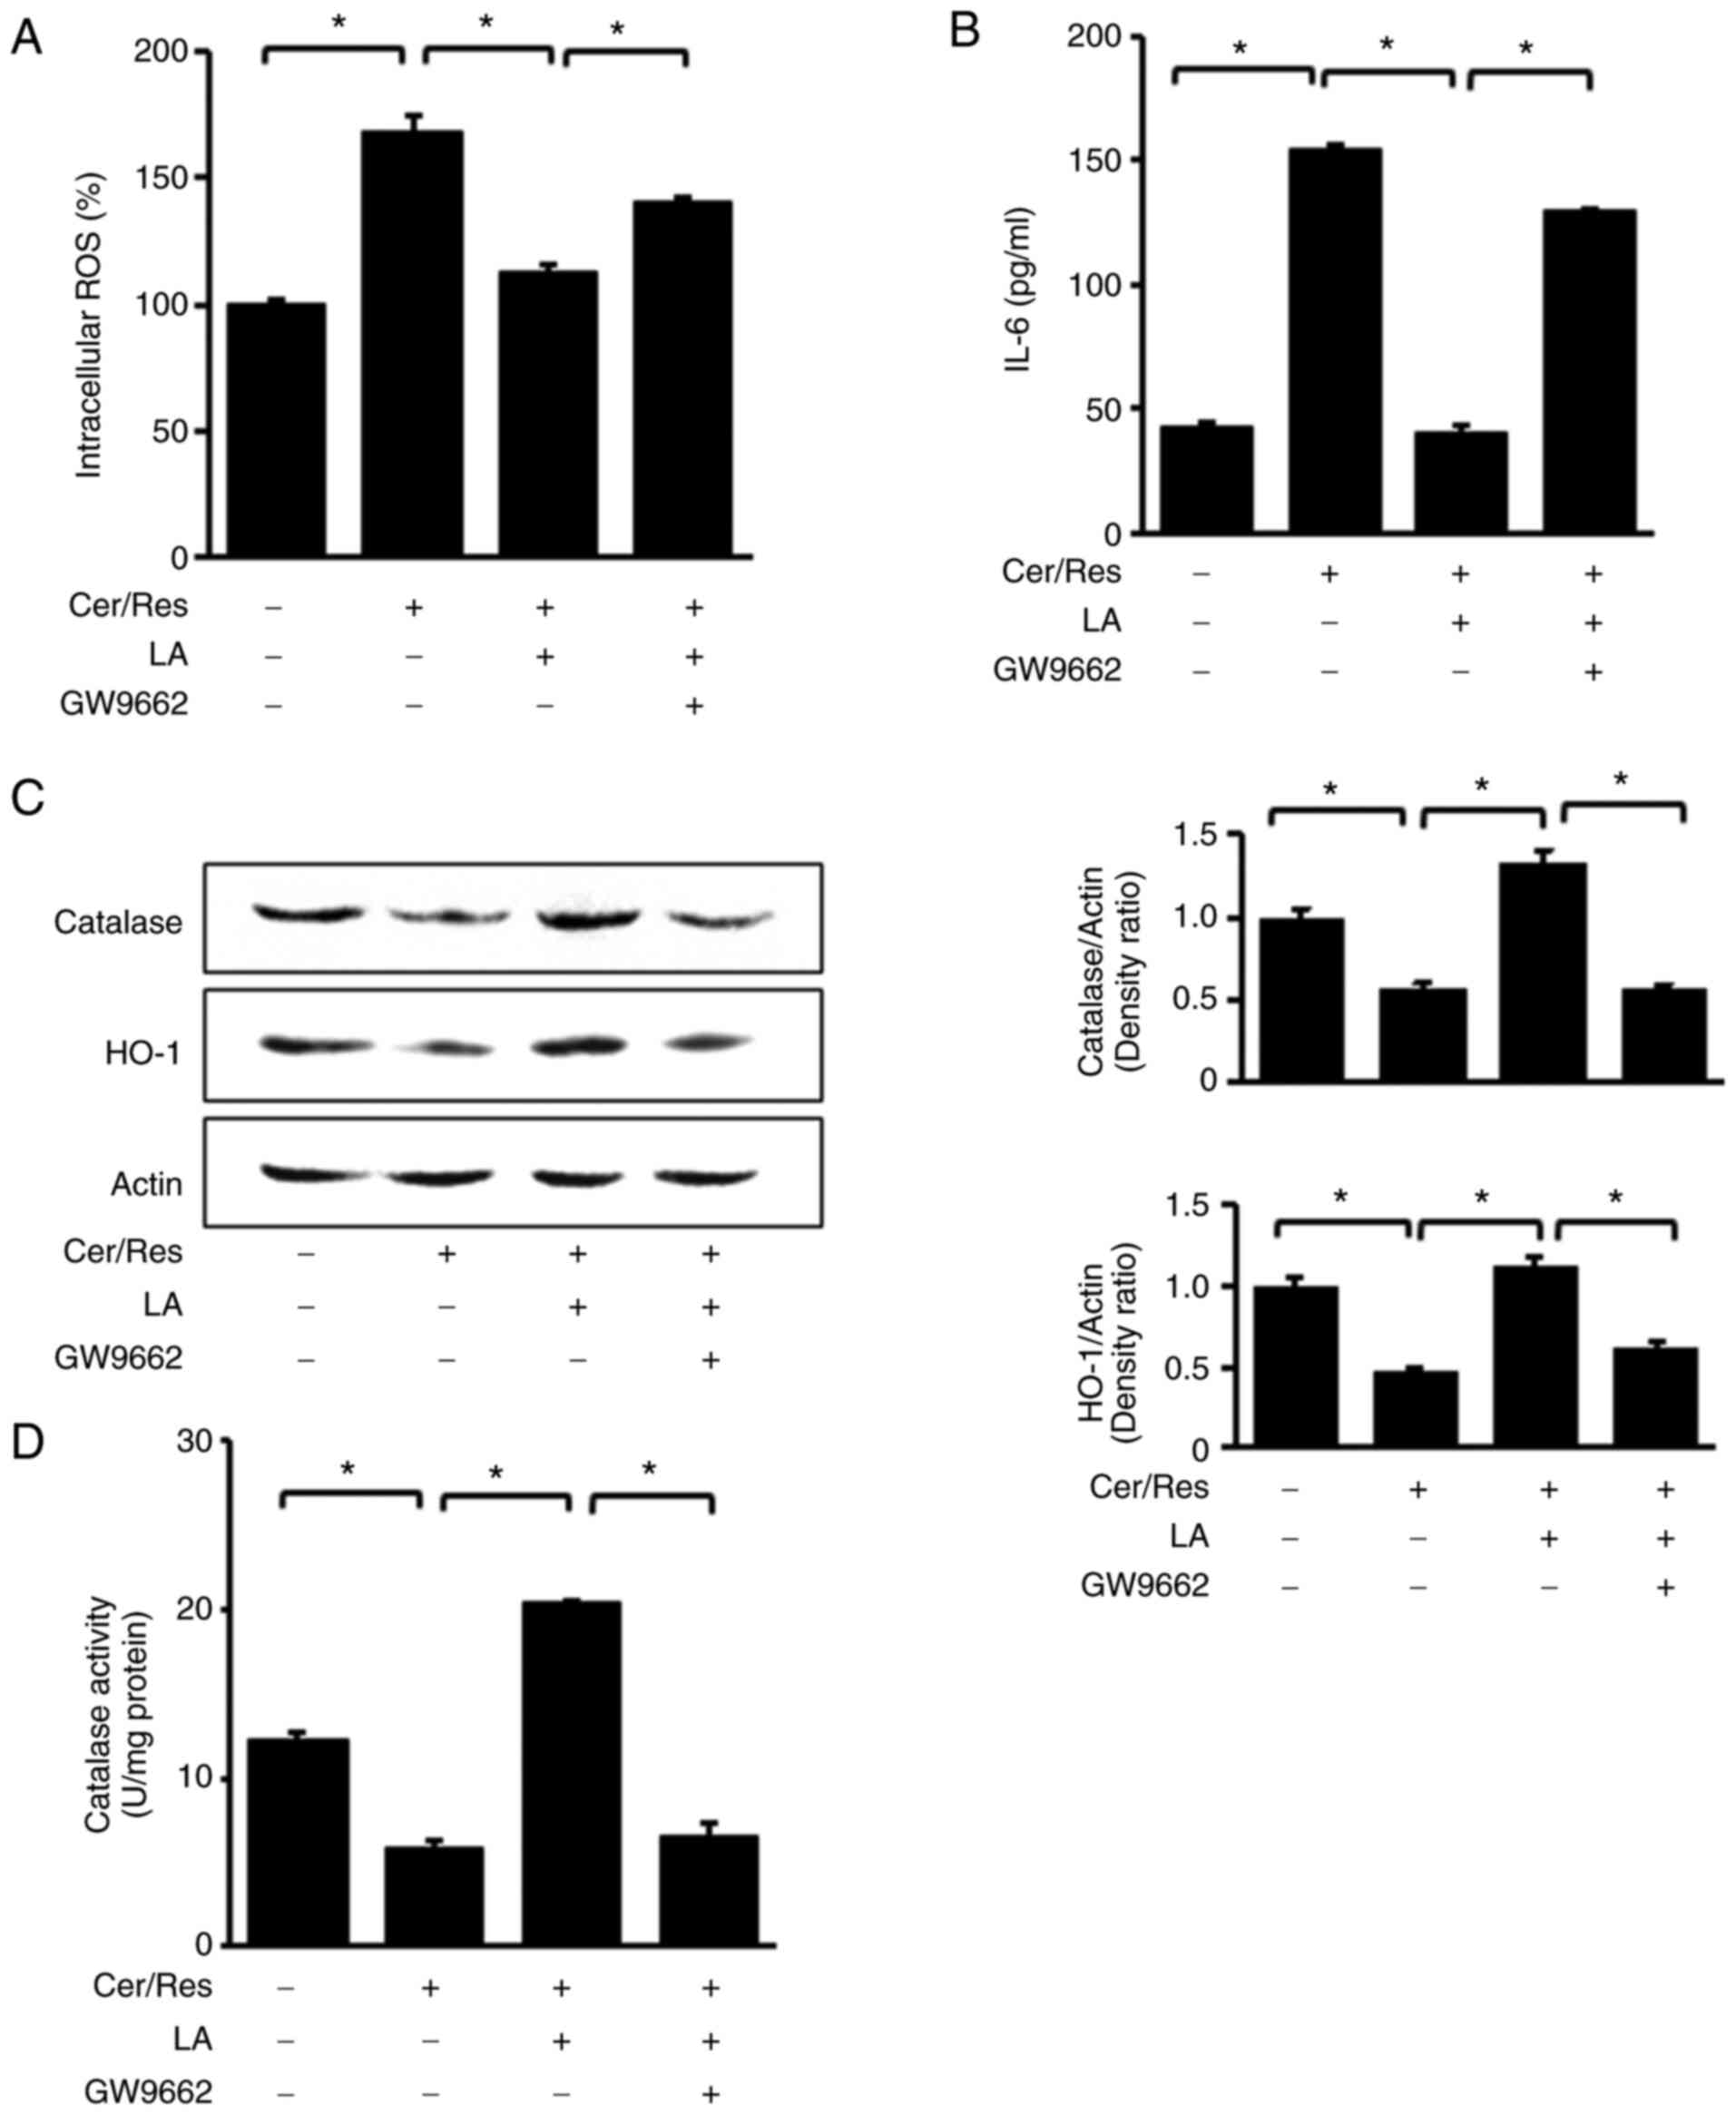 | Figure 5.Impact of PPAR-γ antagonist GW9662 on
the levels of intracellular ROS, IL-6, HO-1, and catalase in
cerulein/resistin-stimulated AR42J cells treated with α-lipoic
acid. Cells were co-treated with 10 µM GW9662 and 5 µM LA for 2 h,
followed by stimulation with Cer and Res for 45 min (A,C and D), or
24 h (B). (A) Intracellular ROS levels were measured using
dichlorofluorescein diacetate. Data are expressed as the mean ± SE
(n=12 for each group). (B) The protein level of IL-6 in the media
was determined by ELISA. (C) Protein levels of HO-1 and catalase in
whole-cell extracts were determined by western blot analysis. Actin
was used as the loading control (left panel). Densitometry data
represent mean ± SE from three immunoblots and are shown as the
relative density of protein band normalized to actin level (right
panel). (D) Catalase activity was determined using a catalase assay
kit. Data are expressed as the mean ± SE (n=12 for each group).
*P<0.05. PPAR-γ, peroxisome proliferator-activated receptor-γ;
ROS, reactive oxygen species; IL-6, intereukin-6; HO-1, heme
oxygenase-1; LA, α-lipoic acid; Cer, cerulein; Res, resistin; SE,
standard error. |
HO-1 inhibitor ZnPP abolishes the
inhibitory effect of α-lipoic acid on IL-6 expression and increases
ROS levels in cerulein/resistin-stimulated AR42J cells
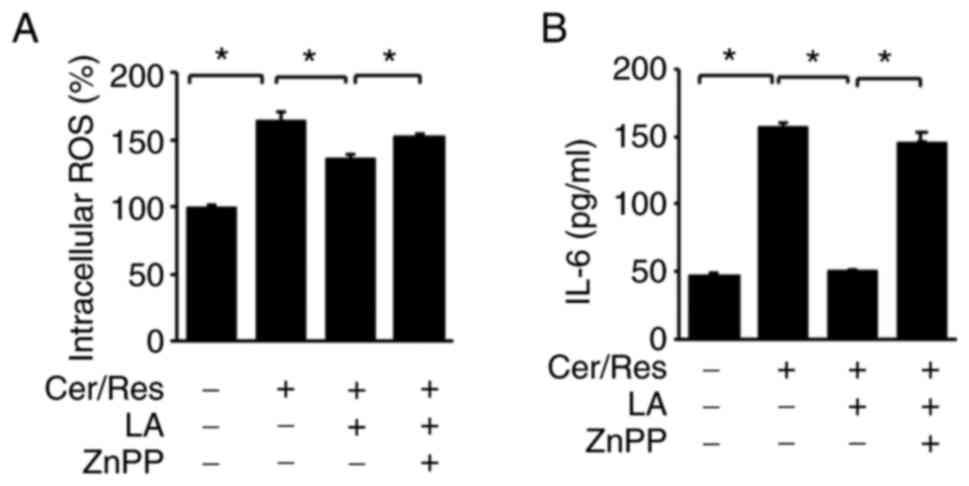
It was next sought to determine whether the
inhibitory effect of α-lipoic acid on ROS and IL-6 levels is
mediated by increased HO-1 expression level in
cerulein/resistin-stimulated cells. Cerulein/resistin-stimulated
AR42J cells were treated with α-lipoic acid in the presence or
absence of the HO-1 inhibitor ZnPP. As revealed in Fig. 6, α-lipoic acid decreased the
cerulein/resistin-induced increase in intracellular ROS levels and
IL-6 expression level. ZnPP treatment reversed the effect of
α-lipoic acid on IL-6 expression and intracellular ROS levels in
cerulein/resistin-stimulated cells. Therefore, α-lipoic acid
downregulated IL-6 expression and reduced ROS levels by inducing
the expression of the PPAR-γ target gene HO-1 in
cerulein/resistin-treated cells.
Discussion
In the present study, it was determined whether
α-lipoic acid ameliorates obesity-linked acute pancreatitis in
cerulein/resistin-stimulated pancreatic acinar AR42J cells. Acute
pancreatitis is a severe inflammatory disease with high mortality
and morbidity rates. Obesity is a risk factor for acute
pancreatitis. Patients with obesity tend to possess excess adipose
tissue, which leads to higher levels of adipokine secretion such as
resistin (4,5). Thus, resistin is recognized as a
novel marker for predicting the severity of acute pancreatitis
(13). It has been previously
demonstrated that resistin aggravates IL-6 expression and zymogen
activation in cerulein-stimulated pancreatic acinar cells (14). It was revealed that
cerulein/resistin could initiate Ca2+ overload, leading
to NADPH oxidase-mediated ROS production, resulting in NF-κB
activation in cerulein/resistin-stimulated AR42J cells.
Accordingly, a cocktail of resistin and cerulein was used to
establish an in vitro obesity-associated acute pancreatitis model
in the present study.
α-lipoic acid is an organosulfur compound commonly
found in plants and animals, including humans (18). α-lipoic acid functions as a
powerful antioxidant, and accumulating evidence has confirmed that
α-lipoic acid exhibits potential therapeutic effects against
diseases such as diabetes, atherosclerosis, tumors and
neurodegenerative diseases (30).
In the present study, α-lipoic acid decreased the
cerulein/resistin-induced increase in intracellular ROS levels and
IL-6 expression level in a dose-dependent manner.
Sechovcová et al (49) have reported that endogenous plasma
levels of lipoic acid range between <4.9 and 197.0 nmol/l,
determined using a conventional method. The authors developed a new
method using high-performance liquid chromatography to determine
endogenous lipoic acid levels. The endogenous lipoic acid
concentration in the plasma of non-supplemented voluntary blood
donors was <1.85 nmol/l. Borowczyk et al (50) have reported that the human plasma
concentration of α-lipoic acid is 0.12-5.0 nmol/ml. If the human
plasma concentration of α-lipoic acid is 5 nmol/ml, a plasma level
of 5 µM α-lipoic acid can be obtained from human participants
consuming α-lipoic acid-rich foods. A single oral supplementation
of α-lipoic acid (600 mg) is rapidly absorbed (peak at 58 min with
plasma concentration of 6.86±1.29 µg/ml), exhibiting high
bioavailability and low toxicity (51). Concentrations at 2 and 5 µM were
used for the cell culture system in the present study. Given that
the human plasma concentration of α-lipoic acid is variable, oral
supplementation with α-lipoic acid or consumption of α-lipoic
acid-rich foods may prevent obesity-associated acute
pancreatitis.
Considering the antioxidant mechanism of α-lipoic
acid, it was revealed that the treatment with α-lipoic acid
increased the expression levels of PPAR-γ and its target genes HO-1
and catalase in unstimulated AR42J cells. Furthermore, in
cerulein/resistin-stimulated AR42J cells, α-lipoic acid treatment
restored the cerulein/resistin-induced decrease in PPAR-γ
expression level and nuclear localization. A similar tendency was
observed in western blot analysis, where α-lipoic acid treatment
restored protein levels of PPAR-γ, HO-1, and catalase in a
dose-dependent manner in cerulein/resistin-stimulated AR42J
cells.
To examine the effect of PPAR-γ on
cerulein/resistin-stimulated AR42J cells, the PPAR-γ antagonist,
GW9662, which covalently modifies the ligand-binding site of PPAR-γ
and inhibits PPAR-γ-mediated transcription, was used (52). Combined treatment with α-lipoic
acid and GW9662 reversed the suppressive effect of α-lipoic acid on
the cerulein/resistin-induced increase in ROS and IL-6 levels and
decreased expression levels of HO-1 and catalase in AR42J cells.
These results confirmed that PPAR-g upregulates its target genes
HO-1 and catalase, thereby establishing their role in the
protective mechanism of α-lipoic acid in cerulein/resistin-treated
AR42J cells. To further investigate the effect of the PPAR-γ target
gene HO-1, the HO-1 inhibitor ZnPP, a metabolite generated during
heme biosynthesis, was used. High levels of ZnPP competitively
inhibit HO-1 (53). Therefore,
ZnPP has been widely used as a potent HO-1 inhibitor in
experimental studies. Treatment with ZnPP reversed the inhibitory
effect of α-lipoic acid on the cerulein/resistin-induced increase
in IL-6 expression and ROS levels in cerulein/resistin-stimulated
AR42J cells.
The present results revealed that α-lipoic acid
inhibited cerulein/resistin-induced increment of ROS and IL-6
levels in AR42J cells. α-lipoic acid could activate PPAR-γ and
upregulate the expression levels of its target genes HO-1 and
catalase in AR42J cells. Inhibition of PPAR-γ or HO-1 by GW9662 or
ZnPP, respectively, suppressed the inhibitory effect of α-lipoic
acid on cerulein/resistin-induced increase in ROS levels and IL-6
expression level. These results indicated that α-lipoic acid may
reduce ROS levels and IL-6 expression level by upregulating the
PPAR-γ signaling pathway in cerulein/resistin-stimulated AR42J
cells. Since other factors than ROS may mediate the development of
cerulein/resistin-induced pancreatitis, further study should be
performed to investigate whether α-lipoic acid alleviates the
overall symptoms of cerulein/resistin-induced pancreatitis.
In the present study, AR42J cells were used to
examine the pathological mechanisms of cerulein/resistin-induced
inflammatory events. AR42J cells are derived from chemically
induced rat pancreatic acinar carcinoma (54) and maintain the characteristics of
normal pancreatic acinar cells, including calcium signaling,
synthesis and secretion of digestive enzymes, receptor expression
and signal transduction mechanisms (54,55). Thus, AR42J cells have been widely
used to study the function of the exocrine pancreas and as an in
vitro model of cerulein-induced acute pancreatitis (56–61). In addition, several studies have
used AR42J cells as an in vitro model of resistin- or
cerulein/resistin-induced acute pancreatitis (12–14).
Lugea et al (62)
used human pancreatic acinar cells isolated from cadaveric donor
pancreata for transplantation. However, freshly isolated human
pancreatic acinar cells rapidly change their phenotype when placed
in culture. This includes losses of polarity, secretory
responsiveness, calcium mobilization in response to stimulation,
and other aspects of differentiation. Until now, there has been no
currently available human pancreas-derived cell lines which fully
represent the acinar cell phenotype and function.
Regarding the effect of cerulein on cell
proliferation, Chao et al (63)
demonstrated that blockade of cerulein-induced IL-6 accelerates
acinar cell apoptosis and attenuates experimental acute
pancreatitis in vivo. A neutralizing antibody against IL-6
effectively suppressed increase in serum amylase, IL-6 levels, and
pancreatitis-associated lung injury and caused induction of
apoptosis in the pancreatic acinar cells of mice with acute
pancreatitis. Our in vitro studies using pancreatic acinar cells
treating cerulein showed that 24-h treatment of cerulein
(10−7 M) increased protein level of apoptosis-inducing
factor (64). However, 4-h
treatment of cerulein (10−8 M) induced the expression of
genes related to proliferation and differentiation such as
lithostatin, progestin-induced protein and stathin 1 in pancreatic
acinar cells (65). In the
present study, AR42J cells were treated with cerulein
(10−8 M). Therefore, further study is necessary to
determine whether cerulein (10−8 M) affects cell death
to determine the relation of IL-6 expression and apoptosis in
pancreatic acinar cells.
Although the evidence obtained from the in vitro
cell culture model fails to precisely represent the events
occurring in human obesity-related acute pancreatitis, they could
provide a possible pathologic mechanism clarifying how resistin
aggravates acute pancreatitis. As previously described, blood
levels of resistin are higher in patients with acute pancreatitis
than in healthy individuals (15–17) and represent the severity of acute
pancreatitis; resistin treatment may increase inflammatory events
in cerulein-stimulated pancreatic acinar cells. Further studies are
warranted to determine the effect of α-lipoic acid on levels of
IL-6, ROS, PPAR-γ, HO-1 and catalase in pancreatic tissues and
nuclear levels of PPAR-γ in the pancreas of animals treated with
cerulein and resistin.
For the studies on agonist of PPAR-γ in
cerulein-stimulated AR42J cells, it was previously identified that
pre-treating cerulein (10−8 M)-stimulated AR42J cells
with PPAR-γ ligands, 15d-PGJ2 and troglitazone, inhibited
ROS-mediated JAK2/STAT3 activation and IL-6 expression (38). In addition, it was revealed that
troglitazone inhibited the cerulein (10−8 M)-induced
increase in ROS and IL-6 expression, but induced catalase
expression in AR42J cells (66).
From the previous study, the possible molecular
mechanism by which α-lipoic acid increases PPARγ protein expression
can be postulated. It was previously demonstrated that
docosahexaenoic acid acts as an agonist of PPARγ, which mediates
the expression of PPARγ-target catalase expression and reduce ROS
levels, leading to the inhibition of JAK2/STAT3 activation and IL-6
expression in cerulein-stimulated acinar cells (66). In the present study, it is evident
that α-lipoic acid activates PPARγ and induces catalase and HO-1
expression in AR42J cells stimulated with cerulein/resistin.
Further study should be performed to explore whether α-lipoic acid
binds to PPARγ to induce its target genes in AR42J cells.
In conclusion, α-lipoic acid activates PPAR-γ and
upregulates its downstream target antioxidant genes HO-1 and
catalase, thereby reducing ROS levels. Based on this molecular
mechanism, α-lipoic acid significantly suppresses
cerulein/resistin-induced IL-6 expression in pancreatic acinar
cells.
Acknowledgements
Not applicable.
Funding
The present study was supported, in part, by the BK21 FOUR
project, Yonsei University, Republic of Korea.
Availability of data and materials
All data generated or analyzed during this study are
included in this published article.
Authors' contributions
HK conceived and designed the experiments. JWL
assisted in the experimental design. YL performed the experiments.
YL and JWL analyzed the data. YL and JWL confirm the authenticity
of all the raw data. YL wrote the paper. HK reviewed and edited the
paper. All authors have read and approved the final version of the
manuscript.
Ethics approval and consent to
participate
Not applicable.
Patient consent for publication
Not applicable.
Competing interests
The authors declare that they have no competing
interests.
References
|
1
|
Dellinger E, Forsmark C, Layer P, Lévy P,
Maraví-Poma E, Petrov MS, Shimosegawa T, Siriwardena AK, Uomo G,
Whitcomb DC, et al: Determinant-based classification of acute
pancreatitis severity: An international multidisciplinary
consultation. Ann Surg. 256:875–880. 2012. View Article : Google Scholar : PubMed/NCBI
|
|
2
|
Bhatia M, Wong F, Cao Y, Lau HY, Huang J,
Puneet P and Chevali L: Pathophysiology of acute pancreatitis.
Pancreatology. 5:132–144. 2005. View Article : Google Scholar : PubMed/NCBI
|
|
3
|
Steer ML, Meldolesi J and Figarella C:
Pancreatitis-The role of lysosomes. Dig Dis Sci. 29:934–938. 1984.
View Article : Google Scholar : PubMed/NCBI
|
|
4
|
Abu Hilal M and Armstrong T: The impact of
obesity on the course and outcome of acute pancreatitis. Obes Surg.
18:326–328. 2008. View Article : Google Scholar : PubMed/NCBI
|
|
5
|
Sempere L, Martinez J, de Madaria E,
Lozano B, Sanchez-Paya J, Jover R and Perez-Mateo M: Obesity and
fat distribution imply a greater systemic inflammatory response and
a worse prognosis in acute pancreatitis. Pancreatology. 8:257–264.
2008. View Article : Google Scholar : PubMed/NCBI
|
|
6
|
Hofbauer B, Saluja AK, Lerch MM, Bhagat L,
Bhatia M, Lee HS, Frossard JL, Adler G and Steer ML: Intra-acinar
cell activation of trypsinogen during caerulein-induced
pancreatitis in rats. Am J Physiol. 275:G352–G362. 1998.PubMed/NCBI
|
|
7
|
Lerch MM and Adler G: Experimental animal
models of acute pancreatitis. Int J Pancreatol. 15:159–170.
1994.PubMed/NCBI
|
|
8
|
Steppan CM, Bailey ST, Bhat S, Brown EJ,
Banerjee RR, Wright CM, Patel HR, Ahima RS and Lazar MA: The
hormone resistin links obesity to diabetes. Nature. 409:307–312.
2001. View
Article : Google Scholar : PubMed/NCBI
|
|
9
|
Azuma K, Katsukawa F, Oguchi S, Murata M,
Yamazaki H, Shimada A and Saruta T: Correlation between serum
resistin level and adiposity in obese individuals. Obes Res.
11:997–1001. 2003. View Article : Google Scholar : PubMed/NCBI
|
|
10
|
Bokarewa M, Nagaev I, Dahlberg L, Smith U
and Tarkowski A: Resistin, an adipokine with potent proinflammatory
properties. J Immunol. 174:5789–5795. 2005. View Article : Google Scholar : PubMed/NCBI
|
|
11
|
Silswal N, Singh AK, Aruna B, Mukhopadhyay
S, Ghosh S and Ehtesham NZ: Human resistin stimulates the
pro-inflammatory cytokines TNF-alpha and IL-12 in macrophages by
NF-kappaB-dependent pathway. Biochem Biophys Res Commun.
334:1092–1101. 2005. View Article : Google Scholar : PubMed/NCBI
|
|
12
|
Jiang CY, Wang W, Tang JX and Yuan ZR: The
adipocytokine resistin stimulates the production of proinflammatory
cytokines TNF-α and IL-6 in pancreatic acinar cells via NF-κB
activation. J Endocrinol Invest. 36:986–992. 2013.PubMed/NCBI
|
|
13
|
Jiang CY and Wang W: Resistin aggravates
the expression of proinflammatory cytokines in cerulean-stimulated
AR42J pancreatic acinar cells. Mol Med Rep. 15:502–506. 2017.
View Article : Google Scholar : PubMed/NCBI
|
|
14
|
Kwak MS, Lim JW and Kim H: Astaxanthin
inhibits interleukin-6 expression in cerulein/resistin-stimulated
pancreatic acinar cells. Mediators Inflamm. 2021:55872972021.
View Article : Google Scholar : PubMed/NCBI
|
|
15
|
Daniel P, Leśniowski B, Mokrowiecka A,
Jasińska A, Pietruczuk M and Małecka-Panas E: Circulating levels of
visfatin, resistin and pro-inflammatory cytokine interleukin-8 in
acute pancreatitis. Pancreatology. 10:477–482. 2010. View Article : Google Scholar : PubMed/NCBI
|
|
16
|
Kibar YI, Albayrak F, Arabul M, Dursun H,
Albayrak Y and Ozturk Y: Resistin: New serum marker for predicting
severity of acute pancreatitis. J Int Med Res. 44:328–337. 2016.
View Article : Google Scholar : PubMed/NCBI
|
|
17
|
Ściskalska M, Marek G, Grzebieniak Z and
Milnerowicz M: Resistin as a prooxidant factor and predictor of
endothelium damage in patients with mild acute pancreatitis exposed
to tobacco smoke xenobiotics. Mediators Inflamm. 2017:30397652017.
View Article : Google Scholar : PubMed/NCBI
|
|
18
|
Reed LJ: A trail of research from lipoic
acid to alpha-keto acid dehydrogenase complexes. J Biol Chem.
276:38329–38336. 2001. View Article : Google Scholar : PubMed/NCBI
|
|
19
|
Solmonson A and DeBerardinis RJ: Lipoic
acid metabolism and mitochondrial redox regulation. J Biol Chem.
293:7522–7530. 2018. View Article : Google Scholar : PubMed/NCBI
|
|
20
|
Lodge LK, Youn HD, Handelman GJ, Konishi
T, Matsugo S, Mathur VV and Packer L: Natural sources of lipoic
acid: Determination of lipoyllysine released from protease-digested
tissues by high performance liquid chromatography incorporating
electrochemical detection. J Appl Nutr. 49:3–11. 1997.
|
|
21
|
Smith AR, Shenvi SV, Widlansky M, Suh JH
and Hagen TM: Lipoic acid as a potential therapy for chronic
diseases associated with oxidative stress. Curr Med Chem.
11:1135–1146. 2004. View Article : Google Scholar : PubMed/NCBI
|
|
22
|
Hermann R, Niebch G, Borbe HO,
Fieger-Büschges H, Ruus P, Nowak H, Riethmüller-Winzen H, Peukert M
and Blume H: Enantioselective pharmacokinetics and bioavailability
of different racemic α-lipoic acid formulations in healthy
volunteers. Eur J Pharm Sci. 4:167–174. 1996. View Article : Google Scholar
|
|
23
|
Salehi B, Berkay Yılmaz Y, Antika G,
Boyunegmez Tumer T, Fawzi Mahomoodally M, Lobine D, Akram M, Riaz
M, Capanoglu E, Sharopov F, et al: Insights on the use of α-lipoic
acid for therapeutic purposes. Biomolecules. 9:3562019. View Article : Google Scholar : PubMed/NCBI
|
|
24
|
Teichert J, Hermann R, Ruus P and Preiss
R: Plasma kinetics, metabolism, and urinary excretion of
alpha-lipoic acid following oral administration in healthy
volunteers. J Clin Pharmacol. 43:1257–1267. 2003. View Article : Google Scholar : PubMed/NCBI
|
|
25
|
Breithaupt-Grögler K, Niebch G, Schneider
E, Erb K, Hermann R, Blume HH, Schug BS and Belz GG:
Dose-proportionality of oral thioctic acid-coincidence of
assessments via pooled plasma and individual data. Eur J Pharm Sci.
8:57–65. 1999. View Article : Google Scholar : PubMed/NCBI
|
|
26
|
Evans JL, Heymann CJ, Goldfine ID and
Gavin LA: Pharmacokinetics, tolerability, and fructosamine-lowering
effect of a novel, controlled-release formulation of alpha-lipoic
acid. Endocr Pract. 8:29–35. 2002. View Article : Google Scholar : PubMed/NCBI
|
|
27
|
Jones W, Li X, Qu ZC, Perriott L,
Whitesell RR and May JM: Uptake, recycling, and antioxidant actions
of alpha-lipoic acid in endothelial cells. Free Radic Biol Med.
33:83–93. 2002. View Article : Google Scholar : PubMed/NCBI
|
|
28
|
Hagen TM, Vinarsky V, Wehr CM and Ames BN:
(R)-alpha-lipoic acid reverses the age-associated increase in
susceptibility of hepatocytes to tert-butylhydroperoxide both in
vitro and in vivo. Antioxid Redox Signal. 2:473–483. 2000.
View Article : Google Scholar : PubMed/NCBI
|
|
29
|
Fayez AM, Zakaria S and Moustafa D: Alpha
lipoic acid exerts antioxidant effect via Nrf2/HO-1 pathway
activation and suppresses hepatic stellate cells activation induced
by methotrexate in rats. Biomed Pharmacother. 105:428–433. 2018.
View Article : Google Scholar : PubMed/NCBI
|
|
30
|
Bilska A and Włodek L: Lipoic acid-the
drug of the future? Pharmacol Rep. 57:570–577. 2005.PubMed/NCBI
|
|
31
|
Park SJ, Seo SW, Choi OS and Park CS:
Alpha-lipoic acid protects against cholecystokinin-induced acute
pancreatitis in rats. World J Gastroenterol. 11:4883–4885. 2005.
View Article : Google Scholar : PubMed/NCBI
|
|
32
|
Berger J and Moller DE: The mechanisms of
action of PPARs. Annu Rev Med. 53:409–435. 2002. View Article : Google Scholar : PubMed/NCBI
|
|
33
|
Boitier E, Gautier JC and Roberts R:
Advances in understanding the regulation of apoptosis and mitosis
by peroxisome-proliferator activated receptors in pre-clinical
models: Relevance for human health and disease. Comp Hepatol.
2:32003. View Article : Google Scholar : PubMed/NCBI
|
|
34
|
Gearing KL, Göttlicher M, Teboul M,
Widmark E and Gustafsson JA: Interaction of the
peroxisome-proliferator-activated receptor and retinoid X receptor.
Proc Natl Acad Sci USA. 90:1440–1444. 1993. View Article : Google Scholar : PubMed/NCBI
|
|
35
|
Rogue A, Spire C, Brun M, Claude N and
Guillouzo A: Gene expression changes induced by PPAR gamma agonists
in animal and human liver. PPAR Res. 2010:3251832010. View Article : Google Scholar : PubMed/NCBI
|
|
36
|
Marx N, Bourcier T, Sukhova GK, Libby P
and Plutzky J: PPARgamma activation in human endothelial cells
increases plasminogen activator inhibitor type-1 expression:
PPARgamma as a potential mediator in vascular disease. Arterioscler
Thromb Vasc Biol. 19:546–551. 1999. View Article : Google Scholar : PubMed/NCBI
|
|
37
|
Rogue A, Lambert C, Jossé R, Antherieu S,
Spire C, Claude N and Guillouzo A: Comparative gene expression
profiles induced by PPARγ and PPARα/γ agonists in human
hepatocytes. PLoS One. 6:e188162011. View Article : Google Scholar : PubMed/NCBI
|
|
38
|
Yu JH, Kim KH and Kim H: SOCS 3 and
PPAR-gamma ligands inhibit the expression of IL-6 and TGF-beta1 by
regulating JAK2/STAT3 signaling in pancreas. Int J Biochem Cell
Biol. 40:677–688. 2008. View Article : Google Scholar : PubMed/NCBI
|
|
39
|
Abraham NG and Kappas A: Pharmacological
and clinical aspects of heme oxygenase. Pharmacol Rev. 60:79–127.
2008. View Article : Google Scholar : PubMed/NCBI
|
|
40
|
Kirkby KA and Adin CA: Products of heme
oxygenase and their potential therapeutic applications. Am J
Physiol Renal Physiol. 290:F563–F571. 2006. View Article : Google Scholar : PubMed/NCBI
|
|
41
|
Krönke G, Kadl A, Ikonomu E, Blüml S,
Fürnkranz A, Sarembock IJ, Bochkov VN, Exner M, Binder BR and
Leitinger N: Expression of heme oxygenase-1 in human vascular cells
is regulated by peroxisome proliferator-activated receptors.
Arterioscler Thromb Vasc Biol. 27:1276–1282. 2007. View Article : Google Scholar : PubMed/NCBI
|
|
42
|
Li M, Li Z, Sun X, Yang L, Fang P, Liu Y,
Li W, Xu J, Lu J, Xie M and Zhang D: Heme oxygenase-1/p21WAF1
mediates peroxisome proliferator-activated receptor-gamma signaling
inhibition of proliferation of rat pulmonary artery smooth muscle
cells. FEBS J. 277:1543–1550. 2010. View Article : Google Scholar : PubMed/NCBI
|
|
43
|
Bilban M, Bach FH, Otterbein SL, Ifedigbo
E, d'Avila JC, Esterbauer H, Chin BY, Usheva A, Robson SC, Wagner O
and Otterbein LE: Carbon monoxide orchestrates a protective
response through PPARgamma. Immunity. 24:601–610. 2006. View Article : Google Scholar : PubMed/NCBI
|
|
44
|
Chen T, Jin X, Crawford BH, Cheng H,
Saafir TB, Wagner MB, Yuan Z and Ding G: Cardioprotection from
oxidative stress in the newborn heart by activation of PPARγ is
mediated by catalase. Free Radic Biol Med. 53:208–215. 2012.
View Article : Google Scholar : PubMed/NCBI
|
|
45
|
Kyung S, Lim JW and Kim H: α-Lipoic acid
inhibits IL-8 expression by activating Nrf2 Signaling in
Helicobacter pylori-infected gastric epithelial cells. Nutrients.
11:25422019. View Article : Google Scholar
|
|
46
|
Livak KJ and Schmittgen TD: Analysis of
relative gene expression data using real-time quantitative PCR and
the 2(−Delta Delta C(T)) method. Methods. 25:402–408. 2001.
View Article : Google Scholar : PubMed/NCBI
|
|
47
|
Lee J, Lim JW and Kim H: Lycopene inhibits
oxidative stress-mediated inflammatory responses in
ethanol/palmitoleic acid-stimulated pancreatic acinar AR42J cells.
Int J Mol Sci. 22:21012021. View Article : Google Scholar : PubMed/NCBI
|
|
48
|
Choi J, Lim JW and Kim H: Lycopene
inhibits Toll-like receptor 4-mediated expression of inflammatory
cytokines in house dust mite-stimulated respiratory epithelial
cell. Molecules. 26:31272021. View Article : Google Scholar : PubMed/NCBI
|
|
49
|
Sechovcová S, Královcová P, Kanďár R and
Ventura K: The issue of HPLC determination of endogenous lipoic
acid in human plasma. Biomed Chromatogr. 32:e41722018. View Article : Google Scholar : PubMed/NCBI
|
|
50
|
Borowczyk K, Olejarz P, Chwatko G,
Szylberg M and Głowacki RA: Simplified method for simultaneous
determination of α-lipoic acid and low-molecular-mass thiols in
human plasma. Int J Mol Sci. 21:10492020. View Article : Google Scholar : PubMed/NCBI
|
|
51
|
Mignini F, Capacchietti M, Napolioni V,
Reggiardo G, Fasani R and Ferrari P: Single dose bioavailability
and pharmacokinetic study of a innovative formulation of α-lipoic
acid (ALA600) in healthy volunteers. Minerva Med. 102:475–482.
2011.PubMed/NCBI
|
|
52
|
Leesnitzer LM, Parks DJ, Bledsoe RK, Cobb
JE, Collins JL, Consler TG, Davis RG, Hull-Ryde EA, Lenhard JM,
Patel L, et al: Functional consequences of cysteine modification in
the ligand binding sites of peroxisome proliferator activated
receptors by GW9662. Biochemistry. 41:6640–6650. 2002. View Article : Google Scholar : PubMed/NCBI
|
|
53
|
Labbé RF, Vreman HJ and Stevenson DK: Zinc
protoporphyrin: A metabolite with a mission. Clin Chem.
45:2060–2072. 1999. View Article : Google Scholar : PubMed/NCBI
|
|
54
|
Christophe J: Pancreatic tumoral cell line
AR42J: An amphicrine model. Am J Physiol. 266:G963–G971.
1994.PubMed/NCBI
|
|
55
|
Blackmore M and Hirst BH: Autocrine
stimulation of growth of AR4-2J rat pancreatic tumour cells by
gastrin. Br J Cancer. 66:32–38. 1992. View Article : Google Scholar : PubMed/NCBI
|
|
56
|
Ju KD, Lim JW, Kim KH and Kim H: Potential
role of NADPH oxidase-mediated activation of Jak2/Stat3 and
mitogen-activated protein kinases and expression of TGF-β1 in the
pathophysiology of acute pancreatitis. Inflamm Res. 60:791–800.
2011. View Article : Google Scholar : PubMed/NCBI
|
|
57
|
Yu JH, Kim H and Kim KH: Calcium-dependent
apoptotic gene expression in cerulein-treated AR42J cells. Ann N Y
Acad Sci. 1010:66–69. 2003. View Article : Google Scholar : PubMed/NCBI
|
|
58
|
Gu L, Ge Z, Wang Y, Shen M, Zhao P and
Chen W: Double-stranded RNA-dependent kinase PKR activates NF-κB
pathway in acute pancreatitis. Biochem Biophys Res Commun.
503:1563–1569. 2018. View Article : Google Scholar : PubMed/NCBI
|
|
59
|
Zhao Q, Tang X, Huang J, Li J, Chen Q, Sun
Y and Wu J: Melatonin attenuates endoplasmic reticulum stress in
acute pancreatitis. Pancreas. 47:884–891. 2018. View Article : Google Scholar : PubMed/NCBI
|
|
60
|
Wang Y, Wang G, Cui L, Liu R, Xiao H and
Yin C: Angiotensin 1–7 ameliorates caerulein-induced inflammation
in pancreatic acinar cells by downregulating Toll-like receptor
4/nuclear factor-κB expression. Mol Med Rep. 17:3511–3518.
2018.PubMed/NCBI
|
|
61
|
Tang X, Tang G, Liang Z, Qin M, Fang C and
Zhang L: Effects of ghrelin miRNA on inflammation and calcium
pathway in pancreatic acinar cells of acute pancreatitis. Pancreas.
46:1305–1313. 2017. View Article : Google Scholar : PubMed/NCBI
|
|
62
|
Lugea A, Waldron RT, Mareninova OA,
Shalbueva N, Deng N, Su HY, Thomas DD, Jones EK, Messenger SW, Yang
J, et al: Human pancreatic acinar cells: Proteomic
characterization, physiologic responses, and organellar disorders
in ex vivo pancreatitis. Am J Pathol. 187:2726–2743. 2017.
View Article : Google Scholar : PubMed/NCBI
|
|
63
|
Chao KC, Chao KF, Chuang CC and Liu SH:
Blockade of interleukin 6 accelerates acinar cell apoptosis and
attenuates experimental acute pancreatitis in vivo. Brit J Surg.
93:332–338. 2006. View Article : Google Scholar : PubMed/NCBI
|
|
64
|
Yu JH, Kim KH and Kim H: Role of NADPH
oxidase and calcium in cerulein-induced apoptosis: Involvement of
apoptosis-inducing factor. Ann NY Acad Sci. 1090:292–297. 2006.
View Article : Google Scholar : PubMed/NCBI
|
|
65
|
Yu JH, Lim JW and Kim H: Altered gene
expression in cerulein-stimulated pancreatic acinar cells:
Pathologic mechanism of acute pancreatitis. Kor J Phsyiol
Pharmacol. 13:409–416. 2009. View Article : Google Scholar : PubMed/NCBI
|
|
66
|
Song EA, Lim JW and Kim H: Docosahexaenoic
acid inhibits IL-6 expression via PPARγ-mediated expression of
catalase in cerulein-stimulated pancreatic acinar cells. Int J
Biochem Cell Biol. 88:60–68. 2017. View Article : Google Scholar : PubMed/NCBI
|