Introduction
Efflux transporters, such as P-glycoprotein
(P-gp/ABCB1), multidrug resistance-associated protein (MRP/ABCC),
and breast cancer resistance protein (BCRP/ABCG2), are involved in
the active transport of endogenous substrates and xenobiotics. The
regulatory mechanisms of transporter expression and activity for
effective drug therapies must be understood as the expression and
activity of transporters could be a determinant of the
pharmacokinetics and efficiency of drugs. The induction of
inflammation is known to affect the expression, plasma membrane
localization, and transport activity of transporters (1–3).
In addition to our group, other research groups have demonstrated
that transporter expression is decreased and increased in the liver
and kidney, respectively, in some animal models of inflammation
(2,4). For example, our study revealed
opposing changes in P-gp and MRP2 expression in the livers and
kidneys of rats with adjuvant-induced arthritis (4). Similarly, Hartmann et al
reported that P-gp expression in the liver and kidney of mice
treated with lipopolysaccharide (LPS) decreased and increased,
respectively (2). However, it is
unclear why the effect of inflammation on transporter expression
differs between the liver and kidney.
Non-histone protein high mobility group box 1
(HMGB1), which participates in the sustenance of chronic
inflammation, is actively secreted by monocytes and macrophages,
and passively released from necrotic cells (5,6).
The binding of HMGB1 to Toll-like receptor (TLR)2, TLR4, and
receptor for advanced glycation end-products (RAGE) leads to the
activation of intracellular signaling for inflammation and NF-κB
(7–9). LPS-TLR4 signaling transduction
pathways contain MyD88-dependent and MyD88-independent signaling
pathways (10). MyD88-dependent
signaling pathway activates NF-kB via the upstream regulators such
as MyD88 and TRAF6, while MyD88-independent signaling pathway
activates IRF-3 via the upstream regulators such as TRAM and TRIF.
Further, the interaction between TLR4 and RAGE is important for the
plasma membrane localization of TLR4, RAGE, and HMGB1-induced
inflammation (11). HMGB1
complexed with LPS, interleukin-1, CXC chemokine ligand 12, or
CD24, but not HMGB1 alone, has cytokine functions (12–14). Some reports have revealed that
HMGB1 increases P-gp expression in the brain via the RAGE/NF-κB
signaling pathway (15–17). However, the role of HMGB1 in the
regulation of efflux transporters in the liver and kidney remains
unclear. Elucidating the involvement of HMGB1 in the regulation of
efflux transporters could help us understand the pharmacokinetics
of efflux transporter substrates in inflammation.
Accordingly, we sought to clarify whether HMGB1
regulates the expression of efflux transporters in the liver and
kidney during inflammation. Mice with LPS-induced inflammation were
employed as an acute inflammatory animal model, while glycyrrhizin
(GL) was employed as an inhibitor of HMGB1. The possible mechanisms
of HMGB1 inhibition by GL include binding to HMGB1 (18), inhibiting the phosphorylation of
HMGB1 (19), and decreasing HMGB1
release from cells (20,21). In the in vitro study, we
investigated the roles of HMGB1 in the regulation of P-gp in the
liver and kidney using human liver cancer HepG2 cells, human clear
cell renal carcinoma KMRC-1 cells, and a co-culture system of
KMRC-1 with macrophage-like cells.
Materials and methods
Chemicals and reagents
LPS from Escherichia coli was purchased from
Sigma-Aldrich Co., LLC. Sepasol-RNA I Super G, GL, Dulbecco's
modified Eagle's medium (DMEM), and phorbol 12-myristate 13-acetate
(PMA) were purchased from Nacalai Tesque Inc. ReverTra Ace was
purchased from Toyobo Co. Ltd. Fast SYBR Green Master Mix, Mem-PER
plus membrane protein extraction kit, and BCA protein assay kit
were purchased from Thermo Fisher Scientific Inc. Transaminase
CII-test Wako and MS-grade porcine pancreatic trypsin were obtained
from Fujifilm Wako Pure Chemical Co. Ltd. Recombinant human HMGB1
was obtained from Novus Biologicals. The Mouse/Rat HMGB1 ELISA Kit
was obtained from Arigo Biolaboratories Co. Recombinant human IFN-γ
was purchased from R&D Systems Inc. Oligonucleotide primers
were obtained from Eurofins Genomics Inc. All other chemicals and
solvents were of MS grade or higher and of commercially available
purity.
Animals and treatments
Five- to six-week-old male ICR mice were purchased
from Japan SLC Inc. Mice were housed in a climate-controlled room
at 24±2°C with relative humidity of 55±10% and a 12-h lighting
schedule (7:00 a.m. to 7:00 p.m.), including free access to
standard laboratory chow (MF; Oriental Yeast Co.). Mice were
treated with LPS (5 mg/kg, i.p.) or GL (200 mg/kg, i.p.) 1 h before
LPS (5 mg/kg, i.p.) (LPS + GL) (21,22) while control mice were treated with
saline as a vehicle or GL in saline. Six or 24 h after LPS
injection, LPS, LPS + GL, and control mice were assessed. The
livers and kidneys were excised from mice euthanized by sodium
pentobarbital (150 mg/kg, i.p.) as judged by cardiac and
respiratory arrest. The blood was collected from the central vein
of euthanized mice. The study protocol was approved by the
Committee for the Care and Use of Laboratory Animals of the Faculty
of Pharmacy of Kindai University (approval no. KAPS-2022-021;
Higashiosaka, Japan).
Plasma AST and ALT activities
Plasma aspartate aminotransferase (AST) and alanine
aminotransferase (ALT) levels were determined using the
transaminase CII-test Wako. Twenty microliters of plasma from
control and LPS mice at 6 and 24 h, and LPS + GL mice at 24 h, was
added to 500 µl AST or ALT substrates. After incubation for 5 min
at 37°C, chromogenic substrates were added to the reaction
solutions. Absorbance at 540 nm was measured using an absorption
spectrometer (Sunrise R, TECAN Group Ltd.). The activities of AST
and ALT were estimated using standard curves.
Plasma HMGB1 concentrations
HMGB1 concentrations in the plasma of control, LPS,
and LPS + GL mice were determined using the Mouse/Rat HMGB1 ELISA
kit. Briefly, we added 100 µl of plasma to antibody-coated
microplates. Thereafter, HRP-conjugated antibodies were added to
each well. After 16 h at 4°C, each well was washed with the wash
buffer. 3,3′,5,5′-tetramethylbenzidine substrate was then added,
and the absorbance at 450 nm was measured using an absorption
spectrometer (Sunrise R). The HMGB1 concentration was estimated
using a standard curve.
mRNA levels of transporters and HMGB1
receptors in the liver and kidney
Total RNA was extracted from the liver and kidney of
control, LPS, and LPS + GL mice, HepG2 cells, KMRC-1 cells, and M1
macrophages derived from THP-1 cells (M1) using Sepasol RNA I Super
G, and reverse transcribed into complementary DNA using ReverTra
Ace qPCR RT Master Mix. The PCR mixtures were incubated at 95°C for
10 sec and then amplified at 95°C for 5 sec, 57°C for 20 sec, and
72°C for 40 sec for 40 cycles using Fast SYBR Green Master Mix. The
oligonucleotide sequences of the primers used for each mRNA target
are shown in Table I. Data were
analyzed using the StepOne Real-Time PCR System (Thermo Fisher
Scientific, Inc.) and the multiplex comparative method. The target
mRNA levels were normalized to those of β-actin.
 | Table I.Primer sequences used in reverse
transcription-quantitative PCR. |
Table I.
Primer sequences used in reverse
transcription-quantitative PCR.
| Gene | Primer sequence,
5′-3′ | Product size,
bp |
|---|
| mMdr1a | Forward:
CTTCATCATGAAACTGCCCCA | 138 |
|
| Reverse:
GCCTCGTCCAACAAAAGGATC |
|
| mMdr1b | Forward:
TTGAAGCCGTAAGAGGCTGAG | 140 |
|
| Reverse:
TTCAAACTCCATCACCACCTCAC |
|
| mMrp2 | Forward:
AGACAGCGGCAAGATTGTTG | 99 |
|
| Reverse:
ACACTTTCAATGCCGGCTTC |
|
| mBcrp | Forward:
CTGGTCCTCTCCCTGCTTTTT | 183 |
|
| Reverse:
TGCCTTTCTCTGCTATGTGTAATG |
|
| mTlr2 | Forward:
TAGGGGCTTCACTTCTCTGCT | 144 |
|
| Reverse:
CACCAAGATCCAGAAGAGCCA |
|
| mTlr4 | Forward:
TCATGGCACTGTTCTTCTCCT | 125 |
|
| Reverse:
AGAAGGAATGTCATCAGGGACTT |
|
| mRage | Forward:
ACACTCGTGAAGGAAGAGACC | 108 |
|
| Reverse:
GAAGGTAGGATGGGTGGTTC |
|
|
mβ-actin | Forward:
GATCAAGATCATTGCTCCTCCTG | 171 |
|
| Reverse:
GCAGCTCAGTAACAGTCCGC |
|
| hMDR1 | Forward:
AGGCCAACATACATGCCTTCATC | 163 |
|
| Reverse:
GCTGACGTGGCTTCATCCAA |
|
| hTLR2 | Forward:
GACTCTACCAGATGCCTCCC | 135 |
|
| Reverse:
AAGTTATTGCCACCAGCTTCC |
|
| hTLR4 | Forward:
TGGATCAAGGACCAGAGGCA | 141 |
|
| Reverse:
GAGGACCGACACACCAATGA |
|
| hRAGE | Forward:
CCCTGCTCATTGGGGTCATC | 139 |
|
| Reverse:
GTACTACTCTCGCCTGCCTC |
|
| hMyD88 | Forward:
GAGGCTGAGAAGCCTTTACAGG | 129 |
|
| Reverse:
GCAGATGAAGGCATCGAAACGC |
|
| hTRAF6 | Forward:
CAATGCCAGCGTCCCTTCCAAA | 142 |
|
| Reverse:
CCAAAGGACAGTTCTGGTCATGG |
|
| hTRIF | Forward:
ACCTTCTGCGAGGATTTCCAGG | 113 |
|
| Reverse:
CGACAGTCGAAGTTGGAGGTGA |
|
| hIRF3 | Forward:
TCTGCCCTCAACCGCAAAGAAG | 151 |
|
| Reverse:
TACTGCCTCCACCATTGGTGTC |
|
|
hβ-actin | Forward:
CACCATTGGCAATGAGCGGTTC | 135 |
|
| Reverse:
AGGTCTTTGCGGATGTCCACGT |
|
Protein levels of P-gp and HMGB1
receptors in the kidney by LC-MS/MS-based targeted proteomics
The protein levels of P-gp, Tlr2, Tlr4, and Rage in
the kidney were determined using LC-MS/MS-based targeted
proteomics, as described previously (23,24). Briefly, membrane proteins were
extracted from the kidneys of the control, LPS, and LPS + GL mice
using a Mem-PER plus membrane protein extraction kit. After
reduction and alkylation of 200 µg proteins, MS-grade porcine
pancreatic trypsin was added to the reaction mixture, including
proteins and 10 pmol reference AQUA peptide
[(H)H(PC13N15)DASVNFSEFSK(OH), Sigma-Aldrich Co., LLC.]. The
surrogate peptides for the target proteins, as shown in Table II, were measured using an
LC-MS/MS system (UltiMate 3000 series, Thermo Fisher Scientific,
Inc.) and a TSQ Endura Triple Quadrupole Mass Spectrometer with
electrospray ionization (Thermo Fisher Scientific, Inc.). Finigan
Xcalibur software (Thermo Fisher Scientific, Inc.) was used for
data recording and analysis. The relative protein expression levels
to control were evaluated by dividing the area of surrogate peptide
by the area of reference AQUA peptide obtained from each sample
using Skyline software V.21 (MacCoss Lab at the University of
Washington, USA).
| Table II.Surrogate amino acid sequences for
targeted proteins. |
Table II.
Surrogate amino acid sequences for
targeted proteins.
| Protein | Sequence |
|---|
| Mdr1a | ATVSASHIIR |
| Mdr1b | GIYFSMVQAGAK |
| Tlr2 | NYQSQSLK |
| Tlr4 |
DFIPGVAIAANIIQEGFHK |
| Rage |
VYQIPGKPEIVDPASELTASVPNK |
Cell culture and treatments
Human liver cancer HepG2 cells and the human
monocytic cell line, THP-1, were obtained from RIKEN BRC. Human
clear cell renal carcinoma KMRC-1 cells were obtained from JCRB
Cell Bank. HepG2 and KMRC-1 cells were maintained in DMEM
supplemented with 10% fetal bovine serum, 100 U/ml penicillin, and
100 µg/ml streptomycin. THP-1 cells were maintained in RPMI 1640
medium supplemented with 10% fetal bovine serum, 100 U/ml
penicillin, and 100 µg/ml streptomycin. Cells were grown at 37°C in
a humidified incubator equilibrated with 5% CO2. HepG2
and KMRC-1 cells were subcultured every 3–4 days using 0.25%
trypsin and 1 mM EDTA. THP-1 cells were sub-cultured every 3–4 days
via dilution with fresh medium.
HepG2 or KMRC-1 cells were seeded at
5×10⁴ cells/cm2 in 24-well plates (Sumitomo
Bakelite Co. Ltd.) 1 d before treatment. HepG2 cells or KMRC-1
cells were treated with LPS alone (0.01–10 µg/ml).
THP-1 monocytes were differentiated into M0
macrophages (M0) after 24 h of incubation with 150 nM PMA. M0
macrophages were polarized in classically activated M1 by
incubation with 20 ng/ml IFN-γ and 10 pg/ml LPS for 24 h. KMRC-1
cells co-culture with M1 (KMRC-1/M1) were performed under 24-well
plate with Falcon cell culture inserts (pore size: 0.4 µm; upper
compartment: M1; lower compartment: KMRC-1 cells) in fresh DMEM at
KMRC-1 cells:M1 ratio of 1:0.4 (inflamed conditions) (25).
Statistical analysis
Differences between means were analyzed by one-way
analysis of variance followed by the Bonferroni test or by unpaired
Student's t-test. The correlation between the TLR2/4 or
RAGE mRNA levels and the MDR1 mRNA levels was
evaluated by Pearson's correlation and regression analysis.
GraphPad Prism 5 was used for all statistical analyses. P<0.05
was considered to indicate a statistically significant
difference.
Results
Plasma AST and ALT activities
To determine whether HMGB1 affects the expression of
efflux transporters and HMGB1 receptors in the liver and kidney of
mice with inflammation, control, LPS, and LPS + GL mice were used.
Table III shows the body
weight, liver weight, kidney weight, and plasma AST and ALT levels
of control, LPS, and LPS + GL mice. Body, liver, and kidney weights
were unchanged after treatment with LPS or LPS + GL at 6 and 24 h.
Both AST and ALT levels in LPS mice were significantly higher than
those in control mice. The combination of GL and LPS resulted in
significant decreases in both AST and ALT levels compared to levels
found in LPS mice (Table
III).
| Table III.Body weight, liver weight, kidney
weight, plasma AST, and ALT levels in control, LPS, and LPS + GL
mice. Mice were treated with vehicle, LPS (50 mg/kg, i.p.),
or LPS (50 mg/kg, i.p.) combined with GL (200 mg/kg,
i.p.). The organs and plasma were collected 6 h and 24 h
after saline or LPS injection. |
Table III.
Body weight, liver weight, kidney
weight, plasma AST, and ALT levels in control, LPS, and LPS + GL
mice. Mice were treated with vehicle, LPS (50 mg/kg, i.p.),
or LPS (50 mg/kg, i.p.) combined with GL (200 mg/kg,
i.p.). The organs and plasma were collected 6 h and 24 h
after saline or LPS injection.
| Time | Group | Body weight, g | Liver weight,
g | Liver weight/body
weight | Kidney weight,
g | Kidney weight/body
weight | AST, IU/l | ALT, IU/l |
|---|
| 6 h | Control | 29.8±0.45 | 1.96±0.05 | 0.066±0.002 | 0.56±0.03 | 0.019±0.001 | 14.2±2.8 | 14.5±7.4 |
|
| LPS | 29.2±0.84 | 1.90±0.05 | 0.065±0.001 | 0.50±0.04 | 0.017±0.001 |
38.7±18.8a |
61.3±35.3b |
|
| LPS + GL | 31.2±1.10 | 1.94±0.15 | 0.062±0.005 | 0.51±0.02 | 0.017±0.001 |
16.8±6.6d |
23.5±3.5d |
| 24 h | Control | 30.0±1.41 | 1.80±0.09 | 0.060±0.005 | 0.49±0.07 | 0.016±0.002 | 13.3±2.8 | 17.0±1.1 |
|
| LPS | 29.7±1.63 | 1.75±0.12 | 0.058±0.004 | 0.56±0.05 | 0.019±0.002 |
34.1±6.3c |
23.8±5.1a |
|
| LPS + GL | 28.7±1.03 | 1.78±0.14 | 0.063±0.004 | 0.61±0.10 | 0.021±0.003 | 26.9±6.4 |
13.0±2.1e |
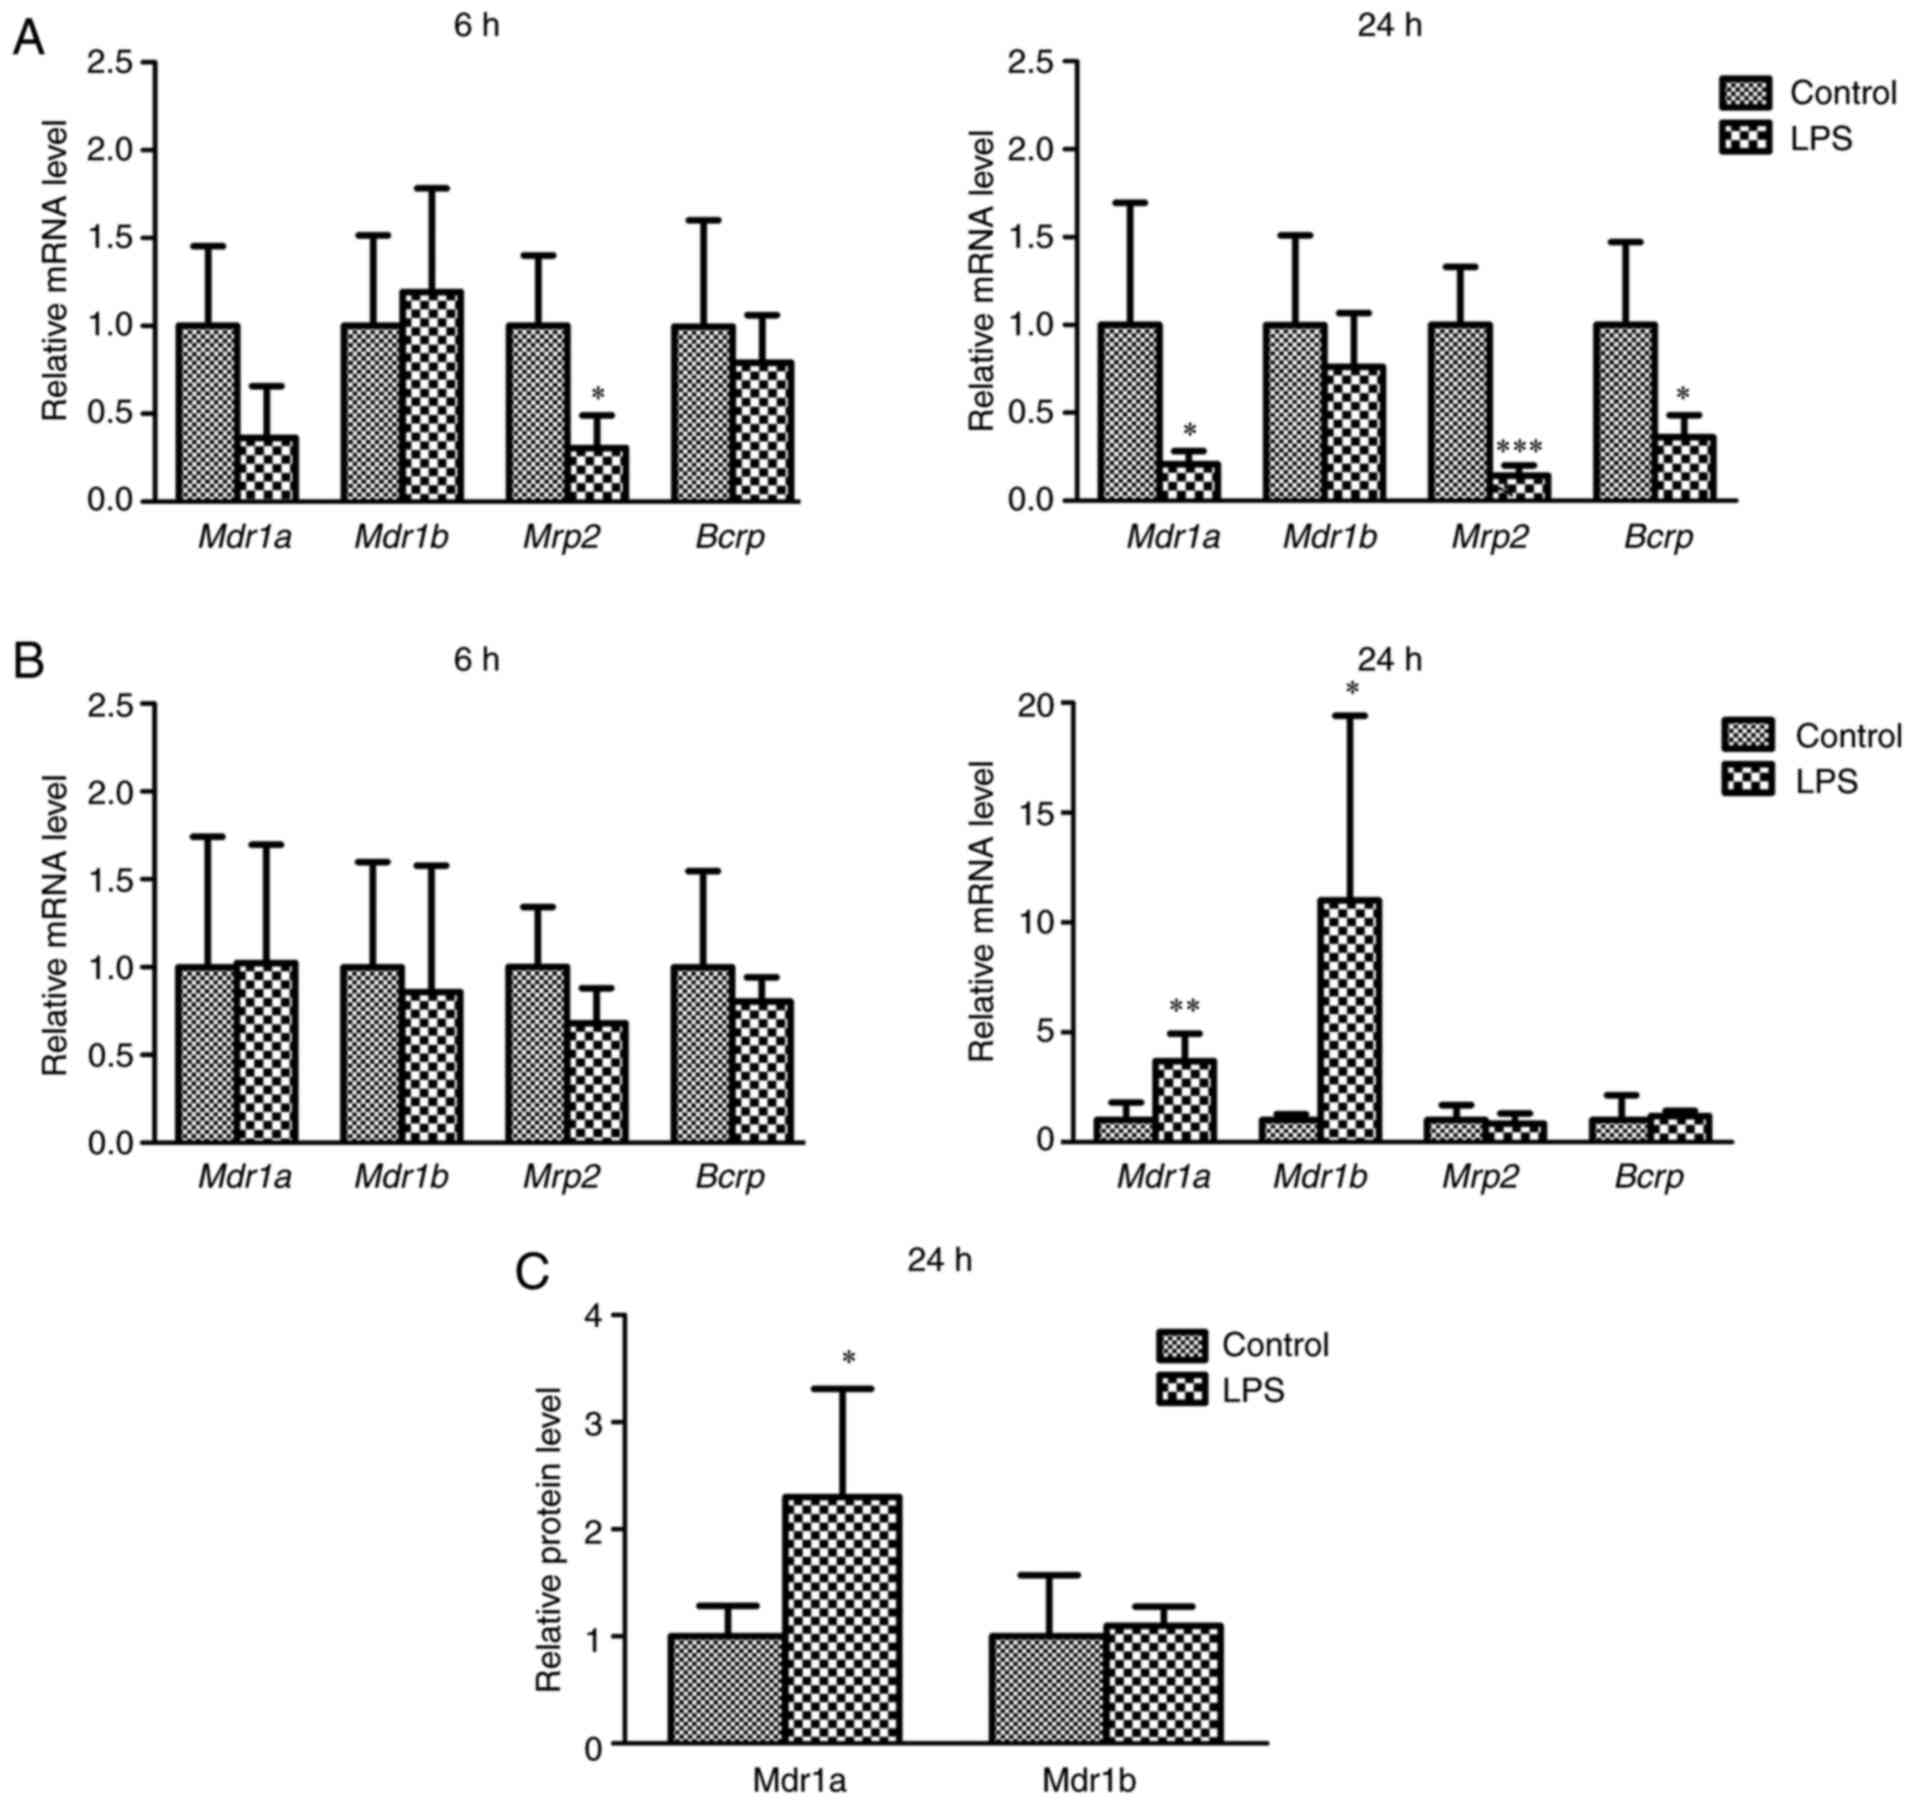
mRNA and protein levels of efflux
transporters
The mRNA levels of Mdr1a, Mdr1b, Mrp2, and
Bcrp in the liver and kidney at 6 and 24 h after LPS
treatment and the protein levels of Mdr1a and Mdr1b in the kidney
24 h after LPS treatment were determined to clarify the effects of
LPS-induced inflammation on the expression of efflux transporters
(Fig. 1). Six hours after
treatment with vehicle or LPS, only a minor change in the mRNA
levels of efflux transporters in the liver and kidney was observed,
with the exception of Mrp2 in the liver. Twenty-four hours
after treatment, the mRNA levels of Mdr1a, Mrp2, and
Bcrp in the liver of LPS mice were significantly decreased
compared to those of control mice (Fig. 1A). In contrast, the mRNA levels of
Mdr1a and Mdr1b in the kidneys of LPS-treated mice
were significantly increased compared to those of control mice
(Fig. 1B). The relative protein
levels of Mdr1a, but not Mdr1b, in the kidneys of LPS-treated mice
after 24 h of treatment were higher than those in control mice
(Fig. 1C).
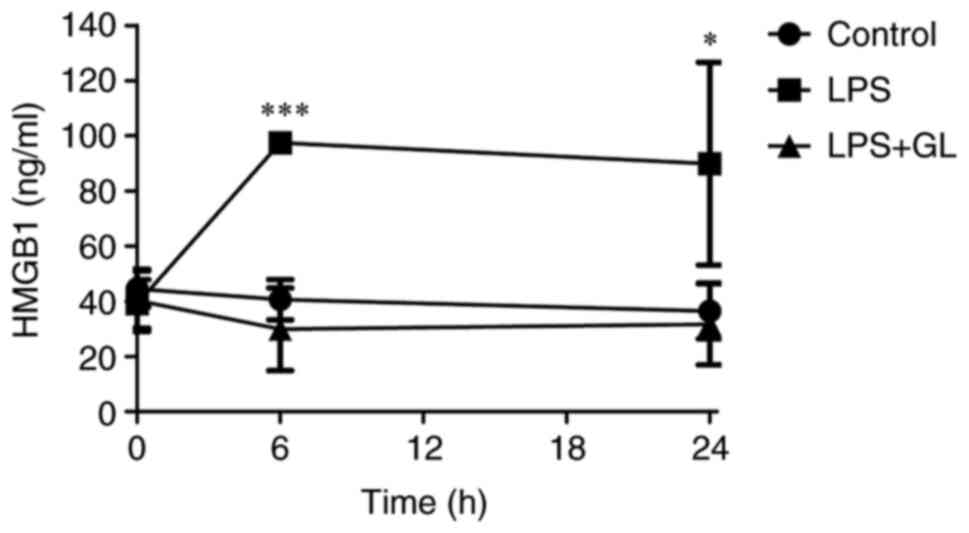
Plasma HMGB1 concentrations
Fig. 2 shows the
plasma concentrations of HMGB1 of LPS or LPS + GL mice. The plasma
concentrations of HMGB1 in LPS mice at 6 h after treatment were
approximately twice the concentration in control mice. Further, the
increased HMGB1 concentrations in LPS mice were maintained until 24
h after LPS treatment (Fig. 2).
The combination of GL and LPS prevented the increase in plasma
HMGB1 levels in LPS mice (Fig.
2).
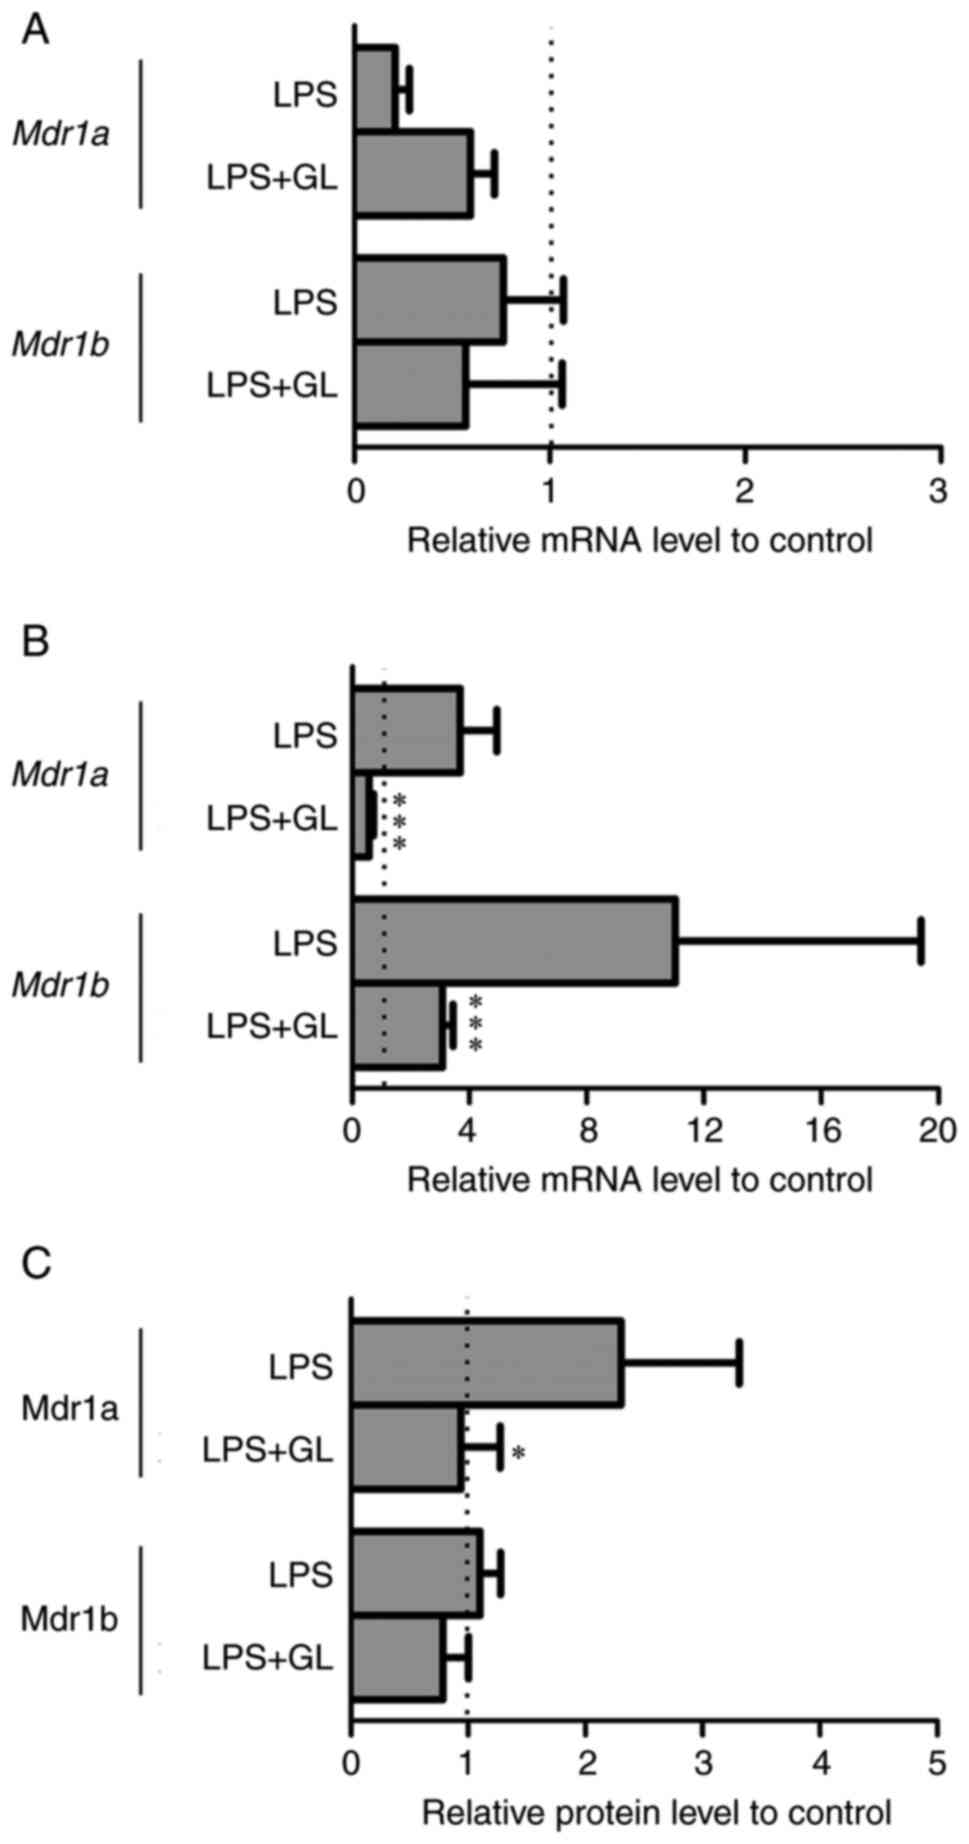
Effects of GL on Mdr1a, Mdr1b, and
HMGB1 receptors expression
When GL and LPS were combined, plasma levels of
HMGB1 were comparable to those in the control (Fig. 2). Therefore, the effects of the
combination of GL and LPS on the mRNA levels of Mdr1a and
Mdr1b in the liver and kidney, and the protein levels of
Mdr1a and Mdr1b in the kidney were determined to clarify the roles
of HMGB1 in the regulation of P-gp expression (Fig. 3). Although the mRNA levels of
Mdr1a and Mdr1b in the liver were unchanged between
LPS and LPS + GL mice (Fig. 3A),
both the mRNA and protein levels of Mdr1a in the kidneys of LPS +
GL mice were significantly decreased compared with those of LPS
mice (Fig. 3B and C). The mRNA
levels of Mdr1b in the kidneys of LPS + GL mice were
significantly lower than those of LPS mice (Fig. 3B). However, the protein levels of
Mdr1b remained unchanged by the combination of GL and LPS by
LC-MS/MS-based targeted proteomics (Fig. 3C). We proceeded to determine
whether HMGB1 affected the mRNA levels of HMGB1 receptors, such as
Tlr2, Tlr4, and Rage, in the liver and kidney of mice
with LPS-induced inflammation (Fig.
4A and B). In the livers of LPS and LPS + GL mice, the mRNA
levels of Tlr2 and Rage were significantly increased
and decreased, respectively, compared to those in the control.
However, the mRNA levels of Tlr4 in the liver remained
unchanged after treatment with LPS or LPS + GL (Fig. 4A). The mRNA levels of Tlr2
and Tlr4 in the kidneys of LPS-treated mice were
significantly increased compared with those of control mice and
were reduced to significantly lower levels by the combination of GL
and LPS (Fig. 4B). The mRNA
levels of Rage in the kidneys of both LPS and LPS + GL mice
were significantly lower than those in control mice (Fig. 4B). Fig. 4C shows the protein levels of Tlr2,
Tlr4, and Rage in the kidneys of the control, LPS, and LPS + GL
mice. The protein levels of Tlr4 were significantly increased by
LPS treatment. Treatment with a combination of GL and LPS reversed
the increase in Tlr4 protein by LPS treatment, in accordance with
the changes in Tlr4 mRNA in the kidney (Fig. 4C). These representative
chromatograms of the surrogate peptides or Mdr1a, Mdr1b, Tlr2,
Tlr4, and Rage were shown in Fig.
S1. GL alone caused only a slight change in the AST, ALT, and
HMGB1 levels and the expression of P-gp and HMGB1 receptors (data
not shown).
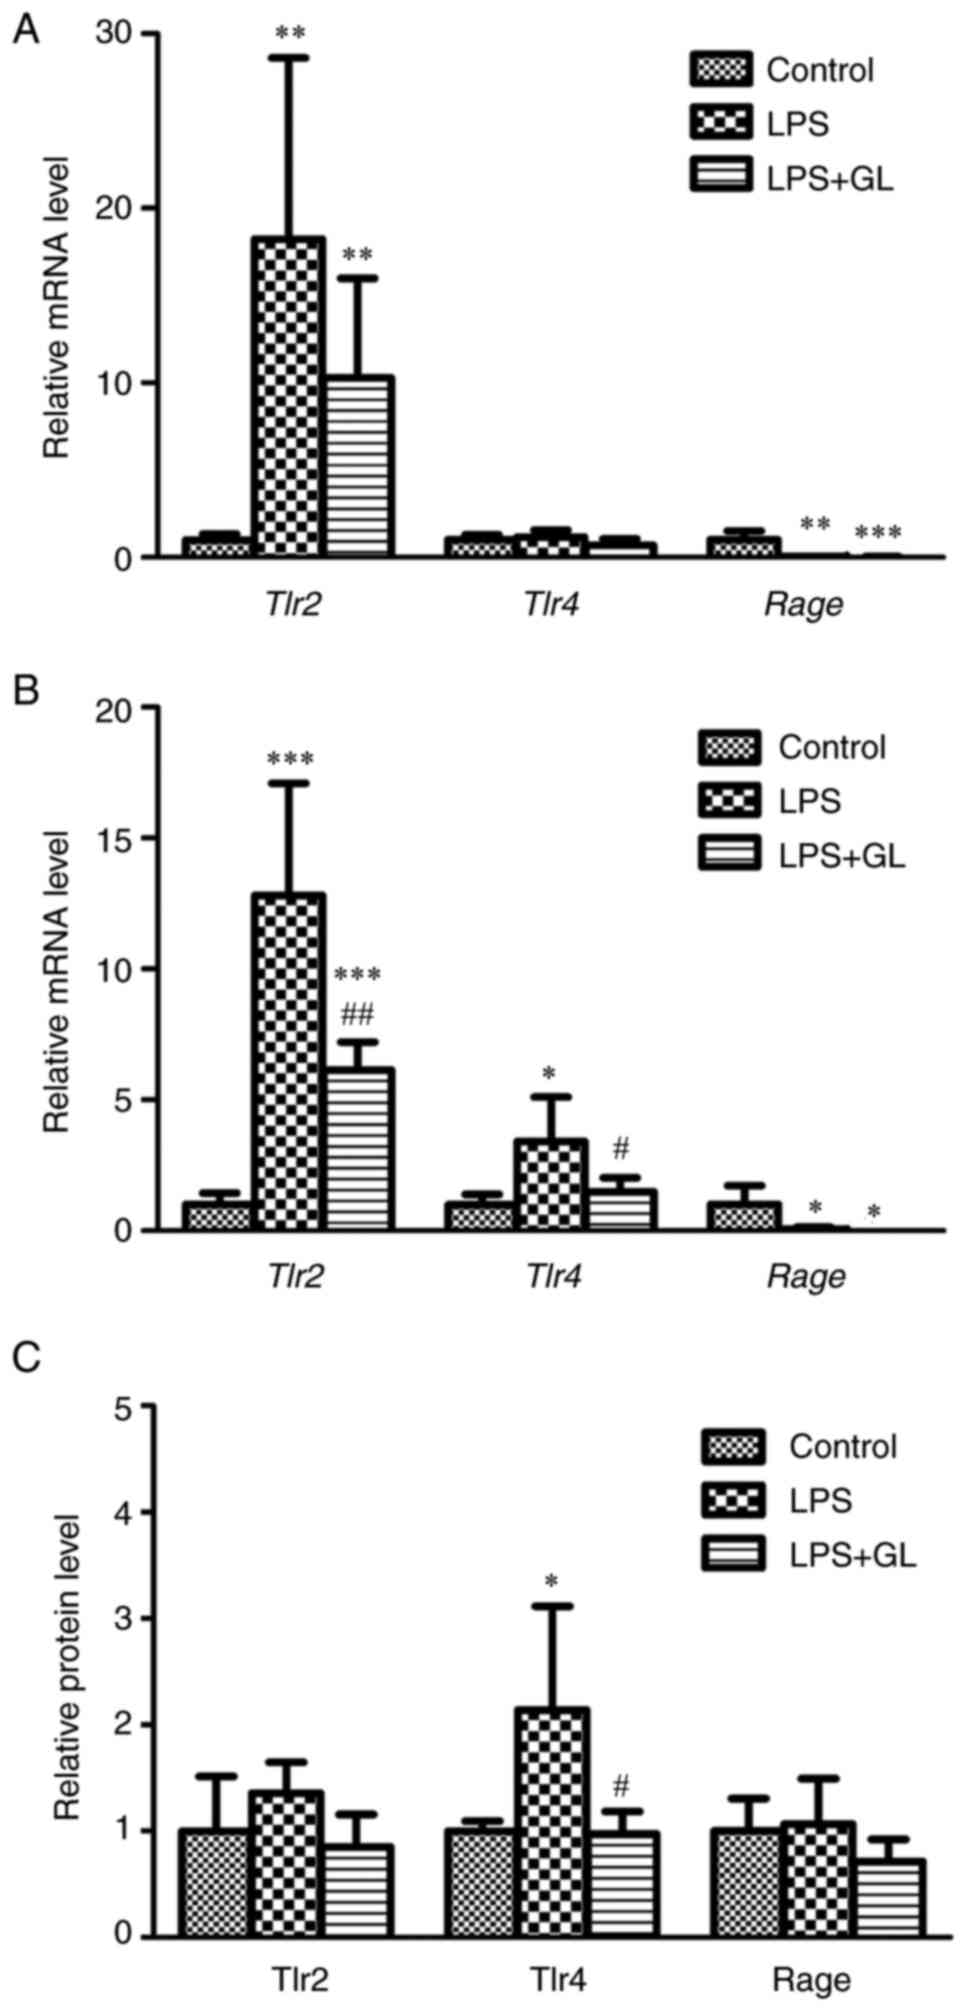 | Figure 4.Relative mRNA levels of Tlr2,
Tlr4, and Rage in the (A) liver and (B) kidney, and (C)
relative protein levels of Tlr2, Tlr4 and Rage in the kidney of
control, LPS, and LPS + GL mice at 24 h after treatment. The
results are expressed as mean ± SD of each group (n=4−8).
*P<0.05, **P<0.01 and ***P<0.001 vs. control;
#P<0.05 and ##P<0.01 vs. LPS. Tlr,
toll-like receptor; Rage, receptor for advanced glycation
end-products; LPS, lipopolysaccharide; GL, glycyrrhizin. |
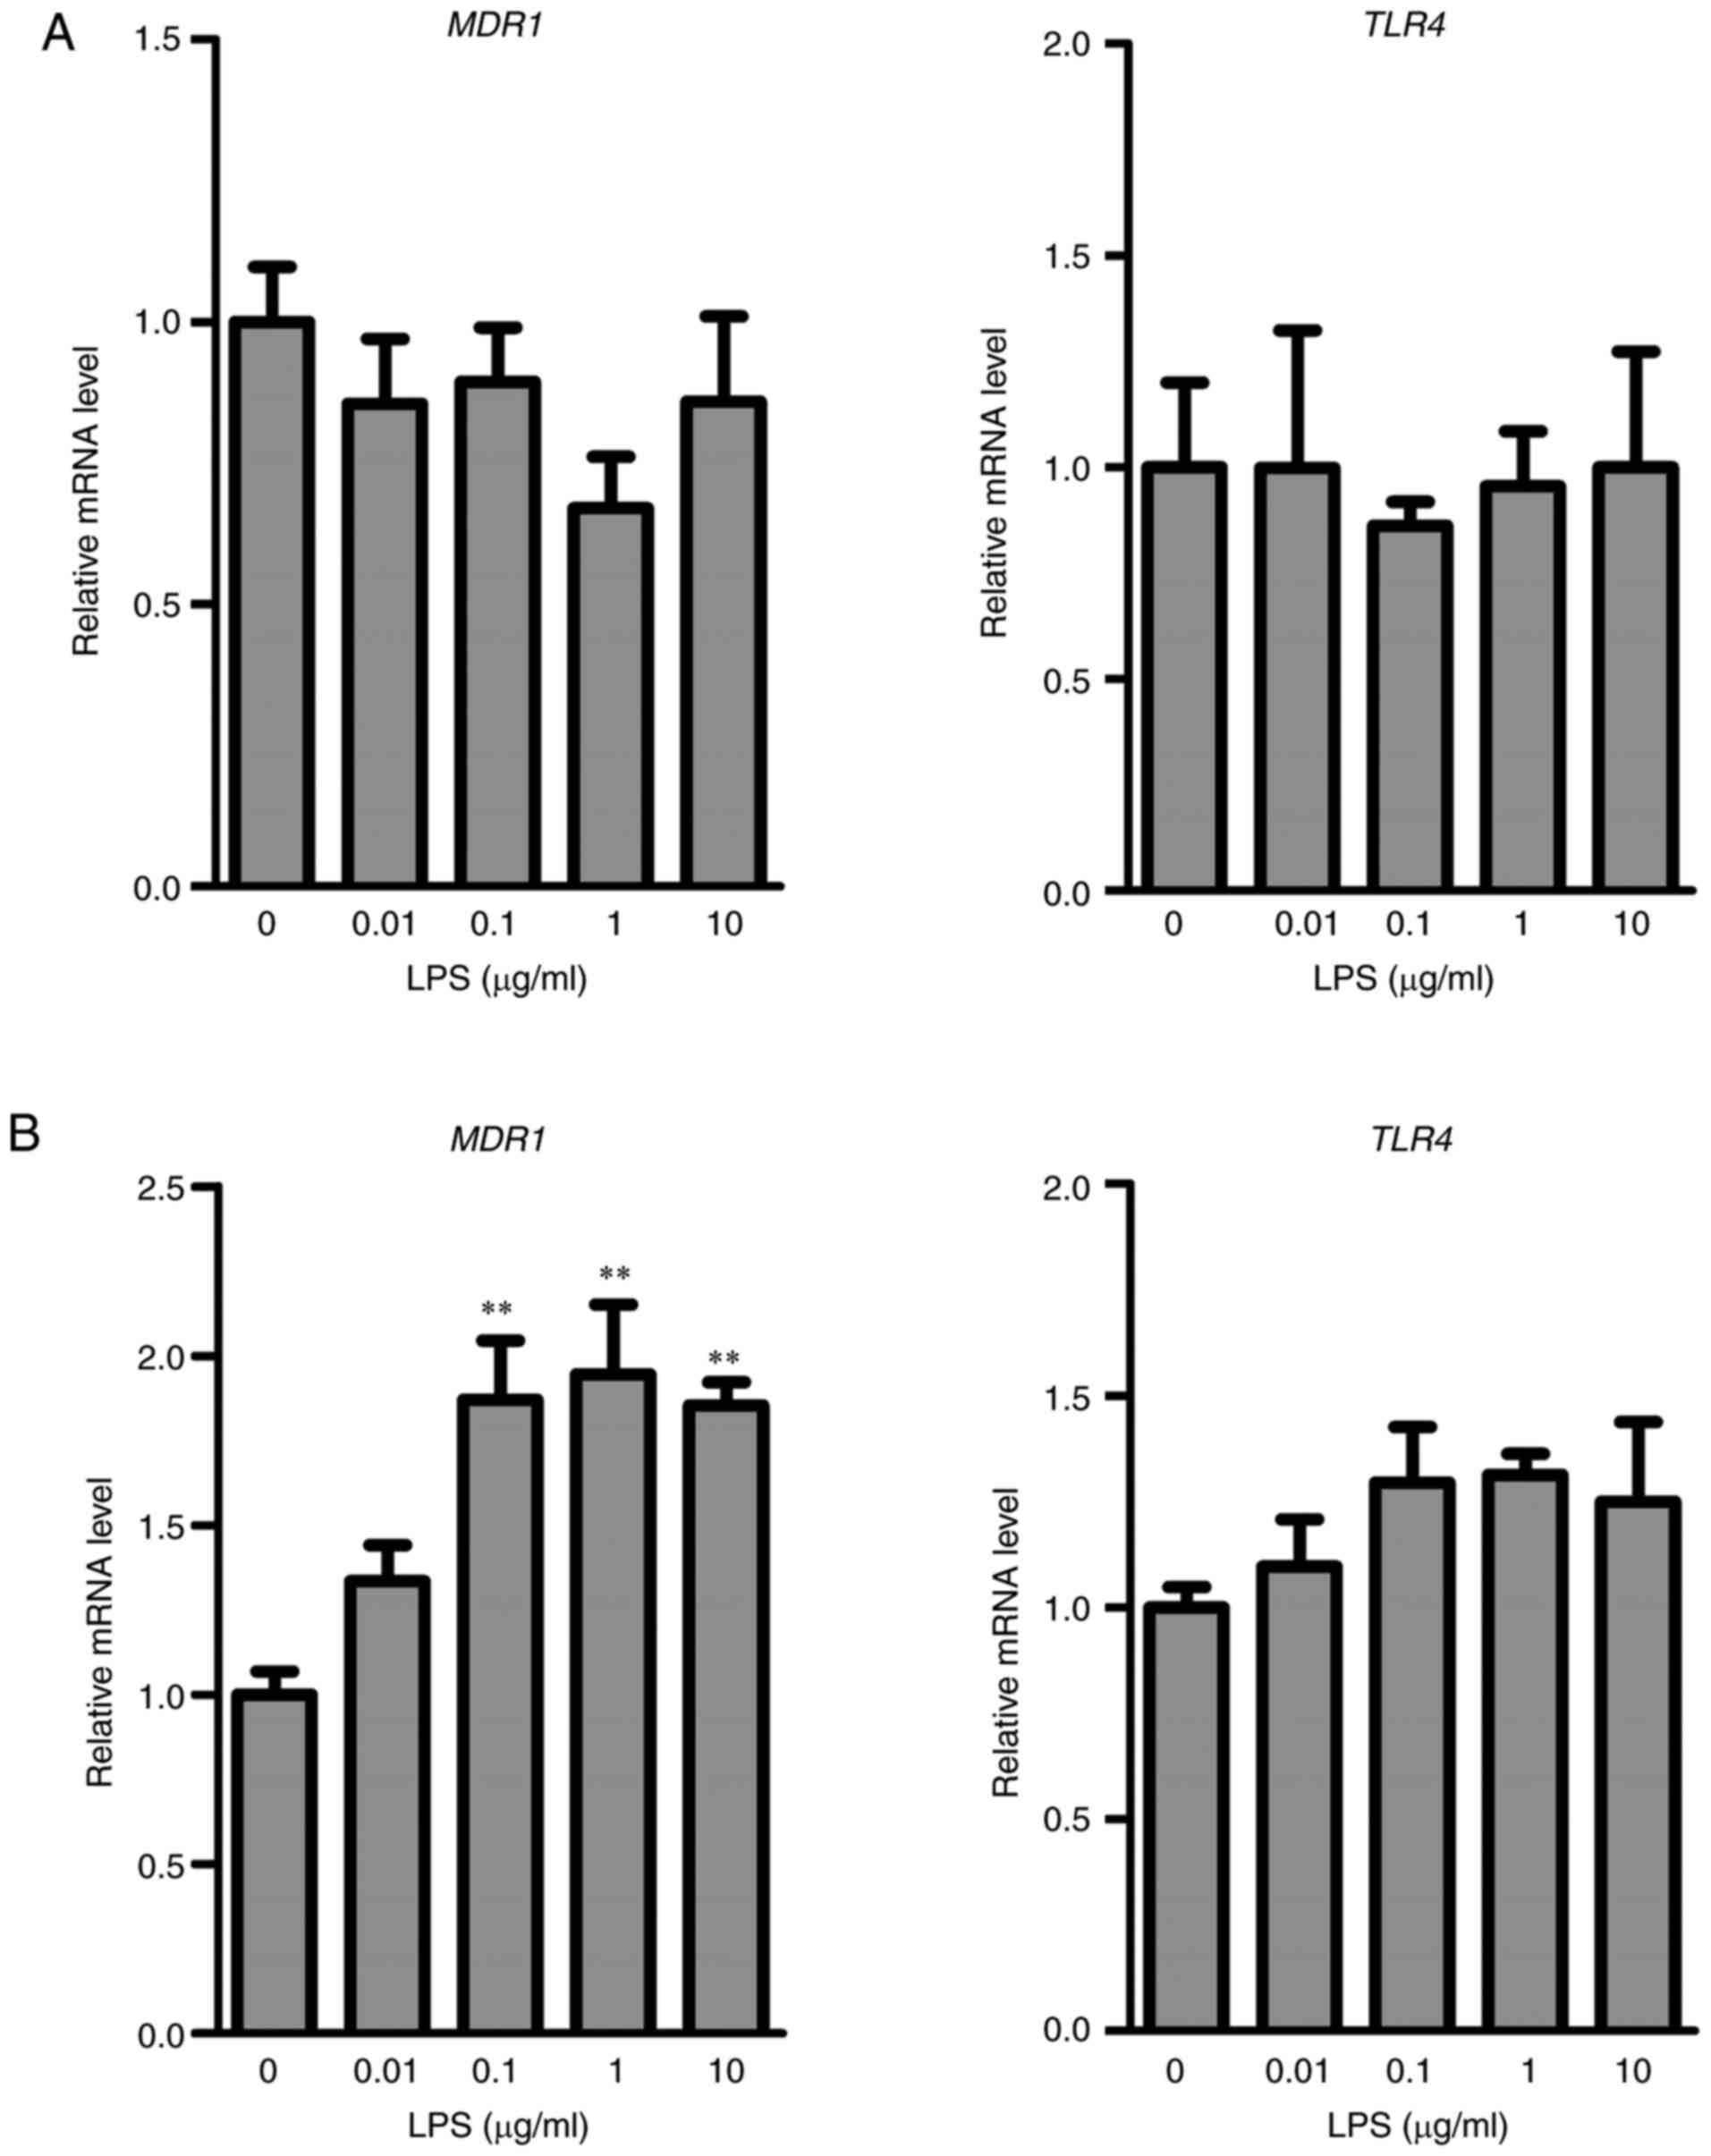
Effects of LPS on MDR1 and TLR4 in
HepG2 or KMRC-1 cells
To further investigate the role of HMGB1 in the
regulation of P-gp expression, in vitro studies were
performed using human liver cancer HepG2 cells and human clear cell
renal carcinoma KMRC-1 cells. The mRNA levels of MDR1 and
TLR4 were unchanged after the treatment of HepG2 cells with
LPS (Fig. 5A). In contrast,
treatment of KMRC-1 cells with LPS (0.1, 1, and 10 µg/ml) resulted
in a significant increase in MDR1 mRNA compared with that in
control cells. Only few changes occurred in the mRNA levels of
TLR4 in control and LPS-treated KMRC-1 cells (Fig. 5B).
Effects of LPS and HMGB1 on MDR1,
HMGB1 receptors, and LPS-TLR4 signaling molecules in KMRC-1/M1
The co-culture of KMRC-1 cells with M1 derived from
THP-1 cells was used to clarify the role of HMGB1 in the regulation
of MDR1 and TLR4 mRNA expression (Fig. 6). The mRNA levels of MDR1
and TLR4 in KMRC-1 cells after treatment with LPS alone or
LPS with HMGB1 were significantly increased compared to those in
the control (Fig. 6A). The mRNA
levels of MyD88, TRAF6, TRIF, and IRF3 in KMRC-1
cells co-cultured with M1 were significantly decreased by
treatments of LPS alone, or LPS with HMGB1 (Fig. 6A). In KMRC-1 alone, the mRNA
levels of MyD88, TRAF6, TRIF, and IRF3 were unchanged
(data not shown). When HepG2 cells were co-cultured with M1 derived
from THP-1 cells, the mRNA levels of MDR1 and TLR4
after LPS treatment were unchanged (data not shown). However, the
mRNA levels of TLR4 in M1 after treatment with LPS alone
were significantly decreased compared with those of the control,
and returned to control levels when treated with both HMGB1 and LPS
(Fig. 6B). The mRNA levels of
TLR2 and RAGE in M1 remained unchanged among the
three groups (Fig. 6B). The
similar HMGB1 concentrations was found in the medium of the three
groups at 24 h after the treatments (data not shown). The
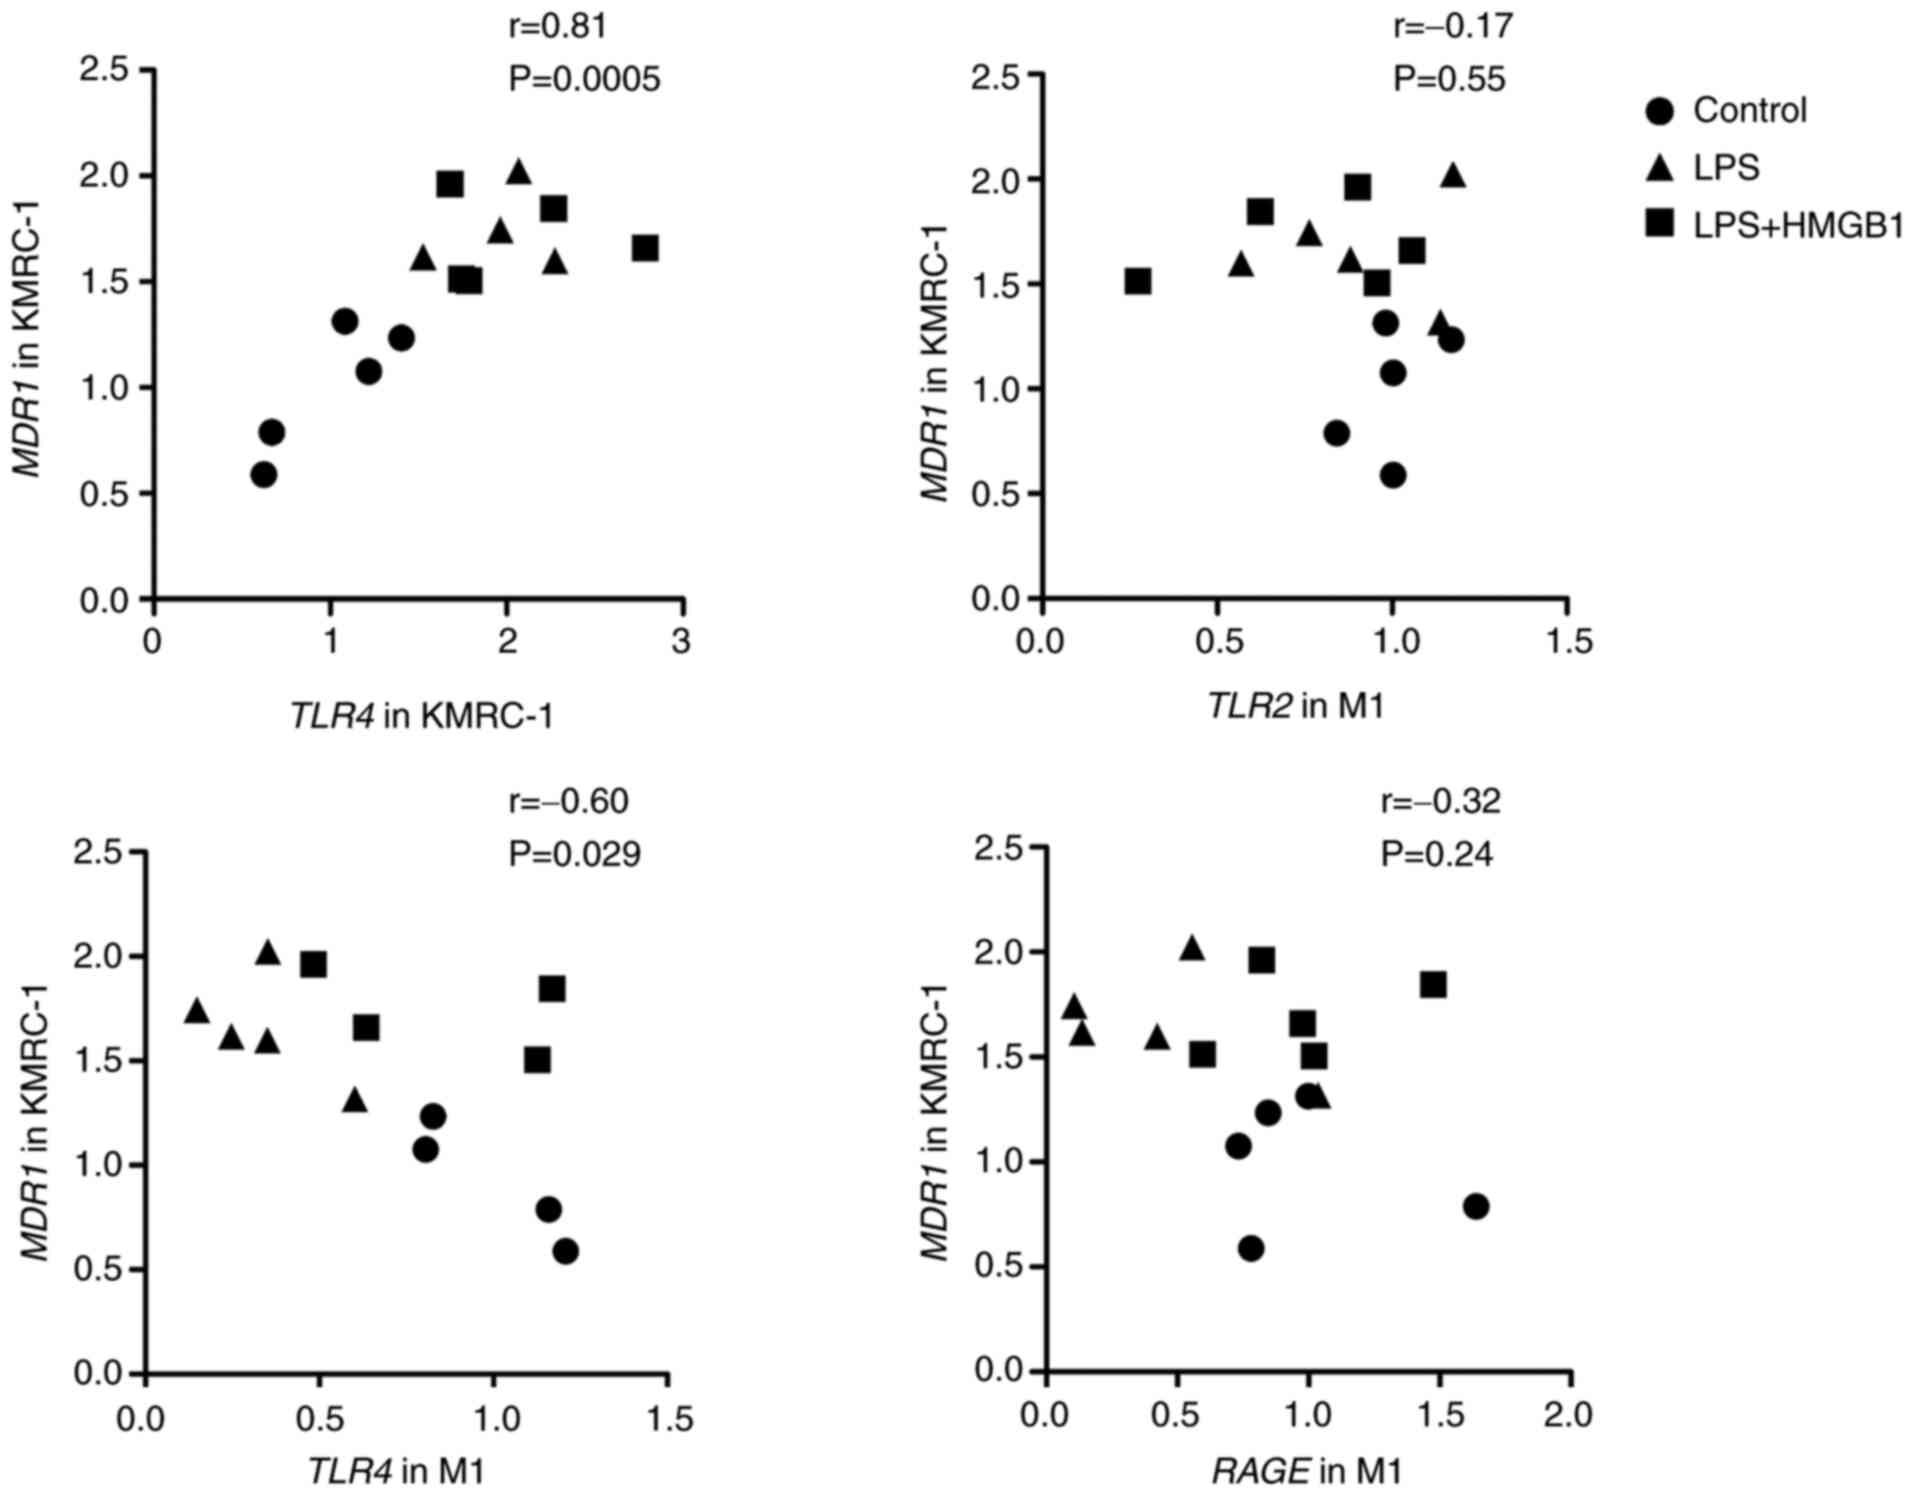
correlation between the mRNA levels of TLR4 in KMRC-1,
TLR2, TLR4, and RAGE in M1 and MDR1 in KMRC-1
24 h after treatment with LPS alone (1 µg/ml) or the combination of
HMGB1 (1 µg/ml) and LPS (1 µg/ml) to KMRC-1/M1 was assessed
(Fig. 7). A significant positive
correlation was found between the mRNA levels of TLR4 and MDR1 in
KMRC-1. Further, a significant negative correlation was found
between the mRNA levels of TLR4 in M1 and MDR1 in KMRC-1 cells.
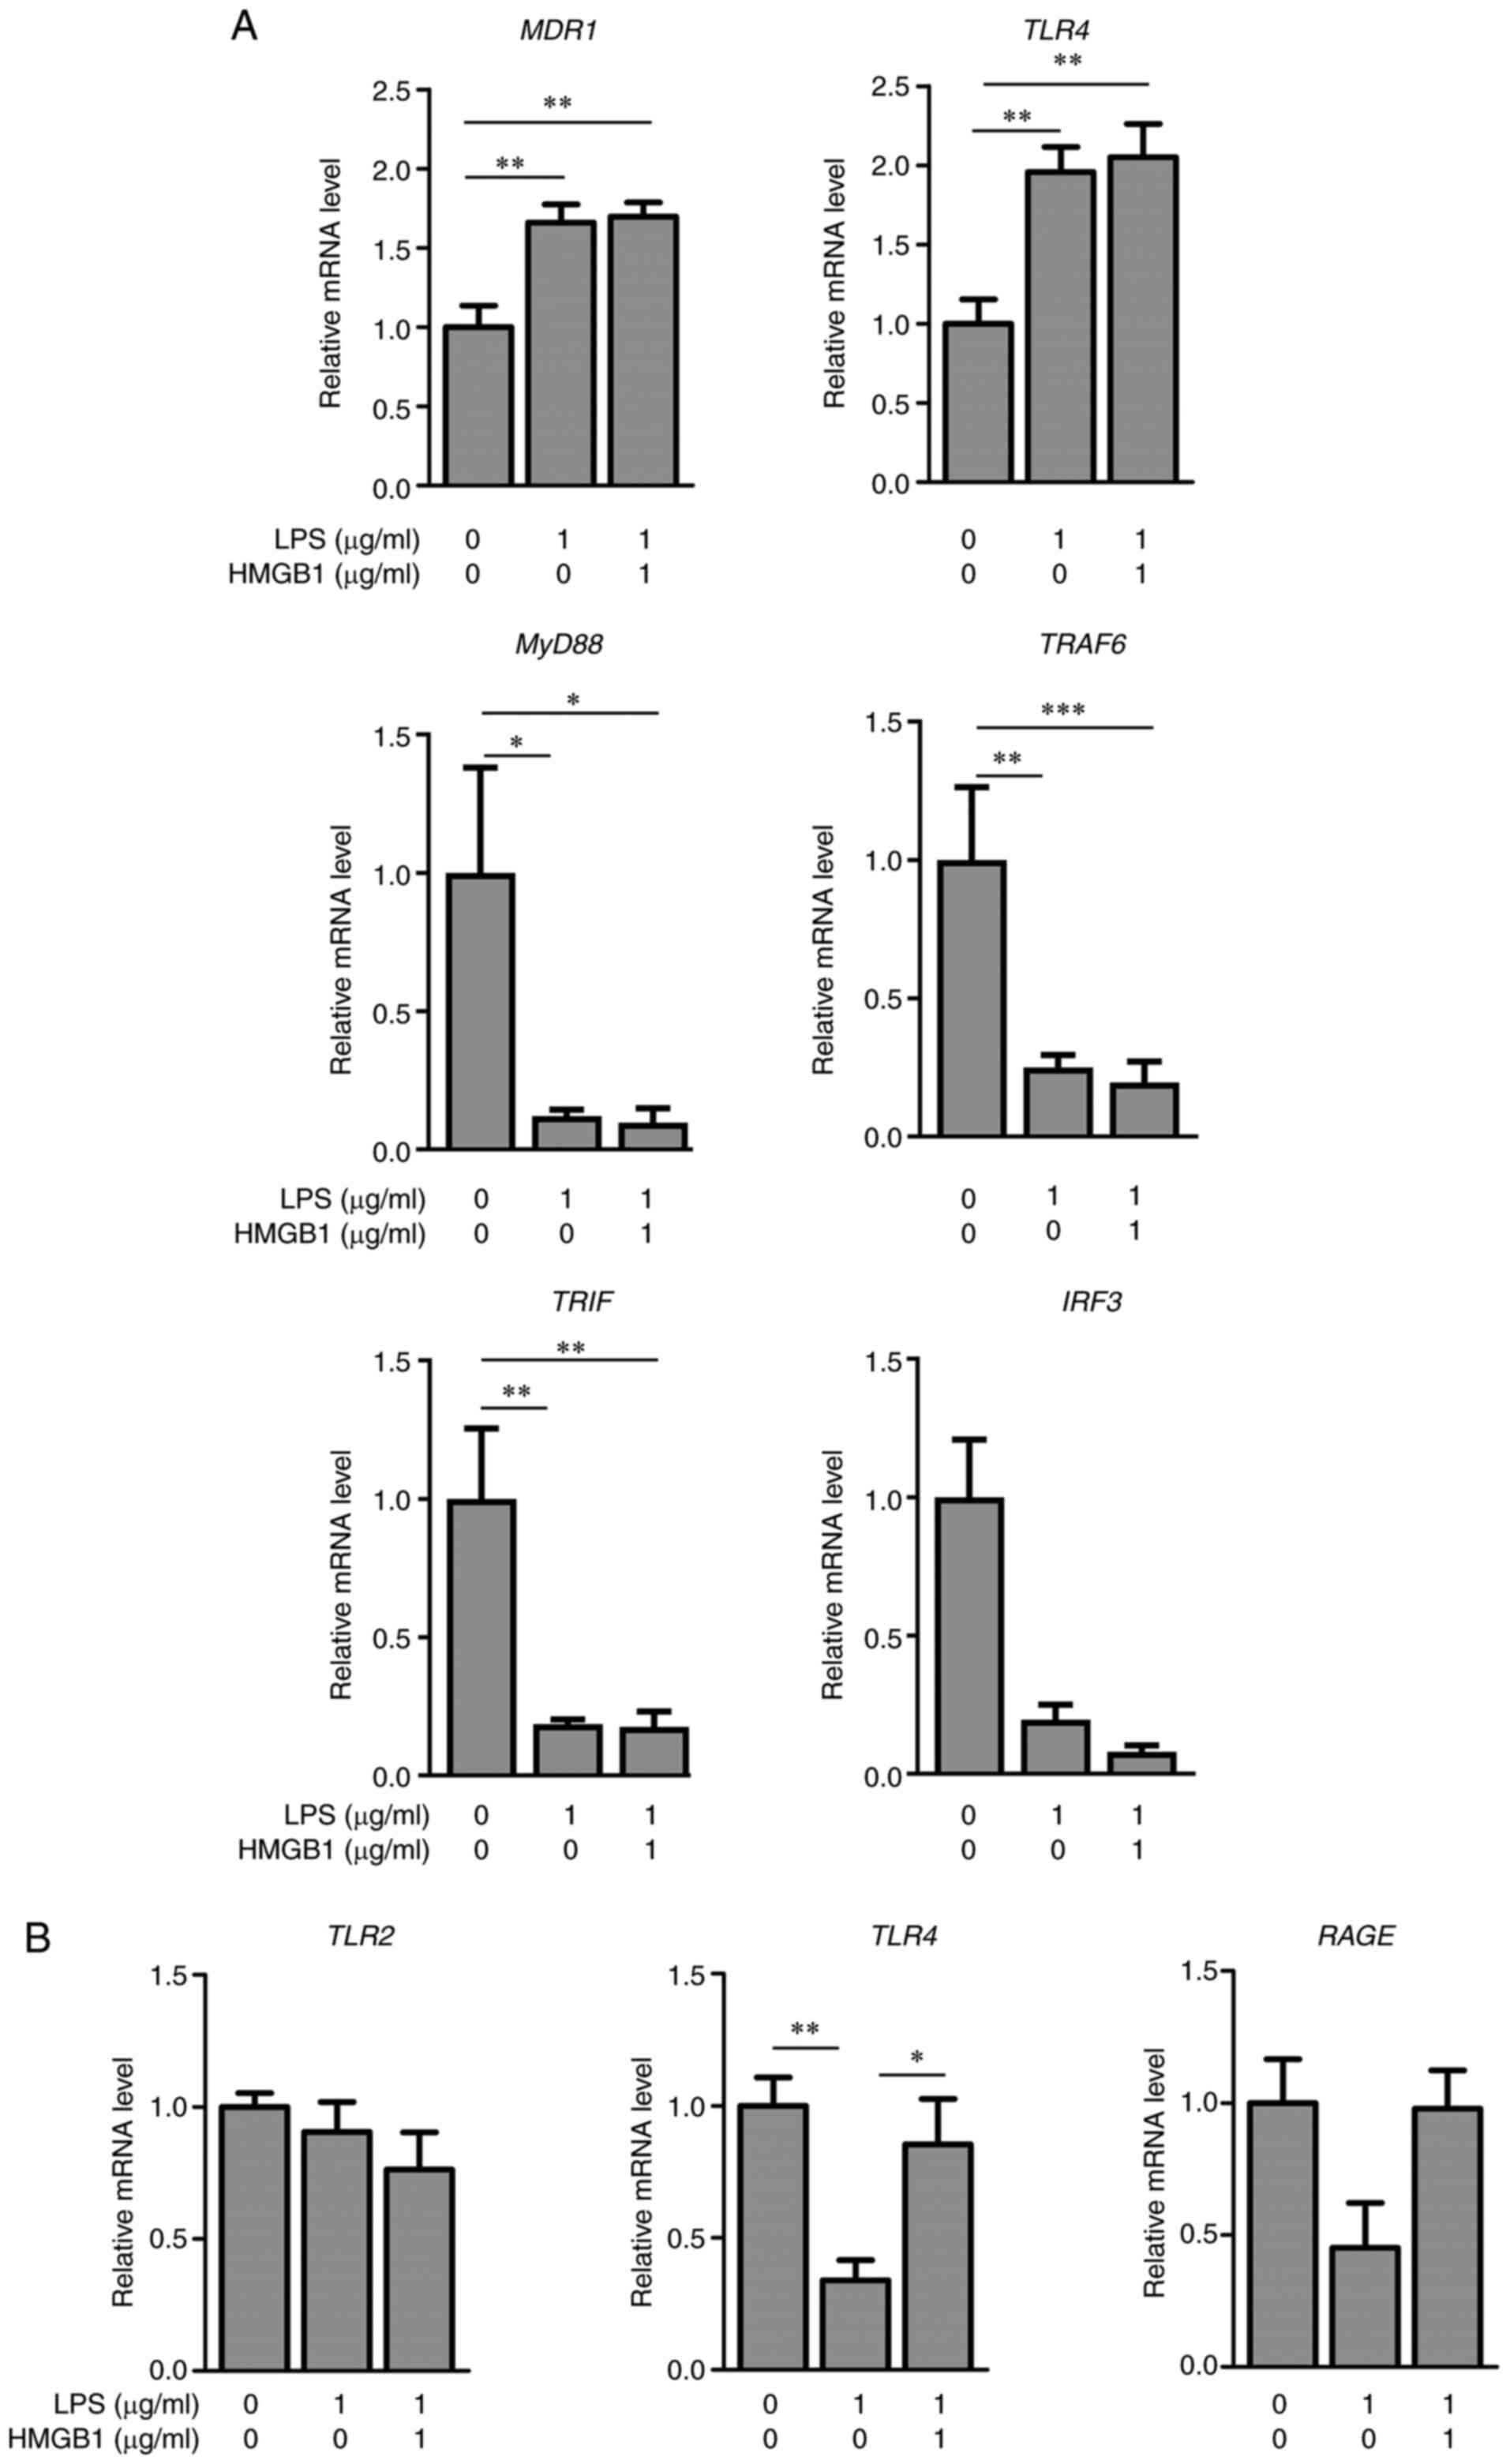 | Figure 6.Effects of LPS and HMGB1 on relative
mRNA levels in co-cultured KMRC-1/M1 cells. (A) Relative mRNA
levels of MDR1, TLR4, MyD88, TRAF6, TRIF and IRF3,
and (B) TLR2, TLR4 and RAGE in M1 in KMRC-1/M1 24 h
after treatment with vehicle, LPS alone (1 µg/ml), or the
combination of HMGB1 (1 µg/ml) and LPS (1 µg/ml). The results are
expressed as mean ± SE of each group (n=4-5). *P<0.05,
**P<0.01 and ***P<0.001. MDR1, multidrug resistance protein
1; TLR4, toll-like receptor 4; LPS, lipopolysaccharide; HMGB1, high
mobility group box 1. |
Discussion
The present study revealed the roles of HMGB1 in the
regulation of P-gp and HMGB1 receptors in the liver and kidney of
mice with LPS-induced inflammation and the cell lines. Following
treatment with LPS alone or combined with HMGB1, changes in the
expression levels of P-gp and HMGB1 receptors were determined.
Based on the results, the increase in plasma HMGB1
following treatment with LPS was involved in the regulation of
Mdr1a expression in the kidney, but not in the liver. TLR4
expression levels in macrophages and HMGB1 levels in plasma may be
important for the regulation of MDR1 in the kidney; several lines
of evidence support this finding. First, the inhibition of HMGB1
after GL treatment masked the increase in the mRNA and protein
expression of Mdr1a and Tlr4 in the kidney after LPS treatment
(Figs. 3C and 4C). The addition of HMGB1 and LPS to
KMRC-1/M1 suppressed the downregulation of TLR4 mRNA
expression in M1 cells after LPS stimulation (Fig. 6B). To our knowledge, this is the
first study to demonstrate the roles of HMGB1 and TLR4 in the
kidney, but not in the liver, of mice with inflammation.
Alterations in efflux transporters, such as Mdr1a,
Mdr1b, Mrp2, and Bcrp in the liver and kidney of mice with
LPS-induced inflammation were assessed. Following LPS treatment,
both the mRNA and protein levels of Mdr1a in the kidneys of mice at
24 h after LPS treatment were significantly increased compared with
those in control mice (Fig. 1).
Hartmann et al demonstrated that the protein levels of P-gp
in the kidneys of LPS mice were significantly higher than those in
control mice (2). Our previous
study also revealed opposing changes in P-gp between the liver and
kidney of rats with adjuvant-induced arthritis. Further, the
relative expression levels of P-gp in the kidneys of rats with
adjuvant-induced arthritis were found to be higher than those in
control rats (4). An increase in
Mdr1a, but not Mdr1b, was observed in the kidneys of mice at 24 h
after LPS treatment (Fig. 1C).
Inflammation was found to have different effects on the mRNA
expression between Mdr1a and Mdr1b, as revealed by
previous reports (2,26,27). P-gp was selected to evaluate the
roles of HMGB1 in the regulation of efflux transporters in the
following studies as distinct differences were observed in the
expression of P-gp in the liver and kidney of LPS-induced
inflammatory mice compared with those of other efflux transporters.
Previous report showed the decreases of the protein expression
levels of P-gp after LPS treatments to mice (2). It has been reported that HMGB1
increases P-gp expression in the brain (15–17). The mRNA levels of Mdr1a and
Mdr1b were significantly increased in the kidneys but not
livers of LPS mice. GL treatment with LPS had little impacts on the
Mdr1a and Mdr1b levels in the livers of inflamed mice
(Fig. 3A). These results
suggested that the protein expression levels of P-gp in the kidney
were regulated by HMGB1 similar to the P-gp expression in brain.
Therefore, we focused the changes of P-gp in the kidneys of LPS
mice to clarify the roles of HMGB1 in the expression of P-gp.
The increased plasma HMGB1, AST, and ALT levels
after LPS treatment returned to control levels when treated with
GL. GL has been frequently used as an inhibitor of HMGB1 because it
directly binds to HMGB1 and inhibits its release from cells
(18,20,21). The effects of GL alone on the
inflammation with mice would be excluded, because the treatment of
GL alone did not affect the AST, ALT, and HMGB1 levels and the
expression of P-gp and HMGB1 receptors in control mice (data not
shown). However, it is difficult to fully distinguish an effect of
direct inhibition of HMGB1 by GL and an indirect effect of
decreases of liver damage via HMGB1 inhibition by GL. GL does not
necessarily suppress liver injury only through the pathway that
inhibits HMGB1, although GL is widely used as an inhibitor for
HMGB1. The further studies using anti-HMGB1 antibody are needed to
clarify the direct effects of HMGB1 on the regulation of P-gp
expression in inflamed kidney. If HMGB1 is involved in the P-gp
regulation in inflamed kidney, the treatment anti-HMGB1 antibody
with LPS results in the prevention of increase of the P-gp
expression in the kidney after LPS treatment. Some reports also
demonstrated that GL inhibited the liver injury via decrease of the
HMGB1 secretion from Kupffer cells (28), inhibition of HMGB1-TLR4 pathway
(29), and decrease of oxidative
stress (30). The expression
levels of P-gp in the kidneys of LPS-treated mice were similar to
those in control mice (Fig. 3C),
indicating that plasma HMGB1 is a determinant of P-gp expression in
the kidneys of mice with LPS-induced inflammation. According to
previous reports, HMGB1 promotes P-gp expression in the brain
(15–17); however, whether it is involved in
the regulation of P-gp expression in the kidney is unknown. The
increased expression levels of Tlr4, which is a receptor for LPS
and HMGB1, restored to control levels by HMGB1 inhibition (Fig. 4C). Expression levels did not
necessarily exhibit corresponding changes between mRNA and protein
levels due to the stability of mRNA, and post-transcriptional or
post-translational regulation. However, the causes of the
proportional changes between mRNA and protein levels of Tlr4 but
not Tlr2 and Rage in inflamed kidney were undetermined. There is no
information on the differences of regulation of Tlr2 and Tlr4
expression in the inflamed kidney. The TLR4 mRNA levels of
M1 treated with LPS and HMGB1 were significantly increased compared
with those of M1 treated with LPS alone (Fig. 6B), indicating that HMGB1
participated in the upregulation of TLR4 in M1. The lower
expression of Tlr4 in the kidneys of LPS + GL mice can be partially
explained by this result (Fig.
6B). TLR4 is predominantly expressed in human and rodent
monocytes and immature dendritic cells, with very low expression in
the liver and kidneys (31–33). Therefore, changes in TLR4
expression in monocyte-derived macrophages, as shown in Fig. 6B, in addition to plasma HMGB1,
could be important for the regulation of P-gp expression in the
liver and kidney of inflamed mice. Tlr4 in the kidney is reported
to be involved in the induction of inflammation and tissue injury
in nephrotoxicity via MyD88-dependent and MyD88-independent
signaling pathways (34–36). To our knowledge, this is the first
study to reveal that HMGB1 and Tlr4 expression are important
factors in the induction of P-gp in the inflamed kidney. However,
the expression levels of P-gp in the liver did not markedly depend
on plasma HMGB1 concentrations and Tlr4 mRNA levels in the
liver. Thus, the upregulation of P-gp expression in the kidney by
HMGB1 and Tlr4 could be a characterization of the organ-distinct
effects of LPS-induced inflammation, differing from that of the
liver. As a result, the differences in Tlr4 expression
between the liver and kidney of mice with LPS-induced inflammation
should be considered. According to the Tlr4 mRNA levels, the
kidney was found to be more responsive to LPS-induced inflammation
than the liver (Fig. 4). Further
studies using Tlr4 deficient mice could help to elucidate the
detailed roles of Tlr4 and HMGB1 in the regulation of P-gp in the
kidneys of mice with inflammation.
Following the treatment of HepG2 or KMRC-1 cells
with LPS, there were significant differences in the induction of
MDR1 between HepG2 and KMRC-1 cells (Fig. 5). Treatment of KMRC-1 cells, but
not HepG2 cells, with LPS (0.1, 1, or 10 µg/ml) led to a
significant induction of MDR1 mRNA expression compared with
that observed in control cells. However, TLR4 mRNA
expression was unchanged after LPS treatment in both KMRC-1 and
HepG2 cells (Fig. 5). These
results suggest that LPS stimulation of KMRC-1 cells results in an
increase in MDR1 without the upregulation of TLR4.
Since KMRC-1 and HepG2 cells are cancer cells, some characteristics
of them do not reflect the properties of normal kidney and liver.
Further studies using normal proximal renal tubular cells and
primary hepatocytes are needed to clarify the detailed roles of
HMGB1 in the regulation of P-gp expression, although KMRC-1 and
HepG2 cells are frequently used to examine the expression and
function of P-gp in kidney and liver. Further, other factors, in
addition to LPS stimulation, may be needed to increase TLR4
expression in KMRC-1 cells. In contrast, TLR4 mRNA levels in
KMRC-1 cells increased after LPS stimulation of KMRC-1/M1 (Fig. 6), suggesting that the presence of
inflammatory macrophages participated in the upregulation of
TLR4 in KMRC-1 cells. Moreover, the mRNA levels of
MDR1 after treatment with HMGB1 and LPS were comparable to
those after LPS treatment alone. Accordingly, it is difficult to
determine the roles of HMGB1 and TLR4 in the regulation of MDR1
using KMRC-1 cells alone. As shown in Fig. 7, TLR4 mRNA expression
levels in KMRC-1 cells and M1 correlated with MDR1 mRNA
expression levels in KMRC-1 cells. Treatment of KMRC-1/M1 cells
with LPS alone increased and decreased the expression of
TLR4 mRNA in KMRC-1 cells and M1, respectively. The addition
of LPS to KMRC-1/M1 (Fig. 6), but
not to KMRC-1 cells alone (Fig.
5), resulted in an increase in TLR4 in KMRC-1 cells,
which might be due to the release of inflammatory cytokines from
M1. According to previous reports, TLR4 in renal parenchymal cells
is an important receptor for the production of inflammatory
cytokines and induction of inflammation (34,37,38). Taken together, the presence of M1
increased TLR4 mRNA expression, similar to Tlr4 expression in the
kidneys of mice with LPS-induced inflammation. Owing to the
combination of HMGB1 and LPS, the mRNA levels of TLR4 were
significantly higher than those with LPS alone, although similar
mRNA levels of MDR1 were observed after treatment with LPS
or LPS + HMGB1. Other studies revealed the synergistic effects of
HMGB1 and LPS on inflammation (39–41). HMGB1 might be involved in
maintaining the regulatory levels of TLR4 mRNA in the M1.
However, the results obtained using this co-culture system were
insufficient to explain the changes in P-gp expression in the
kidney of LPS-induced inflamed mice. Further studies are thus
needed to clarify the role of HMGB1 in the regulation of P-gp
expression in the kidney.
In conclusion, to the best of our knowledge, this is
the first report on the involvement of HMGB1 in the regulation of
P-gp expression in the kidney, but not in the liver, of inflamed
mice similar to brain, although the interaction between HMGB1 and
TLR4, inhibitory effects of GL on HMGB1, and LPS-mediated
activation of HMGB1 have been reported. It was unclear whether
HMGB1 regulated the transporters such as P-gp expression in the
kidneys and livers of inflamed mice. These findings may provide
important information for us to understand the effects of
inflammation on the disposition of P-gp substrates to the kidneys
and livers. The regulation of TLR4 expression in M1 by HMGB1 may
contribute to P-gp expression in the kidneys. Further, the
upregulation of HMGB1 and Tlr4 in the kidney could be the cause of
the differing effect of inflammation on P-gp expression in the
liver and kidney. Thus, altering P-gp expression in the
inflammatory kidney may affect the pharmacokinetics of P-gp
substrates; the involvement of HMGB1 and TLR4 should also be
investigated.
Supplementary Material
Supporting Data
Acknowledgements
Not applicable.
Funding
Funding: No funding was received.
Availability of data and materials
The datasets used and/or analyzed during the current
study are available from the corresponding author on reasonable
request.
Authors' contributions
AK, KI, NM, YT, HS and MI contributed to the study
conception and design. AK, KI, NM and YT contributed to material
preparation, data collection and analysis. AK and KI and NM confirm
the authenticity of all the raw data. The first draft of the
manuscript was written by AK and all authors commented on previous
versions of the manuscript. All authors read and approved the final
manuscript.
Ethics approval and consent to
participate
The study protocol was approved by the Committee for
the Care and Use of Laboratory Animals of the Faculty of Pharmacy
of Kindai University.
Patient consent for publication
Not applicable.
Competing interests
The authors declare that they have no competing
interests.
References
|
1
|
Vos TA, Hooiveld GJ, Koning H, Childs S,
Meijer DK, Moshage H, Jansen PL and Müller M: Up-regulation of the
multidrug resistance genes, Mrp1 and Mdr1b, and down–regulation of
the organic anion transporter, Mrp2, and the bile salt transporter,
Spgp, in endotoxemic rat liver. Hepatology. 28:1637–1644. 1998.
View Article : Google Scholar : PubMed/NCBI
|
|
2
|
Hartmann G, Vassileva V and
Piquette-Miller M: Impact of endotoxin-induced changes in
P-glycoprotein expression on disposition of doxorubicin in mice.
Drug Metab Dispos. 33:820–828. 2005. View Article : Google Scholar : PubMed/NCBI
|
|
3
|
Kawase A, Nakasaka M, Bando H, Yasuda S,
Shimada H and Iwaki M: Changes in radixin expression and
interaction with efflux transporters in the liver of
adjuvant-induced arthritic rats. Inflammation. 43:85–94. 2020.
View Article : Google Scholar : PubMed/NCBI
|
|
4
|
Kawase A, Norikane S, Okada A, Adachi M,
Kato Y and Iwaki M: Distinct alterations in ATP-binding cassette
transporter expression in liver, kidney, small intestine, and brain
in adjuvant-induced arthritic rats. J Pharm Sci. 103:2556–2564.
2014. View Article : Google Scholar : PubMed/NCBI
|
|
5
|
Rouhiainen A, Kuja-Panula J, Wilkman E,
Pakkanen J, Stenfors J, Tuominen RK, Lepäntalo M, Carpén O,
Parkkinen J and Rauvala H: Regulation of monocyte migration by
amphoterin (HMGB1). Blood. 104:1174–1182. 2004. View Article : Google Scholar : PubMed/NCBI
|
|
6
|
Scaffidi P, Misteli T and Bianchi ME:
Release of chromatin protein HMGB1 by necrotic cells triggers
inflammation. Nature. 418:191–195. 2002. View Article : Google Scholar : PubMed/NCBI
|
|
7
|
Yu M, Wang H, Ding A, Golenbock DT, Latz
E, Czura CJ, Fenton MJ, Tracey KJ and Yang H: HMGB1 signals through
toll-like receptor (TLR) 4 and TLR2. Shock. 26:174–179. 2006.
View Article : Google Scholar : PubMed/NCBI
|
|
8
|
Hreggvidsdóttir HS, Lundberg AM, Aveberger
AC, Klevenvall L, Andersson U and Harris HE: High mobility group
box protein 1 (HMGB1)-partner molecule complexes enhance cytokine
production by signaling through the partner molecule receptor. Mol
Med. 18:224–230. 2012. View Article : Google Scholar : PubMed/NCBI
|
|
9
|
Zhang C, Dong H, Chen F, Wang Y, Ma J and
Wang G: The HMGB1-RAGE/TLR-TNF-α signaling pathway may contribute
to kidney injury induced by hypoxia. Exp Ther Med. 17:17–26.
2019.PubMed/NCBI
|
|
10
|
Godowski PJ: A smooth operator for LPS
responses. Nat Immunol. 6:544–546. 2005. View Article : Google Scholar : PubMed/NCBI
|
|
11
|
Zhong H, Li X, Zhou S, Jiang P, Liu X,
Ouyang M, Nie Y, Chen X, Zhang L, Liu Y, et al: Interplay between
RAGE and TLR4 regulates HMGB1-induced inflammation by promoting
cell surface expression of RAGE and TLR4. J Immunol. 205:767–775.
2020. View Article : Google Scholar : PubMed/NCBI
|
|
12
|
Park JS, Svetkauskaite D, He Q, Kim JY,
Strassheim D, Ishizaka A and Abraham E: Involvement of toll-like
receptors 2 and 4 in cellular activation by high mobility group box
1 protein. J Biol Chem. 279:7370–7377. 2004. View Article : Google Scholar : PubMed/NCBI
|
|
13
|
Lotze MT and Tracey KJ: High-mobility
group box 1 protein (HMGB1): Nuclear weapon in the immune arsenal.
Nat Rev Immunol. 5:331–342. 2005. View Article : Google Scholar : PubMed/NCBI
|
|
14
|
Chen GY, Tang J, Zheng P and Liu Y: CD24
and Siglec-10 selectively repress tissue damage-induced immune
responses. Science. 323:1722–1725. 2009. View Article : Google Scholar : PubMed/NCBI
|
|
15
|
Chen Y, Huang XJ, Yu N, Xie Y, Zhang K,
Wen F, Liu H and Di Q: HMGB1 contributes to the expression of
P-glycoprotein in mouse epileptic brain through toll-like receptor
4 and receptor for advanced glycation end products. PLoS One.
10:e01409182015. View Article : Google Scholar : PubMed/NCBI
|
|
16
|
Xie Y, Yu N, Chen Y, Zhang K, Ma HY and Di
Q: HMGB1 regulates P-glycoprotein expression in status epilepticus
rat brains via the RAGE/NF-κB signaling pathway. Mol Med Rep.
16:1691–1700. 2017. View Article : Google Scholar : PubMed/NCBI
|
|
17
|
Wang F, Ji S, Wang M, Liu L, Li Q, Jiang
F, Cen J and Ji B: HMGB1 promoted P-glycoprotein at the blood-brain
barrier in MCAO rats via TLR4/NF-κB signaling pathway. Eur J
Pharmacol. 880:1731892020. View Article : Google Scholar : PubMed/NCBI
|
|
18
|
Mollica L, De Marchis F, Spitaleri A,
Dallacosta C, Pennacchini D, Zamai M, Agresti A, Trisciuoglio L,
Musco G and Bianchi ME: Glycyrrhizin binds to high-mobility group
box 1 protein and inhibits its cytokine activities. Chem Biol.
14:431–441. 2007. View Article : Google Scholar : PubMed/NCBI
|
|
19
|
Kim SW, Jin Y, Shin JH, Kim ID, Lee HK,
Park S, Han PL and Lee JK: Glycyrrhizic acid affords robust
neuroprotection in the postischemic brain via anti-inflammatory
effect by inhibiting HMGB1 phosphorylation and secretion. Neurobiol
Dis. 46:147–156. 2012. View Article : Google Scholar : PubMed/NCBI
|
|
20
|
Tsoyi K, Lee TY, Lee YS, Kim HJ, Seo HG,
Lee JH and Chang KC: Heme-oxygenase-1 induction and carbon
monoxide-releasing molecule inhibit lipopolysaccharide
(LPS)-induced high-mobility group box 1 release in vitro and
improve survival of mice in LPS- and cecal ligation and
puncture-induced sepsis model in vivo. Mol Pharmacol. 76:173–182.
2009. View Article : Google Scholar : PubMed/NCBI
|
|
21
|
Kim YM, Kim HJ and Chang KC: Glycyrrhizin
reduces HMGB1 secretion in lipopolysaccharide-activated RAW 264.7
cells and endotoxemic mice by p38/Nrf2-dependent induction of HO-1.
Int Immunopharmacol. 26:112–118. 2015. View Article : Google Scholar : PubMed/NCBI
|
|
22
|
Wong ML, Xie B, Beatini N, Phu P, Marathe
S, Johns A, Gold PW, Hirsch E, Williams KJ, Licinio J and Tabas I:
Acute systemic inflammation up-regulates secretory sphingomyelinase
in vivo: A possible link between inflammatory cytokines and
atherogenesis. Proc Natl Acad Sci USA. 97:8681–8686. 2000.
View Article : Google Scholar : PubMed/NCBI
|
|
23
|
Kawase A, Tateishi S and Kazaoka A:
Profiling of hepatic metabolizing enzymes and nuclear receptors in
rats with adjuvant arthritis by targeted proteomics. Biopharm Drug
Dispos. 39:308–314. 2018. View Article : Google Scholar : PubMed/NCBI
|
|
24
|
Kawase A, Kazaoka A, Yamamoto R, Minakata
R, Shimada H and Iwaki M: Changes in transporters and metabolizing
enzymes in the livers of rats with bile duct ligation. J Pharm
Pharm Sci. 22:457–465. 2019. View Article : Google Scholar : PubMed/NCBI
|
|
25
|
Sunman JA, Hawke RL, LeCluyse EL and
Kashuba ADM: Kupffer cell-mediated IL-2 suppression of CYP3A
activity in human hepatocytes. Drug Metab Dispos. 32:359–363. 2004.
View Article : Google Scholar : PubMed/NCBI
|
|
26
|
Hartmann G, Kim H and Piquette-Miller M:
Regulation of the hepatic multidrug resistance gene expression by
endotoxin and inflammatory cytokines in mice. Int Immunopharmacol.
1:189–199. 2001. View Article : Google Scholar : PubMed/NCBI
|
|
27
|
Goralski KB, Hartmann G, Piquette-Miller M
and Renton KW: Downregulation of mdr1a expression in the brain and
liver during CNS inflammation alters the in vivo disposition of
digoxin. Br J Pharmacol. 139:35–48. 2003. View Article : Google Scholar : PubMed/NCBI
|
|
28
|
Ogiku M, Kono H, Hara M, Tsuchiya M and
Fujii H: Glycyrrhizin prevents liver injury by inhibition of
high-mobility group box 1 production by Kupffer cells after
ischemia-reperfusion in rats. J Pharmacol Exp Ther. 339:93–98.
2011. View Article : Google Scholar : PubMed/NCBI
|
|
29
|
Shi X, Yu L, Zhang Y, Liu Z, Zhang H,
Zhang Y, Liu P and Du P: Glycyrrhetinic acid alleviates hepatic
inflammation injury in viral hepatitis disease via a HMGB1-TLR4
signaling pathway. Int Immunopharmacol. 84:1065782020. View Article : Google Scholar : PubMed/NCBI
|
|
30
|
Wang Y, Chen Q, Shi C, Jiao F and Gong Z:
Mechanism of glycyrrhizin on ferroptosis during acute liver failure
by inhibiting oxidative stress. Mol Med Rep. 20:4081–4090.
2019.PubMed/NCBI
|
|
31
|
Ketloy C, Engering A, Srichairatanakul U,
Limsalakpetch A, Yongvanitchit K, Pichyangkul S and Ruxrungtham K:
Expression and function of Toll-like receptors on dendritic cells
and other antigen presenting cells from non-human primates. Vet
Immunol Immunopathol. 125:18–30. 2008. View Article : Google Scholar : PubMed/NCBI
|
|
32
|
Hornung V, Rothenfusser S, Britsch S, Krug
A, Jahrsdörfer B, Giese T, Endres S and Hartmann G: Quantitative
expression of toll-like receptor 1–10 mRNA in cellular subsets of
human peripheral blood mononuclear cells and sensitivity to CpG
oligodeoxynucleotides. J Immunol. 168:4531–4537. 2002. View Article : Google Scholar : PubMed/NCBI
|
|
33
|
Rehli M: Of mice and men: Species
variations of toll-like receptor expression. Trends Immunol.
23:375–378. 2002. View Article : Google Scholar : PubMed/NCBI
|
|
34
|
Zhang B, Ramesh G, Uematsu S, Akira S and
Reeves WB: TLR4 signaling mediates inflammation and tissue injury
in nephrotoxicity. J Am Soc Nephrol. 19:923–932. 2008. View Article : Google Scholar : PubMed/NCBI
|
|
35
|
West AP, Koblansky AA and Ghosh S:
Recognition and signaling by toll-like receptors. Annu Rev Cell Dev
Biol. 22:409–437. 2006. View Article : Google Scholar : PubMed/NCBI
|
|
36
|
Rothfuchs AG, Trumstedt C, Wigzell H and
Rottenberg ME: Intracellular bacterial infection-induced IFN-gamma
is critically but not solely dependent on Toll-like receptor
4-myeloid differentiation factor 88-IFN-alpha beta-STAT1 signaling.
J Immunol. 172:6345–6353. 2004. View Article : Google Scholar : PubMed/NCBI
|
|
37
|
Zhang B, Ramesh G, Norbury CC and Reeves
WB: Cisplatin-induced nephrotoxicity is mediated by tumor necrosis
factor-alpha produced by renal parenchymal cells. Kidney Int.
72:37–44. 2007. View Article : Google Scholar : PubMed/NCBI
|
|
38
|
Fan HY, Qi D, Yu C, Zhao F, Liu T, Zhang
ZK, Yang MY, Zhang LM, Chen DQ and Du Y: Paeonol protects
endotoxin-induced acute kidney injury: Potential mechanism of
inhibiting TLR4-NF-κB signal pathway. Oncotarget. 7:39497–39510.
2016. View Article : Google Scholar : PubMed/NCBI
|
|
39
|
Hreggvidsdottir HS, Ostberg T, Wähämaa H,
Schierbeck H, Aveberger AC, Klevenvall L, Palmblad K, Ottosson L,
Andersson U and Harris HE: The alarmin HMGB1 acts in synergy with
endogenous and exogenous danger signals to promote inflammation. J
Leukoc Biol. 86:655–662. 2009. View Article : Google Scholar : PubMed/NCBI
|
|
40
|
Wähämaa H, Schierbeck H, Hreggvidsdottir
HS, Palmblad K, Aveberger AC, Andersson U and Harris HE: High
mobility group box protein 1 in complex with lipopolysaccharide or
IL-1 promotes an increased inflammatory phenotype in synovial
fibroblasts. Arthritis Res Ther. 13:R1362011. View Article : Google Scholar : PubMed/NCBI
|
|
41
|
He ZW, Qin YH, Wang ZW, Chen Y, Shen Q and
Dai SM: HMGB1 acts in synergy with lipopolysaccharide in activating
rheumatoid synovial fibroblasts via p38 MAPK and NF-κB signaling
pathways. Mediators Inflamm. 2013:5967162013. View Article : Google Scholar : PubMed/NCBI
|