Introduction
A solitary pulmonary nodule (SPN) is defined as an
approximately round lesion less than 3 cm in diameter that is
completely surrounded by pulmonary parenchyma without other
pulmonary abnormalities (1). Recent
advanced technology, such as low-dose, helical computed tomography
(CT) screening and multi-detector row CT, has increased the
incidental detection rate of SPNs. When an SPN is detected, imaging
techniques may be used to characterize the nodule in terms of
whether it is likely to be benign or malignant (2). CT is the modality of choice in the
imaging characterization of pulmonary nodules. Chest CT is
considered the standard technique for assessing morphologic
findings (1–8) and the intrathoracic spread of an SPN.
The evaluation of tumor vascularity by using contrast
material-enhanced CT has proven to be useful for differentiating
between malignant and benign nodules (9–12).
Various threshold attenuation values have been reported to be
useful for distinguishing malignant nodules from benign ones on
contrast-enhanced dynamic CT with single- or multi-detector row
helical machines (9,10,12).
In general, malignant nodules tend to enhance substantially more
than benign nodules (9,10,12).
However, in previous studies, which were focused on the early phase
of dynamic CT scanning, a certain overlap was found between
malignant and benign nodules, for example, active granulomas or
benign vascular tumors (12,13).
Therefore, although the results of these dynamic studies showed a
high sensitivity for the diagnosis of malignant nodules, the
specificity was too low. In addition, approximately 50% of
indeterminate lung nodules, for which diagnosis was obtained at
surgery, were benign, and hospitalization for the surgical removal
of these nodules was expensive and involved a certain amount of
morbidity and mortality (14,15).
Therefore, non-invasive imaging modalities for the specific
diagnosis of indeterminate lung nodules are required.
In previous studies (16,17),
the washout characteristics of lesions on contrast-enhanced CT were
assessed. Washout refers to the reduction of attenuation values of
lesions at CT during a variable period following the intravenous
injection of a bolus of contrast material. These studies added new
information on the imaging characterization of SPN. According to
these studies, it should be possible to generate a washout
percentage that reflects the difference in attenuation measurements
of SPNs obtained at dynamic and delayed contrast-enhanced CT. To
the best of our knowledge, no evaluation of the accuracy of
pulmonary nodule washout characterization at dynamic
contrast-enhanced CT has been reported.
The purpose of the present study was to assess the
accuracy of the relative percentage washout characteristics with
dynamic contrast-enhanced multi-detector row CT to distinguish
malignant SPNs from benign ones.
Materials and methods
Patients
The patients included in this study fulfilled the
following criteria: solitary nodule without satellite nodules;
longest diameter <3 cm; approximately spherical; short- and
long-axis diameters within a factor of 1.5 of each other; no
therapy prior to examination; no benign (diffuse, laminated,
popcorn-like or central) patterns of calcification; no fat on
thin-section CT; nodules without ground glass opacity on
thin-section CT; satisfactory patient respiratory registration
without artifact on equatorial images; no marked reaction to
contrast medium that interfered with image acquisition. Our
institutional review board approved our research protocol for this
CT study, and written informed consent was obtained from all
patients.
A total of 63 patients (38 males and 25 females; age
range, 21–80 years, mean 58±13.2 years) with an SPN at chest
radiography underwent dynamic chest CT.
CT examination
CT examinations were performed by using a
16-detector row (Toshiba Aquilion) scanner. Before dynamic CT was
performed, we obtained targeted thin-section helical CT scans
(1.0-mm collimation, 0.4 sec gantry rotation time, 120 kVp, 200 mA)
from the lung apices to the level of the middle pole of the kidneys
for tumor staging. Image data were reconstructed with a thickness
of 2.0 mm by using standard and lung algorithms, respectively.
Initial dynamic scanning was performed with a 90-sec scanning delay
from the beginning of the bolus administration of contrast
material. Delayed scanning limited to the nodule area was performed
20 min following initiation of the administration of contrast
material by using similar scanning parameters and without moving
the patient from the scanning table. Image data following
enhancement were reconstructed with a thickness of 2.0 mm by using
a standard algorithm.
For each lesion, regions of interest (ROI) were
drawn around the lesion on each image of the non-enhanced, dynamic
and delayed CT scans, and then the mean CT value was calculated.
Each ROI measurement was performed twice by two investigators (Z.Y.
and X.Y.), and the mean value was extrapolated to minimize error.
Furthermore, each scanner was calibrated daily against a water
phantom to ensure accurate attenuation measurements.
From the mean Hounsfield unit (HU) value in each ROI
of the pulmonary nodules on the dynamic and delayed CT scans, a
relative percentage washout was calculated as follows: 1 - (HU
measurement on delayed scan/HU measurement on dynamic scan) × 100%.
The absolute delayed attenuation measurements on delayed scans and
absolute enhanced attenuation on dynamic scans were recorded to
determine the amount of lesions that could be characterized by
these methods. In addition, the accuracy of these methods were
compared with that of the calculated relative percentage washout
values.
Statistical analysis
Statistical analysis was performed with SPSS
software (version 10.0, SPSS, Inc.). The values were compared
between malignant and benign nodules by use of the Mann-Whitney U
test. Receiver operating characteristic analysis was performed to
determine a threshold for use in differentiating malignant nodules
from benign nodules. Two-sided tests were used and P<0.05 was
considered to indicate a statistically significant difference.
Results
Of 63 SPNs, 42 (66.7%) proved to be malignant and 21
(33.3%) proved to be benign (Table
I). The mean diameter of the nodules was 1.8 cm (range,
0.8–1.9).
 | Table IDiagnoses of 63 nodules. |
Table I
Diagnoses of 63 nodules.
| Nodule type and
diagnosis | No. of nodules
(%) |
|---|
| Malignant | 42 (66.7) |
| Adenocarcinoma | 28 |
| Squamous cell
carcinoma | 6 |
| Bronchioloalveolar
cell carcinoma | 2 |
| Mucoepidermoid
carcinoma | 1 |
| Small cell
carcinoma | 1 |
| Metastatic
carcinoma | 4 |
| Benign | 21 (33.3) |
| Follow-up with
imaging | 14 |
| Tuberculosis | 3 |
| Hamartoma | 1 |
| Wegener’s
granulomatosis | 1 |
| Fungal
granulomatosis | 1 |
| Bronchial cysts | 1 |
Non-enhanced CT
The mean CT attenuation value in 21 benign lesions
on non-enhanced CT scans was 37±7.7 HU (range, 32–57). The mean
attenuation value in 42 malignant lesions on non-enhanced CT scans
was 40±8.7 HU (range, 16–59). The mean attenuation value of benign
nodules on non-enhanced CT scans was not significantly different
from that of malignant nodules (Mann-Whitney U test, p=0.068).
Early enhanced CT and wash-in of contrast
material
The mean attenuation of the 21 benign lesions on
early contrast-enhanced CT scans was 69±30.9 HU (range, 34–159).
Net enhancement attenuation (wash-in) was 33±30.0 HU (range,
0–113). The mean attenuation of the 42 malignant lesions on early
enhanced CT scans was 69±17.1 HU (range, 31–119). Net enhancement
attenuation (wash-in) was 29±17.9 HU (range, 0–96). No significant
differences were found between benign and malignant nodules with
regard to the mean attenuation value (Mann-Whitney U test, p=0.384)
and net enhancement attenuation (wash-in) (Mann-Whitney U test,
p=0.847) on early contrast-enhanced CT scans.
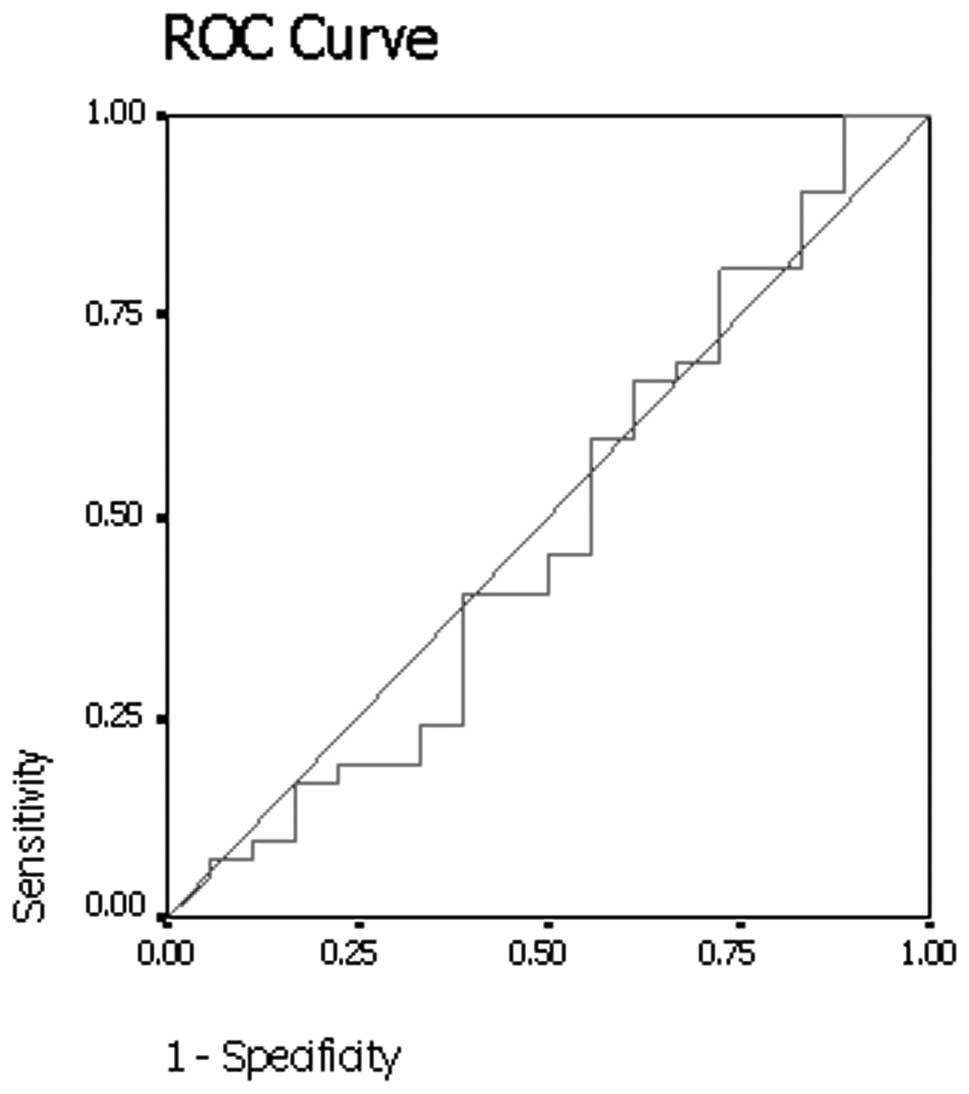
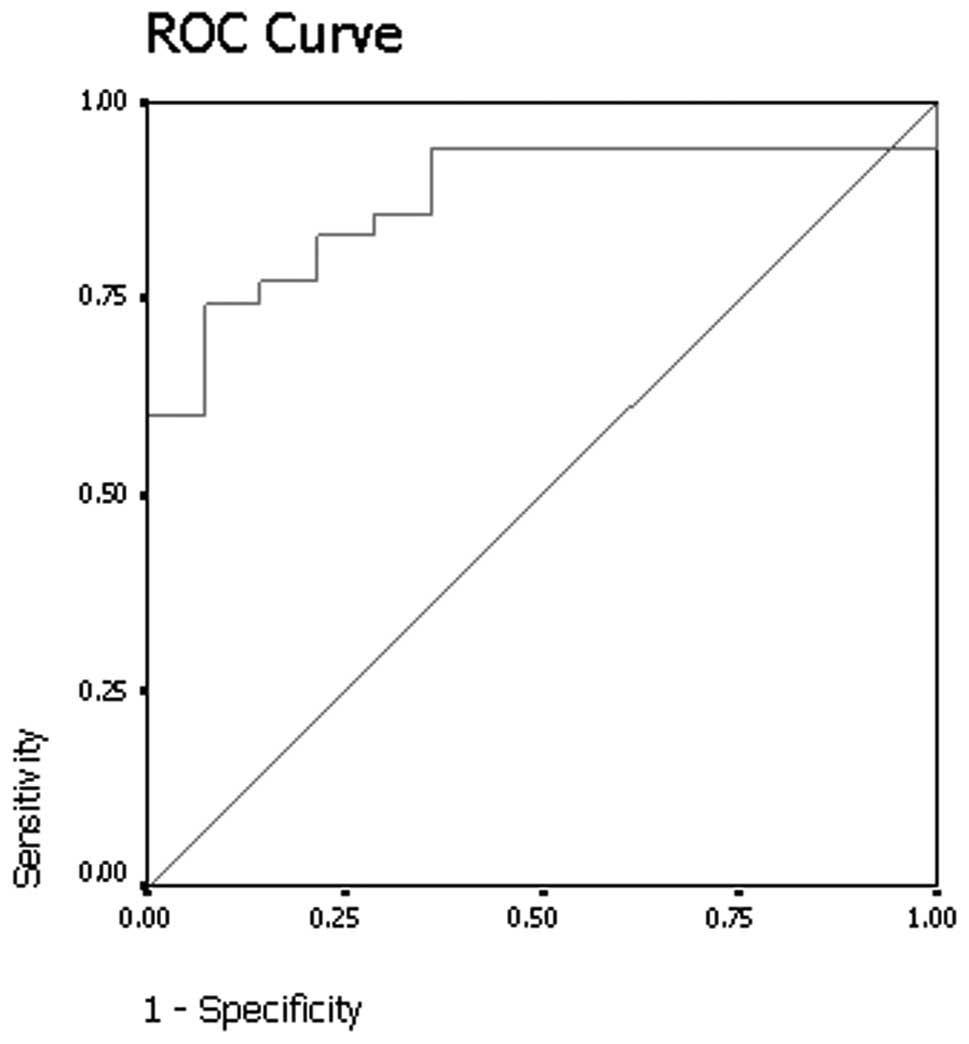
Results of the receiver operating curve analysis
(Fig. 1) showed that a threshold
net enhancement value of 25 HU had 40.5% sensitivity and 55.6%
specificity for identifying malignant nodules on early
contrast-enhanced CT scans.
Delayed contrast-enhanced CT and relative
percentage washout of contrast material
On delayed contrast-enhanced CT scans, the mean
absolute attenuation value for the 21 benign nodules was 48±16.8 HU
(range, 27–93). The mean absolute attenuation value for the 42
malignant nodules on delayed contrast-enhanced CT scans was 62±11.7
HU (range, 36–92). The absolute attenuation values of malignant
nodules were significantly larger than values of benign nodules on
delayed contrast-enhanced CT scans (Mann-Whitney U test,
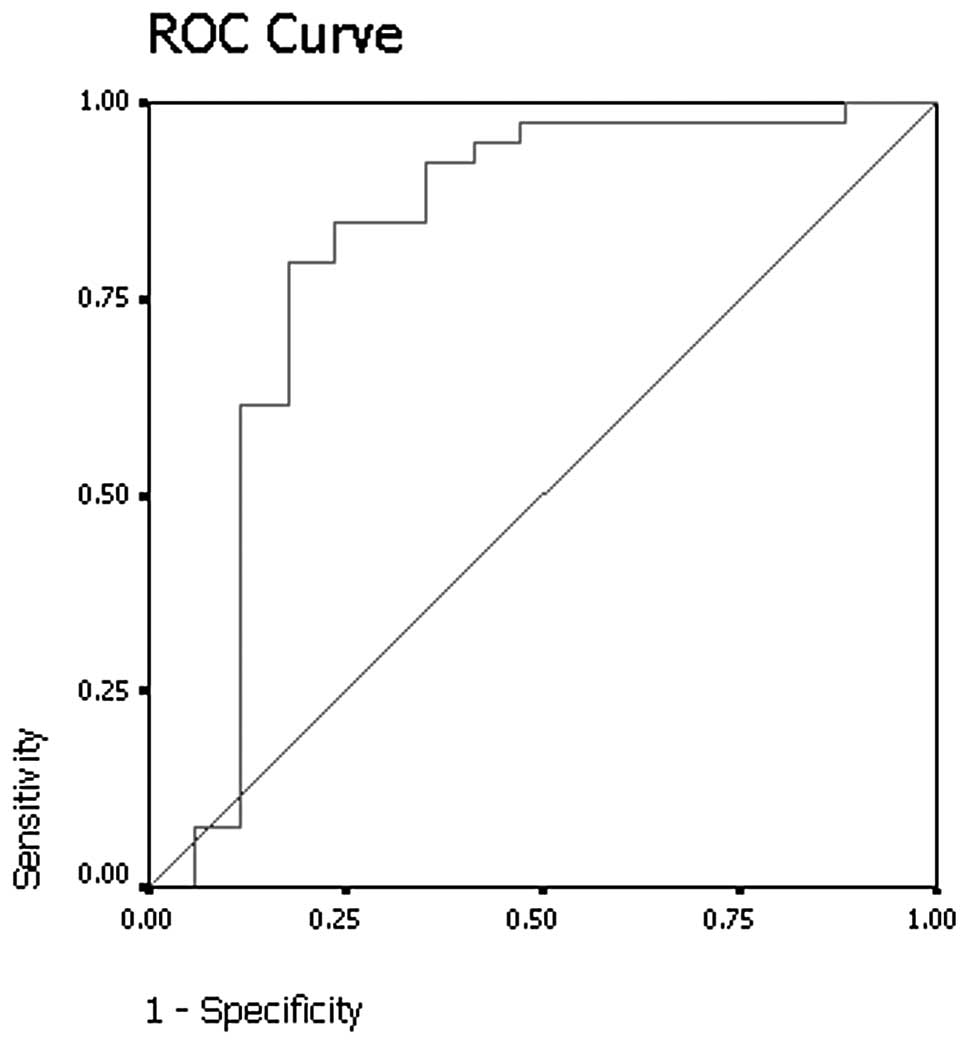
p<0.001). Results of receiver operating curve analysis (Fig. 2) showed that a threshold absolute
attenuation value of 55 HU had 82.1% sensitivity and 76.5%
specificity for identifying malignant nodules on delayed
contrast-enhanced CT scans.
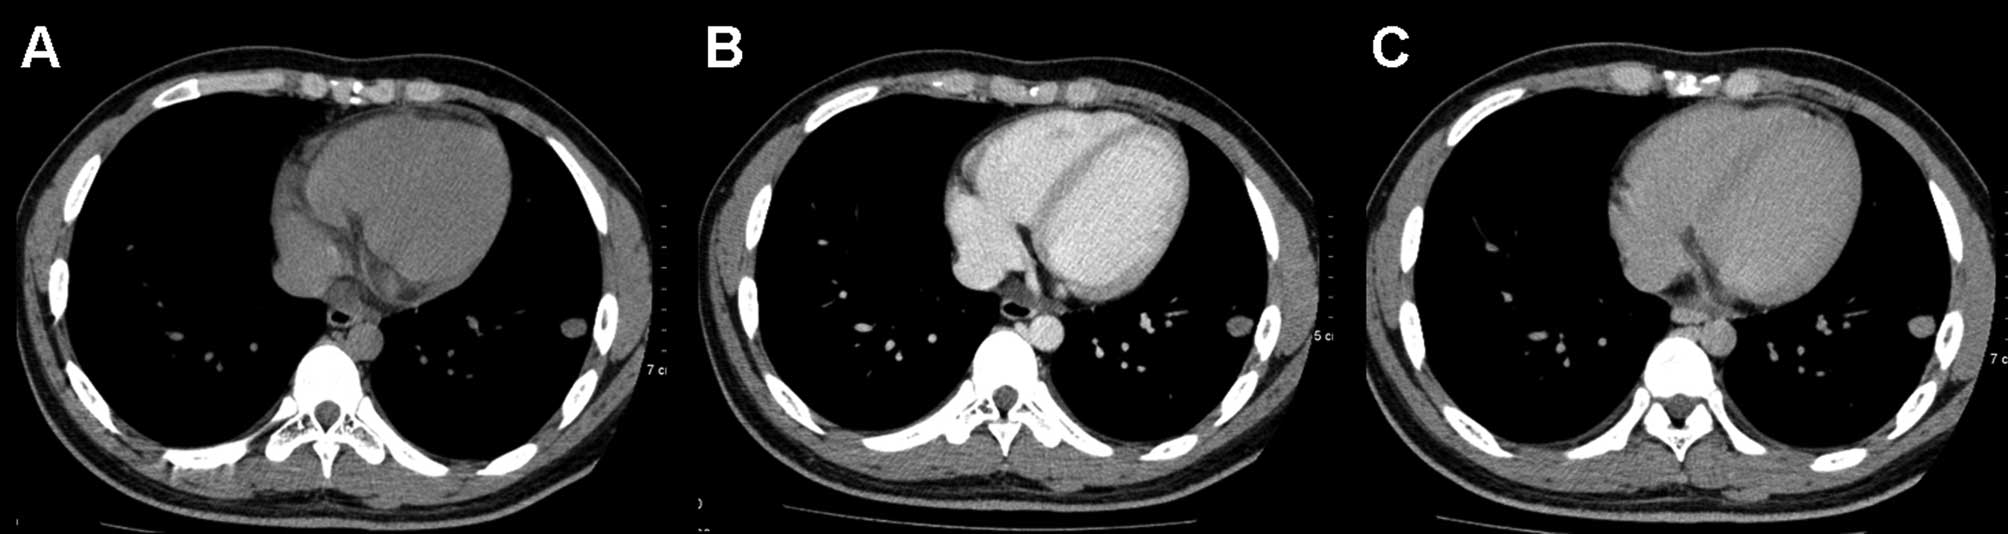
On the delayed contrast-enhanced CT scans, by
excluding 4 nodules that demonstrated net enhancement attenuation
values of <10 HU, the mean relative percentage washout value for
benign nodules was 33% (range, 12–46) (Fig. 3). By excluding 4 lesions that
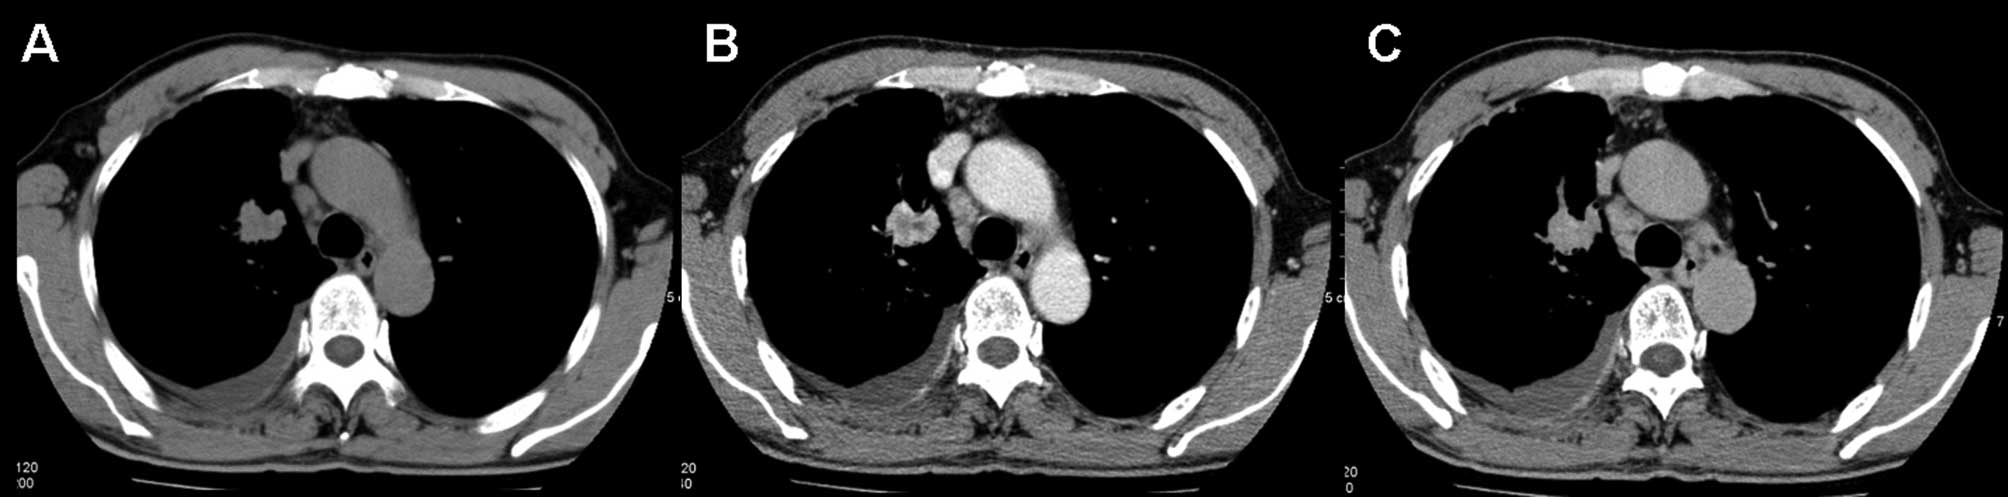
demonstrated net enhancement attenuation values of <10 HU, the
mean relative percentage washout value for malignant nodules was 7%
(range, −36–51) (Fig. 4). The
attenuation values of 12 of the malignant lesions actually
increased on the delayed scan. The relative percentage washout
values of malignant nodules were significantly lower than the
values of the benign nodules on delayed contrast-enhanced CT scans
(Mann-Whitney U test, p<0.001). The results of receiver
operating curve analysis showed that a threshold relative
percentage washout of 14.5% had 74.3% sensitivity and 92.9%
specificity for identifying malignant nodules (Fig. 5).
Discussion
SPNs are caused by a variety of disorders including
neoplasms, infections, inflammation, and vascular and congenital
abnormalities. Although the majority of SPNs have benign causes,
30–40% of these nodules are malignant. Despite a number of clinical
and radiologic features indicating the diagnosis, a number of SPNs
remain indeterminate following conventional radiologic evaluation.
A number of SPNs have similar features, and 25–39% of malignant
nodules are inaccurately classified as benign following
radiological assessment of size, margins, contours and internal
characteristics (18). Patients
with these lesions therefore require additional work-up to
determine the diagnosis.
The evaluation of tumor vascularity by using
contrast material-enhanced CT has proven to be useful for
differentiating between malignant and benign nodules. In general,
malignant nodules tend to enhance substantially more than benign
nodules on CT (9,10,12).
Yamashita et al (19)
reported that a maximum attenuation of 20–60 HU appears to be a
good predictor of malignancy. In their study, Swensen et al
(20) reported that a threshold
value of 15 HU produced a sensitivity of 98%, a specificity of 58%
and an accuracy of 77% for malignant nodules. Cut-off values for
the differentiation between benign and malignant nodules have since
been set at 15 or 20 HU.
However, all of these previous dynamic CT studies
(9,10,12)
were focused on the early phase of dynamic CT scanning, and the
results showed low specificities that range, d from 54 to 77%. In
our study, a threshold value of 25 HU produced a sensitivity of
40.5% and a specificity of 55.6% for malignant nodules. Moreover,
early-phase dynamic CT did not help to differentiate malignant
nodules from active granulomas or benign vascular tumors.
A number of authors assessed the washout
characteristics of adrenal lesions and pulmonary nodules on
contrast-enhanced CT (16,17,21).
Findings now confirm the usefulness of attenuation measurements at
non-enhanced and delayed contrast-enhanced CT for the
differentiation of benign from malignant lesions (16,17,21).
In this study, we evaluated the accuracy of pulmonary nodule
washout characterization at dynamic contrast-enhanced CT. The
relative percentage washout values in the malignant nodules were
significant lower than those in the benign nodules (p<0.001). We
also found that a threshold relative washout of 14.5% had 74.3%
sensitivity and 92.9% specificity for identifying malignant nodules
by receiver operating curve analysis. The results showed a higher
specificity using washout characterization than that for wash-in
characterization in the early phase of dynamic CT scanning. The
biological basis for the observed difference in washout
characterization in malignant and benign pulmonary nodules can be
postulated. Transduction of contrast medium through the lung
involves the intravascular and interstitial spaces (22). A large interstitial space has been
found in certain malignant tumors. Of note, in the washout phase
from the interstitial space, a near absence or substantial
reduction of lymphatic flow is noted in malignant tumors (22). The retarded flow in the
intravascular and interstitial spaces is likely to contribute to
the retention of contrast medium in malignant nodules. Outflow of
contrast medium (washout) through the intravascular space in benign
nodules, particularly in an inflammatory situation, occurs through
relatively straight vessels with a normal configuration.
Additionally, washout of the contrast medium from the interstitial
space is accelerated by active lymphatic flow (23). In the inflammatory nodules, the
time-attenuation curve declines after reaching peak height, due to
normal washout (13). In malignant
nodules, the curve changes little after reaching peak height, due
to the retarded flow in the washout phase.
There were several limitations to our study. First,
pathological proof was not obtained for a number of the benign
nodules. However, follow-up CT scans helped to diagnose benign
nodules by showing no growth or a decrease in the size of the
nodules.
Second, the previous study showed that certain
nodules had persistent enhancement on 15-min delayed CT scanning
(16). Therefore, we selected a
20-min delay, so as to leave enough time for the washout of
contrast material from a pulmonary nodule. Although the application
of washout threshold values may provide high sensitivity and
specificity in differentiating between benign and malignant
nodules, we found that it is difficult to obtain a delayed scan at
precisely 20 min due to the pressures of the CT schedule.
Third, no pathophysiological data or proof is
presented to explain the washout characteristics of benign and
malignant nodules.
In conclusion, the evaluation of SPNs by analyzing
washout characteristics at dynamic multi-detector row CT was proved
useful for differentiating between benign and malignant nodules.
However, further studies are required to determine a suitable and
effective delayed CT scan protocol for clinical practice.
References
|
1
|
Ost D, Fein AM and Feinsilver SH: The
solitary pulmonary nodule. N Engl J Med. 348:2535–2542. 2003.
View Article : Google Scholar : PubMed/NCBI
|
|
2
|
Shaffer K: Role of radiology for imaging
and biopsy of solitary pulmonary nodule. Chest. 116:519–522. 1999.
View Article : Google Scholar : PubMed/NCBI
|
|
3
|
Tan BB, Flaherty KR, Kazerooni EA and
Iannettoni MD; American College of Chest Physicians. The solitary
pulmonary nodule. Chest. 123:S89–S96. 2003. View Article : Google Scholar
|
|
4
|
Winer-Muram HT: The solitary pulmonary
nodule. Radiology. 239:34–49. 2006. View Article : Google Scholar : PubMed/NCBI
|
|
5
|
MacMahon H, Austin JH, Gamsu G, Herold CJ,
Jett JR, Naidich DP, Patz EF Jr and Swensen SJ; Fleischner Society.
Guidelines for management of small pulmonary nodules detected on CT
scans. A statement from the Fleischner Society. Radiology.
237:395–400. 2005. View Article : Google Scholar : PubMed/NCBI
|
|
6
|
Christensen JA, Nathan MA, Mullan BP,
Hartman TE, Swensen SJ and Lowe VJ: Characterization of the
solitary pulmonary nodule: 18F-FDG PET versus nodule-enhancement
CT. Am J Roentgenol. 187:1361–1367. 2006. View Article : Google Scholar : PubMed/NCBI
|
|
7
|
Marom EM: CT of the solitary pulmonary
nodule - a commentary. Am J Roentgenol. 190:1154–1155. 2008.
View Article : Google Scholar : PubMed/NCBI
|
|
8
|
Matsuoka S, Kurihara Y, Yagihashi K, Niimi
H and Nakajima Y: Peripheral solitary pulmonary nodule: CT findings
in patients with pulmonary emphysema. Radiology. 235:266–273. 2005.
View Article : Google Scholar : PubMed/NCBI
|
|
9
|
Swensen SJ, Brown LR, Colby TV and Weaver
AL: Pulmonary nodules: CT evaluation of enhancement with iodinated
contrast material. Radiology. 194:393–398. 1995. View Article : Google Scholar : PubMed/NCBI
|
|
10
|
Swensen SJ, Brown LR, Colby TV, Weaver AL
and Midthun DE: Lung nodule enhancement at CT: prospective
findings. Radiology. 201:447–455. 1996. View Article : Google Scholar : PubMed/NCBI
|
|
11
|
Yamashita K, Matsunobe S, Takahashi R,
Tsuda T, Matsumoto K, Miki H, Oyanagi H and Konishi J: Small
peripheral lung carcinoma evaluated with incremental dynamic CT:
radiologic-pathologic correlation. Radiology. 196:401–408. 1995.
View Article : Google Scholar : PubMed/NCBI
|
|
12
|
Yi CA, Lee KS, Kim EA, Han J, Kim H, Kwon
OJ, Jeong YJ and Kim S: Solitary pulmonary nodules: dynamic
enhanced multi-detector row CT study and comparison with vascular
endothelial growth factor and microvessel density. Radiology.
233:191–199. 2004. View Article : Google Scholar : PubMed/NCBI
|
|
13
|
Zhang M and Kono M: Solitary pulmonary
nodules: evaluation of blood flow patterns with dynamic CT.
Radiology. 205:471–478. 1997. View Article : Google Scholar : PubMed/NCBI
|
|
14
|
Bernard A: Resection of pulmonary nodules
using video-assisted thoracic surgery. The Thorax Group. Ann Thorac
Surg. 161:202–204. 1996. View Article : Google Scholar : PubMed/NCBI
|
|
15
|
Keagy BA, Starek PJ, Murray GF, Battaglini
JW, Lores ME and Wilcox BR: Major pulmonary resection for suspected
but unconfirmed malignancy. Ann Thorac Surg. 38:314–316. 1984.
View Article : Google Scholar : PubMed/NCBI
|
|
16
|
Jeong YJ, Lee KS, Jeong SY, Chung MJ, Shim
SS, Kim H, Kwon OJ and Kim S: Solitary pulmonary nodule:
characterization with combined wash-in and washout features at
dynamic multi-detector row CT. Radiology. 237:675–83. 2005.
View Article : Google Scholar : PubMed/NCBI
|
|
17
|
Pena CS, Boland GW, Hahn PF, Lee MJ and
Mueller PR: Characterization of indeterminate (lipid-poor) adrenal
masses: use of washout characteristics at contrast-enhanced CT.
Radiology. 217:798–802. 2000. View Article : Google Scholar : PubMed/NCBI
|
|
18
|
Gurney JW, Lyddon DW and McKay JA:
Determining the likelihood of malignancy in solitary pulmonary
nodules with Bayesian analysis. Part II. Application. Radiology.
186:415–422. 1993. View Article : Google Scholar
|
|
19
|
Yamashita K, Matsunobe S, Tsuda T, Nemoto
T, Matsumoto K, Miki H and Konishi J: Solitary pulmonary nodule:
preliminary study of evaluation with incremental dynamic CT.
Radiology. 194:399–405. 1995. View Article : Google Scholar : PubMed/NCBI
|
|
20
|
Swensen SJ, Viggiano RW, Midthun DE,
Müller NL, Sherrick A, Yamashita K, Naidich DP, Patz EF, Hartman
TE, Muhm JR and Weaver AL: Lung nodule enhancement at CT:
multicenter study. Radiology. 214:73–80. 2000. View Article : Google Scholar : PubMed/NCBI
|
|
21
|
Caoili EM, Korobkin M, Francis IR, Cohan
RH, Platt JF, Dunnick NR and Raghupathi KI: Adrenal masses:
characterization with combined unenhanced and delayed enhanced CT.
Radiology. 222:629–633. 2002. View Article : Google Scholar : PubMed/NCBI
|
|
22
|
Littleton JT, Durizch ML, Moeller G and
Herbert DE: Pulmonary masses: contrast enhancement. Radiology.
177:861–871. 1990. View Article : Google Scholar : PubMed/NCBI
|
|
23
|
Dewan NA, Gupta NC, Redepenning LS, Phalen
JJ and Frick MP: Diagnostic efficacy of PET-FDG imaging in solitary
pulmonary nodules: potential role in evaluation and management.
Chest. 104:997–1002. 1993. View Article : Google Scholar : PubMed/NCBI
|