Introduction
Gliomas are the most common primary tumors of the
central nervous system in humans and are characterized by a rapid
infiltrative growth pattern that makes complete surgical resection
impossible. Despite progress in tumor diagnosis and treatment,
including surgery, radiotherapy and chemotherapy, the median
survival time is only one year and few patients survive for two
years (1). Moreover, these
conventional therapies often damage the surrounding normal brain
tissues, leading to consciousness disorders and neurological
deficits. Immunotherapy is a more effective and specific
therapeutic method (2). Therefore,
the identification of several biomarkers, which are expressed
differentially in high-grade gliomas, low-grade gliomas and normal
brain tissues, is urgently required for immunotherapy and the
formation of a prognosis.
Cancer/testis antigens (CTAs) are a group of
tumor-associated antigens that are expressed in normal testis germ
cells, the placenta, trophoblasts and in various tumors (3–5). These
antigens may be used as ideal targets for cancer immunotherapy due
to their characteristic expression pattern (6). Melanoma-associated antigens (MAGE) are
a subgroup of CTAs that include >60 genes in humans (7). The MAGE family is subdivided into two
groups, MAGE-I and MAGE-II, based on their gene structure and
tissue-specific gene expression (8). The MAGE-I group includes the MAGE-A,
-B and -C subfamilies. The MAGE-A family is located in the q28
region of the X chromosome and includes 12 family members, named
MAGE-A1 to A12 (9,10). Glial cells and melanocytes originate
from the neural ectoderm, so tumors derived from these two types of
cells, i.e. gliomas and melanomas, may have common biological
characteristics. Although MAGEs have been well studied for >20
years in melanomas (11), these
antigens have not been well characterized in gliomas. Kuramoto
investigated the expression of the MAGE-A1 and -A4 proteins in 28
brain tumor tissues (14 gliomas and 14 non-gliomas) by immunoblot
analysis and observed positive results in the majority of gliomas
(12 of 14) and a few (5 of 14) non-gliomas (12). Bodey et al studied the
expression of MAGE-A1 protein in childhood astrocytomas using an
immunocytochemical method and observed that positively-stained
cells were present in high-grade, but not low-grade, astrocytomas,
suggesting that MAGE-A1 may be an indicator of childhood
astrocytoma progression (13). Syed
et al analyzed the composite expression of CTA and
melanocyte-differentiation antigens (MDA) using RT-PCR in malignant
gliomas and noted that the frequencies of MAGE-A3, -A1 and -A4 were
22, 16 and 7%, respectively (14).
In the present study, formalin-fixed and
paraffin-embedded tissues and the clinicopathological parameters
from 78 patients with glioma were collected and the expression
levels of the MAGE-A1, -A3, -A11 and ki-67 proteins were evaluated
by immunohistochemistry. Furthermore, the associations of patient
prognosis and clinicopathological parameters with the expression of
the MAGE-A1, -A3 and -A11 proteins were investigated. To the best
of our knowledge, this is the first study to detect MAGE-A11
expression in gliomas and to show a correlation between its
expression level and patient prognosis.
Materials and methods
Clinical specimens
A total of 78 glioma specimens obtained from
patients who underwent surgical treatment at the Department of
Neurosurgery of the Fourth Clinical Hospital of Hebei Medical
University (Shijiazhuang, Hebei, China) between 2006 and 2010 were
analyzed in the present study. No patients underwent any
treatments, including radiotherapy or chemotherapy, prior to
surgery. The patients included 45 males and 33 females with a mean
age of 49.8 years (range, 22–79 years). Gliomas were classified
according to the guidelines of the 2000 WHO classification
(15). These tumors included nine
grade I (pilocytic astrocytomas), 16 grade II (astrocytomas), 17
grade III (anaplastic astrocytomas) and 36 grade IV (glioblastoma)
gliomas. Six normal human testis specimens were obtained as
positive controls from patients with prostatic cancer who underwent
surgical castration orchiectomy at the Department of Urinary
Surgery, the Fourth Clinical Hospital of Hebei Medical University
in 2007. A total of 15 normal brain specimens were obtained as
negative controls from the donations of individuals who had
succumbed due to injuries caused by traffic accidents. After
surgery, the specimens were sent to the pathology department to be
fixed with formalin and embedded in paraffin for conventional
hematoxylin and eosin (HE) staining and immunohistochemical
analysis. Informed consent was obtained from all recruited subjects
prior to enrollment and all patients were consecutively enrolled.
The study was approved by the Medical Ethics Committee of the
Fourth Clinical Hospital of Hebei Medical University. All patients
were followed up until September 2012.
Clinicopathological parameters
The clinicopathological parameters, including age,
gender, Karnofsky performance scale (KPS) score, histological types
and pathological grades, were collected by reviewing medical
records and telephone interview information.
Immunohistochemistry and evaluation
Tissue sections of a 4-μm thickness were cut
from paraffin-embedded tissue blocks, mounted on silanized slides
and incubated for 120 min in a thermostat at 60°C. The sections
were then deparaffinized in xylene, rehydrated in sequential
alcohol grades and washed with phosphate-buffered saline (PBS; pH
7.2) for 5 min three times. Antigen retrieval was performed by
heating the sections in a microwave oven for 20 min in 10 mM sodium
citrate buffer (pH 6.0) followed by endogenous peroxidase, using 3%
hydrogen peroxide for 20 min. Subsequent to being washed in PBS,
the samples were incubated in 10% normal goat serum at 37°C in a
humidified chamber for 30 min to minimize non-specific protein
binding. The sections were then incubated with rabbit-anti-human
MAGE-A1 monoclonal antibody (1:200; Epitomics, Burlingame, CA,
USA), rabbit-anti-human MAGE-A3 polyclonal antibody (1:100; Abcam,
Cambridge, UK), rabbit anti-human MAGE-A11 polyclonal antibody
(1:100; Epitomics) or mouse anti-human ki-67 monoclonal antibody
(Jinqiao, Beijing, China) at 4°C overnight, followed by
biotinylated secondary antibodies for 30 min at 37°C. A
streptoavidin-biotinylated horseradish peroxidase-based detection
system was used to detect antigen-specific binding. Normal rabbit
or mouse IgG replaced the primary antibody for the controls.
Finally, the slides were counterstained with HE for microscopic
observation and evaluation.
To evaluate MAGE-A1, -A3 and -A11 expression in the
various grades of glioma, qualitative and quantitative evaluations
of the percentage of positive cells and the intensity of staining
were performed using a light microscope at high magnification
(×400) by examining 10 randomly selected visual fields per slide.
The percentage of the antigen-positive cells were scored as follow:
0, no positive cells; 1, 0–10% positive cells; 2, 11–50% positive
cells; and 3, >50% positive cells. The intensity of the staining
was scored as follows: 0, no staining; 1, weak staining; 2, mild
staining; and 3, high intensity staining. The final score per slide
was the cross product of the scores of staining intensity and
percentage of positive cells (16).
The expression level was defined as between - and 3+, as follows:
-, score <2; +, score of 2–3; 2+, score of 4; 3+, score of 6 or
9. A score of - or + was defined as a low expression level. A score
of 2–3+ was defined as a high expression level.
The ki-67 labeling index (percentage of ki-67
positive cells) was examined by light microscopy at low
magnification (×200) by observing 10 randomly selected visual
fields. The average count of each field was the percentage of
immunopositive neoplastic cells. Marked nuclear staining was
regarded as positive and weak nuclear or cytoplasmic staining was
negative. All samples were scored by two independent experienced
pathologists. A high ki-67 labeling index was defined as when ≥10%
of neoplastic cells were positive (17).
Statistical analysis
Statistical analysis was performed using SPSS 11.5
software (SPSS Inc., Chicago, IL, USA). Two-sided tests were used
to determine the significance and P<0.05 was considered to
indicate a statistically significant difference for all statistical
tests. The data are expressed as the mean ± SD of the experiments.
Chi-squared or Fisher’s exact tests were used to evaluate the
statistical significance of the differences and associations
between MAGE-A1, -A3 and -A11 and the clinicopathological
parameters. The correlations between MAGE-A1, -A3 and -A11 and the
ki-67 labeling index were assessed by Spearman’s rank correlation
coefficient. Overall survival (OS) time was defined as the period
between the date of surgery to the date of mortality. The
Kaplan-Meier method was used for the survival analyses. The
statistical significance of the differences between the groups was
evaluated using the log-rank test. The associations between OS and
the potential prognostic factors were analyzed using Cox-regression
multivariate analysis.
Results
Expression of MAGE-A1, -A3 and -A11 in
glioma and normal brain tissues
In the normal human testis tissue, MAGE-A1 was
mainly located in the cytoplasm and membrane. However, MAGE-A3 and
-A11 were observed in the cytoplasm and nuclei of the primary
spermatogonia and spermatocytes (Fig.
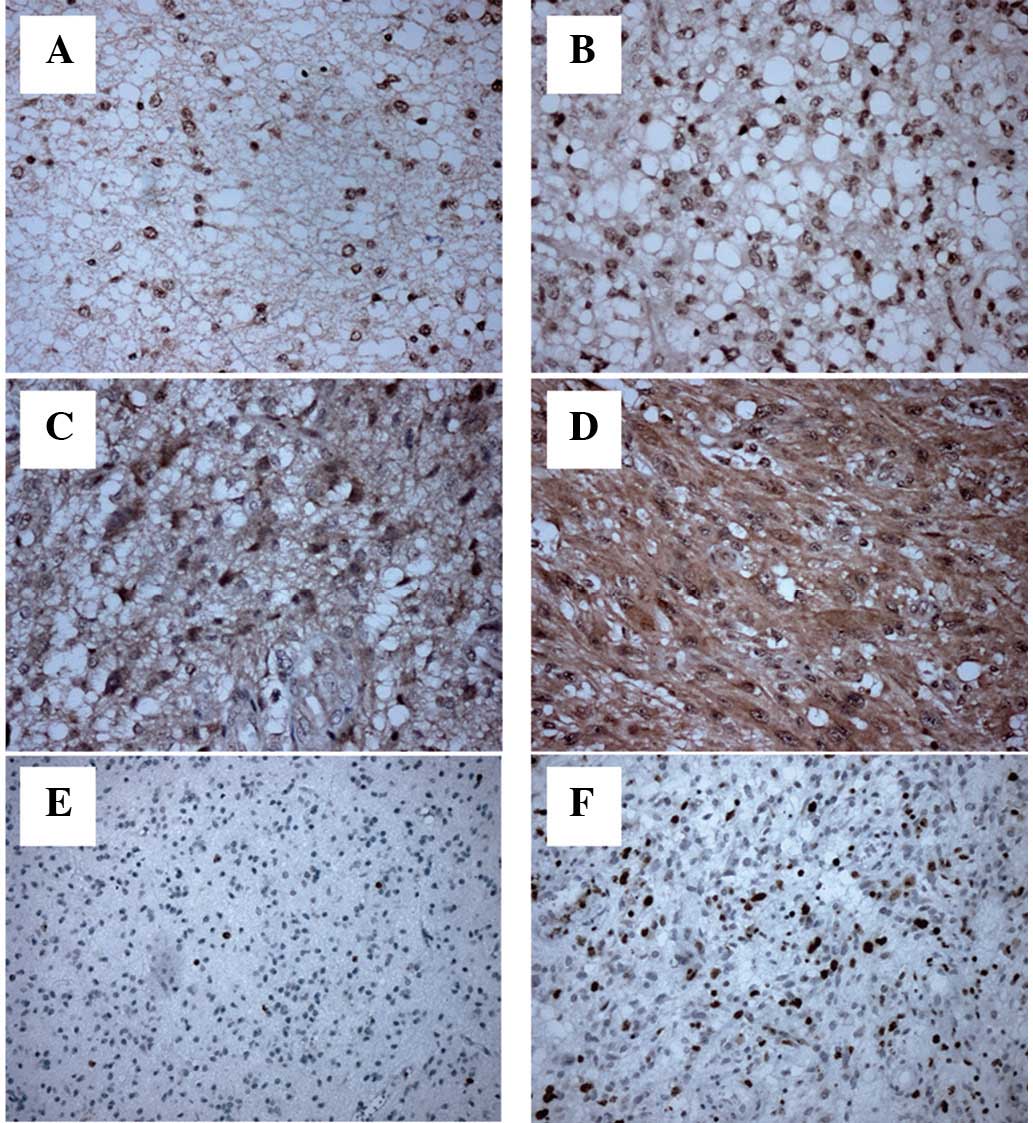
1). In the grade I–II gliomas, MAGE-A1 (Fig. 2A and B) was expressed mainly in the
cytoplasm and membrane, while MAGE-A3 (data not shown) and -A11
(Fig. 3A and B) were expressed in
the nuclei of the tumor cells. In the grade III–IV gliomas, MAGE-A1
(Fig. 2C and D) was mainly detected
in the cytoplasm, while MAGE-A3 (data not shown) and -A11 (Fig. 3C and D) were mainly found in the
cytoplasm and nuclei of the tumor cells.
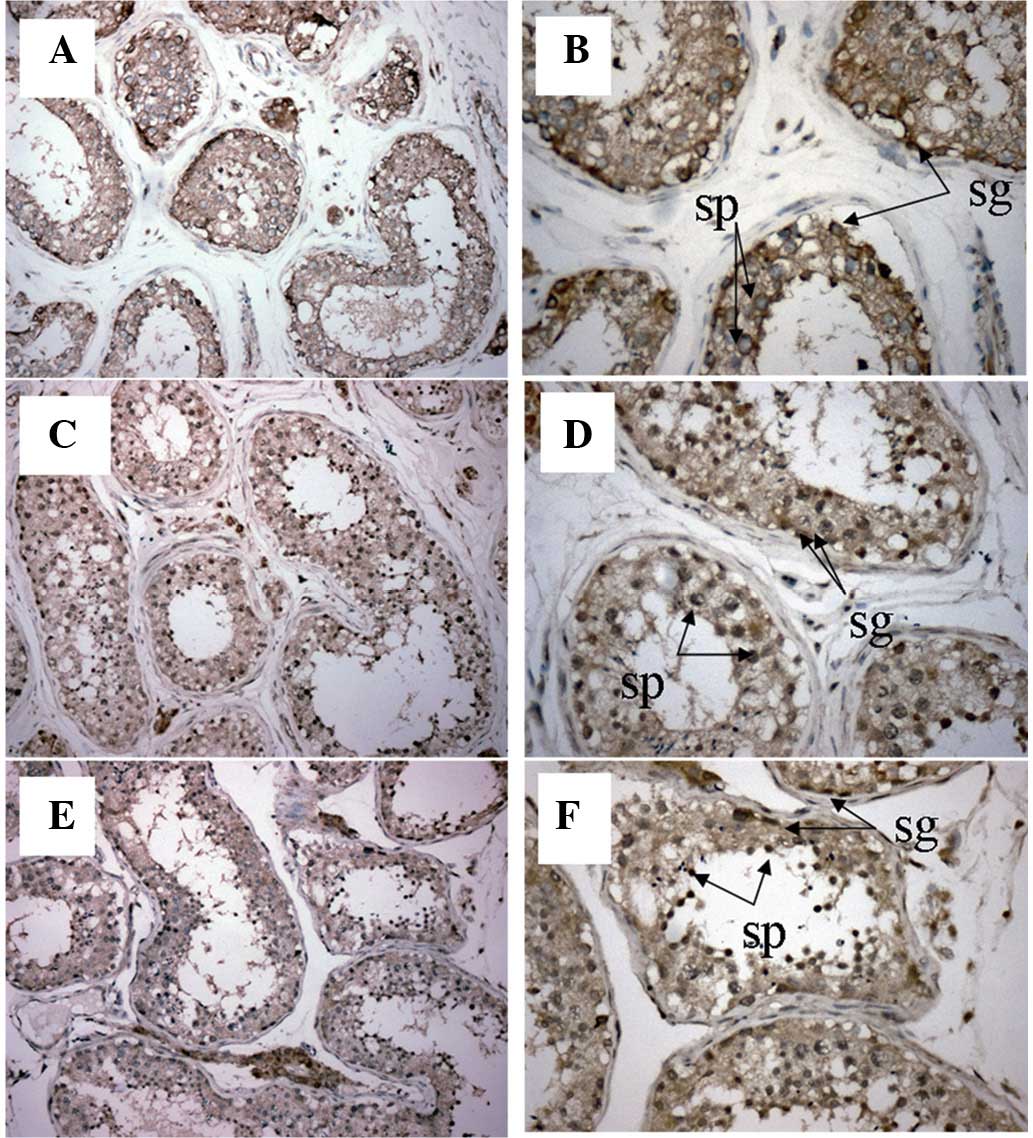 | Figure 1.Immunohistochemical analysis of
MAGE-A1, -A3 and -A11 expression in normal human testis tissue.
Magnification: (A) MAGE-A1, ×200; (B) MAGE-A1, ×400; (C) MAGE-A3,
×200; (D) MAGE-A3, ×400; (E) MAGE-A11, ×200; and (F) MAGE-A11,
×400. In the normal testis tissue, MAGE-A1, -A3 and -A11 were
mainly expressed in the primary spermatocytes (Sp) and
spermatogonia (Sg). MAGE, melanoma-associated antigen. |
The expression of MAGE-A1, -A3 and -A11 was not
detected in the 15 normal brain tissues (data not shown). Out of
the 78 glioma specimens, 50 (64.1%), 40 (51.3%) and 45 (57.7%)
exhibited high expression levels with MAGE-A1, -A3 and -A11
antibodies, respectively (Table I).
In addition, the frequencies of these antigens in the gliomas with
various pathological grades were not accordant (Table II). The expression levels of MAGE-A1
(P= 0.000) and -A11 (P= 0.000) in the various pathological grades
were significantly different and increased with the pathological
grade. However, there was no significant difference between the
MAGE-A3 expression level and the pathological grade.
 | Table I.Expression levels of MAGE-A1, -A3 and
-A11 in glioma and normal brain tissues. |
Table I.
Expression levels of MAGE-A1, -A3 and
-A11 in glioma and normal brain tissues.
| Type of tissue | MAGE-A1
| χ2 | P-value | MAGE-A3
| χ2 | P-value | MAGE-A11
| χ2 | P-value |
|---|
| −/+ | 2+/3+ | −/+ | 2+/3+ | −/+ | 2+/3+ |
|---|
| Glioma | 28 | 50 | 20.796 | 0.000 | 38 | 40 | 13.498 | 0.000 | 33 | 45 | 16.767 | 0.000 |
| Normal brain
tissue | 15 | 0 | | | 15 | 0 | | | 15 | 0 | | |
| Table II.Expression levels of MAGE-A1, -A3 and
-A11 in various pathological grades of glioma. |
Table II.
Expression levels of MAGE-A1, -A3 and
-A11 in various pathological grades of glioma.
| Grade | n | MAGE -A1
| χ2 | P-value | MAGE -A3
| χ2 | P-value | MAGE -A11
| χ2 | P-value |
|---|
| − | + | 2+ | 3+ | − | + | 2+ | 3+ | − | + | 2+ | 3+ |
|---|
| I | 9 | 6 | 2 | 1 | 0 | * | 0.000 | 2 | 2 | 3 | 2 | 3.144 | 0.958 | 6 | 2 | 0 | 1 | 30.321 | 0.000 |
| II | 16 | 2 | 9 | 5 | 0 | | | 5 | 4 | 4 | 3 | | | 2 | 5 | 4 | 5 | | |
| III | 17 | 2 | 2 | 4 | 9 | | | 5 | 5 | 5 | 2 | | | 4 | 6 | 2 | 5 | | |
| IV | 36 | 1 | 4 | 12 | 19 | | | 6 | 9 | 12 | 9 | | | 0 | 8 | 8 | 20 | | |
Associations between the expression
levels of MAGE-A1, -A3 and -A11 and the clinicopathological
characteristics of glioma patients
The association between the expression levels of
MAGE-A1, -A3 and -A11 and the patients’ clinicopathological
characteristics are shown in Table
III. No associations were observed among age, gender, KPS score
and the expression levels of MAGE-A1, -A3 and -A11. However,
significant correlations were detected between the expression of
MAGE-A1 (P=0.000) and MAGE-A11 (P=0.030) and the glioma
pathological grade. There were no significant associations between
MAGE-A3 (P=0.069) expression and tumor grade.
| Table III.Associations between MAGE-A1, -A3 and
-A11 expression levels and the clinicopathological characteristics
of patients with glioma. |
Table III.
Associations between MAGE-A1, -A3 and
-A11 expression levels and the clinicopathological characteristics
of patients with glioma.
| Clinicopathological
parameters | MAGE-A1
| χ2 | P-value | MAGE-A3
| χ2 | P-value | MAGE-A11
| χ2 | P-value |
|---|
| −/+ | 2+/3+ | −/+ | 2+/3+ | −/+ | 2+/3+ |
|---|
| Age (years) | | | | | | | | | | | | |
| ≥50 | 16 | 21 | 1.651 | 0.199 | 19 | 18 | 0.195 | 0.658 | 17 | 20 | 0.382 | 0.537 |
| <50 | 12 | 29 | | | 19 | 22 | | | 16 | 25 | | |
| Gender | | | | | | | | | | | | |
| Male | 17 | 28 | 0.163 | 0.686 | 20 | 25 | 0.778 | 0.378 | 19 | 26 | 0.000 | 0.986 |
| Female | 11 | 22 | | | 18 | 15 | | | 14 | 19 | | |
| Pathological
grade | | | | | | | | | | | | |
| Glioma I–II | 19 | 6 | 25.714 | 0.000 | 13 | 12 | 0.159 | 0.690 | 15 | 10 | 4.718 | 0.030 |
| Glioma
III–IV | 9 | 44 | | | 25 | 28 | | | 18 | 35 | | |
| KPS score | | | | | | | | | | | | |
| ≥80 | 8 | 13 | 0.060 | 0.806 | 3 | 18 | 13.637 | 0.000 | 8 | 13 | 0.209 | 0.648 |
| <80 | 20 | 37 | | | 35 | 22 | | | 25 | 32 | | |
Associations between MAGE-A1, -A3 and
-A11 expression levels and the prognosis of glioma patients
Among the 78 glioma patients, the median survival
time was 26 months and the one-, three- and five-year survival
rates were 71.79, 37.16 and 21.56%, respectively.
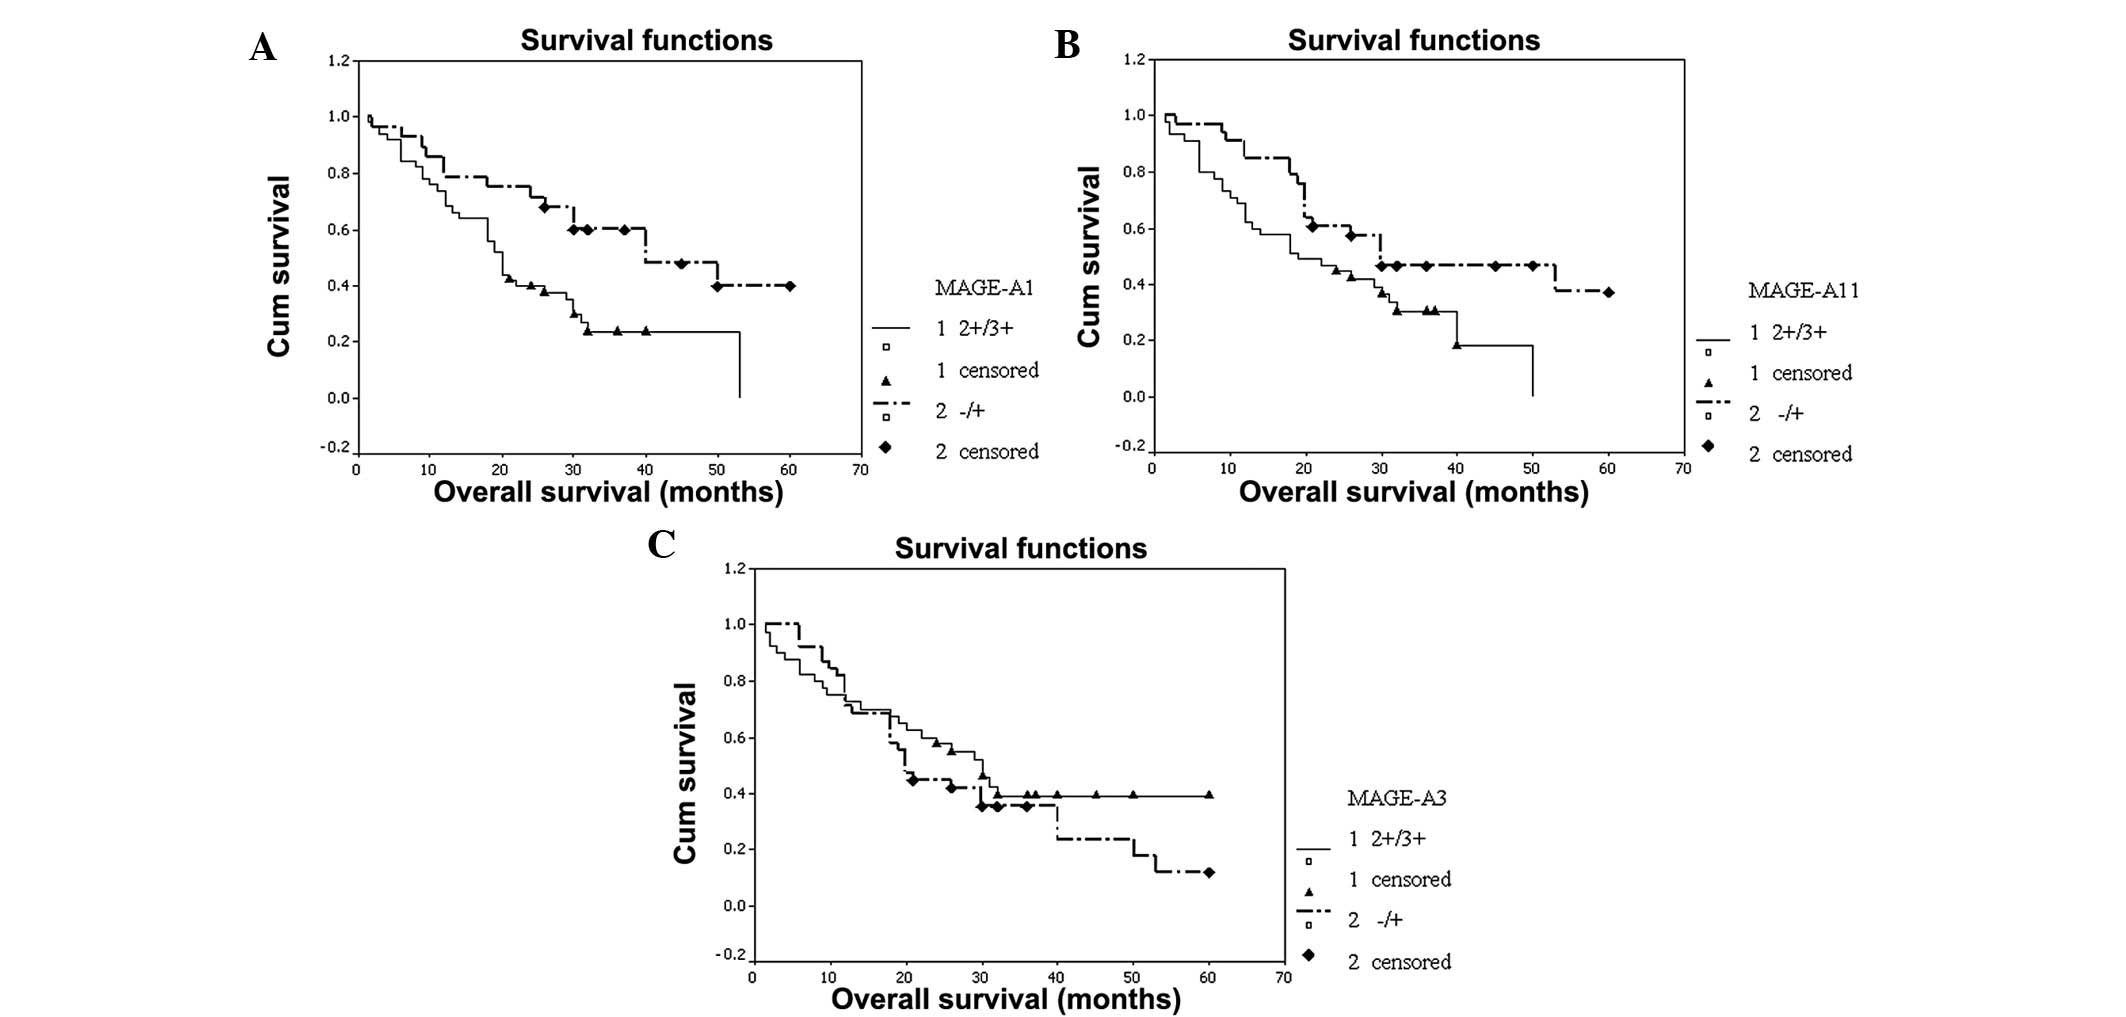
The OS of the patients in the MAGE-A1, -A3 and -A11
groups with high and low expression was examined and statistically
significant differences were only observed between the MAGE-A1 (P=
0.005) and -A11 (P= 0.019) subgroups. The survival time of the
patients with high expression levels of MAGE-A1 or -A11 was
significantly lower compared with the patients with low expression
levels (Fig. 4). In the univariate
analysis, high pathological grade (P=0.000), low KPS score
(P=0.000), decreased age (P=0.014), high ki-67 labeling index
(P=0.050) and high MAGE-A1 (P=0.005) and -A11 (P=0.019) expression
levels were correlated with poor patient outcomes (Table IV). Further assessment with Cox’s
multivariable analysis showed that high pathological grade
(P=0.000), low KPS score (P= 0.000) and high MAGE-A1 (P=0.007) and
-A11 (P=0.010) expression levels were statistical predictors of
poor OS (Table V). Additionally,
the ki-67 labeling index was positively correlated with the
expression of MAGE-A1 (P=0.026) and MAGE-A11 (P=0.008; Table VI).
| Table IV.Univariate analyses to evaluate the
effect of variables on median survival and survival rate for 78
patients with glioma. |
Table IV.
Univariate analyses to evaluate the
effect of variables on median survival and survival rate for 78
patients with glioma.
| Variable | Cases | Median survival
(months) | Survival rate
(years)
| χ2 | P-value |
|---|
| 1 | 3 | 5 |
|---|
| Age (years) | | | | | | | |
| ≥50 | 37 | 40 | 83.78 | 50.61 | 25.30 | 6.050 | 0.014 |
| <50 | 41 | 19 | 60.98 | 22.50 | 22.50 | | |
| Gender | | | | | | | |
| Male | 45 | 30 | 75.56 | 40.73 | 27.15 | 1.181 | 0.278 |
| Female | 33 | 20 | 66.67 | 32.49 | 14.44 | | |
| Pathological
grade | | | | | | | |
| Glioma I–II | 25 | 50 | 100.00 | 76.55 | 47.63 | 24.090 | 0.000 |
| Glioma
III–IV | 53 | 18 | 58.49 | 18.57 | 9.29 | | |
| KPS score | | | | | | | |
| ≥80 | 21 | - | 85.71 | 69.84 | 69.84 | 12.610 | 0.000 |
| <80 | 57 | 20 | 66.67 | 25.20 | 9.45 | | |
| MAGE-A1
expression | | | | | | | |
| −/+ | 28 | 40 | 78.57 | 59.87 | 39.92 | 7.960 | 0.005 |
| 2+/3+ | 50 | 20 | 68.00 | 23.69 | 0.00 | | |
| MAGE-A3
expression | | | | | | | |
| −/+ | 38 | 20 | 71.05 | 35.49 | 11.83 | 1.060 | 0.304 |
| 2+/3+ | 40 | 30 | 72.50 | 39.20 | 39.20 | | |
| MAGE-A11
expression | | | | | | | |
| −/+ | 33 | 30 | 84.85 | 46.65 | 37.32 | 5.550 | 0.019 |
| 2+/3+ | 45 | 19 | 62.22 | 30.41 | 0.00 | | |
| Ki-67
expression | | | | | | | |
| <10% | 17 | 50 | 88.24 | 59.13 | 0.00 | 3.770 | 0.050 |
| ≥10% | 61 | 20 | 67.21 | 31.18 | 23.39 | | |
| Table V.Multivariate Cox’s regression
analysis for patients with glioma. |
Table V.
Multivariate Cox’s regression
analysis for patients with glioma.
| Factor | Variable | B | SE | Wald | P-value | OR | Low | Upper |
|---|
| MAGE-A1
expression | −/+ or 2+−3+ | 0.875 | 0.325 | 7.248 | 0.007 | 2.399 | 1.269 | 4.538 |
| Pathological
grade | I–II or III–IV | 1.728 | 0.398 | 18.881 | 0.000 | 5.630 | 2.582 | 12.276 |
| MAGE-A11
expression | −/+ or 2+−3+ | 0.800 | 0.311 | 6.618 | 0.010 | 2.225 | 1.210 | 4.092 |
| KPS score | <80 or ≥80 | −1.678 | 0.448 | 14.008 | 0.000 | 0.187 | 0.078 | 0.450 |
| Table VI.Associations between expression
levels of MAGE-A1, -A3 and -A11 and ki-67 labeling index. |
Table VI.
Associations between expression
levels of MAGE-A1, -A3 and -A11 and ki-67 labeling index.
| Ki-67 labeling
index | MAGE-A1
| χ2 | P-value | MAGE-A3
| χ2 | P-value | MAGE-A11
| χ2 | P-value |
|---|
| 2+/3+ | ± | 2+/3+ | ± | 2+/3+ | ± |
|---|
| <10% | 7 | 10 | 4.965 | 0.026 | 6 | 11 | 2.224 | 0.136 | 5 | 12 | 7.123 | 0.008 |
| ≥10% | 43 | 18 | | | 34 | 27 | | | 40 | 21 | | |
Discussion
CTAs are considered to be ideal targets for
immunotherapy in tumors due to their characteristic expression
pattern. The MAGE-A family, a subgroup of CTA, has been studied
widely. MAGE-As are expressed in various types of cancer, including
breast, lung, prostate and oral squamous cell carcinoma and bladder
cancer (18–21). However, information concerning the
expression of the MAGE-A family in glioma is limited and
conflicting. Jacobs et al (22) analyzed cancer-germline gene
expression, including that of MAGE-A1, -A2, -A3, -A4, -A6, -A10,
-A12 and -C2, NY-ESO-1 and GAGE-1, 2 and 8 in 50 pediatric brain
tumors (including 36 gliomas) using real-time PCR, and noted that
67% of astrocytic tumors expressed one or more cancer-germline
genes. Another study (14)
investigated the composite expression of CTA and MDA in malignant
glioma using RT-PCR and showed that the frequencies of MAGE-A3, -A1
and -A4 expression were 22, 16 and 7%, respectively. Chi et
al (23) observed that 38 and
33% of glioma tissues expressed MAGE-A1 and MAGE-A3, respectively,
at the RNA level. Sahin et al (24) reported that only 8% of glioma
specimens expressed MAGE-A3, while Saikali et al (25) demonstrated that the MAGE-A3 mRNA
expression frequency in glioblastoma multiforme was 42%. Only a few
studies have investigated MAGE-A antigens with immunohistochemistry
or western-blot analysis. Our group previously investigated the
expression of MAGE-A10 and -A11 in breast cancers and showed that
they were tumor-specific antigens and that MAGE-A11 expression was
a prognostic factor for a poor patient outcome (26). Although certain studies have
investigated the expression of MAGE-A1 and -A3 in glioma, few have
demonstrated the association between the expression levels and
prognosis or cell proliferation status. There have been no studies
on the expression of MAGE-A11 in glioma and its association with
cell proliferation status or prognosis.
In the present study, the expression levels of the
MAGE-A1, -A3 and -A11 proteins were evaluated with
immunocytochemistry in glioma specimens, using normal testis
tissues as positive controls and normal brain tissues as negative
controls. It was revealed that MAGE-A1, -A3 and -A11 were expressed
in the majority of gliomas. Furthermore, the 15 normal brain
tissues showed no expression of MAGE-A1, -A3 and -A11, which was
consistent with the CTA expression pattern. This suggested that
MAGE-A1, -A3 and -A11 may potentially be used as ideal targets in
immunotherapy for glioma (26–28).
Ki-67, a gene expressed during G1, S and G2 phases
of the cell cycle (29–31), with a peak during mitosis an absence
in the G0 phase, is often measured using MIB-1 antibody as a
labeling index for evaluating the proliferation status of numerous
types of cancer (32,33). The expression of the ki-67 protein
has been correlated with disease aggressiveness and survival time
in glioma patients (34–36). To investigate the association
between the expression of MAGE-A1, -A3 and -A11 and the prognosis
of patients with glioma, the expression of the ki-67 protein was
also observed in the same glioma specimens in the present study.
The results showed that the expression levels of MAGE-A1 and -A11
were positively correlated with the ki-67 labeling index,
suggesting that MAGE-A1 and -A11 may be involved in tumor cell
proliferation (37).
The survival analysis in the present study showed
that the pathological grade, KPS score and expression levels of
MAGE-A1 and -A11 were significantly correlated with patient
outcome, while no association was observed between MAGE-A3
expression and prognosis. The survival of patients with high
expression levels of MAGE-A1 and -A11 was significantly lower
compared with patients with low expression levels, suggesting that
MAGE-A1 and -A11 were potential factors for a poor prognosis for
glioma. Certain studies have reported an association between
MAGE-A1 and -A11 expression and tumor prognosis. Bodey et al
(13) suggested that MAGE-A1 may be
an indicator of childhood astrocytoma progression, although Grau E
et al (38) showed that the
MAGE-A1 expression was associated with a good prognosis in
neuroblastoma. Our group previously detected the expression of
MAGE-A11 in breast cancers and observed that it was a prognostic
factor for poor patient outcome (26). There have been no previous reports
concerning the prognostic significance of MAGE-A1 and -A11 in adult
glioma. In the present study, high MAGE-A1 and -A11 expression
levels in the patients with glioma were significantly correlated
with poor OS and a high ki-67 labeling index. Consequently, we
considered that MAGE-A1 and -A11 may be prognostic markers of poor
outcome in glioma patients. Additionally, in the present results,
increased pathological grades and low KPS scores were correlated
with worse outcomes, which was consistent with previous studies
(35,39).
In summary, the present preliminary study showed
that MAGE-A1, -A3 and -A11 are expressed in glioma and that MAGE-A1
and -A11 expression levels increase with the pathological grade.
The patients with high MAGE-A1 and -A11 expression levels had poor
OS and high ki-67 labeling indices. The results suggest that
MAGE-A1, -A3 and -A11 may be used as ideal targets in immunotherapy
for glioma, and that MAGE-A1 and -A11 may be potential markers of a
poor prognosis for glioma. However, the present study had a number
of limitations. The number of patients was relatively small, which
may have affected the statistical results. As it was a
retrospective study, only expression at the protein level was
detected. The prognostic role of MAGE-A1 and -A11 should be
investigated in a greater number of glioma patients and using a
greater number of methods. The mechanism responsible for MAGE-A1
and -A11 expression in tumorigenesis and biological functions
requires further evaluation.
Acknowledgements
The present study was supported by the
Natural Science Foundation of Hebei Province (No. H2012206077).
References
|
1.
|
Parney IF, Hao C and Petruk KC: Glioma
immunology and immunotherapy. Neurosurgery. 46:778–792.
2000.PubMed/NCBI
|
|
2.
|
Surawicz TS, Davis F, Freels S, Laws ER Jr
and Menck HR: Brain tumor survival: results from the National
Cancer Data Base. J Neurooncol. 40:151–160. 1998. View Article : Google Scholar : PubMed/NCBI
|
|
3.
|
Scanlan MJ, Gure AO, Jungbluth AA, Old LJ
and Chen YT: Cancer/testis antigens: an expanding family of targets
for cancer immunotherapy. Immunol Rev. 188:22–32. 2002. View Article : Google Scholar : PubMed/NCBI
|
|
4.
|
Scanlan MJ, Simpson AJ and Old LJ: The
cancer/testis genes: review, standardization, and commentary.
Cancer Immun. 4:12004.PubMed/NCBI
|
|
5.
|
Zendman AJ, Ruiter DJ and Van Muijen GN:
Cancer/testis-associated genes: identification, expression profile,
and putative function. J Cell Physiol. 194:272–288. 2003.
View Article : Google Scholar : PubMed/NCBI
|
|
6.
|
Simpson AJ, Caballero OL, Jungbluth A,
Chen YT and Old LJ: Cancer/testis antigens, gametogenesis and
cancer. Nat Rev Cancer. 5:615–625. 2005. View Article : Google Scholar : PubMed/NCBI
|
|
7.
|
Chomez P, De Backer O, Bertrand M, De
Plaen E, Boon T and Lucas S: An overview of the MAGE gene family
with the identification of all human members of the family. Cancer
Res. 61:5544–5551. 2001.PubMed/NCBI
|
|
8.
|
Sang M, Wang L, Ding C, et al:
Melanoma-associated antigen genes - an update. Cancer Lett.
302:85–90. 2011. View Article : Google Scholar : PubMed/NCBI
|
|
9.
|
De Plaen E, Arden K, Traversari C, et al:
Structure, chromosomal localization, and expression of 12 genes of
the MAGE family. Immunogenetics. 40:360–369. 1994.PubMed/NCBI
|
|
10.
|
Rogner UC, Wilke K, Steck E, Korn B and
Poustka A: The melanoma antigen gene (MAGE) family is clustered in
the chromosomal band Xq28. Genomics. 29:725–731. 1995. View Article : Google Scholar : PubMed/NCBI
|
|
11.
|
van der Bruggen P, Traversari C, Chomez P,
et al: A gene encoding an antigen recognized by cytolytic T
lymphocytes on a human melanoma. Science. 254:1643–1647. 1991.
|
|
12.
|
Kuramoto T: Detection of MAGE-1 tumor
antigen in brain tumor. Kurume Med J. 44:43–51. 1997. View Article : Google Scholar : PubMed/NCBI
|
|
13.
|
Bodey B, Siegel SE and Kaiser HE: MAGE-1,
a cancer/testis-antigen, expression in childhood astrocytomas as an
indicator of tumor progression. In Vivo. 16:583–588.
2002.PubMed/NCBI
|
|
14.
|
Syed ON, Mandigo CE, Killory BD, Canoll P
and Bruce JN: Cancer-testis and melanocyte-differentiation antigen
expression in malignant glioma and meningioma. J Clin Neurosci.
19:1016–1021. 2012. View Article : Google Scholar : PubMed/NCBI
|
|
15.
|
Kleihues P, Louis DN, Scheithauer BW, et
al: The WHO classification of tumours of the nervous system.
JNeuropathol Exp Neurol. 61:215–225. 2002.
|
|
16.
|
Matos LL, Stabenow E, Tavares MR, Ferraz
AR, Capelozzi VL and Pinhal MA: Immunohistochemistry quantification
by a digital computer-assisted method compared to semiquantitative
analysis. Clinics (Sao Paulo). 61:417–424. 2006. View Article : Google Scholar
|
|
17.
|
Wild PJ, Kunz-Schughart LA, Stoehr R, et
al: High-throughput tissue microarray analysis of COX2 expression
in urinary bladder cancer. Int J Oncol. 27:385–391. 2005.PubMed/NCBI
|
|
18.
|
Ries J, Mollaoglu N, Toyoshima T, et al: A
novel multiple-marker method for the early diagnosis of oral
squamous cell carcinoma. Dis Markers. 27:75–84. 2009. View Article : Google Scholar : PubMed/NCBI
|
|
19.
|
Jang SJ, Soria JC, Wang L, et al:
Activation of melanoma antigen tumor antigens occurs early in lung
carcinogenesis. Cancer Res. 61:7959–7963. 2001.PubMed/NCBI
|
|
20.
|
Bergeron A, Picard V, LaRue H, et al: High
frequency of MAGE-A4 and MAGE-A9 expression in high-risk bladder
cancer. Int J Cancer. 125:1365–1371. 2009. View Article : Google Scholar : PubMed/NCBI
|
|
21.
|
Matković B, Juretić A, Spagnoli GC, et al:
Expression of MAGE-A and NY-ESO-1 cancer/testis antigens in
medullary breast cancer: retrospective immunohistochemical study.
Croat Med J. 52:171–177. 2011.PubMed/NCBI
|
|
22.
|
Jacobs JF, Grauer OM, Brasseur F, et al:
Selective cancer-germline gene expression in pediatric brain
tumors. J Neurooncol. 88:273–280. 2008. View Article : Google Scholar : PubMed/NCBI
|
|
23.
|
Chi DD, Merchant RE, Rand R, et al:
Molecular detection of tumor-associated antigens shared by human
cutaneous melanomas and gliomas. Am J Pathol. 150:2143–2152.
1997.PubMed/NCBI
|
|
24.
|
Sahin U, Türeci O, Schmitt H, et al: Human
neoplasms elicit multiple specific immune responses in the
autologous host. Proc Natl Acad Sci USA. 92:11810–11813. 1995.
View Article : Google Scholar : PubMed/NCBI
|
|
25.
|
Saikali S, Avril T, Collet B, et al:
Expression of nine tumour antigens in a series of human
glioblastoma multiforme: interest of EGFRvIII, IL-13Ralpha2, gp100
and TRP-2 for immunotherapy. J Neurooncol. 81:139–148. 2007.
View Article : Google Scholar : PubMed/NCBI
|
|
26.
|
Lian Y, Sang M, Ding C, et al: Expressions
of MAGE-A10 and MAGE-A11 in breast cancers and their prognostic
significance: a retrospective clinical study. J Cancer Res Clin
Oncol. 138:519–527. 2012. View Article : Google Scholar : PubMed/NCBI
|
|
27.
|
Bu N, Wu H, Sun B, et al: Exosome-loaded
dendritic cells elicit tumor-specific CD8+ cytotoxic T cells in
patients with glioma. J Neurooncol. 104:659–667. 2011.PubMed/NCBI
|
|
28.
|
Phuphanich S, Wheeler CJ, Rudnick JD, et
al: Phase I trial of a multi-epitope-pulsed dendritic cell vaccine
for patients with newly diagnosed glioblastoma. Cancer Immunol
Immunother. 62:125–135. 2012. View Article : Google Scholar : PubMed/NCBI
|
|
29.
|
Schvartzman JM, Sotillo R and Benezra R:
Mitotic chromosomal instability and cancer: mouse modelling of the
human disease. Nat Rev Cancer. 10:102–115. 2010. View Article : Google Scholar : PubMed/NCBI
|
|
30.
|
Weigel MT and Dowsett M: Current and
emerging biomarkers in breast cancer: prognosis and prediction.
Endocr Relat Cancer. 17:R245–R262. 2010. View Article : Google Scholar : PubMed/NCBI
|
|
31.
|
Rao CV, Yamada HY, Yao Y and Dai W:
Enhanced genomic instabilities caused by deregulated microtubule
dynamics and chromosome segregation: a perspective from genetic
studies in mice. Carcinogenesis. 30:1469–1474. 2009. View Article : Google Scholar : PubMed/NCBI
|
|
32.
|
Yoshida Y, Nakada M, Harada T, et al: The
expression level of sphingosine-1-phosphate receptor type 1 is
related to MIB-1 labeling index and predicts survival of
glioblastoma patients. J Neurooncol. 98:41–47. 2010. View Article : Google Scholar : PubMed/NCBI
|
|
33.
|
Yerushalmi R, Woods R, Ravdin PM, Hayes MM
and Gelmon KA: Ki67 in breast cancer: prognostic and predictive
potential. Lancet Oncol. 11:174–183. 2010. View Article : Google Scholar : PubMed/NCBI
|
|
34.
|
Torp SH: Diagnostic and prognostic role of
Ki67 immunostaining in human astrocytomas using four different
antibodies. Clin Neuropathol. 21:252–257. 2002.PubMed/NCBI
|
|
35.
|
Johannessen AL and Torp SH: The clinical
value of Ki-67/MIB-1 labeling index in human astrocytomas. Pathol
Oncol Res. 12:143–147. 2006. View Article : Google Scholar : PubMed/NCBI
|
|
36.
|
Paulus W: GFAP, Ki67 and IDH1: perhaps the
golden triad of glioma immunohistochemistry. Acta Neuropathol.
118:603–604. 2009. View Article : Google Scholar : PubMed/NCBI
|
|
37.
|
Xia LP, Xu M, Chen Y and Shao WW:
Expression of MAGE-A11 in breast cancer tissues and its effects on
the proliferation of breast cancer cells. Mol Med Rep. 7:254–258.
2012.PubMed/NCBI
|
|
38.
|
Grau E, Oltra S, Martínez F, et al:
MAGE-A1 expression is associated with good prognosis in
neuroblastoma tumors. J Cancer Res Clin Oncol. 135:523–531. 2009.
View Article : Google Scholar : PubMed/NCBI
|
|
39.
|
Dellaretti M, Reyns N, Touzet G, et al:
Diffuse brainstem glioma: prognostic factors. J Neurosurg.
117:810–814. 2012. View Article : Google Scholar : PubMed/NCBI
|