Introduction
Acute leukemia (AL), resulting from the clonal
expansion of blasts in bone marrow, is considered to be a
clinically, morphologically and genetically heterogeneous disease
(1). The rate of complete remission
(CR), achieved by intensive chemotherapy, is 50–80% and 80–90% in
adult patients with acute myeloid leukemia (AML) and acute
lymphoblastic leukemia (ALL), respectively. However, the relapse
rate is >60% (2–5), which is the major cause of treatment
failure in affected patients. The detection and eradication of
minimal residual disease (MRD) is a key issue that merits a
controlled clinical evaluation, including optimizing the timing of
treatment and guiding decisions with regard to donor lymphocyte
infusion post-transplant. Thus, the measure of MRD promises to be
an efficient tool for predicting and increasing the survival
outcome in AL patients (6–8).
Monitoring MRD levels in patients with AL at various
time-points during therapy requires the availability of
determination markers. At present, multiparameter flow-cytometry
(MFC), polymerase chain reaction (PCR) and fluorescence in
situ hybridization are useful methods for the detection of MRD
in patients with AL. However, the applicability of PCR is
restricted to AL with leukemia-specific molecular targets,
including promyelocytic leukemia/retinoic acid receptor-α
(PML/RARα), FLT3 and T cell receptor (9–12). The
widespread applicability of MFC is also complicated by the lack of
standardized procedures and a leukemia-associated immunophenotype
at the time of diagnosis. Currently, the diagnostic methods
mentioned previously are also performed during bone marrow
analysis, and patients should undergo bone marrow aspiration under
local anesthesia prior to the analysis, which is an invasive and
time-consuming procedure. Therefore, the identification of new
leukemia markers that are easily detectable and stably expressed in
a large proportion of AL cases should simplify the application of
MRD studies, aid in extending the benefit to all patients and
possibly enhance the sensitivity of MRD detection.
The benefits of serum examination are that it is a
minimally invasive and low cost procedure and that serum is easy to
acquire and process. Serum protein or peptide levels under a
disease state differ from the levels that are present in a healthy
state. Thus, serum is a good specimen to be used in disease marker
studies. Serum proteomics via the identification of new
proteins/peptides have already been successfully performed for
tumor diagnosis (13–17). In the field of hematology, the use
of the matrix-assisted laser desorption/ionization time of flight
mass spectrometry (MALDI-TOF MS) method and complement C3f-desArg
and its derivatives has been identified to correlate with MRD
levels in patients with PML/RARα-positive acute promyeloid leukemia
(APL) (18). These results indicate
that human serum peptides, particularly those of low molecular
weights, contain important information for tumor diagnosis.
The present study used MALDI-TOF MS analysis to
detect specific serum peptidomic biomarkers in order to
discriminate between AL patients with various degrees of remission.
The specific peptide that may be used to monitor MRD in patients
with AL was also identified and its prognostic role was
evaluated.
Materials and methods
Patients and blood sample
preparation
A total of 123 patients with AL and 49 healthy
controls were recruited through The First Hospital of Jilin
University (Changchun, Jilin, China) between December 2009 and June
2010. The diagnosis of the patients was based on morphology,
immunophenotyping, cytogenetics and molecular biology. Among these
AL patients, 40 were newly diagnosed, 42 achieved hematological CR
(HCR), including 17 M2/M3 patients with cytogenetic abnormalities
who reached cytogenetic remission following chemotherapy and 25
patients who achieved consistent remission, including 18 M2/M3 with
molecular remission (MR). The remaining AML/ALL patients without
cytogenetic/genetic signatures achieved CR for more than one year.
A total of 30 patients with newly-diagnosed solid tumors, including
lung, breast, liver and colon cancer, and a further 35 patients
with benign hematological disorders, including anemia and
idiopathic thrombocytopenia (ITP), were also analyzed. The healthy
controls were volunteers who underwent a routine physical
examination and were confirmed to be in a healthy state by The
First Hospital of Jilin University. The clinical characteristics of
the patients with AL and the control group are shown in Tables I and II, respectively. Approval for this study
was obtained from the Human Subject Committee of The First Hospital
of Jilin University, and all patients and healthy controls provided
their informed consent.
 | Table IClinical characteristics of patients
with AL. |
Table I
Clinical characteristics of patients
with AL.
| Newly-diagnosed
AL | AL-HCR | AL-MR | |
|---|
|
|
|
| |
|---|
| Acute leukemia | Training set | Test set | Training set | Test set | Training set | Test set | Relapse |
|---|
| Male:female, n | 14:10 | 8:8 | 14:12 | 9:7 | 7:8 | 4:6 | 8:8 |
| Age, mean (range),
years | 37.9 (15–73) | 44.6 (18–75) | 36.4 (15–56) | 33.3 (11–62) | 34.8 (13–55) | 37.9 (23–55) | 33.8 (15–64) |
| WBC,
×109 | 27.4 | 23.4 | 2.86 | 5.4 | 4.5 | 6.2 | 40.0 |
| Mean, range | 1.2–166.6 | 0.5–70 | 0.1–5.7 | 0.5–17.3 | 1.3–7.6 | 3.7–11.2 | 1.3–197.8 |
| FAB classification,
n |
| AML | 17 | 13 | 17 | 11 | 13 | 8 | 7 |
| ALL | 7 | 3 | 9 | 5 | 2 | 2 | 9 |
| Cytogenetic
abnormalities, n |
| t(15:17) | 6 | 2 | 3 | 0 | 0 | 0 | 3 |
| t(8:21) | 3 | 4 | 0 | 1 | 0 | 0 | 0 |
|
inv(16)/t(16;16) | 0 | 0 | 0 | 0 | 0 | 0 | 0 |
| t(9;22) | 0 | 0 | 0 | 0 | 0 | 0 | 3 |
| Complex
karyotype | 0 | 2 | 0 | 0 | 0 | 0 | 0 |
| Other
karyotype | 7 | 5 | 0 | 0 | 0 | 0 | 0 |
| Normal
karyotype | 8 | 3 | 20 | 14 | 15 | 10 | 2 |
| Not
determined | 0 | 0 | 3 | 1 | 0 | 0 | 8 |
| Gene abnormalities,
n |
| PML/RARα | 6 | 3 | 7 | 4 | 0 | 0 | 4 |
| AML/ETO | 3 | 6 | 4 | 2 | 0 | 0 | 0 |
| BCR/ABL | 0 | 2 | 0 | 0 | 0 | 0 | 3 |
| IgH or TCR | 1 | 0 | 0 | 0 | 0 | 0 | 0 |
| Other gene | 2 | 2 | 0 | 0 | 0 | 0 | 0 |
| Not
determined | 12 | 3 | 15 | 10 | 15 | 10 | 9 |
| Table IIClinical characteristics of the
control groups. |
Table II
Clinical characteristics of the
control groups.
| A, Healthy
controls |
|---|
|
|---|
| Characteristic | Training set | Test set |
|---|
| Male:female,
n | 16:13 | 9:11 |
| Mean age, years
(range) | 39.6 (15–65) | 39.2 (23–73) |
|
| B, Benign
hematological disorders |
|
| Characteristic | Anemia | ITP | PNH | Aplastic
anemia |
|
| Male:female,
n | 4:7 | 4:7 | 3:1 | 4:5 |
| Mean age, years
(range) | 41.5 (12–78) | 42.4 (14–75) | 47.5 (35–63) | 52.6 (43–68) |
|
| C, Solid tumor |
|
| Characteristic | Liver | Breast | Lung | Colon |
|
| Male:female,
n | 5:1 | 0:9 | 5:3 | 3:4 |
| Mean age, years
(range) | 48.7 (18–61) | 51.3 (33–77) | 51.8 (35–62) | 53.0 (48–60) |
The serum samples were collected, processed and
stored according to standard procedure. Briefly, the serum samples
were allowed to clot or sediment at room temperature for 2 h and
were then centrifuged at 376 × g for 15 min. The samples were
divided into aliquots of 50 μl and stored at −80°C until use. The
sera from 10 patients with AL were pooled and analyzed using
MALDI-TOF MS. Six within-run assays and six between-run assays were
performed to assess the deviation.
Serum pretreatment using magnetic
beads
Copper-chelated magnetic beads and solutions were
obtained from the National Center of Biomedical Analysis (Beijing,
China) to extract the peptides from the sera. The samples were
purified and isolated through binding, washing and elution
processes. Briefly, 5 μl beads and 50 μl binding solution were
mixed with 5 μl serum. Following a 10-min incubation period, the
beads were washed three times using 100 μl washing solution. The
bound peptides were then eluted in 20 μl elution solution. A 1 μl
elute was mixed with 1 μl CHCA matrix solution, spotted onto target
spots (Bruker Daltonik, Bremen, Germany) and dried at room
temperature. The peptide calibration standard in the same matrix
was applied to the target spots for an external calibration of the
instrument. The samples proceeded into MALDI-TOF MS equipped with a
pulsed ion extraction ion source.
MALDI-TOF MS pattern-recognition
analysis
All the spectra were analyzed using FlexAnalysis 2.4
software (Bruker Daltonik) to determine the peak m/z values and the
intensities in the mass range of 1,000–10,000 Da. To align the
spectra, a mass shift of ≤0.1% was determined. The intensities of
all the peaks were then normalized to the total m/z ion current of
each spectrum using in-house MatchPeaks software and the relative
intensity was calculated. P-values for each peak were obtained for
their discriminatory power. The support vector machine (SVM) method
is an effective algorithm for gene selection and cancer
classification and was consequently used for class prediction
(http://biosunms.sourceforge.net)
(19). The parameters in the
Gaussian kernel function were optimized using the grid search
approach (20). The models of the
training set were built using a selected number of peaks and a
five-fold cross-validation scheme.
Peptide sequence
The identification of peptide m/z 4625 was performed
using a nano-liquid chromatography-electrospray ionization-tandem
(LC/ESI) MS system. The peptide solutions were loaded onto a C18
trap column (nanoACQUITY; Waters, Milford, MA, USA) at a flow rate
of 400 μl/min. Mobile phases A (5% acetonitrile and 0.1% formic
acid) and B (95% acetonitrile and 0.1% formic acid) were used for
the analytical columns. The gradient elution profile was
5%B-50%B-80%B-80%B-5%B-5%B in 100 min. The eight most intense
mono-isotope ions were precursors for collision-induced
dissociation. MS/MS spectra were limited to two consecutive scans
per precursor ion followed by 60 sec of dynamic exclusion.
Statistical analysis
The peaks were evaluated using the P-values from a
two-tailed t-test in various groups for building the model. The
sensitivity, specificity and the area under the receiver operating
characteristic (ROC) curve (AUC) were calculated using the
validation set data for the three models obtained from the training
data. The overall survival (OS) between the two groups with peptide
expression differences was estimated using a Kaplan-Meier log rank
survival analysis. P<0.05 was considered to indicate a
statistically significant difference.
Results
Stability and reproducibility of the
MALDI-TOF MS spectra
For the reproducibility experiment, a pool of sera
from 10 patients with AL was analyzed using the MALDI-TOF MS
instrument and used to perform six within-run assays and six
between-run assays to observe the deviation. The mean coefficient
of variation (CV) of the within- and between-run assays was 8.98%
(range, 7.5–11.0%) and 18.2% (range, 13.9–22.3%), respectively,
indicating that the analysis of the MALDI-TOF MS spectra was stable
and reproducible. The results are shown in Table III.
| Table IIIReproducibility of mass spectra by
magnetic beads and MALDI-TOF MS analysis. |
Table III
Reproducibility of mass spectra by
magnetic beads and MALDI-TOF MS analysis.
| Within-run
assays | Between-run
assays |
|---|
|
|
|
|---|
| m/z | MRI, % | CV, % | MRI, % | CV, % |
|---|
| 2081.88 | 4.7 | 9.1 | 5.1 | 13.9 |
| 2861.24 | 0.8 | 11.0 | 0.8 | 17.7 |
| 3157.64 | 1.8 | 8.4 | 1.5 | 18.0 |
| 3240.01 | 0.7 | 7.5 | 0.6 | 15.7 |
| 4209.03 | 2.3 | 8.9 | 2.5 | 22.0 |
| 6633.21 | 2.4 | 9.0 | 2.3 | 22.3 |
Screening peptide patterns to distinguish
between AL patients with various degrees of remission
The serum samples from 123 AL patients and 49
healthy controls were detected for peptide profiling using an
MALDI-TOF MS analysis. The samples from 65 AL patients and 29
healthy controls were assigned randomly to a training set and the
remaining samples were used as a testing set. Using Flex Analysis
2.4 software (Bruker Daltonics, Bremen, Germany), 249 peaks were
discovered in all the training set samples. To identify their
discriminatory power, the P-value from each peak was obtained by a
two-tailed t-test. The candidate peaks were selected for model
building, and 26 peaks were observed to be significantly different
between the AL patients and healthy controls (P<0.0001). The SVM
algorithm was utilized to generate models and to discriminate the
selected 26 peaks as the optimal combination. The detection value
of the model was validated using 58 AL patients and 20 healthy
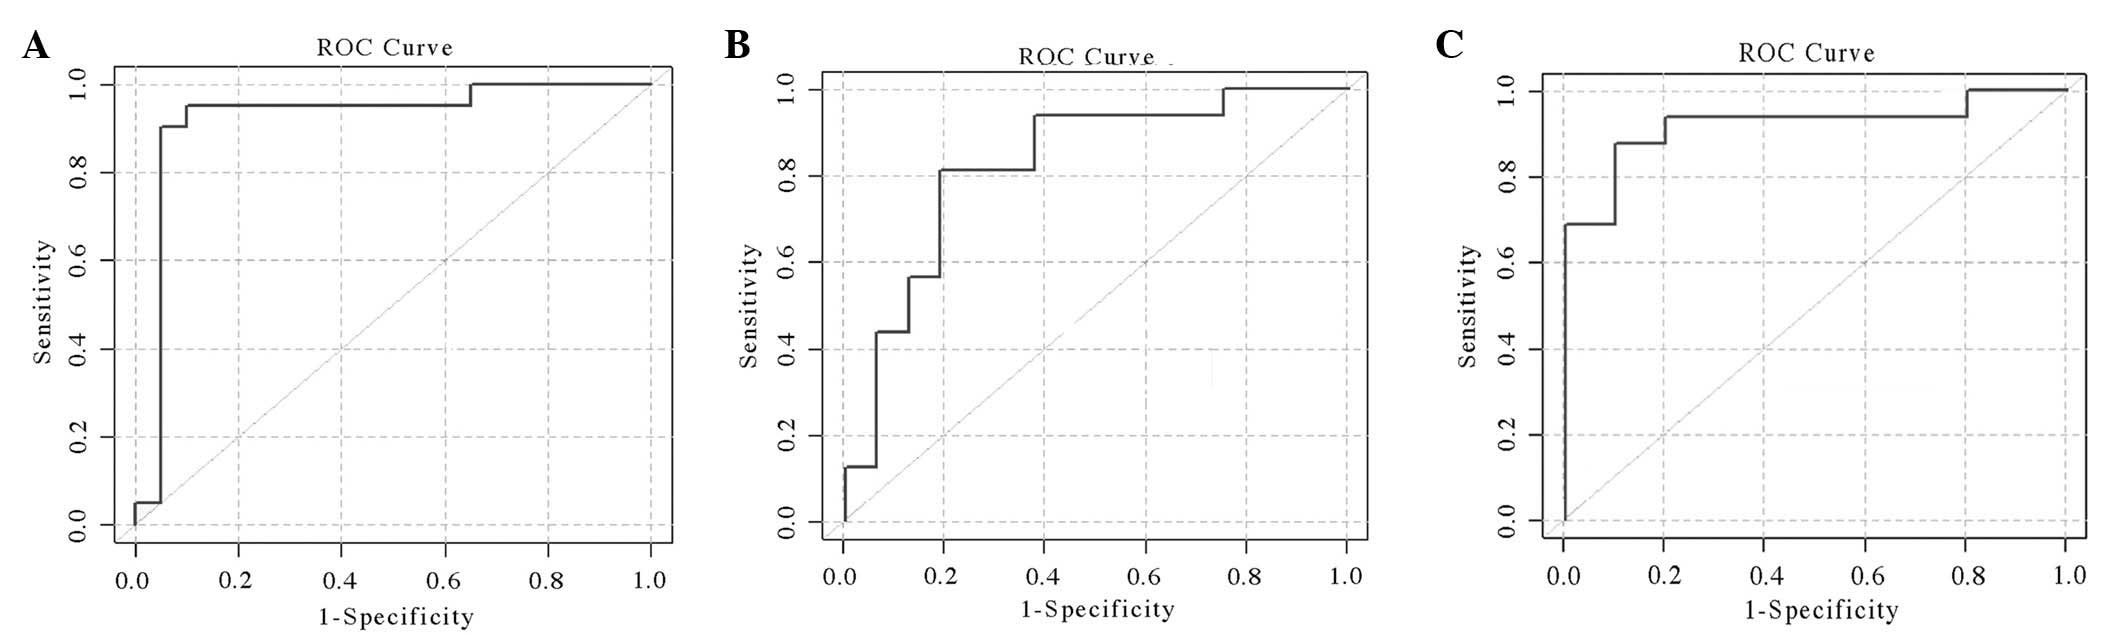
controls as the test set. This model distinguished the AL patients
from the healthy controls with a sensitivity of 90%, a specificity
of 95% and an AUC of 0.921 (Fig.
1A).
As demonstrated in Fig.
1B and C, two patterns of peaks were selected for model
building, including 40 newly-diagnosed AL patients, 42 patients
with AL-HCR and 25 patients with deep remission (consistent
remission for more than one year), which included 18 M2/M3 with
molecular remission (MR). A total of 11 peaks (P<0.05) were used
to build the model to distinguish between newly-diagnosed AL and
AL-HCR patients, which showed the best discriminating power with a
sensitivity of 81.25%, specificity of 81.25% and an AUC of 0.824.
In the AL-CR and AL-MR models, another 11 peaks (P<0.05) were
used. The results of the sensitivity and specificity were 87.5 and
90%, respectively and the AUC was 0.919.
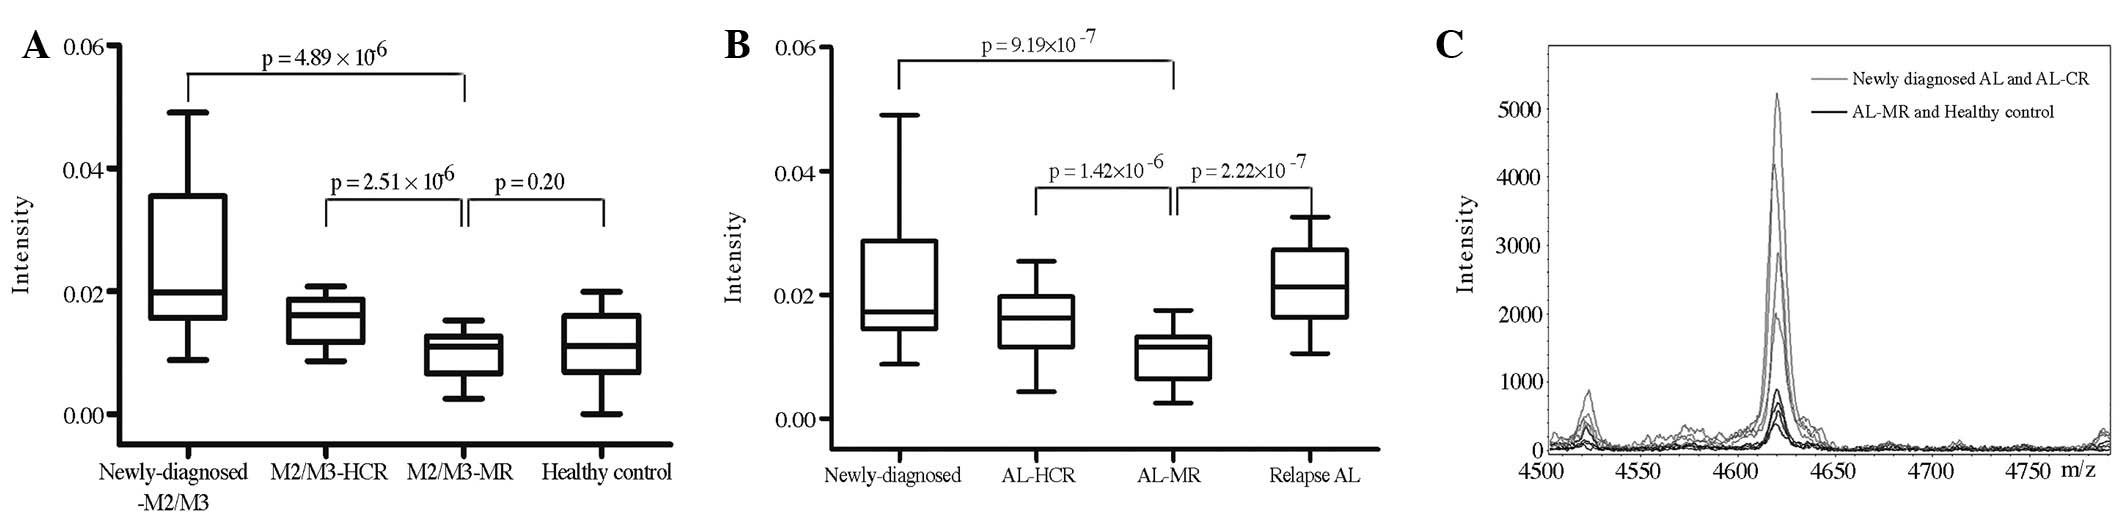
Screening differential peaks for the
evaluation of the MRD
Serum peptides from 18 M2 patients with
AML/eight-twenty-one (ETO) and 35 M3 patients with PML/RARα were
evaluated. A significantly different peak with m/z 4625 was
identified and the intensity gradually decreased as the remission
degree increased. In the healthy controls, the intensity level of
m/z 4625 was similar to that of the M2/M3-MR group (Fig. 2A). Notably, for all types of AL
patients, the change in m/z 4625 intensity was correlated with the
MR/M3 group. Furthermore, the intensity level of m/z 4625 in the
relapse group was significantly higher than that of the AL-MR
group, including patients in deep remission and M2/M3-MR. There was
no difference between the newly-diagnosed AL and relapse AL groups
(Fig 2B) or between the
newly-diagnosed AL patients and the patients with HCR (Fig. 2C). Among these patients, the
intensity level of m/z 4625 in one patient with M1 in HCR was
increased. The patient was subsequently followed up and the serum
was examined every month. The intensity of the m/z 4625 peak
continued to increase and the patient relapsed after three months,
with the leukemia cells accounting for 5% of the bone marrow.
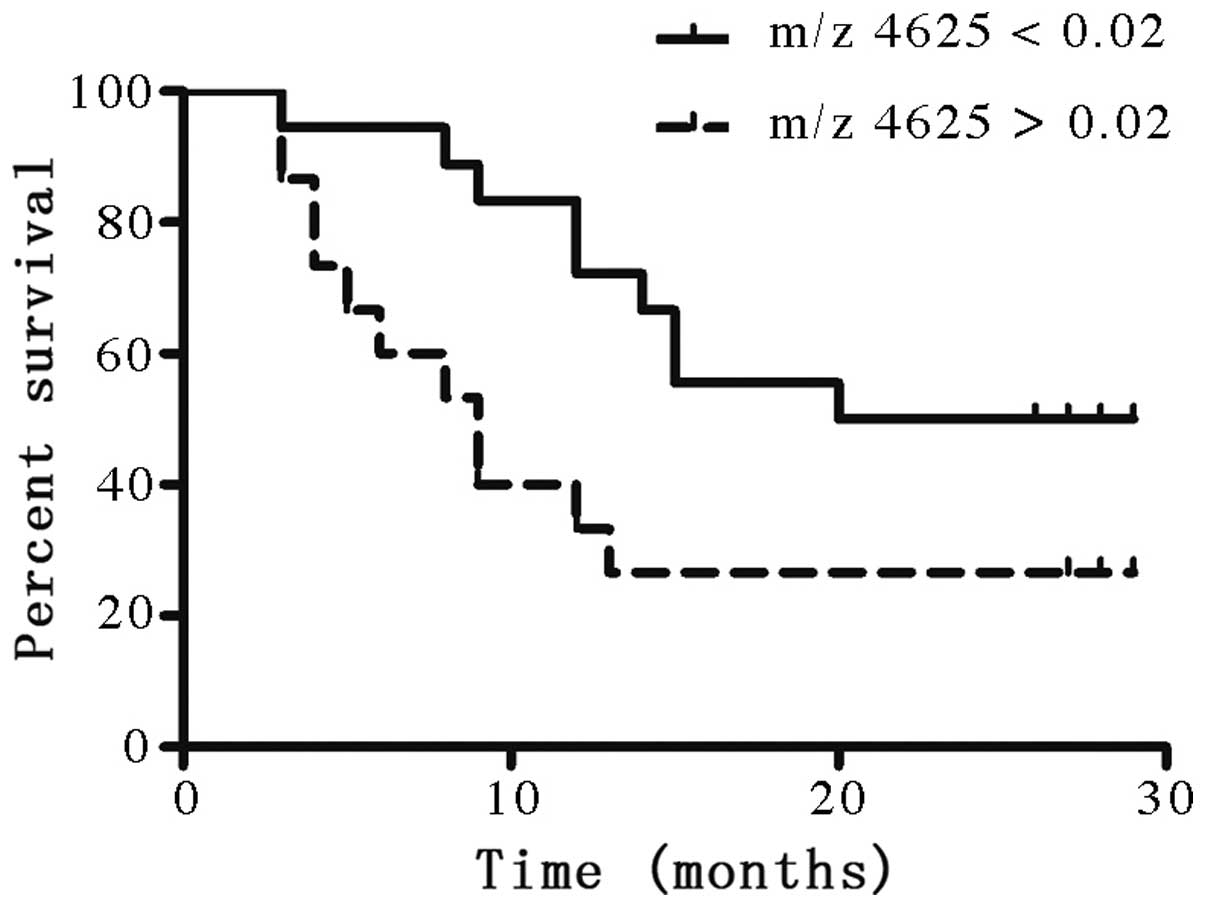
Prognostic value of the m/z 4625
peak
The second aim of identifying a marker for MRD
assessment was to evaluate its role in predicting prognosis. A
statistical analysis of the m/z 4625 peak intensity was performed
and the peak was observed to be significantly correlated with the
prognosis. A total of 33 newly-diagnosed patients possessed
complete records. The clinical characteristics of these patients
are shown in Table IV. The median
follow-up interval was 16 months (range, 3–29 months). The patients
were divided into two groups according the intensity of the m/z
4625 peak: Group A displayed an intensity of <0.02 (18 patients)
and group B displayed an intensity of >0.02 (15 patients). The
features between the two groups were comparable, with the exception
of the intensity of the peak. The subjects with intensities of
>0.02 showed a poorer OS outcome compared with those with m/z
4625 intensities of <0.02 (P=0.042; Fig. 3).
| Table IVClinical characteristics of patients
with newly-diagnosed AL who had complete records. |
Table IV
Clinical characteristics of patients
with newly-diagnosed AL who had complete records.
| Clinical
characteristics | Group A (n=18) | Group B (n=15) |
|---|
| Median age, years
(range) | 36 (17–73) | 42 (17–75) |
| Gender ratio,
M/F | 11/7 | 7/8 |
| FAB no. (%) |
| M2 | 6 (33.3) | 4 (26.7) |
| M3 | 5 (27.8) | 5 (33.3) |
| M4 | 1 (0.06) | 0 |
| M5 | 0 | 2 (13.3) |
| ALL | 6 (33.3) | 4 (26.7) |
| Leukocytes
>30g/l, n (%) | 6 (33.3) | 6 (40.0) |
| 2-year survival, n
(%) | 9 (50.0) | 4 (26.7) |
| Succumbed, n | 9 | 11 |
| Median survival,
months | 12 | 7 |
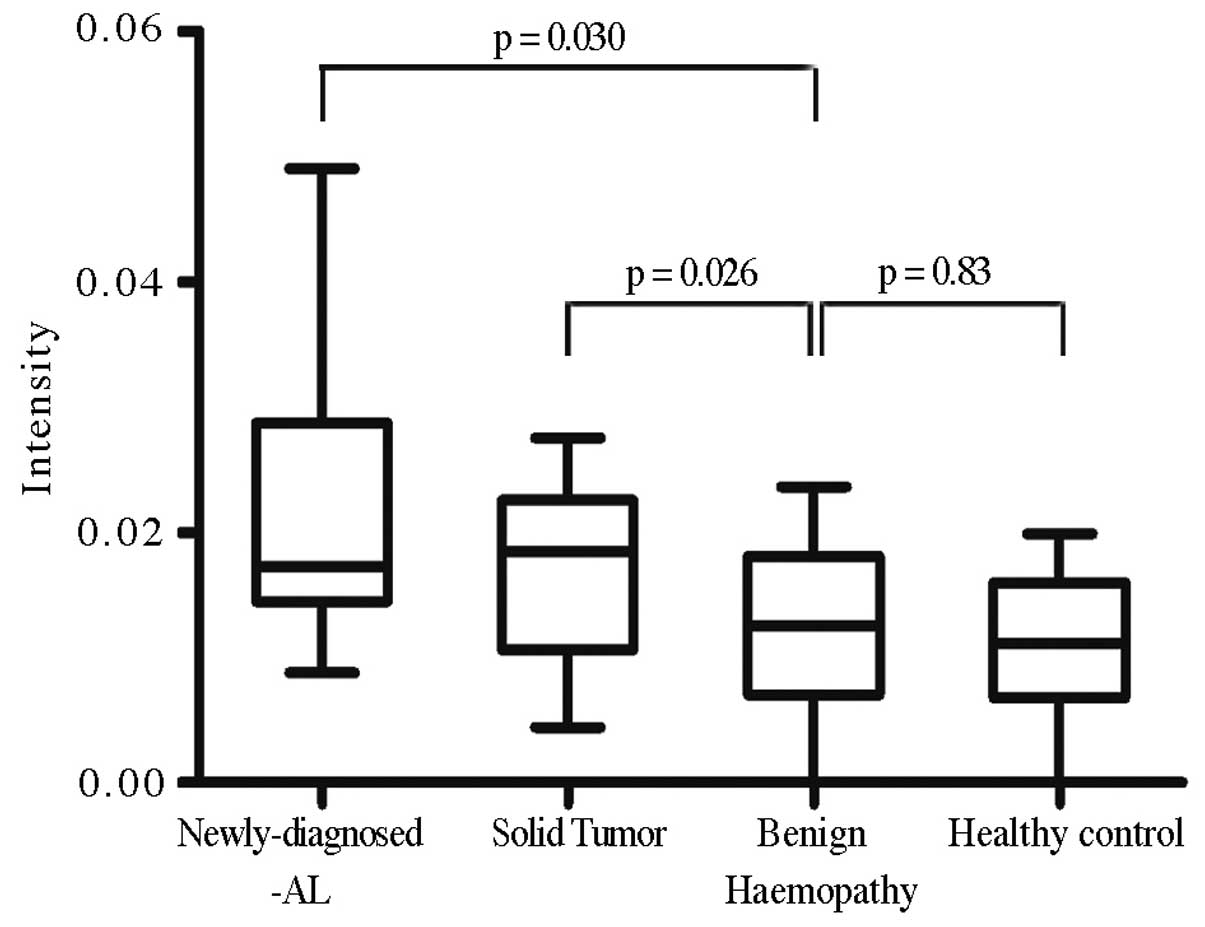
Disease specificity of the m/z 4625
peak
The intensity of the m/z 4625 peak in the sera of
patients with solid tumors and benign hematological disorders was
analyzed to confirm whether the peak was restricted to AL patients
(Fig. 4). The intensity of m/z 4625
was significantly higher in the malignant diseases, particularly in
the AL patients (P=0.014), whereas the level of m/z 4625 intensity
in the benign hematological disorders were similar to those of the
healthy controls (P=0.587).
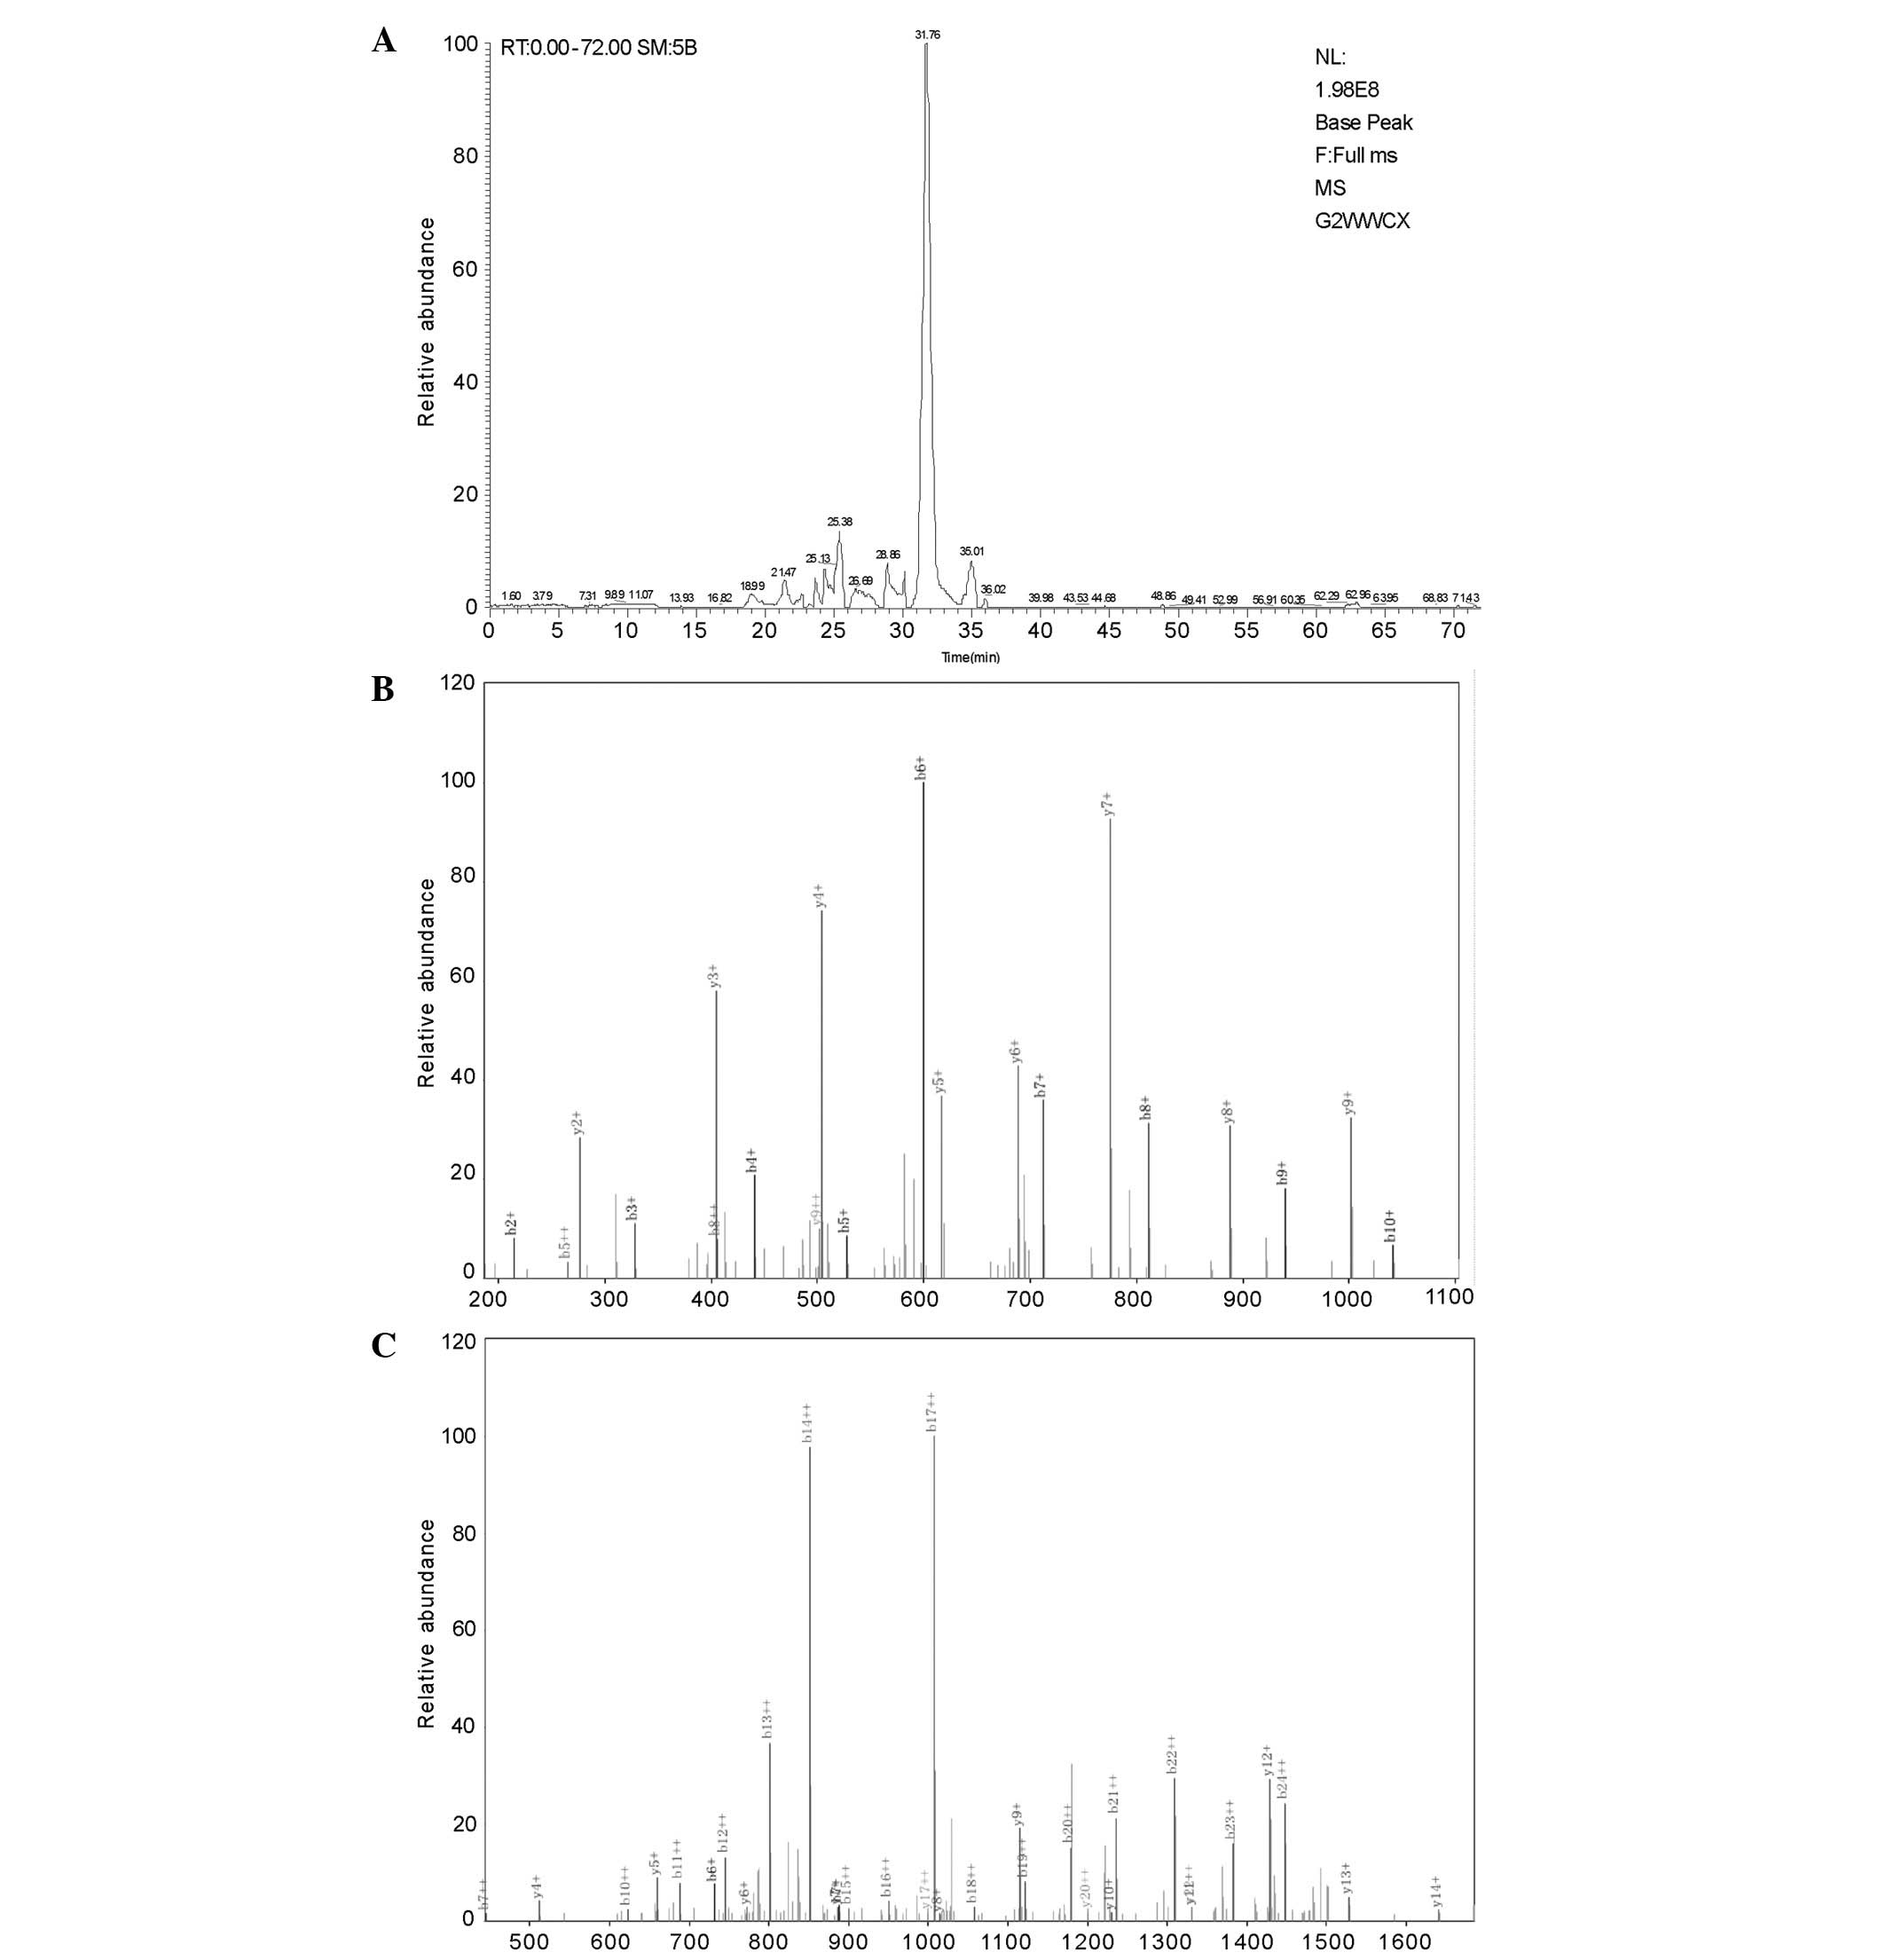
Serum peptide identification
Using nano-LC/ESI-MS detection, the peptide sequence
of 4625 m/z was identified as SAL
VETRTIVRFNRPFLMIIVPTDTQNIFFMSKVTNPKQA. A sequence search using the
Bioworks Browser 3.3.1 SP1 (Thermo Fisher Scientific, Bremen,
Germany) in the International Protein Index database, identified
the peptide as a partial fragment of the α-1-antichymotrypsin
precursor, SERPINA3 (Fig. 5).
Discussion
Markers for the detection of the MRD and the
prediction of the prognosis of AL play a crucial role in the
determination of the treatment regimen and in prolonging the
survival of patients. The present study used MALDI-TOF MS to
generate profiles of the serum peptides.
The results revealed that the technique system set
up in the present study was stable and reproducible. The SVM
algorithm was used to distinguish AL patients from healthy controls
with a sensitivity of 90% and a specificity of 95%. The peptide
pattern was also able to discriminate between AL patients with
various degrees of remission. There was a good concordance between
the results of this method and conventional methods. These results
demonstrate that the serum peptide pattern may reflect the
pathological state of the disease and implicate its role in
monitoring the MRD of AL.
In the present study, one of the most significantly
different peaks with m/z 4625 was identified. The intensity of the
peak gradually decreased as the degree of remission increased. In
the healthy controls, the intensity of m/z 4625 was similar to that
of the AL-MR group. The intensity in the relapse group was
significantly higher than that in the AL-MR group, and no
difference was observed between the newly-diagnosed and relapsed AL
groups. The intensity of the peak in one patient with M1 in HCR was
dramatically increased and this patient eventually relapsed within
three months. The results indicated that this technique widened the
application of MRD detection in AL patients without molecular
markers. APL patients in MR showed an increase in the intensity of
the peak, which was detected for several consecutive times with
various intervals and has been followed up closely since then. It
appears that this technique was more sensitive than quantitative
PCR.
The intensity of the m/z 4625 peak was observed to
significantly correlate with the prognosis of the disease. The
patients with a high intensity of the peak at diagnosis displayed a
poor prognosis compared with those in the low-intensity group
(2-year survival rate 50% vs. 26.7%), implying that the intensity
of the peak functions as not only an MRD marker, but also as a
prognostic marker. The role of m/z 4625 in prognostic prediction
requires further investigation in distinct subtypes of AL.
The sera from patients with solid tumors and benign
hematological disorders was analyzed to confirm whether the high
intensity of the peak with m/z 4625 was restricted to AL. The
intensity of m/z 4625 was significantly higher in malignant
diseases, including the solid tumors and particularly in AL
(P<0.05). The intensity in the benign hematological disorders
was the same as that in the healthy controls, indicating that the
m/z 4625 serum peptide may also be used as a diagnostic marker for
malignant diseases.
To identify the m/z 4625 peptide, sequencing was
performed using nano-LC/ESI-MS/MS, and the peptide was identified
as a fragment of SERPINA3. SERPINA3 is an acute phase protein that
is produced in the liver, and the concentration may rise during
acute and chronic inflammation (21). SERPINA3 also exhibits pro-apoptotic
activity (22). Kloth et
al(23) identified that high
SERPINA3 expression correlated significantly with a poor OS in
cervical carcinoma using immunohistochemical analysis. In addition,
SERPINA3 has been identified to be upregulated in sera from thyroid
papillary carcinoma and prostate cancers (24,25).
SERPINA3 is involved in promoting the invasion and metastasis of
malignant melanomas and cell lines, where it may have a role in
regulating apoptosis and invasiveness (26).
In conclusion, the present study indicates that the
approach reported here may identify new markers for minimally
invasive, fast, universal and sensitive MRD monitoring in AL. The
present approach also highlighted the potential of serum peptide
alterations as new and useful markers to predict the prognosis of
AL patients. Although additional studies are required to draw
definite conclusions, the alterations of serum peptide levels may
offer an improved understanding of the mechanism involved in the
development of AL. Studies aimed at identifying the possible origin
of the peptide would be the next investigations to be
undertaken.
Acknowledgements
This study was supported by grants from the National
Natural Science Foundation for Young Scholars (no. 30901702), the
Program for Distinguished Scholars and Innovative Research Team in
Jilin Province (no. 20111807) and the Foundation for Distinguished
Young Scholars in Jilin University (no. 201005001).
Abbreviations:
|
AL
|
acute leukemia
|
|
CR
|
complete remission
|
|
AML
|
acute myeloid leukemia
|
|
ALL
|
acute lymphoblastic leukemia
|
|
MRD
|
minimal residual disease
|
|
MALDI-TOF MS
|
matrix-assisted laser
desorption/ionization-time of flight mass spectrometry
|
|
PCR
|
polymerase chain reaction
|
|
MFC
|
multiparameter flow cytometry
|
|
APL
|
acute promyeloid leukemia
|
|
MR
|
molecular remission
|
|
ROC
|
receiver operating characteristic
|
|
AUC
|
area under the ROC curve
|
|
OS
|
overall survival
|
References
|
1
|
Falini B, Tiacci E, Martelli MP, Ascani S
and Pileri SA: Acute myeloid leukemia (AML) and related precursor
neoplasms. WHO Classification of Tumors of Haematopoietic and
Lymphoid Tissues. Swerdlow SH, Campo E, Harris NL, Jaffe ES, Pileri
SA, Stein H, et al: 4th edition. IARC; Lyon, France: pp. 109–147.
2008
|
|
2
|
Pui CH, Relling MV and Downing JR: Acute
lymphoblastic leukemia. N Engl J Med. 350:1535–1548. 2004.
View Article : Google Scholar : PubMed/NCBI
|
|
3
|
Kantarjian HM, O’Brien S, Smith TL, Cortes
J, Giles FJ, Beran M, et al: Results of treatment with hyper-CVAD,
a dose-intensive regimen, in adult acute lymphocytic leukemia. J
Clin Oncol. 18:547–561. 2000.PubMed/NCBI
|
|
4
|
Annino L, Vegna ML, Camera A, Specchia G,
Visani G, Fioritoni G, et al: Treatment of adult acute
lymphoblastic leukemia (ALL): long-term follow-up of the GIMEMA ALL
0288 randomized study. Blood. 99:863–871. 2002. View Article : Google Scholar : PubMed/NCBI
|
|
5
|
Cassileth PA, Harrington DP, Appelbaum FR,
Lazarus HM, Rowe JM, Paietta E, et al: Chemotherapy compared with
autologous or allogeneic bone marrow transplantation in the
management to acute myeloid leukemia in first remission. N Engl J
Med. 339:1649–1656. 1998. View Article : Google Scholar : PubMed/NCBI
|
|
6
|
Dworzak MN, Fröschl G, Printz D, Mann G,
Pötschger U, Mühlegger N, et al; Austrian Berlin-Frankfurt-Münster
Study Group. Prognostic significance and modalities of flow
cytometric minimal residual disease detection in childhood acute
lymphoblastic leukemia. Blood. 99:1952–1958. 2002. View Article : Google Scholar : PubMed/NCBI
|
|
7
|
Mortuza FY, Papaioannou M, Moreira IM,
Coyle LA, Gameiro P, Gandini D, et al: Minimal residual disease
tests provide an independent predictor of clinical outcome in adult
acute lymphoblastic leukemia. J Clin Oncol. 20:1094–1104. 2002.
View Article : Google Scholar : PubMed/NCBI
|
|
8
|
Campana D: Determination of minimal
residual disease in leukemia patients. Br J Haematol. 121:823–838.
2003. View Article : Google Scholar : PubMed/NCBI
|
|
9
|
San Miguel JF, Vidriales MB, López-Berges
C, Díaz-Mediavilla J, Gutiérrez N, Cañizo C, et al: Early
immunophenotypical evaluation of minimal residual disease in acute
myeloid leukemia identifies different patient risk groups and may
contribute to postinduction treatment stratification. Blood.
98:1746–1751. 2001.
|
|
10
|
Guerrasio A, Pilatrino C, De Micheli D,
Cilloni D, Serra A, Gottardi E, et al: Assessment of minimal
residual disease (MRD) in CBFbeta/MYH11-positive acute myeloid
leukemias by qualitative and quantitative RT-PCR amplification of
fusion transcripts. Leukemia. 16:1176–1181. 2002. View Article : Google Scholar : PubMed/NCBI
|
|
11
|
van Dongen JJ, Seriu T, Panzer-Grümayer
ER, Biondi A, Pongers-Willemse MJ, Corral L, et al: Prognostic
value of minimal residual disease in acute lymphoblastic leukaemia
in childhood. Lancet. 352:1731–1738. 1998.
|
|
12
|
Schmidt HH, Strehl S, Thaler D, Strunk D,
Sill H, Linkesch W, et al: RT-PCR and FISH analysis of acute
myeloid leukemia with t(8;21)(p11;p13) and chimeric MOZ and CBP
transcripts: breakpoint cluster region and clinical implications.
Leukemia. 18:1115–1121. 2004. View Article : Google Scholar
|
|
13
|
Fiedler GM, Leichtle AB, Kase J, Baumann
S, Ceglarek U, Felix K, Conrad T, Witzigmann H, Weimann A, Schütte
C, Hauss J, Büchler M and Thiery J: Serum peptidome profiling
revealed platelet factor 4 as a potential discriminating Peptide
associated with pancreatic cancer. Clin Cancer Res. 15:3812–3819.
2009. View Article : Google Scholar
|
|
14
|
Patz EF Jr, Campa MJ, Gottlin EB,
Kusmartseva I, Guan XR and Herndon JE 2nd: Panel of serum
biomarkers for the diagnosis of lung cancer. J Clin Oncol.
25:5578–5583. 2007. View Article : Google Scholar : PubMed/NCBI
|
|
15
|
Visintin I, Feng Z, Longton G, Ward DC,
Alvero AB, Lai Y, et al: Diagnostic markers for early detection of
ovarian cancer. Clin Cancer Res. 14:1065–1072. 2008. View Article : Google Scholar : PubMed/NCBI
|
|
16
|
Kornblau SM, Tibes R, Qiu YH, Chen W,
Kantarjian HM, Andreeff M, et al: Functional proteomic profiling of
AML predicts response and survival. Blood. 113:154–164. 2009.
View Article : Google Scholar : PubMed/NCBI
|
|
17
|
Cui JW, Li WH, Wang J, Li AL, Li HY, Wang
HX, et al: Proteomics-based identification of human acute leukemia
antigens that induce humoral immune response. Mol Cell Proteomics.
4:1718–1724. 2005. View Article : Google Scholar : PubMed/NCBI
|
|
18
|
Liang T, Wang N, Li W, Li A, Wang J, Cui
J, et al: Identification of complement C3f-desArg and its
derivative for acute leukemia diagnosis and minimal residual
disease assessment. Proteomics. 10:90–98. 2010. View Article : Google Scholar : PubMed/NCBI
|
|
19
|
Cao Y, Wang N, Ying X, Li A, Wang H, Zhang
X and Li W: BioSunMS: a plug-in-based software for the management
of patients information and the analysis of peptide profiles from
mass spectrometry. BMC Med Inform Decis Mak. 9:132009. View Article : Google Scholar : PubMed/NCBI
|
|
20
|
Ng KL and Mishra SK: De novo SVM
classification of precursor microRNAs from genomic pseudo hairpins
using global and intrinsic folding measures. Bioinformatics.
23:1321–1330. 2007. View Article : Google Scholar : PubMed/NCBI
|
|
21
|
Licastro F, Pedrini S, Ferri C, Casadei V,
Govoni M, Pession A, et al: Gene polymorphism affecting
alpha1-antichymotrypsin and interleukin-1 plasma levels increases
Alzheimer’s disease risk. Ann Neurol. 48:388–391. 2000.PubMed/NCBI
|
|
22
|
Bird PI: Regulation of pro-apoptotic
leucocyte granule serine proteinases by intracellular serpins.
Immunol Cell Biol. 77:47–57. 1999. View Article : Google Scholar : PubMed/NCBI
|
|
23
|
Kloth JN, Gorter A, Fleuren GJ, Oosting J,
Uljee S, ter Haar N, et al: Elevated expression of SerpinA1 and
SerpinA3 in HLA-positive cervical carcinoma. J Pathol. 215:222–230.
2008. View Article : Google Scholar : PubMed/NCBI
|
|
24
|
Lai ML, Rizzo N, Liguori C, Zucca G and
Faa G: Alpha-1-antichymotrypsin immunoreactivity in papillary
carcinoma of the thyroid gland. Histopathology. 33:332–336. 1998.
View Article : Google Scholar : PubMed/NCBI
|
|
25
|
Estellés A, Gilabert J, Grancha S,
Yamamoto K, Thinnes T, España F, et al: Abnormal expression of type
1 plasminogen activator inhibitor and tissue factor in severe
preeclampsia. Thromb Haemost. 79:500–508. 1998.PubMed/NCBI
|
|
26
|
Wang Y, Jiang H, Dai D, Su M, Martinka M,
Brasher P, et al: Alpha 1 antichymotrypsin is aberrantly expressed
during melanoma progression and predicts poor survival for patients
with metastatic melanoma. Pigment Cell Melanoma Res. 23:575–578.
2010. View Article : Google Scholar : PubMed/NCBI
|