Introduction
Although radiation therapy (RT) is a
well-established option for treating patients with prostate cancer,
gastrointestinal (GI) and genitourinary (GU) toxicity is a major
complication of RT. Radiation-induced toxicity can manifest as
acute effects that occur during or rapidly following RT, or as late
effects that arise between a number of months and years later. GI
and GU toxicity remain important dose-limiting factors for the use
of RT in patients with prostate cancer and can affect the quality
of life of patients who undergo RT (1–6). In
addition, current treatment strategies for patients with GI and GU
toxicity are often unsatisfactory and there exists no recommended
standard treatments for such patients.
The prevalence of obesity is increasing worldwide,
although, large ethnic differences exist. The body mass index (BMI)
is a simple ratio of weight to height that is commonly used to
classify overweight and obese adults. It is defined as a patient’s
weight in kg divided by the square of the patient’s height in
m2 (kg/m2). The World Health Organization
categorizes individuals with BMIs of >25 kg/m2 as
being overweight (7).
It has been previously reported that obesity is
associated with the incidence of more aggressive, higher grade
prostate cancer and greater prostate-specific antigen (PSA) failure
rates following radical prostatectomy or external beam RT (EBRT)
(8–14). However, Efstathiou et
al(15) previously reported
that BMI is not associated with PSA failure in males with prostate
cancer treated with brachytherapy. To date, only a small number of
studies have analyzed the impact of obesity on radiation-induced
toxicity and the correlation between patient BMI and
radiation-induced toxicity remains uncertain.
The aim of the present study was to assess the
impact of BMI on radiation-induced GI and GU toxicity.
Materials and methods
Patient selection
A total of 254 patients with prostate cancer were
treated with RT at the Hospital of Hyogo College of Medicine
(Hyogo, Japan) between January 2007 and December 2009. All data
used was obtained from the patient’s medical records via a
retrospective review. Written informed consent was obtained from
the patients.
Patients were eligible for the study if they showed
histological evidence of prostate cancer and underwent curative
therapy with three-dimensional conformal RT (3D-CRT) to treat
clinically localized prostate cancer. Patients with bone metastases
that showed complete responses to treatment were included in the
present study. Data, including Gleason scores, serum PSA
measurements, clinical stages and adverse events, were obtained
from patient records.
The patients were classified into groups according
to pretreatment risk using a modification of the D’Amico risk
classification system (16).
Patients with T4 prostate tumors, with nodal or distant metastases,
were assigned to the high-risk group.
Data collected within two years of the initiation of
RT, including height, weight and the results of CT scanning to
measure abdominal adiposity, were also used. Among all the records,
acute toxicities were assessed in the 54 patients of which all data
were available.
Two patients with follow-up terms of <3 months
were not included in the assessment of late toxicities. One patient
with a rectal invasion due to a recurrence of prostate cancer was
excluded from the assessment of late GI toxicity. Late GI and GU
toxicity were assessed in the remaining 51 and 52 patients,
respectively.
Treatment
All patients were placed in the supine position and
helically scanned on an Aquilion LB (Toshiba Corporation, Tokyo,
Japan) computer tomography unit. For each patient, a planning
computerised tomography (CT) scan of the entire pelvis from the
lower-abdomen to below the ischial tuberosities was obtained at
5-mm intervals. Patients were required to urinate and excrete stool
prior to the CT scan.
The CT data set was transferred to the FOCUS XiO™
(CMS Inc., St. Louis, MO, USA) treatment planning system to outline
the volumes of interest.
The clinical target volume (CTV) of the prostate and
seminal vesicles was calculated in the intermediate- and high-risk
prostate cancer patients. For these patients, the CTV was expanded
in three dimensions with a 1-cm margin, with the exception of the
prostate-rectal interface, where a 0.5-cm margin was used to obtain
the planning target volume (PTV). The RT plan was prescribed at the
isocenter in the PTV.
The normal structures were outlined and considered
to be solid organs, including the rectum, bladder and femoral
heads. In addition, the rectum and bladder were reviewed and
contoured a second time in all patients eligible for the present
study. For each case, the rectum was contoured from the anal verge
or ischial tuberosities (whichever was higher) to the sacroiliac
joints or the rectosigmoid junction (whichever was lower) (17). The bladder was contoured from the
apex to the dome.
The patients were treated using the 3D-CRT technique
with 8 coplanar fields and 10 MV photons. The RT plan was delivered
using Mevatron KD2/50 Primus (Toshiba Corporation) between 2007 and
2009 and Elekta Synergy (Elekta, Crawley, UK) from 2009 onward.
Androgen suppressive therapy was started prior to
the initiation of RT and was routinely used during the term of RT,
with the exception of one low-risk prostate cancer patient.
Anthropometric measurements and
dosimetric parameters
The abdominal circumferences and areas of
subcutaneous and visceral fat were measured retrospectively from
the CT images. The CT images were reconstructed at a 5–8-mm
thickness. For each patient, the abdominal circumference and areas
of fat were measured on single cross-sectional scans obtained at
the umbilicus (18). All images
were analyzed on the Virtual Place Advance Plus workstation (AZE
Ltd., Tokyo, Japan). The areas of subcutaneous and visceral fat
were obtained by automatic planimetry. First, the subcutaneous and
visceral fat were automatically defined. Subcutaneous fat was
defined as the extraperitoneal fat between the skin and muscles and
the intraperitoneal fat was defined as visceral fat. The border was
manually corrected. Next, the areas of visceral and subcutaneous
fat were automatically calculated from the mean value and standard
deviation of the Hounsfield unit values in the fat tissue.
For each patient, the distance between the prostate
and the rectum (D) from the anterior wall of the rectum to the
superior margin of the prostate was measured on the planning CT
images, since the inferior portion of the rectum contacted the
prostate and the border was ill-defined. In addition, the rectal
volume was calculated.
For each patient, calculated dosimetric parameters
included the mean, minimum and maximum doses for the rectum and
bladder. Additionally, the rectal volumes receiving ≥40, ≥50, ≥60,
≥65 and ≥70 Gy (rectum V40, V50,
V60, V65 and V70, respectively)
and the bladder volumes receiving ≥40 and ≥65 Gy (bladder
V40 and V65, respectively) were calculated
for each patient.
Toxicity assessment
GI and GU toxicity occurring during the term of RT
or <90 days after the completion of RT, were assessed according
to the Common Terminology Criteria for Adverse Events version 3.0
(19). GI and GU toxicity occurring
>90 days following the completion of RT were assessed according
to the toxicity criteria of the Radiation Therapy Oncology
Group/European Organization for Research and Treatment of Cancer
acute and late radiation morbidity scoring scheme.
Statistical analysis
Patients were classified into two groups according
to BMI. The lower BMI group included patients with a BMI of <25
and the higher BMI group included those with a BMI of ≥25.
T stage and risk groups were analyzed using the G
test with William’s correction. The incidences of toxicity in the
two groups were assessed using a χ2 test. Yate’s
correction was used in the assessment of late toxicity with the
exception of the analysis of late GI toxicity with a cutoff value
of 22.0 kg/m2. The patient characteristics, dosimetric
parameters and anthropometric measurements were assessed using the
Student’s or Welch’s t-test. Welch’s t-test was used when the
variances were not equal. In addition, all statistical analyses
were two-sided and P<0.05 was considered to indicate a
statistically significant difference.
Results
The mean age of the patients was 71.7 years (range,
58–84 years), the mean initial PSA level was 108.2 ng/ml (range,
4.3–2,605.0 ng/ml) and the mean prescribed dose of RT was 69.3 Gy
(range, 66–70 Gy). In total, 29 patients (53.7%) had a Gleason
score of ≥8. All the patients tolerated EBRT well and completed the
planned course of treatment, although, one patient experienced a
six day break period due to development of a spontaneous
pneumothorax. The mean follow-up term was 26.7 months (range, 6–63
months) in the patients evaluated for late toxicities.
BMI and anthropometric measurements
The lower BMI group contained 36 patients and the
higher BMI group contained 18 patients. Patient characteristics are
listed in Table I. No significant
differences were observed in the parameters, with the exception of
BMI, between the two groups. In addition, the higher BMI group
included one patient with a BMI of 33.8 kg/m2.
 | Table IPatient characteristics. |
Table I
Patient characteristics.
| BMI,
kg/m2 | |
|---|
|
| |
|---|
| Characteristics | <25.0 | ≥25.0 | P-value |
|---|
| Patients, n | 36 | 18 | |
| Mean age, years
(range) | 71.7 (58–84) | 71.8 (43.0–80.0) | 0.97 |
| Mean BMI,
kg/m2 (range) | 21.5 (16.1–24.6) | 26.6 (25.0–33.8) |
2.44×10⁻¹⁰ |
| Clinical T stage, n
(%) | | | 0.73a |
| T1 | 11 (30.6) | 6 (33.3) | |
| T2 | 12 (33.3) | 7 (38.9) | |
| T3 | 11 (30.6) | 5 (27.8) | |
| T4 | 2 (5.6) | 0 (0.0) | |
| Bone metastasis, n
(%) | 7 (19.4) | 2 (11.1) | 0.70 |
| Mean initial PSA,
ng/ml (range) | 71.9 (4.3–423.0) | 180.9
(4.4–2,605.0) | 0.46 |
| Gleason score, n
(%) | | | 0.080a |
| ≤6 | 2 (5.6) | 5 (27.8) | |
| 7 | 14 (38.9) | 4 (22.2) | |
| ≥8 | 20 (55.6) | 9 (50.0) | |
| Risk group, n
(%) | | | 0.87a |
| Low | 1 (2.8) | 1 (5.6) | |
| Intermediate | 7 (19.4) | 4 (22.2) | |
| High | 28 (77.8) | 13 (72.2) | |
The results of the anthropometric measurements are
presented in Table II. The higher
BMI group was found to have significantly larger abdominal
circumferences and areas of total, subcutaneous and visceral fat
compared with the lower BMI group. However, D was similar in the
two groups and no significant differences were observed in rectal
volume.
| Table IIAnthropometric measurements. |
Table II
Anthropometric measurements.
| BMI,
kg/m2 | |
|---|
|
| |
|---|
| Measurements | <25.0 | ≥25.0 | P-value |
|---|
| Distance between the
rectum and the prostate, mm (range) | 12.1 (0.0–29.2) | 10.7 (1.2–27.8) | 0.48 |
| Rectal volume, cc
(range) | 71.6
(35.7–151.6) | 63.0
(36.6–120.4) | 0.22 |
| Bladder volume, cc
(range) | 79.7
(29.5–287.9) | 83.4
(33.7–98.0) | 0.81 |
| Abdominal
circumference, cm (range) | 83.6
(64.1–105.2) | 99.6
(90.3–114.1) |
4.87×10⁻¹⁰ |
| Total fat,
cm2 (range) | 183.6
(12.7–318.9) | 331.6
(204.1–553.8) |
4.67×10⁻⁸ |
| Subcutaneous fat,
cm2 (range) | 92.6
(3.5–163.7) | 170.8
(111.1–288.4) |
3.23×10⁻⁸ |
| Visceral fat,
cm2 (range) | 91.3
(9.2–199.9) | 160.8
(63.0–287.9) |
3.68×10⁻⁵ |
| Ratio of visceral
to subcutaneous fat, % (range) | 48.9
(21.9–78.2) | 47.6
(28.5–63.3) | 0.67 |
The dosimetric parameters are shown in Table III. The rectum V60 and
V65 were significantly lower in the higher BMI group
than in the lower BMI group, although, no significant differences
were observed in the maximum doses to the PTV or rectum. In
addition, no significant differences were observed in the
dosimetric bladder parameters between the two groups.
| Table IIIDosimetric parameters. |
Table III
Dosimetric parameters.
| BMI,
kg/m2 | |
|---|
|
| |
|---|
| Parameters | <25.0 | ≥25.0 | P-value |
|---|
| Mean dose for PTV
(range) | 69.7
(66.2–70.8) | 69.0
(65.9–70.9) | 0.13 |
| Maximum dose for
PTV (range) | 70.9
(67.5–72.2) | 70.2
(67.0–72.5) | 0.15 |
| Minimum dose for
PTV (range) | 65.4
(57.8–67.0) | 64.9
(61.8–67.1) | 0.25 |
| Rectum |
| Mean dose, Gy
(range) | 43.6
(29.1–58.6) | 42.9
(37.3–53.2) | 0.70 |
| Maximum dose, Gy
(range) | 70.3
(67.1–71.8) | 69.3
(66.1–72.0) | 0.05 |
| V40, %
(range) | 60.3
(34.2–92.6) | 59.7
(37.2–88.7) | 0.88 |
| V50, %
(range) | 42.6
(21.1–76.4) | 38.4
(20.9–67.5) | 0.26 |
| V60, %
(range) | 29.6
(12.0–57.7) | 23.2
(11.1–42.0) | 0.02 |
| V65, %
(range) | 20.8
(6.5–44.5) | 13.4
(3.7–31.7) | 0.0049 |
| V70, %
(range) | 3.5 (0.0–20.0) | 1.4 (0.0–14.1) | 0.075 |
| Bladder |
| Mean dose, Gy
(range) | 53.4
(30.3–64.6) | 54.0
(34.2–63.5) | 0.79 |
| Maximum dose, Gy
(range) | 70.5
(67.2–71.7) | 69.8
(66.6–72.3) | 0.21 |
| V40, %
(range) | 73.6
(36.3–94.3) | 74.8
(33.7–98.8) | 0.78 |
| V65, %
(range) | 40.8
(11.3–74.3) | 41.6
(2.9–68.3) | 0.88 |
Toxicity
The results of the toxicity assessment are shown in
Table IV. The incidences of acute
GI and GU toxicity and late GI and GU toxicity among all the
patients were 37.0, 22.2, 25.5 and 15.4%, respectively. No patients
were identified with acute toxicities of grade ≥3. Late GI toxicity
of grade 3 was found in five patients with BMIs of 20.1, 21.0,
21.1, 24.2 and 25.7 kg/m2, respectively, and GU toxicity
of grade 3 was found in two patients with BMIs of 21.6 and 26.0
kg/m2, respectively. In addition, no patients were
identified with late toxicities of grade 4.
| Table IVGI and GU toxicity. |
Table IV
GI and GU toxicity.
| BMI,
kg/m2 | |
|---|
|
| |
|---|
| Toxicity | <25.0 | ≥25.0 | P-value |
|---|
| Acute toxicity |
| GI (%) | n=36 | n=18 | |
| 15 (41.7) | 5 (27.8) | 0.32 |
| GU (%) | n=36 | n=18 | |
| 7 (19.4) | 5 (27.8) | 0.49 |
| Late
toxicityb |
| GI (%) | n=34 | n=17 | |
| 12 (35.3) | 1 (5.9) | 0.053 |
| GU (%) | n=35 | n=17 | |
| 2 (5.7) | 6 (35.3) | 0.018 |
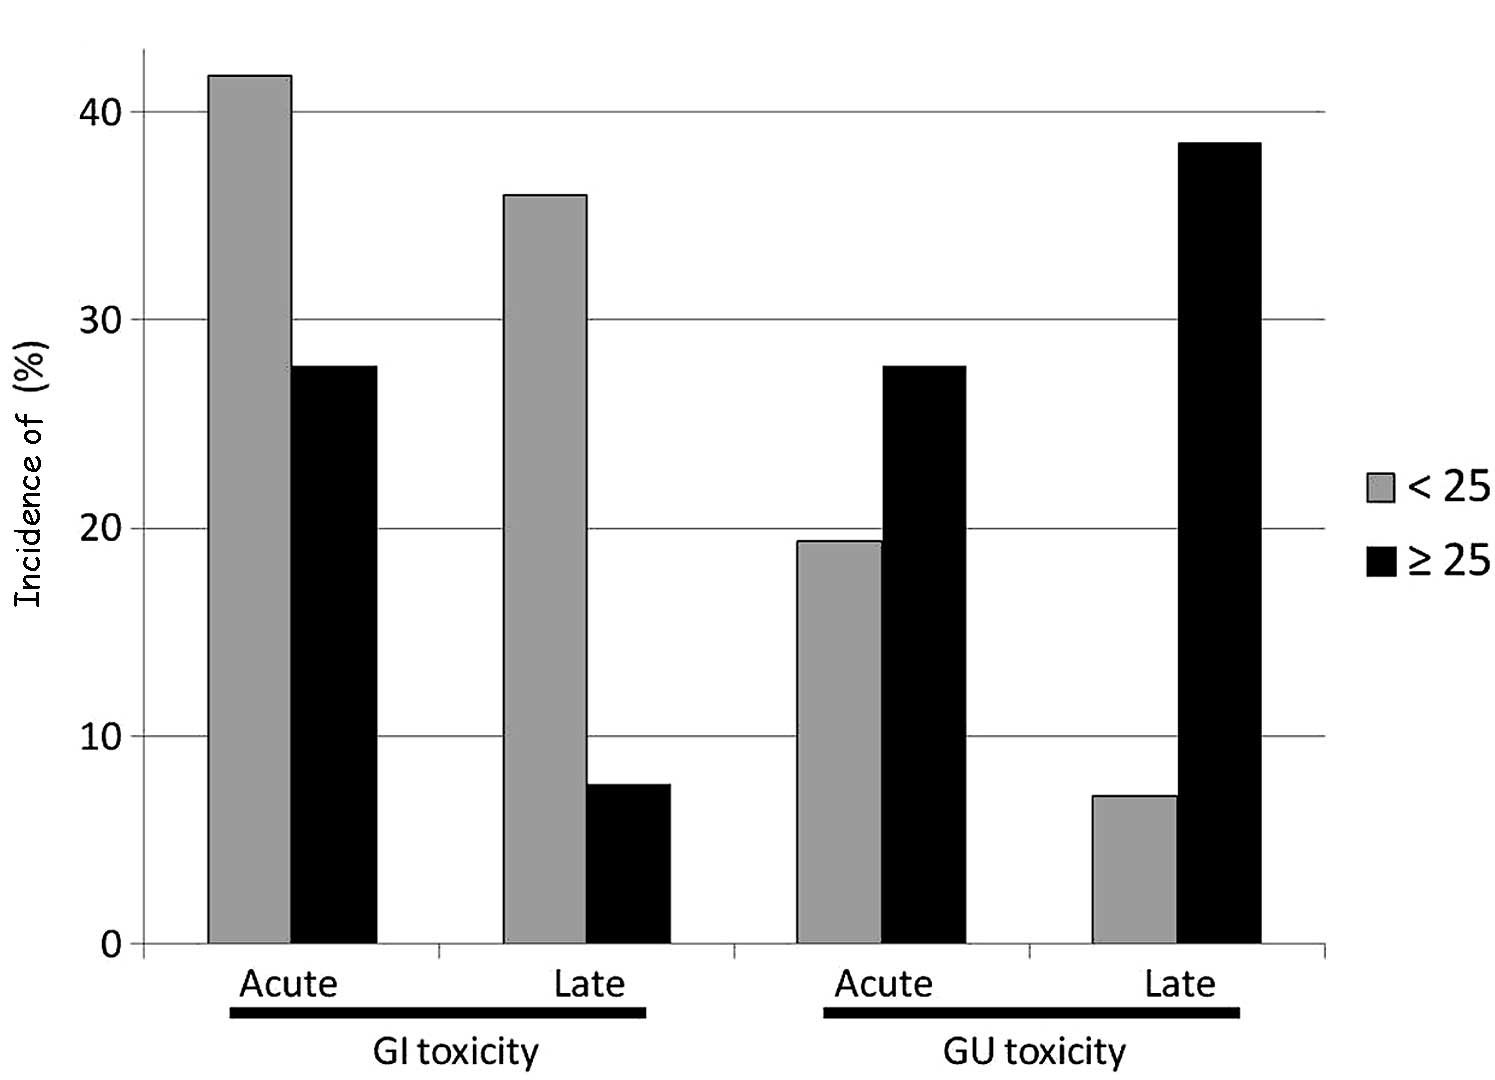
The higher BMI group demonstrated lower incidences
of acute and late GI toxicity and higher incidences of acute and
late GU toxicity (Fig. 1). In
addition, significant differences were observed between the two
groups with regard to the incidence of late GU toxicity.
Multiple cutoff points were analyzed to identify an
improved cutoff value for the BMI that may predict toxicity
(Table V). The patients were
classified into two groups according to BMI with the multiple
cutoff points as follows: Patients with BMIs less than the cutoff
point and patients with BMIs greater than or equal to the cutoff
point. The χ2 test was used to calculate each P-value.
Significant differences were observed when the cutoff point for the
BMI was set at 22.0 and 23.0 kg/m2 for the late GI
toxicity and a BMI of 25.0 kg/m2 for late GU
toxicity.
| Table VMultiple cutoff points of the BMI for
predicting GI and GU toxicity. |
Table V
Multiple cutoff points of the BMI for
predicting GI and GU toxicity.
| BMI cut-off point,
kg/m2 |
|---|
|
|
|---|
| Toxicity | 20.0 | 21.0 | 22.0 | 23.0 | 24.0 | 25.0 | 26.0 |
|---|
| Acute toxicity |
| GI | 0.89 | 0.97 | 0.35 | 0.73 | 0.48 | 0.49 | 0.94 |
| GU | 0.66 | 0.90 | 0.97 | 0.83 | 0.34 | 0.49 | 0.96 |
| Late toxicity |
| GI | 0.86 | 0.12 | 0.015 | 0.019 | 0.13 | 0.053 | 0.23 |
| GU | 0.37 | 0.49 | 0.65 | 0.36 | 0.13 | 0.018 | 0.63 |
Discussion
The correlation between BMI and radiation-induced
toxicity in patients with prostate cancer remains uncertain. The
present study showed that patients with higher BMIs exhibited lower
incidences of GI toxicity and higher incidences of GU toxicity.
Previously, Wedlake et al(3)
reported that lower BMIs predict GI toxicity in patients treated
with RT for pelvic malignancies, including urological, GI and
gynecological malignancies. The results of the current study are
consistent with these results. However, the current study presents
the anthropometric measurements and dosimetric parameters in
patients with prostate cancer for two ranges of BMI. To the best of
our knowledge, this is the first study to investigate the effects
of BMI on the dosimetric parameters for organs at risk and
radiation-induced toxicity in patients with prostate cancer.
A correlation between radiation doses and
radiation-induced GI toxicity has been previously reported and
appears to be well established. In addition, the risk factors for
radiation-induced GI toxicity have been discussed in previous
studies (1,20). However, the correlation between the
BMI, radiation-induced toxicities and patient-related risk factors
for toxicity in patients with prostate cancer, remain unclear. The
present study examined whether BMI affects GI or GU toxicity
induced by EBRT. The results showed that patients with higher BMIs
have lower risks of GI toxicity and higher risks of GU
toxicity.
Patil et al(21) previously reported that a lower BMI
is associated with a higher rectal wall dose. However, a lower BMI
has not been associated with greater rectal toxicity in patients
with prostate cancer who are treated with brachytherapy. In the
present study, higher BMIs were found to decrease the doses to the
rectum and incidence of GI toxicity, although, no differences were
observed in D or rectal volume. The prostate-rectum spacers, such
as collagen and hydrogels, have been previously reported to
separate the rectum from the prostate (22,23).
The positional association between the inferior portion of the
rectum and the prostate is unclear, although, the present study
evaluated the area between the anterior wall of the rectum and the
superior margin of the prostate. Perirectal fat may function as a
spacer to reduce the rectal dose and lower the incidence of GI
toxicity. The effort to reduce the rectal dose is required in
patients with lower BMIs.
The higher BMI group showed higher incidences of
acute and late GU toxicity, although, no apparent differences were
observed between the dosimetric bladder parameters. Generally, the
bladder locates sequentially to the prostate and intrapelvic fat
appears to have only a small impact on the positional association
between the bladder and the prostate. The bladder is a highly
distensible organ. Its volume continuously changes and the
post-void residual volume varies. In addition, dilation or
shrinkage of the bladder wall due to pooled urine may affect the
development of radiation-induced toxicity. Furthermore, fat has
been reported to cause changes in the serum levels of various
hormones and induce a state of chronic low-level inflammation in
obese patients (8,24). These changes may affect the
occurrence or severity of radiation-induced toxicity. The factors
affecting GU toxicity and the biochemical mechanisms of the effects
of fat on radiation-induced toxicity must be investigated in future
studies.
Limitations of the current study include the sample
of patients and length of the follow-up term. These limitations
make it difficult to deduce specific trends. Previously, Zeleksfy
et al(4) reported that the
median time to the development of late GI and GU toxicity is 17 and
30 months, respectively, and that late GU symptoms occur
significantly later than those of GI toxicity. In addition, Lawton
et al(5) reported that the
median time to the development of late GI and GU toxicity is 17.9
and 14.1 months, respectively. The median follow-up term of 26.7
months in the present study appears to be sufficient to evaluate GI
and GU toxicity. With a longer follow-up period and a larger number
of events, the statistical strength of the study may be
reinforced.
Treatment for prostate cancer in obese patients is
more challenging than that in normal-weight patients due to
predictable inferior outcomes (8–14).
Therefore, increased doses of EBRT with image-guided RT techniques
or brachytherapy appear to have been considered for treating obese
patients with prostate cancer. However, the results of the present
study propose that adequate care for GU toxicity must be provided.
Additional studies in larger groups of patients are required to
confirm whether this is consistent with obese patients with BMIs of
≥30 kg/m2.
To conclude, higher BMIs tend to decrease the doses
to the rectum and incidence of GI toxicity and increase the
incidence of GU toxicity in patients who undergo RT to treat
prostate cancer. We hypothesize that an increased effort must be
made to reduce rectal doses in patients with lower BMIs.
Conversely, increased care for GU toxicity must be provided for
overweight patients.
Acknowledgements
The current study was supported, in part, by funding
from Grants-in-Aid for Scientific Research (C) (21591622).
References
|
1
|
Garg AK, Mai WY, McGary JE, Grant WH III,
Butler EB and Teh BS: Radiation proctopathy in the treatment of
prostate cancer. Int J Radiat Oncol Biol Phys. 66:1294–1305. 2006.
View Article : Google Scholar : PubMed/NCBI
|
|
2
|
Elliott SP and Malaeb BS: Long-term
urinary adverse effects of pelvic radiotherapy. World J Urol.
29:35–41. 2011. View Article : Google Scholar : PubMed/NCBI
|
|
3
|
Wedlake LJ, Thomas K, Lalji A, Blake P,
Khoo VS, Tait D and Andreyev HJ: Predicting late effects of pelvic
radiotherapy: is there a better approach? Int J Radiat Oncol Biol
Phys. 78:1163–1170. 2010. View Article : Google Scholar : PubMed/NCBI
|
|
4
|
Zelefsky MJ, Levin EJ, Hunt M, Yamada Y,
Shippy AM, Jackson A and Amols HI: Incidence of late rectal and
urinary toxicities after three-dimensional conformal radiotherapy
and intensity-modulated radiotherapy for localized prostate cancer.
Int J Radiat Oncol Biol Phys. 70:1124–1129. 2008. View Article : Google Scholar
|
|
5
|
Lawton CA, Won M, Pilepich MV, Asbell SO,
Shipley WU, Hanks GE, Cox JD, Perez CA, Sause WT, Doggett SR and
Rubin P: Long-term treatment sequelae following external beam
irradiation for adenocarcinoma of the prostate: analysis of RTOG
studies 7506 and 7706. Int J Radiat Oncol Biol Phys. 21:935–939.
1991. View Article : Google Scholar : PubMed/NCBI
|
|
6
|
Crew JP, Jephcott CR and Reynard JM:
Radiation-induced haemorrhagic cystitis. Eur Urol. 40:111–123.
2001. View Article : Google Scholar : PubMed/NCBI
|
|
7
|
No authors listed. Physical status: the
use and interpretation of anthropometry. Report of a WHO Expert
Committee. World Health Organ Tech Rep Ser. 854:1–452.
1995.PubMed/NCBI
|
|
8
|
Freedland SJ and Platz EA: Obesity and
prostate cancer: making sense out of apparently conflicting data.
Epidemiol Rev. 29:88–97. 2007. View Article : Google Scholar : PubMed/NCBI
|
|
9
|
Hsing AW, Sakoda LC and Chua S Jr:
Obesity, metabolic syndrome and prostate cancer. Am J Clin Nutr.
86:s843–s857. 2007.PubMed/NCBI
|
|
10
|
Thomas JA II and Freedland SJ: Obesity and
prostate cancer: collateral damage in the battle of the bulge.
Front Biosci (Schol Ed). 3:594–605. 2011. View Article : Google Scholar : PubMed/NCBI
|
|
11
|
Zilli T, Nguyen TV, Bahary JP, Chagnon M,
Dufresne A and Taussky D: Prognostic impact of abdominal adiposity,
waist circumference and body mass index in patients with
intermediate-risk prostate cancer treated with radiotherapy. Int J
Obes (Lond). 35:1421–1426. 2011. View Article : Google Scholar : PubMed/NCBI
|
|
12
|
Efstathiou JA, Chen MH, Renshaw AA,
Loffredo MJ and D’Amico AV: Influence of body mass index on
prostate-specific antigen failure after androgen suppression and
radiation therapy for localized prostate cancer. Cancer.
109:1493–1498. 2007. View Article : Google Scholar
|
|
13
|
Palma D, Pickles T and Tyldesley S;
Prostate Cohort Outcomes Initiative. Obesity as a predictor of
biochemical recurrence and survival after radiation therapy for
prostate cancer. BJU Int. 100:315–319. 2007. View Article : Google Scholar : PubMed/NCBI
|
|
14
|
Geinitz H, Thamm R, Mueller T, Jess K,
Zimmermann FB, Molls M and Nieder C: Impact of body mass index on
outcomes after conformal radiotherapy in patients with prostate
cancer. Int J Radiat Oncol Biol Phys. 81:16–22. 2011. View Article : Google Scholar : PubMed/NCBI
|
|
15
|
Efstathiou JA, Skowronski RY, Coen JJ,
Grocela JA, Hirsch AE and Zietman AL: Body mass index and
prostate-specific antigen failure following brachytherapy for
localized prostate cancer. Int J Radiat Oncol Biol Phys.
71:1302–1308. 2008. View Article : Google Scholar
|
|
16
|
D’Amico AV, Whittington R, Malkowicz SB,
Schultz D, Blank K, Broderick GA, Tomaszewski JE, Renshaw AA,
Kaplan I, Beard CJ and Wein A: Biochemical outcome after radical
prostatectomy, external beam radiation therapy, or interstitial
radiation therapy for clinically localized prostate cancer. JAMA.
280:969–974. 1998.
|
|
17
|
Vargas C, Martinez A, Kestin LL, Yan D,
Grills I, Brabbins DS, Lockman DM, Liang J, Gustafson GS, Chen PY,
Vicini FA and Wong JW: Dose-volume analysis of predictors for
chronic rectal toxicity after treatment of prostate cancer with
adaptive image-guided radiotherapy. Int J Radiat Oncol Biol Phys.
62:1297–1308. 2005.
|
|
18
|
Yoshizumi T, Nakamura T, Yamane M, Islam
AH, Menju M, Yamasaki K, Arai T, Kotani K, Funahashi T, Yamashita S
and Matsuzawa Y: Abdominal fat: standardized technique for
measurement at CT. Radiology. 211:283–286. 1999. View Article : Google Scholar : PubMed/NCBI
|
|
19
|
Trotti A, Colevas AD, Setser A, et al:
CTCAE v3.0: development of a comprehensive grading system for the
adverse effects of cancer treatment. Semin Radiat Oncol.
13:176–181. 2003. View Article : Google Scholar
|
|
20
|
Peeters ST, Heemsbergen WD, van Putten WL,
Slot A, Tabak H, Mens JW, Lebesque JV and Koper PC: Acute and late
complications after radiotherapy for prostate cancer: results of a
multicenter randomized trial comparing 68 Gy to 78 Gy. Int J Radiat
Oncol Biol Phys. 61:1019–1034. 2005. View Article : Google Scholar
|
|
21
|
Patil N, Crook J, Saibishkumar EP, Aneja
M, Borg J, Pond G and Ma C: The effect of obesity on rectal
dosimetry after permanent prostate brachytherapy. Brachytherapy.
8:218–222. 2009. View Article : Google Scholar
|
|
22
|
Susil RC, McNutt TR, DeWeese TL and Song
D: Effects of prostate-rectum separation on rectal dose from
external beam radiotherapy. Int J Radiat Oncol Biol Phys.
76:1251–1258. 2010. View Article : Google Scholar : PubMed/NCBI
|
|
23
|
Noyes WR, Hosford CC and Schultz SE: Human
collagen injections to reduce rectal dose during radiotherapy. Int
J Radiat Oncol Biol Phys. 82:1918–1922. 2012. View Article : Google Scholar : PubMed/NCBI
|
|
24
|
Stienstra R, Duval C, Müller M and Kersten
S: PPARs, obesity and inflammation. PPAR Res. 2007:959742007.
View Article : Google Scholar : PubMed/NCBI
|