Introduction
Gastric cancer (GC) is one of the most frequent
malignant tumors with a high mortality rate. Almost two-thirds of
GC cases occur in developing countries and the incidence in China
accounts for ~42% of all the cases (1). Early GC is defined as a gastric
carcinoma that is confined to the mucosa and submucosa,
irrespective of lymph node involvement and tumor size (2). Early GC has a good prognosis following
curative resection; the five-year survival rate is >90% in
certain parts of Asia (3,4) and marginally lower in Europe and the
United States (5,6). Currently, surgery remains the main
option for treating GC. However, the majority of the patients that
present with clinical symptoms of GC are diagnosed with advanced
GC. The digestive endoscopic technique has significantly improved
the early diagnosis rate of GC. In addition, clinical cancer
biomarkers, including CEA and CA199, are effective objective
indicators for GC diagnosis. However, a misdiagnosis of patients
that are negative for the cancer biomarkers and endoscopic
diagnosis may occur. Therefore, the identification of novel
biomarkers is urgently required for the early diagnosis of GC.
To date, the study of cancer genomics has
extensively penetrated into biomedical research and clinical
applications. Numerous studies have used these high-throughput
techniques to identify new subclasses of biomarkers (7,8),
classify subtypes (9) and predict
the outcome of human cancer (10–13).
Gene expression profiling from microarray studies has been used to
understand the development mechanism of human diseases. However,
the majority of studies with regard to the identification of
biomarkers have focused on mRNA and proteins. Compared with mRNA
and proteins, microRNAs (miRNAs) are more likely to act as disease
biomarkers due to their stable structure and easy detection
(13). The abnormal expression of
miRNAs is key in the progression of human cancer and may act as a
biomarker that is used for a clinical diagnosis of early GC.
The present study identified two signature miRNAs,
hsa-miR-196a and hsa-miR-148a, using the microarray technique,
bioinformatics methods and biological experiment methods based on a
group of clinical samples from Chinese patients. This single
signature may potentially act as candidate biomarker for the early
diagnosis of GC.
Materials and methods
Clinical samples
The clinical samples were collected from the Wuhan
General Hospital of Guangzhou Command (Guangzhou, China).
Information regarding the clinicopathological, therapeutic and
outcome parameters of patients that were treated between August
2010 and December 2011 was collected retrospectively. Cancer
staging was performed according to the fifth edition of the
American Joint Commission on Cancer TNM criteria in 2000. All
cancer samples were obtained from surgical specimens and all
patients provided written consent for the use of these tissues for
research purposes. A total of 86 patients were selected for the
present study, including 44 samples from early GC patients and 42
normal gastric mucosa samples from non-cancer patients, which were
used as a control group. The details of the patients that were used
in this study are shown in Table I.
The study was approved by the ethics committee of Wuhan General
Hospital of Guangzhou Command (Wuchang, China). Written informed
consent was obtained from the patients.
 | Table IDetails of the patients that were used
in this study. |
Table I
Details of the patients that were used
in this study.
| Characteristic | Cancer group
(n=44) | Control group
(n=42) | P-value |
|---|
| Gender, n | | | 0.976 |
| Male | 25 | 24 | |
| Female | 19 | 18 | |
| Age, years | | | 0.343 |
| Median | 55 | 51 | |
| Range | 37–78 | 32–74 | |
| Stage, n | | | - |
| I | 13 | - | |
| II | 31 | - | |
| Patient status,
n | | | 0.105 |
| Survival | 39 | 41 | |
| Mortality | 5 | 1 | |
miRNA microarray
The miRNA microarray analysis was performed as
described in detail on the website of the Shanghai Biotechnology
Corporation (http://www.ebioservice.com/). Briefly, 50–100 μg total
RNA was used to extract the miRNAs using an miRNA isolation kit
(AM1560; Ambion, Carlsbad, CA, USA). Fluorescein-labeled miRNAs
were used for hybridization on an Affymetrix miRNA chip 2.0
(Affymetrix, Santa Clara, CA, USA). The fluorescence signals were
scanned using a GeneChip Scanner 3000 7G (Affymetrix). The raw data
were normalized and analyzed using GeneChip Command Console 1.1
software (Affymetrix).
RNA extraction and quantitative PCR
(qPCR)
RNA was extracted from larynx carcinoma and normal
esophageal mucosa tissues using TRIzol reagent (Invitrogen,
Carlsbad, CA, USA), according to standard procedure. Mature miRNA
sequences were acquired from the Sanger Institute miRBase Sequence
Database (http://microrna.sanger.ac.uk/sequences/). Stem-loop
reverse transcription primers for miRNAs were designed according to
Chen et al (14). The
reverse transcription reaction conditions that were used involved
incubation at 16°C for 30 min, 42°C for 30 min and 72°C for 10 min.
The thermal cycling procedure for the PCR involved an initial
denaturation step at 95°C for 4 min, followed by 40 cycles at 95°C
for 30 sec, 57°C for 30 sec and 72°C for 30 sec. The melt curves
for each PCR were carefully analyzed to determine any non-specific
amplification. The expression of each miRNA was calculated using
the 2−ΔΔCT formula and normalized to U6 snRNA expression
(15).
Bioinformatics algorithms
The significant analysis of microarray (SAM) method
was used to perform the unsupervised calculation. The statistical
technique is based on a t-test for finding significant genes in a
set of microarray experiments and was proposed by Tusher et
al (16). A hierarchical
clustering of the differentially expressed genes was performed with
Cluster 3.0 (http://bonsai.hgc.jp/~mdehoon/software/cluster/software)
version using the average linkage algorithm. The top scoring pair
(TSP) algorithm was used to perform the supervised calculation
(17). The basic principle of the
k-TSP is to identify miRNA pairs that are oppositely expressed (one
upregulated and one downregulated) in two classes. All numerical
analyses that are presented were performed using Matlab 7.0
(MathWorks Company, Natick, MA, USA).
Receiver operating characteristic (ROC)
curves and statistical analysis
The ROC curve analysis was conducted using the
MedCalc software packages (version 8.2.1.0; MedCalc, Mariakerke,
Belgium). The area under the curve (AUC) provided a measure of the
overall performance of the diagnostic test. The ratio of the miRNA
signal intensities and Ct value of each miRNA were used for the ROC
calculation of the samples. The clinical data were analyzed using
the t-test. The cumulative survival curve was compared using the
log-rank test. P<0.05 was considered to indicate a statistically
significant difference.
miRNA-targeted gene prediction and signal
pathway analyses
An miRNA target gene prediction database TargetScan
5.2 (http://www.targetscan.org) was used to
predict the plausible targets of the miRNAs. An integrated gene
ontology database molecular annotation system (MAS 3.0; http://www.capitalbio.com) was used to investigate the
miRNA-targeted genes and their involvement in various signal
pathways.
Results
Differentially expressed miRNA
profiling
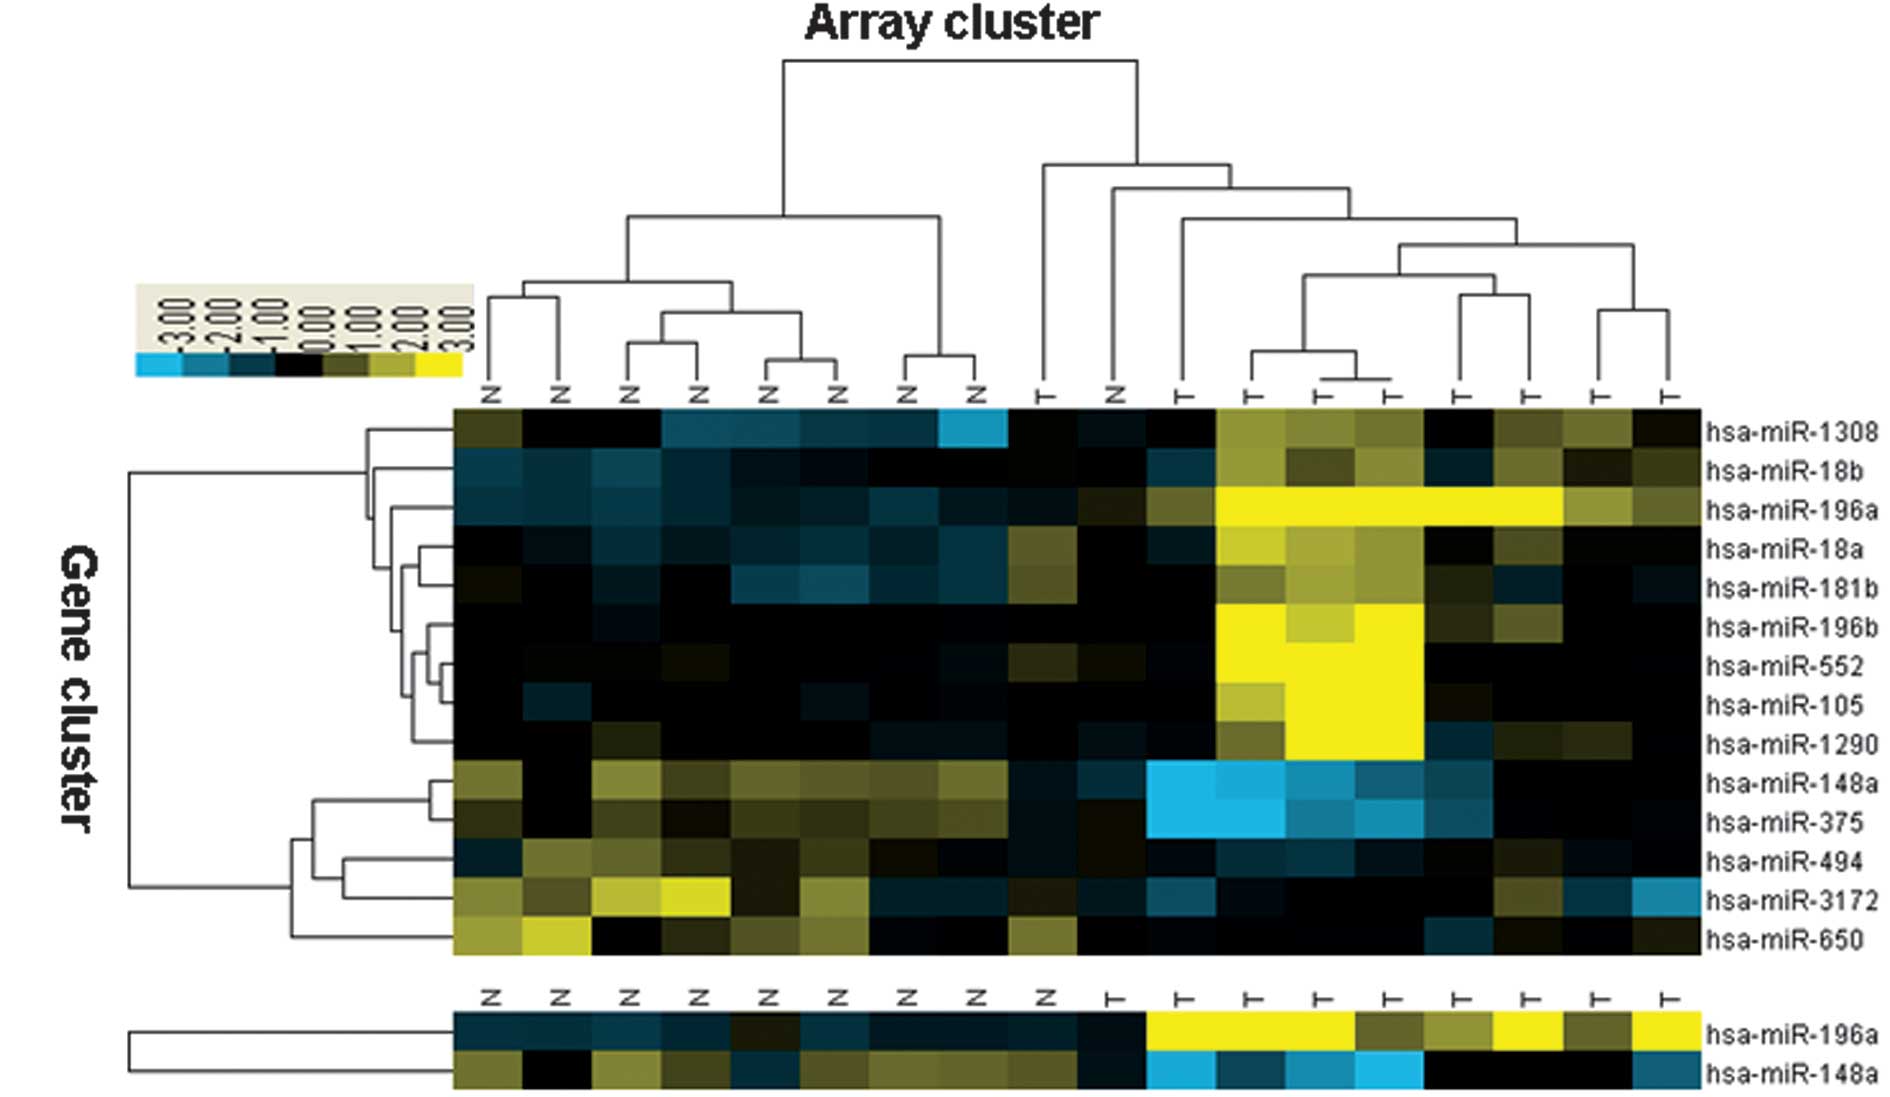
SAM was used to compare the expression data of nine
early GC samples with nine normal samples. A total of nine
upregulated and five downregulated miRNAs were identified with
statistical significance in the early GC samples (Fig. 1A). The 14-miRNA profile may be used
to differentiate between the cancer and normal samples with a
classification accuracy of 94.4%. Furthermore, the TSP algorithm
was used to identify the most efficient marker based on the
14-miRNA profile data. hsa-miR-196a and hsa-miR-148a were
calculated to be the most efficient markers for classifying early
GC and normal samples (Fig.
1B).
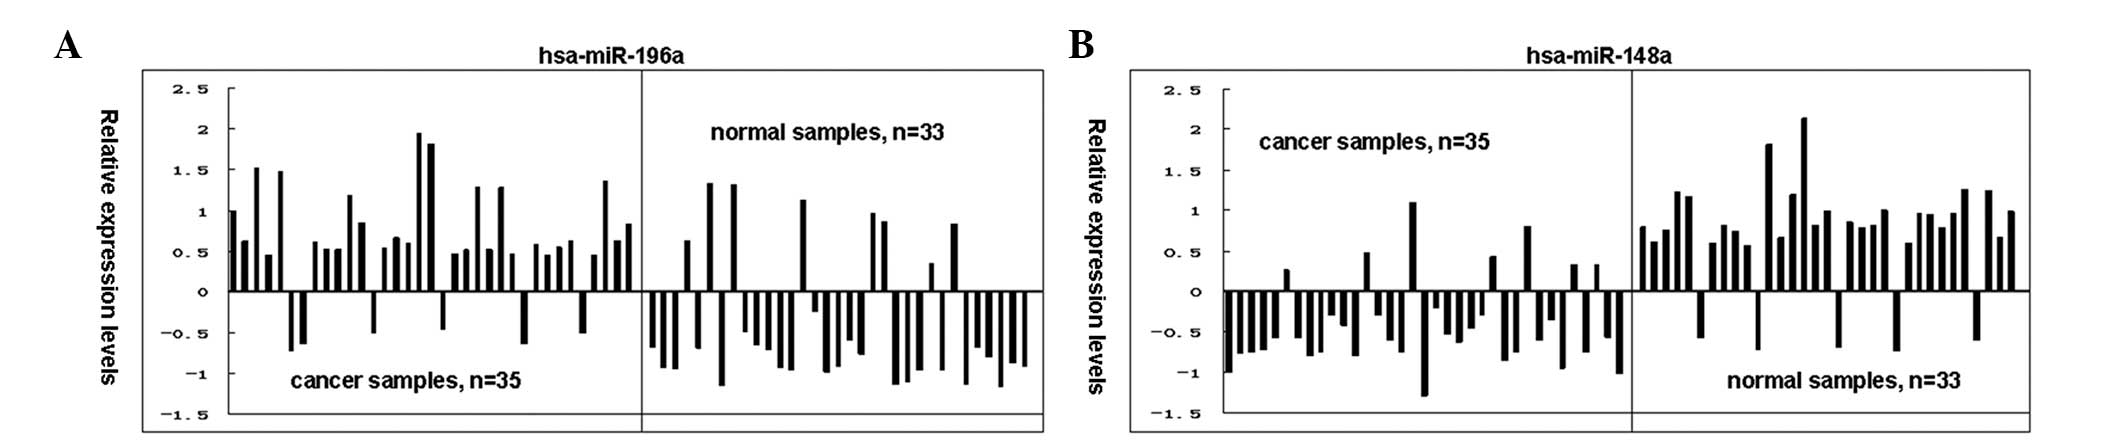
qPCR validation
The relative expression levels of hsa-miR-196a and
hsa-miR-148a were detected in 68 test samples. The relative
expression levels of this group of selected miRNAs obtained from
the microarray data were consistently confirmed using qPCR
analyses. hsa-miR-196a was upregulated in 29 of the 35 GC samples,
with a total positive rate of 82.86%; whereas hsa-miR-196a was
downregulated in 25 of the 33 normal samples, with a positive rate
of 75.76% (Fig. 2A). hsa-miR-148a
was upregulated in 28 of the 33 normal samples, with a positive
rate of 84.85%; while it was downregulated in 28 of the 35 GC
samples, with a positive rate of 80.00% (Fig. 3B).
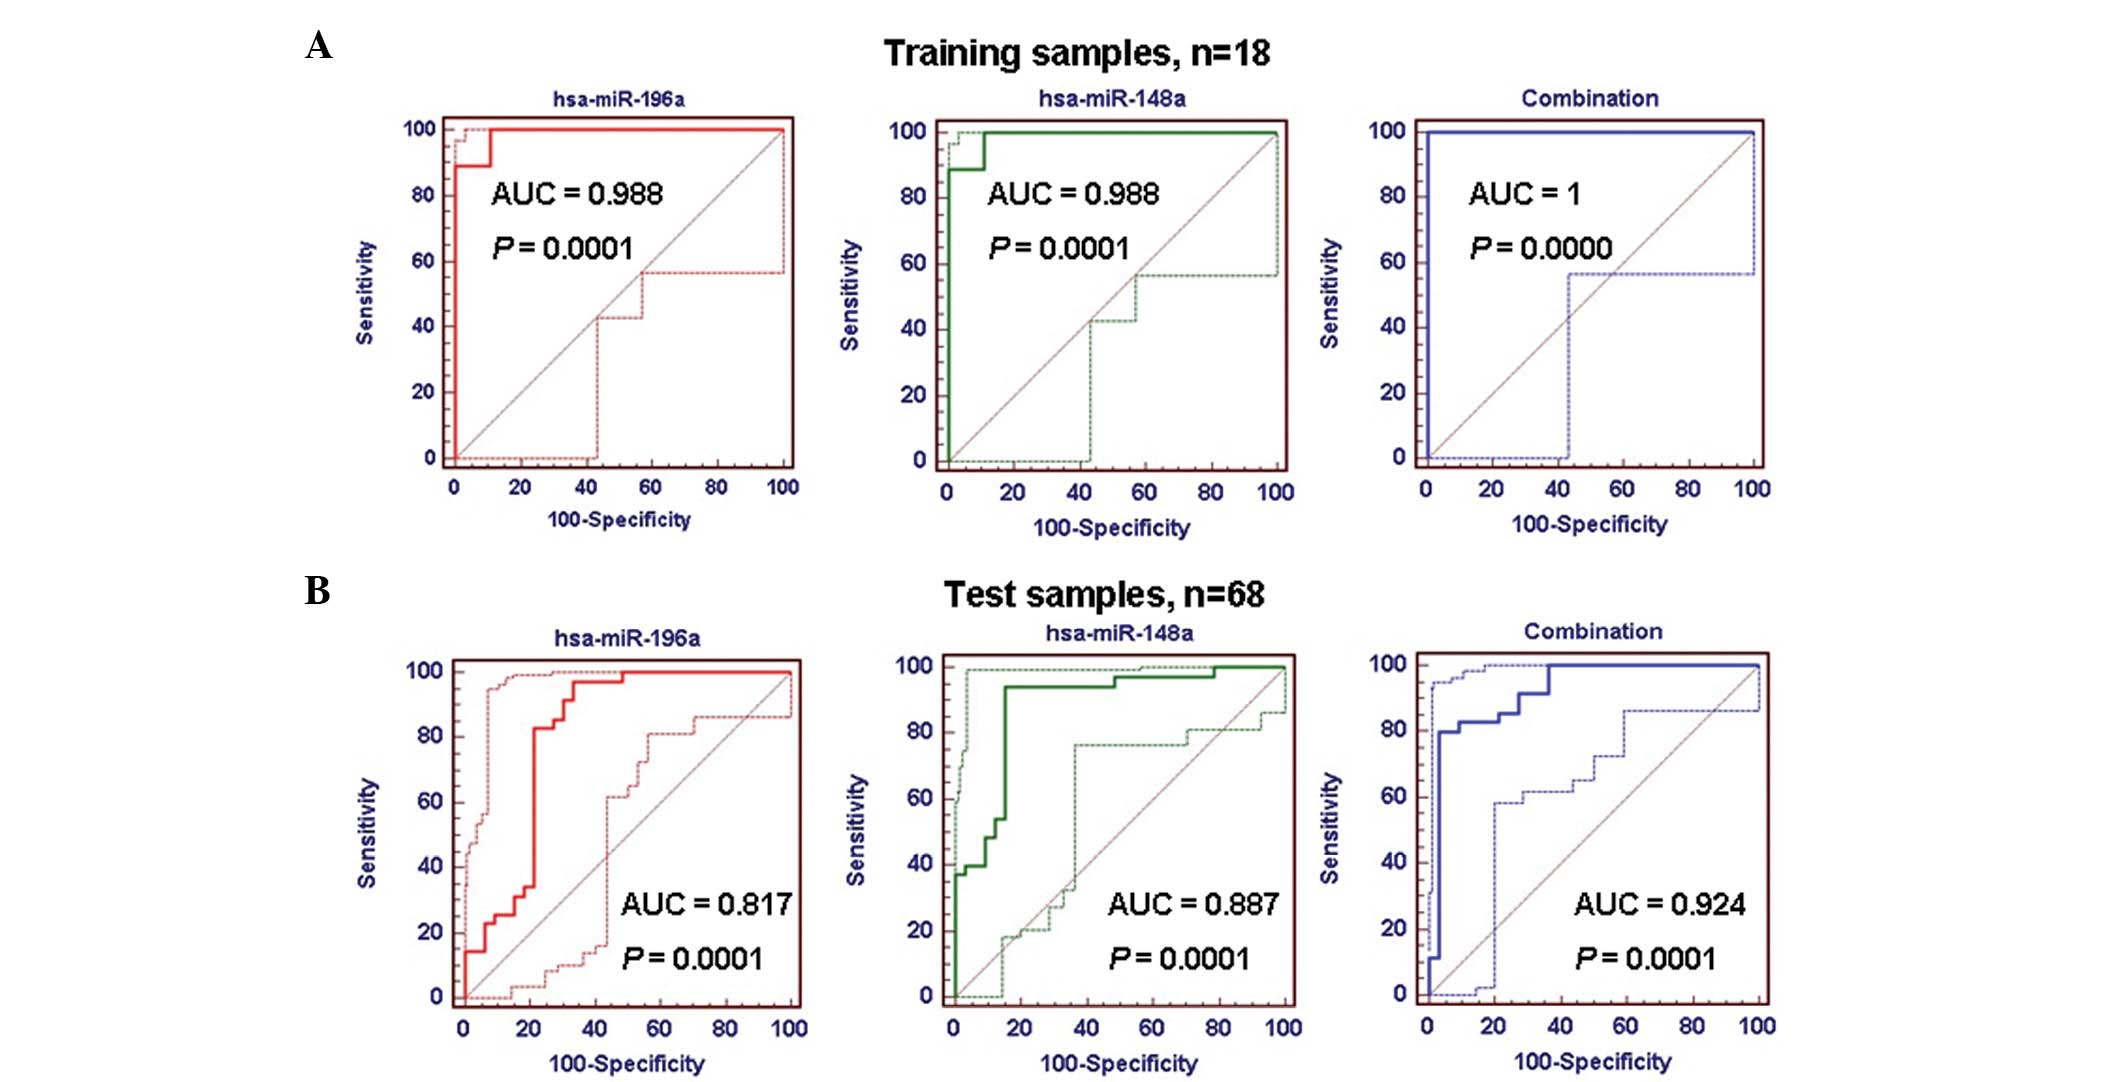
ROC curve analyses
ROC curves were used to analyze the classification
sensitivity and specificity of the candidate biomarkers.
hsa-miR-196a and hsa-miR-148a were combined to form one marker for
this study. The present data revealed that the AUC value of the
marker (combined hsa-miR-196a and hsa-miR-148a) was 1.0 in training
samples, which was higher than that of hsa-miR-196a (0.988) or
hsa-miR-148a (0.988) alone (Table
II; Fig. 3A–C). Similar results
were observed in the test samples; the AUC value of the marker in
the test samples was 0.924, which was higher than that of
hsa-miR-196a (0.817) or hsa-miR-148a (0.887) alone, and was more
sensitive (80%) and specific (96.97%) for the classification of GC
and normal samples (Table II;
Fig. 3D–F).
| Table IIROC curve analyses of the biomarkers
in the training and test samples. |
Table II
ROC curve analyses of the biomarkers
in the training and test samples.
| Samples | Classifiers | Sensitivity (%) | Specificity (%) | AUC | 95% CI | P-value |
|---|
| Training (n=18) | hsa-miR-196a | 100.00 | 88.89 | 0.988 | 0.792–1.000 | 0.0001 |
| hsa-miR-148a | 88.89 | 100.00 | 0.988 | 0.792–1.000 | 0.0001 |
| Combination | 100.00 | 100.00 | 1.000 | 0.575–0.947 | 0.0000 |
| Test (n=68) | hsa-miR-196a | 97.14 | 66.67 | 0.817 | 0.705–0.901 | 0.0001 |
| hsa-miR-148a | 94.29 | 84.85 | 0.887 | 0.787–0.951 | 0.0001 |
| Combination | 80.00 | 96.97 | 0.924 | 0.833–0.974 | 0.0001 |
Signaling pathway analyses
In order to investigate the possible regulatory
mechanisms of hsa-miR-196a and hsa-miR-148a in the process of early
GC, the plausible targets were predicted using a bioinformatics
database (TargetScan 5.2). A total of 211 genes were predicted to
be the target genes of hsa-miR-196a. Signaling pathway analyses
revealed that the majority of the targeted genes that were
regulated by hsa-miR-196a were involved in pathways including ErbB,
mTOR, MAPK, cell cycle, Jak-STAT, p53 and VEGF signaling pathways
(Table III). A total of 536 genes
were predicted to be the target genes of hsa-miR-148a. The targeted
genes that were regulated by hsa-miR-148a were involved in the same
pathways as hsa-miR-196a, with the exception of Wnt and TGF-β
signaling pathways, which were regulated by hsa-miR-148a, but not
by hsa-miR-196a (Table III).
| Table IIISignaling pathway analyses of genes
regulated by hsa-miR-196a and hsa-miR-148a. |
Table III
Signaling pathway analyses of genes
regulated by hsa-miR-196a and hsa-miR-148a.
| hsa-miR-196a | hsa-miR-148a |
|---|
|
|
|
|---|
| Pathway | Gene | q-value | Gene | q-value |
|---|
| ErbB signaling | NRAS, ABL1, CDKN1B,
ABL2 |
3.26×10⁻⁴ | SOS2, TGFA, SOS1,
ERBB3, NRAS, ABL2, PIK3R3, CAMK2A |
2.70×10⁻⁶ |
| mTOR signaling | RICTOR, TSC1,
IGF1 |
8.32×10⁻⁴ | IGF1, RICTOR,
PRKAA1, PDK1, PIK3R3 |
1.26×10⁻⁴ |
| MAPK signaling | NRAS, MAP3K1,
RASGRP1, MAP4K3, PDGFRA |
1.63×10⁻³ | SOS2, GADD45A,
SOS1, MAP3K4, MRAS, NRAS, CDC25B, NLK |
1.97×10⁻³ |
| Cell cycle | ABL1, CDKN1B,
CDC25A |
4.52×10⁻³ | YWHAB, CDC14A,
GADD45A, SKP1, CDK6, SMAD2, CDC25B, E2F3 |
1.90×10⁻⁵ |
| Jak-STAT
signaling | OSMR, SOCS4 |
2.79×10⁻² | SOS2, SOS1, PIK3R3,
SOCS3 |
2.43×10⁻² |
| p53 signaling | IGF1 |
5.43×10⁻² | PTEN, IGF1,
GADD45A, SERPINE1, CDK6 |
4.16×10⁻⁴ |
| VEGF signaling | NRAS |
5.86×10⁻² | NFAT5,
NRAS;PIK3R3 |
1.70×10⁻² |
| Wnt signaling | | | NFAT5, WNT1, ROCK1,
PRICKLE2, TBL1XR1, SKP1, WNT10B, VANGL1, CAMK2A, PSEN1, SMAD2, NLK,
PPARD, |
5.00×10⁻⁹ |
| TGF-β
signaling | | | INHBB, ROCK1, NOG,
ACVR1, SKP1, GDF6, LTBP1, ACVR2B, SMAD2, SP1 |
2.36×10⁻⁸ |
Discussion
High-throughput microarray experiments were the
first step in the present study. The method has developed
significantly and has become a comprehensive technique to aid in
improving the understanding of cancer (18). The detection of all the known and
unknown miRNAs in the human genome was easy in the present study
through the use of microarray. The primary cancer cases were
analyzed in order to identify the candidate biomarkers for early GC
based on the microarray data. Finally, two miRNAs (hsa-miR-196a and
hsa-miR-148a) were grouped as a signature with high sensitivity and
specificity for differentiating between GC and normal samples, and
may be a potential marker for the early diagnosis of GC.
miRNAs range in size from 19–25 nt and are protected
by the RNA-induced silencing complex, which may render them less
susceptible to RNA degradation compared with mRNA in these tissues.
In addition, miRNA expression is able to be detected in blood
samples, which is an excellent source for clinical studies. In the
present study, a concise machine learning algorithm, TSP, was used
for data-mining and selecting feature miRNAs based on the early GC
microarray data. This TSP method has been well-used by other
studies in biomarker identification for human diseases (19). Finally, the candidate biomarkers
were validated in the laboratory by qPCR.
Studies have shown that miR-196a is upregulated in
human cancer, including GC, and promotes the cell proliferation
process (20–22). miR-196a may act as a candidate
biomarker for GC (23). Other
studies have shown miR-196a to contribute to the risk of carcinoma,
metastasis and recurrence and to be associated with risk and
prognosis by the regulation of its target genes (24–26).
The present results are consistent with the majority of studies
that describe miR-196a to be highly expressed in GC. A low
expression of miR-148a has also been confirmed in certain human
cancers and was associated with the cancer patient’s prognosis by
regulating its target genes (27–29).
miR-148a may act as candidate biomarker in human cancer (30,31).
However, no studies are available with regard to the combination of
the two miRNAs as a signature for diagnosis or prognosis in human
cancer. Although the key involvement of miR-196a and miR-148a in GC
are unclear, the present data are encouraging.
The current study revealed that certain
cancer-related pathways, including ErbB, mTOR, MAPK, cell cycle,
Jak-STAT, p53 and VEGF signaling pathways, were regulated by both
miR-196a and miR-148a. However, the present data also revealed that
two significant pathways involved in carcinogenesis, Wnt and TGF-β,
were regulated by miR-148a, but not by miR-196a. These multiple
signal pathway alterations, particularly those that include the Wnt
and TGF-β pathways, may reasonably affect the progress of GC
carcinogenesis. The SMAD2 gene is significant in the two pathways
and was regulated by miR-148a, as shown by the bioinformatics
analyses. Therefore, we propose that miR-148a may be a key
regulator in the development of early GC by regulating the SMAD2
gene and participating in the Wnt and TGF-β pathways. However,
further confirmation of this in the laboratory is required.
In summary, two miRNAs were identified that were
differentially expressed in early GC compared with normal samples.
By combining the two miRNAs as a single signature, differentiating
between cancer and normal samples may be more accurate. The two
miRNAs may act as candidate biomarkers for early GC.
Acknowledgements
This study was supported by the Natural Science
Foundation of Hubei Province (no. 2012FFB06806).
References
|
1
|
Yang L: Incidence and mortality of gastric
cancer in China. World J Gastroenterol. 12:17–20. 2006.
|
|
2
|
Japanese Gastric Cancer Association.
Japanese Classification of Gastric Carcinoma - 2nd English Edition.
Gastric Cancer. 1:10–24. 1998. View Article : Google Scholar : PubMed/NCBI
|
|
3
|
Shiozawa N, Kodama M, Chida T, Arakawa A,
Tur GE and Koyama K: Recurrent death among early gastric cancer
patients: 20 years’ experience. Hepatogastroenterology. 41:244–247.
1994.
|
|
4
|
Kim JP, Hur YS and Yang HK: Lymph node
metastasis as a significant prognostic factor in early gastric
cancer: analysis of 1,136 early gastric cancers. Ann Surg Oncol.
2:308–313. 1995. View Article : Google Scholar
|
|
5
|
Degiuli M and Calvo F: Survival of early
gastric cancer in a specialized European center. Which
lymphadenectomy is necessary? World J Surg. 30:2193–2203. 2006.
View Article : Google Scholar
|
|
6
|
Smith JW, Shiu MH, Kelsey L and Brennan
MF: Morbidity of radical lymphadenectomy in the curative resection
of gastric cancer. Arch Surg. 126:1469–1473. 1991. View Article : Google Scholar : PubMed/NCBI
|
|
7
|
Crispi S, Calogero RA, Santini M, et al:
Global gene expression profiling of human pleural mesotheliomas:
identification of matrix metalloproteinase 14 (MMP-14) as potential
tumour target. PLoS One. 4:e70162009. View Article : Google Scholar
|
|
8
|
Guo RF, Zang SZ, Fang JY, et al:
Identification of biomarkers for early detection in gastric cancer
and its clinical biological significance. Beijing Da Xue Xue Bao.
41:353–360. 2009.(In Chinese).
|
|
9
|
Fèvre-Montange M, Champier J, Durand A, et
al: Microarray gene expression profiling in meningiomas:
differential expression according to grade or histopathological
subtype. Int J Oncol. 35:1395–1407. 2009.
|
|
10
|
Yoshihara K, Tajima A, Komata D, et al:
Gene expression profiling of advanced-stage serous ovarian cancers
distinguishes novel subclasses and implicates ZEB2 in tumour
progression and prognosis. Cancer Sci. 100:1421–1428. 2009.
View Article : Google Scholar
|
|
11
|
Lau SK, Boutros PC, Pintilie M, et al:
Three-gene prognostic classifier for early-stage non small-cell
lung cancer. J Clin Oncol. 25:5562–5569. 2007. View Article : Google Scholar : PubMed/NCBI
|
|
12
|
Zervakis M, Blazadonakis ME, Tsiliki G, et
al: Outcome prediction based on microarray analysis: a critical
perspective on methods. BMC Bioinformatics. 10:532009. View Article : Google Scholar : PubMed/NCBI
|
|
13
|
Yan Z, Xiong Y, Xu W, et al:
Identification of hsa-miR-335 as a prognostic signature in gastric
cancer. PLoS One. 7:e400372012. View Article : Google Scholar : PubMed/NCBI
|
|
14
|
Chen C, Ridzon DA, Broomer AJ, et al: Real
time quantification of microRNAs by stem-loop RT-PCR. Nucleic Acids
Res. 33:e1792005. View Article : Google Scholar : PubMed/NCBI
|
|
15
|
Livak KJ and Schmittgen TD: Analysis of
relative gene expression data using real-time quantitative PCR and
the 2(−Delta Delta C(T)) Method. Methods. 25:402–408. 2001.
|
|
16
|
Tusher VG, Tibshirani R and Chu G:
Significance analysis of microarrays applied to transcriptional
responses to ionizing radiation. Proc Natl Acad Sci USA.
98:5116–5121. 2001. View Article : Google Scholar : PubMed/NCBI
|
|
17
|
Tan AC, Naiman DQ, Xu L, et al: Simple
decision rules for classifying human cancers from gene expression
profiles. Bioinformatics. 21:3896–3904. 2005. View Article : Google Scholar : PubMed/NCBI
|
|
18
|
Liang RQ, Li W, Li Y, et al: An
oligonucleotide microarray for microRNA expression analysis based
on labeling RNA with quantum dot and nanogold probe. Nucl Acids
Res. 33:e172005. View Article : Google Scholar : PubMed/NCBI
|
|
19
|
Price ND, Trent J, El-Naggar AK, et al:
Highly accurate two-gene classifier for differentiating
gastrointestinal stromal tumors and leiomyosarcomas. Proc Natl Acad
Sci USA. 104:3414–3419. 2007. View Article : Google Scholar
|
|
20
|
Sun M, Liu XH, Li JH, et al: MiR-196a is
upregulated in gastric cancer and promotes cell proliferation by
downregulating p27(kip1). Mol Cancer Ther. 11:842–852. 2012.
View Article : Google Scholar : PubMed/NCBI
|
|
21
|
Niinuma T, Suzuki H, Nojima M, et al:
Upregulation of miR-196a and HOTAIR drive malignant character in
gastrointestinal stromal tumors. Cancer Res. 72:1126–1136. 2012.
View Article : Google Scholar : PubMed/NCBI
|
|
22
|
Schimanski CC, Frerichs K, Rahman F, et
al: High miR-196a levels promote the oncogenic phenotype of
colorectal cancer cells. World J Gastroenterol. 15:2089–2096. 2009.
View Article : Google Scholar : PubMed/NCBI
|
|
23
|
Kong X, Du Y, Wang G, et al: Detection of
differentially expressed microRNAs in serum of pancreatic ductal
adenocarcinoma patients: miR-196a could be a potential marker for
poor prognosis. Dig Dis Sci. 56:602–609. 2011. View Article : Google Scholar
|
|
24
|
Wang K, Li J, Guo H, et al: MiR-196a
binding-site SNP regulates RAP1A expression contributing to
esophageal squamous cell carcinoma risk and metastasis.
Carcinogenesis. 33:2147–2154. 2012. View Article : Google Scholar : PubMed/NCBI
|
|
25
|
Tsai KW, Liao YL, Wu CW, et al: Aberrant
expression of miR-196a in gastric cancers and correlation with
recurrence. Genes Chromosomes Cancer. 51:394–401. 2012. View Article : Google Scholar : PubMed/NCBI
|
|
26
|
Christensen BC, Avissar-Whiting M, Ouellet
LG, et al: Mature microRNA sequence polymorphism in MIR196A2 is
associated with risk and prognosis of head and neck cancer. Clin
Cancer Res. 16:3713–3720. 2010. View Article : Google Scholar : PubMed/NCBI
|
|
27
|
Song YX, Yue ZY, Wang ZN, et al:
MicroRNA-148b is frequently down-regulated in gastric cancer and
acts as a tumor suppressor by inhibiting cell proliferation. Mol
Cancer. 10:12011. View Article : Google Scholar : PubMed/NCBI
|
|
28
|
Zhou X, Zhao F, Wang ZN, Song YX, Chang H,
Chiang Y and Xu HM: Altered expression of miR-152 and miR-148a in
ovarian cancer is related to cell proliferation. Oncol Rep.
27:447–454. 2012.PubMed/NCBI
|
|
29
|
Zheng B, Liang L, Wang C, et al:
MicroRNA-148a suppresses tumor cell invasion and metastasis by
downregulating ROCK1 in gastric cancer. Clin Cancer Res.
17:7574–83. 2011. View Article : Google Scholar : PubMed/NCBI
|
|
30
|
Schultz NA, Andersen KK, Roslind A,
Willenbrock H, Wøjdemann M and Johansen JS: Prognostic microRNAs in
cancer tissue from patients operated for pancreatic cancer - five
microRNAs in a prognostic index. World J Surg. 36:2699–2707. 2012.
View Article : Google Scholar
|
|
31
|
Takahashi M, Cuatrecasas M, Balaguer F, et
al: The clinical significance of MiR-148a as a predictive biomarker
in patients with advanced colorectalcancer. PLoS One. 7:e466842012.
View Article : Google Scholar : PubMed/NCBI
|