Introduction
Tumor invasion and metastasis is a complex process
in which tumor cells lose their cell-cell adhesion, penetrate the
basement membrane and extracellular matrix (ECM) at the primary
site to enter the blood circulation, and then evade immune
surveillance and migrate to other areas of the body to continue
growing (1). When cellular signal
transduction is normal, signal transducer and activator of
transcription (STAT)-3 is under multi-level control by multiple
factors, its signaling strength and dynamics maintain specificity
(2) and its activation is rapid and
transient. In tumor cells, there is continuous STAT-3 activation,
resulting in disordered janus tyrosine kinase (JAK)-STAT signal
transduction, which is typical of tumor cells during invasion and
metastasis (3). STAT-3 may be
activated by a variety of cytokines, in particular, those in the
interleukin (IL)-6 family, such as gp130 (4). Jenkins et al (5) found that STAT-3 deletion mutants
completely reversed the splenomegaly, hepatic acute phase reaction,
abnormal lymphocyte activation and spontaneous gastric antrum
cancer observed in gp130 mutant mice, demonstrating that the
sustained activation of STAT-3 is important for the abnormal
proliferation of a variety of cells. Haura et al (6) showed that the expression of the STAT-3
mutant, STAT-3-C (with cysteine substitutions at amino acids at
A661 and N663), is carcinogenic, further confirming that the
sustained activation of STAT-3 leads to cell transformation, which
is closely associated with human carcinogenesis. In the present
study, the diethylnitrosamine (DEN)-induced rat liver cancer model
was used to simulate the induction and development of human liver
cancer. The expression of STAT-3 was observed and the correlation
between tumor metastasis, invasion, angiogenesis and immune escape,
and the expression of the matrix metalloproteinase (MMP)-10,
vascular endothelial growth factor (VEGF), kinase insert domain
receptor (KDR), hypoxia inducible factor (HIF)-1α, basic fibroblast
growth factor (bFGF) and IL-10 proteins was investigated.
Elucidating the mechanisms of liver carcinogenesis and progression
may contribute to the prevention of this disease and the
development of targeted therapy.
Material and methods
Rat liver cancer model
A total of 136 male five-week-old Wistar rats
[SCXK-(Ji) 2007-0003; Experimental Animal Center of Bethune Medical
College of Jilin University, Certificate of Conformity, Yanji,
Jilin, China], weighing of 140–160 g, which had been fed stably for
seven days, were divided into experimental and control groups.
Sterile drinking water containing 0.01% DEN (purity 99.9%;
Sigma-Aldrich, St. Louis, MO, USA) was provided ad libitum
to the experimental group (n=120). This was replaced every day.
After five weeks, with DEN-free water was provided for three weeks,
followed by 0.01% DEN solution for 12 weeks and then complete
withdrawal of the drug. DEN-free sterilized drinking water was
provided to the control group (n=16) for the entire study duration.
A total of 15 experimental rats were sacrificed at 4, 8, 12, 16, 18
and 20 weeks post-treatment, respectively, with two control rats of
the same age also sacrificed at each time-point. The study was
approved by the ethics committee of Yanbian University (Yanji,
China).
Specimen collection and processing
The appearance, color and texture of the rat livers
were recorded. Certain sections of the liver or liver cancer
tissues were fixed in 4% paraformaldehyde (Jinzhou Chemical Reagent
Plant, Dalian, China), paraffin-embedded and sectioned for
hematoxylin and eosin staining (Shengyang Chemical Reagents
Factory, Shenyang, China). Additional sections of the liver or the
liver cancer tissues (1×1×1 mm) were fixed in 2.5% glutaraldehyde
(Shengyang Chemical Reagents Factory) at 4°C, rinsed twice in
phosphate-buffered saline (0.1 mol/l) and fixed in 1.0% osmium
tetroxide (Huaye Chemical Industry Co., Ltd., Beijing, China). The
samples were then embedded in EPON812 (Sigma-Aldrich) in order to
generate ultra-thin sections, which were double-stained with uranyl
acetate (Sigma-Aldrich) and lead citrate, and then observed using a
JEM1200EX transmission electron microscope (JEOL, Tokyo,
Japan).
Western blotting
The liver and tumor tissues were lysed in lysis
buffer (Pierce Biotechnology, Inc., Rockford, IL, USA) and
centrifuged at 12,000 × g for 15 min. The protein concentration was
determined using the bicinchoninic acid kit (Pierce Biotechnology,
Inc.) according to the manufacturer’s instructions. A 70-μg protein
sample was fractionated by 10% sodium dodecyl sulfate
polyacrylamide gel electrophoresis and then transferred to a
polyvinylidene fluoride membrane (Pall Corporation, Port
Washington, NY, USA). Subsequent to blocking the membranes for 1 h
with 5% milk in Tris-buffered saline and Tween-20, the primary
antibodies, rabbit monoclonal anti-MMP-10, -VEGF, -KDR, -HIF-1α,
-bFGF and -IL-10, and rabbit monoclonal anti-STAT-3 (1:400;
catalogue number: BA0621, Boshide Biotech Co. Ltd., Wuhan, China)
and -phosphorylated (p)-STAT-3 (1:400; Boshide Biotech Co. Ltd.,
Wuhan, China), were added and incubated at 4°C overnight. Following
incubation with goar anti-rabbit IgG peroxidase-labeled secondary
antibodies (1:5,000; catalogue number: BA1055, Boshide Biotech Co.
Ltd.) the proteins were visualized by chemiluminescence. The
intensity of the protein bands was quantitatively determined using
an ultraviolet crosslinker (Bio-Rad, Hercules, CA, USA) and
normalized with the intensity of the actin band in each gel.
Quantitative polymerase chain reaction
(qPCR)
The RNeasy Plus Mini Kit (Qiagen) was used according
to the manufacturer’s instructions to extract total RNA from the
tumors. cDNA was generated with the iScript Select cDNA Synthesis
kit (Qiagen) and then analyzed by qPCR using SyberGreen qPCR primer
assays (Qiagen, Hilden, Germany) and the iCycler iQ Multicolor
Real-Time PCR Detection System (Qiagen). The relative expression
levels were normalized against β-actin expression, which was run
simultaneously as a reference control. The primers used are listed
in Table I.
 | Table IPrimers used in the present study. |
Table I
Primers used in the present study.
| Target gene | Sequence (5′-3′) | Product length,
bp |
|---|
| β-actin | F:
GCAGAAGGAGATTACTGCCCT
R: GCTGATCCACATCTGCTGGAA | 136 |
| STAT-3 | F:
CAGCCTGTCGCAGAGTTCA
R: GGAGATCACCACAACTGGCA | 190 |
| MMP10 | F:
GGCCCACTCTTCCTTCAGAC
R:GAGTGTGGATCCCCTTTGGG | 138 |
| VEGF | F:
CAAACCTCACCAAAGCCAGC
R: GCGCTTTCGTTTTTGACCCT | 139 |
| KDR | F:
TGGGCAGTCAAGTCCGAATC
R: GTTGGTGAGGATGACCGTGT | 176 |
| bFGF | F:
GCCAACCGGTACCTTGCTAT
R: GTCCCGTTTTGGATCCGAGT | 187 |
| HIF-1α | F:
GCCTTAACCTGTCTGCCACT
R: GCTGCTTGAAAAAGGGAGCC | 133 |
| IL-10 | F:
CAGAGAAGCATGGCCCAGAA
R: GCTCCACTGCCTTGCTCTTA | 129 |
Statistical analysis
Data are presented as the mean ± standard deviation.
One-way analysis of variance and independent t-tests of the sample
pairs were used, and all data analyses were performed using SPSS
version 13.0 software (SPSS, Inc., Chicago, IL, USA). Bivariate
correlation analysis was used to analyze the correlation data.
P<0.05 was considered to indicate a statistically significant
difference.
Results
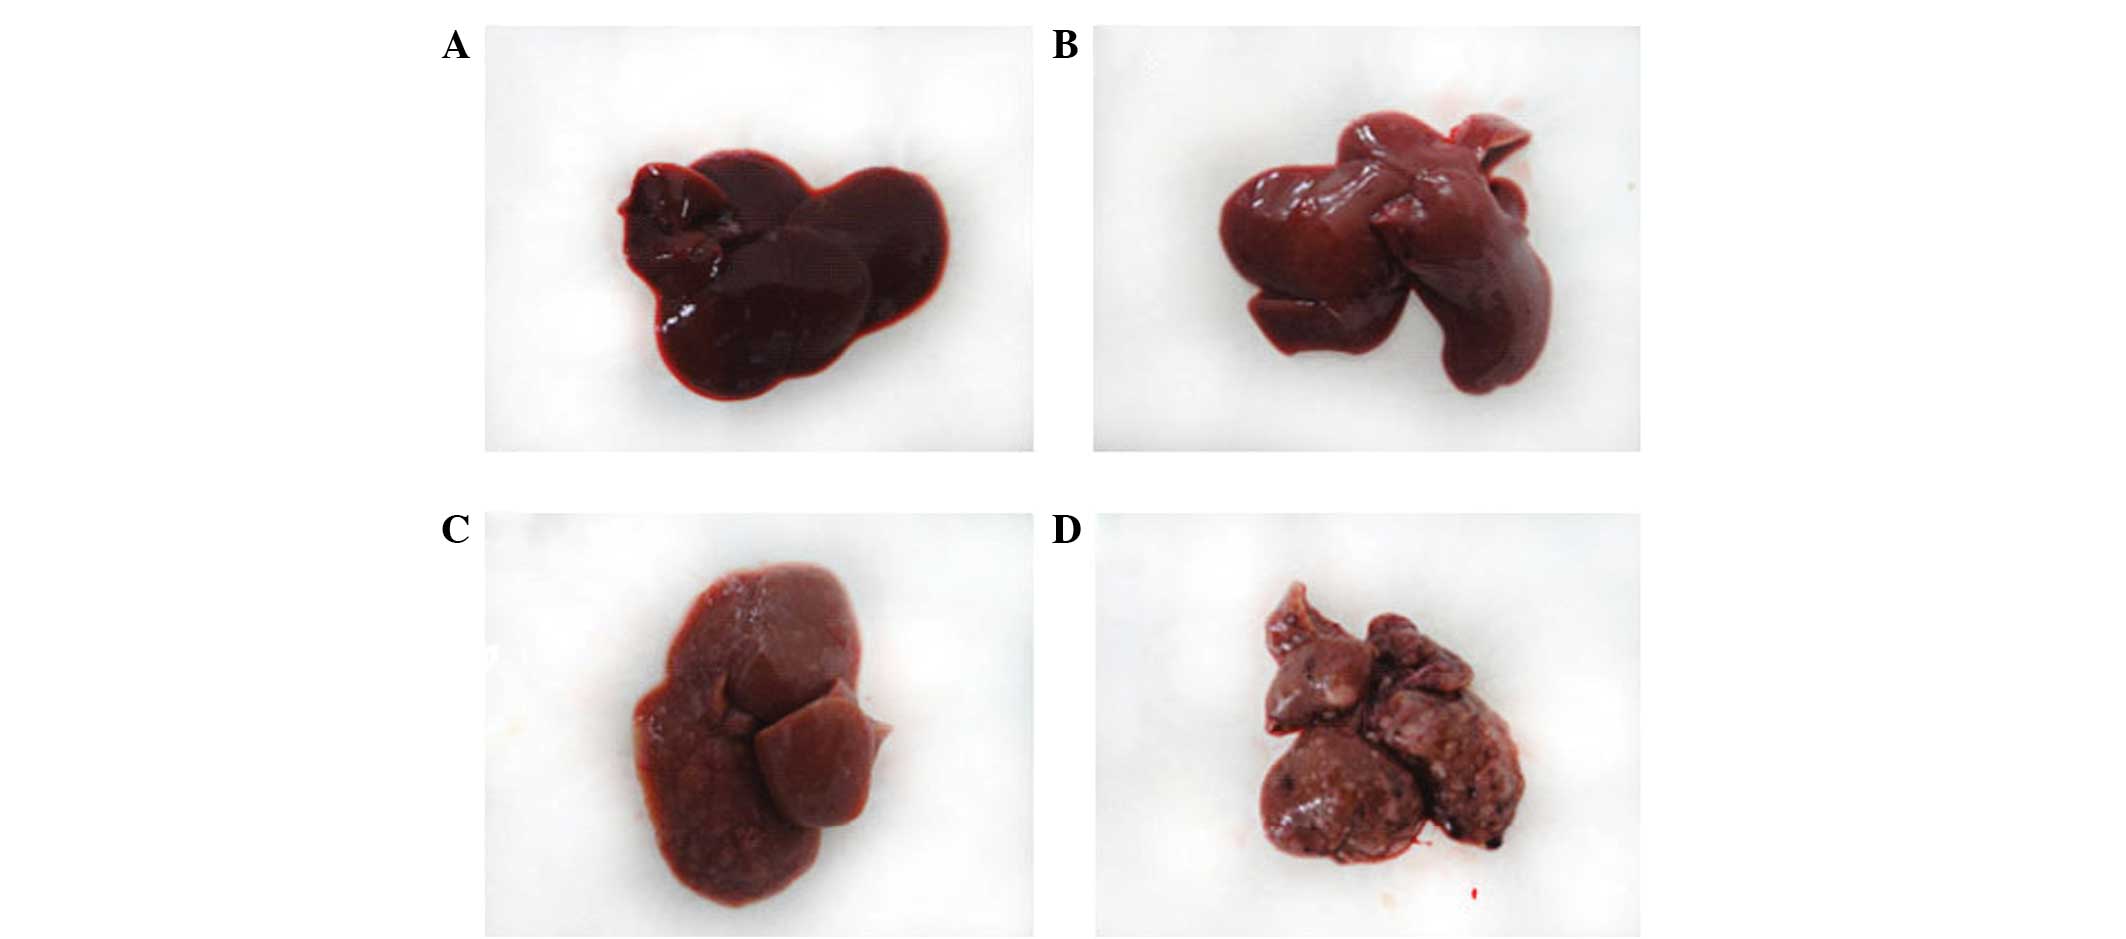
Rat liver pathology
The surface of the liver of the control rats was
brown, soft in texture and smooth, with an evident gloss (Fig. 1A). Light microscopy revealed that
the structure of the hepatic lobule was complete, with hepatocytes
arranged in neat rows and with clear nuclei (Fig. 2A). In addition, electron microscopy
revealed a regular, rounded or oval cell morphology, and a normal
nucleus to cytoplasm ratio. Abundant cytoplasmic organelles were
present, and the mitochondria, rough and smooth endoplasmic
reticulum and Golgi complex were well developed (Fig. 3A).
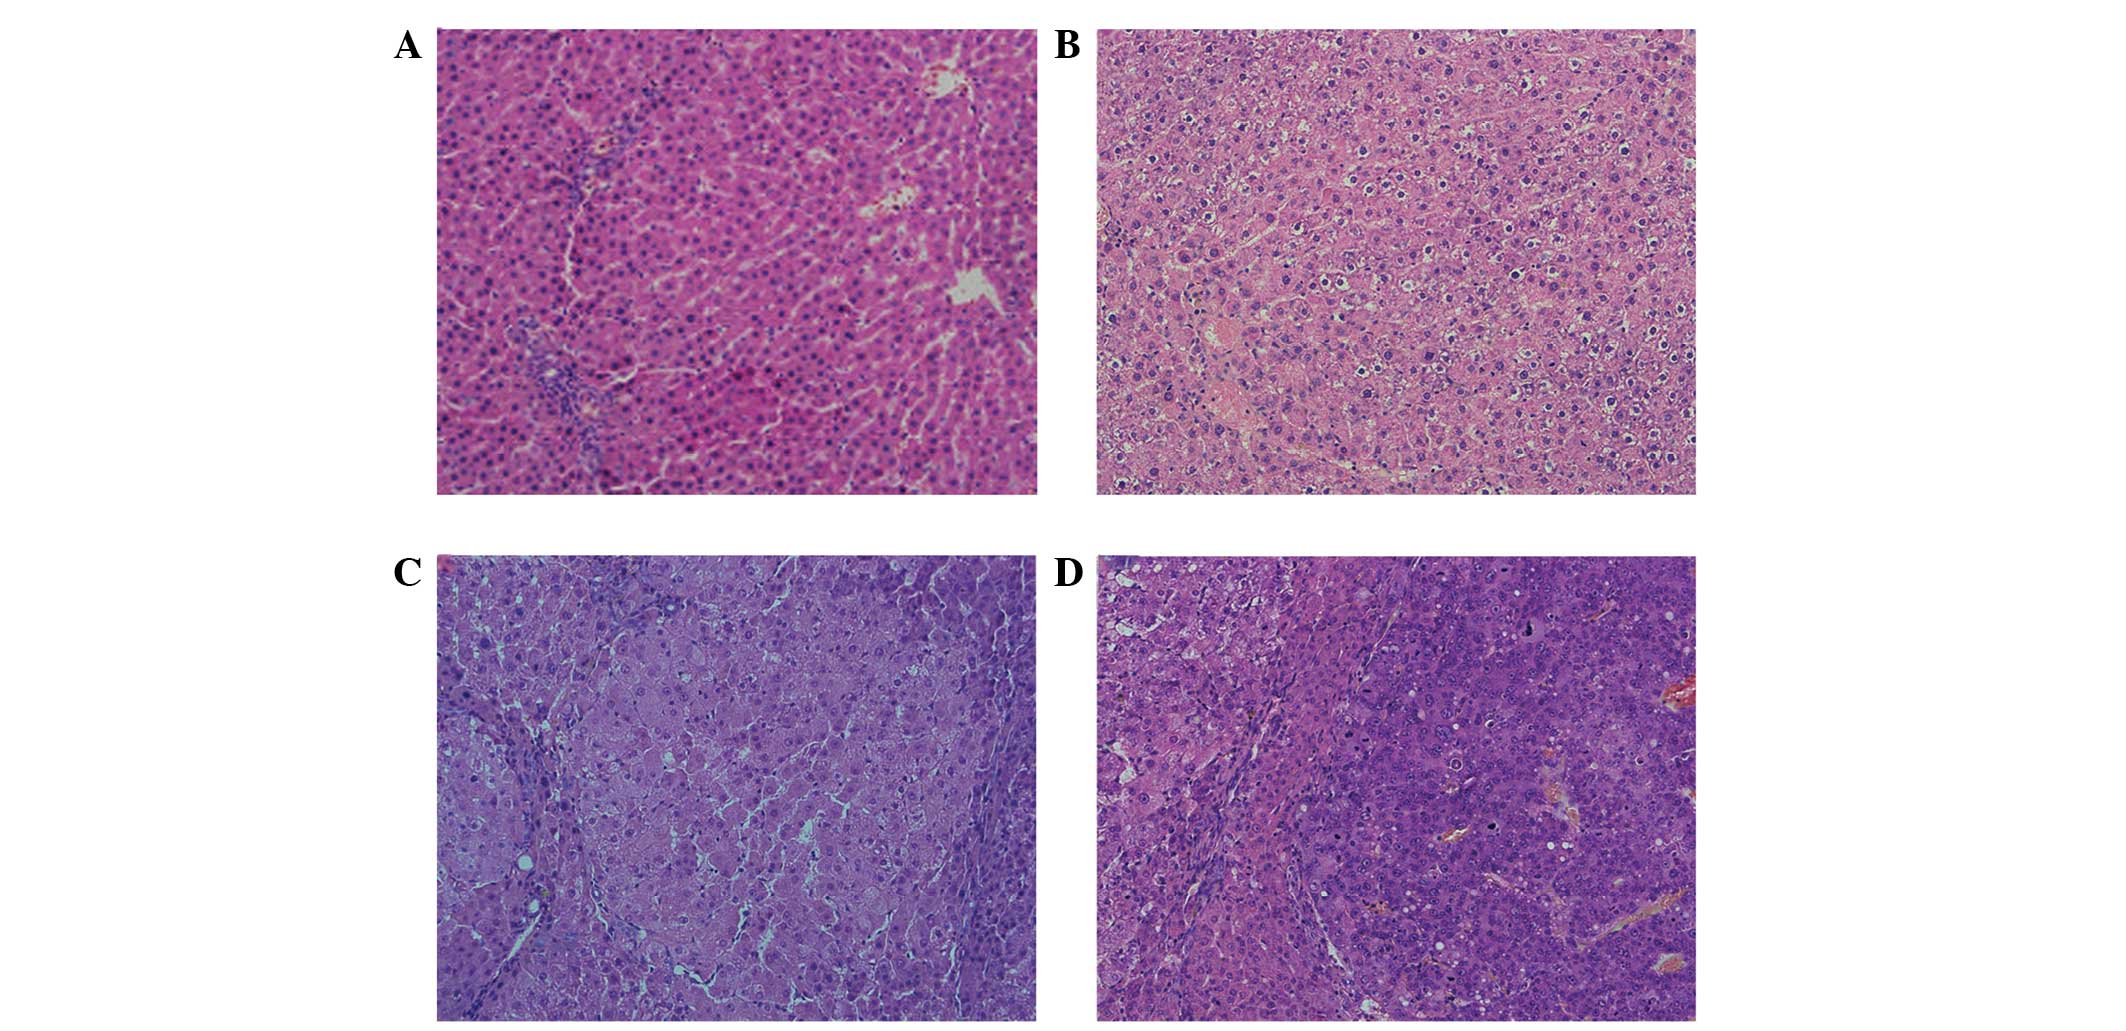 | Figure 2Changes in liver tissue during the
development of diethylnitrosamine (DEN)-induced rat liver cancer,
as observed by light microscopy (stain, hematoxylin and eosin;
magnification, ×200). (A) Normal group, the architecture of the
hepatic lobes is complete, with hepatocytes arranged in neat rows
and the clear cell nuclei. (B) Experimental group (early
carcinogenesis; 1–8 weeks), the architecture of the hepatic lobes
is complete, and there is visible intralobular focal necrosis with
infiltrating inflammatory cells. (C) Experimental group (interim
carcinogenesis: 9–15 weeks), the architecture of the hepatic lobes
is damaged and the hepatocytes are proliferating, accompanied by
severe steatosis and the formation of visible pseudolobules. (D)
Experimental group (late carcinogenesis; 16–20 weeks), the cancer
cells exhibit evident atypia, with abnormally large nuclei and
diminished cytoplasm. |
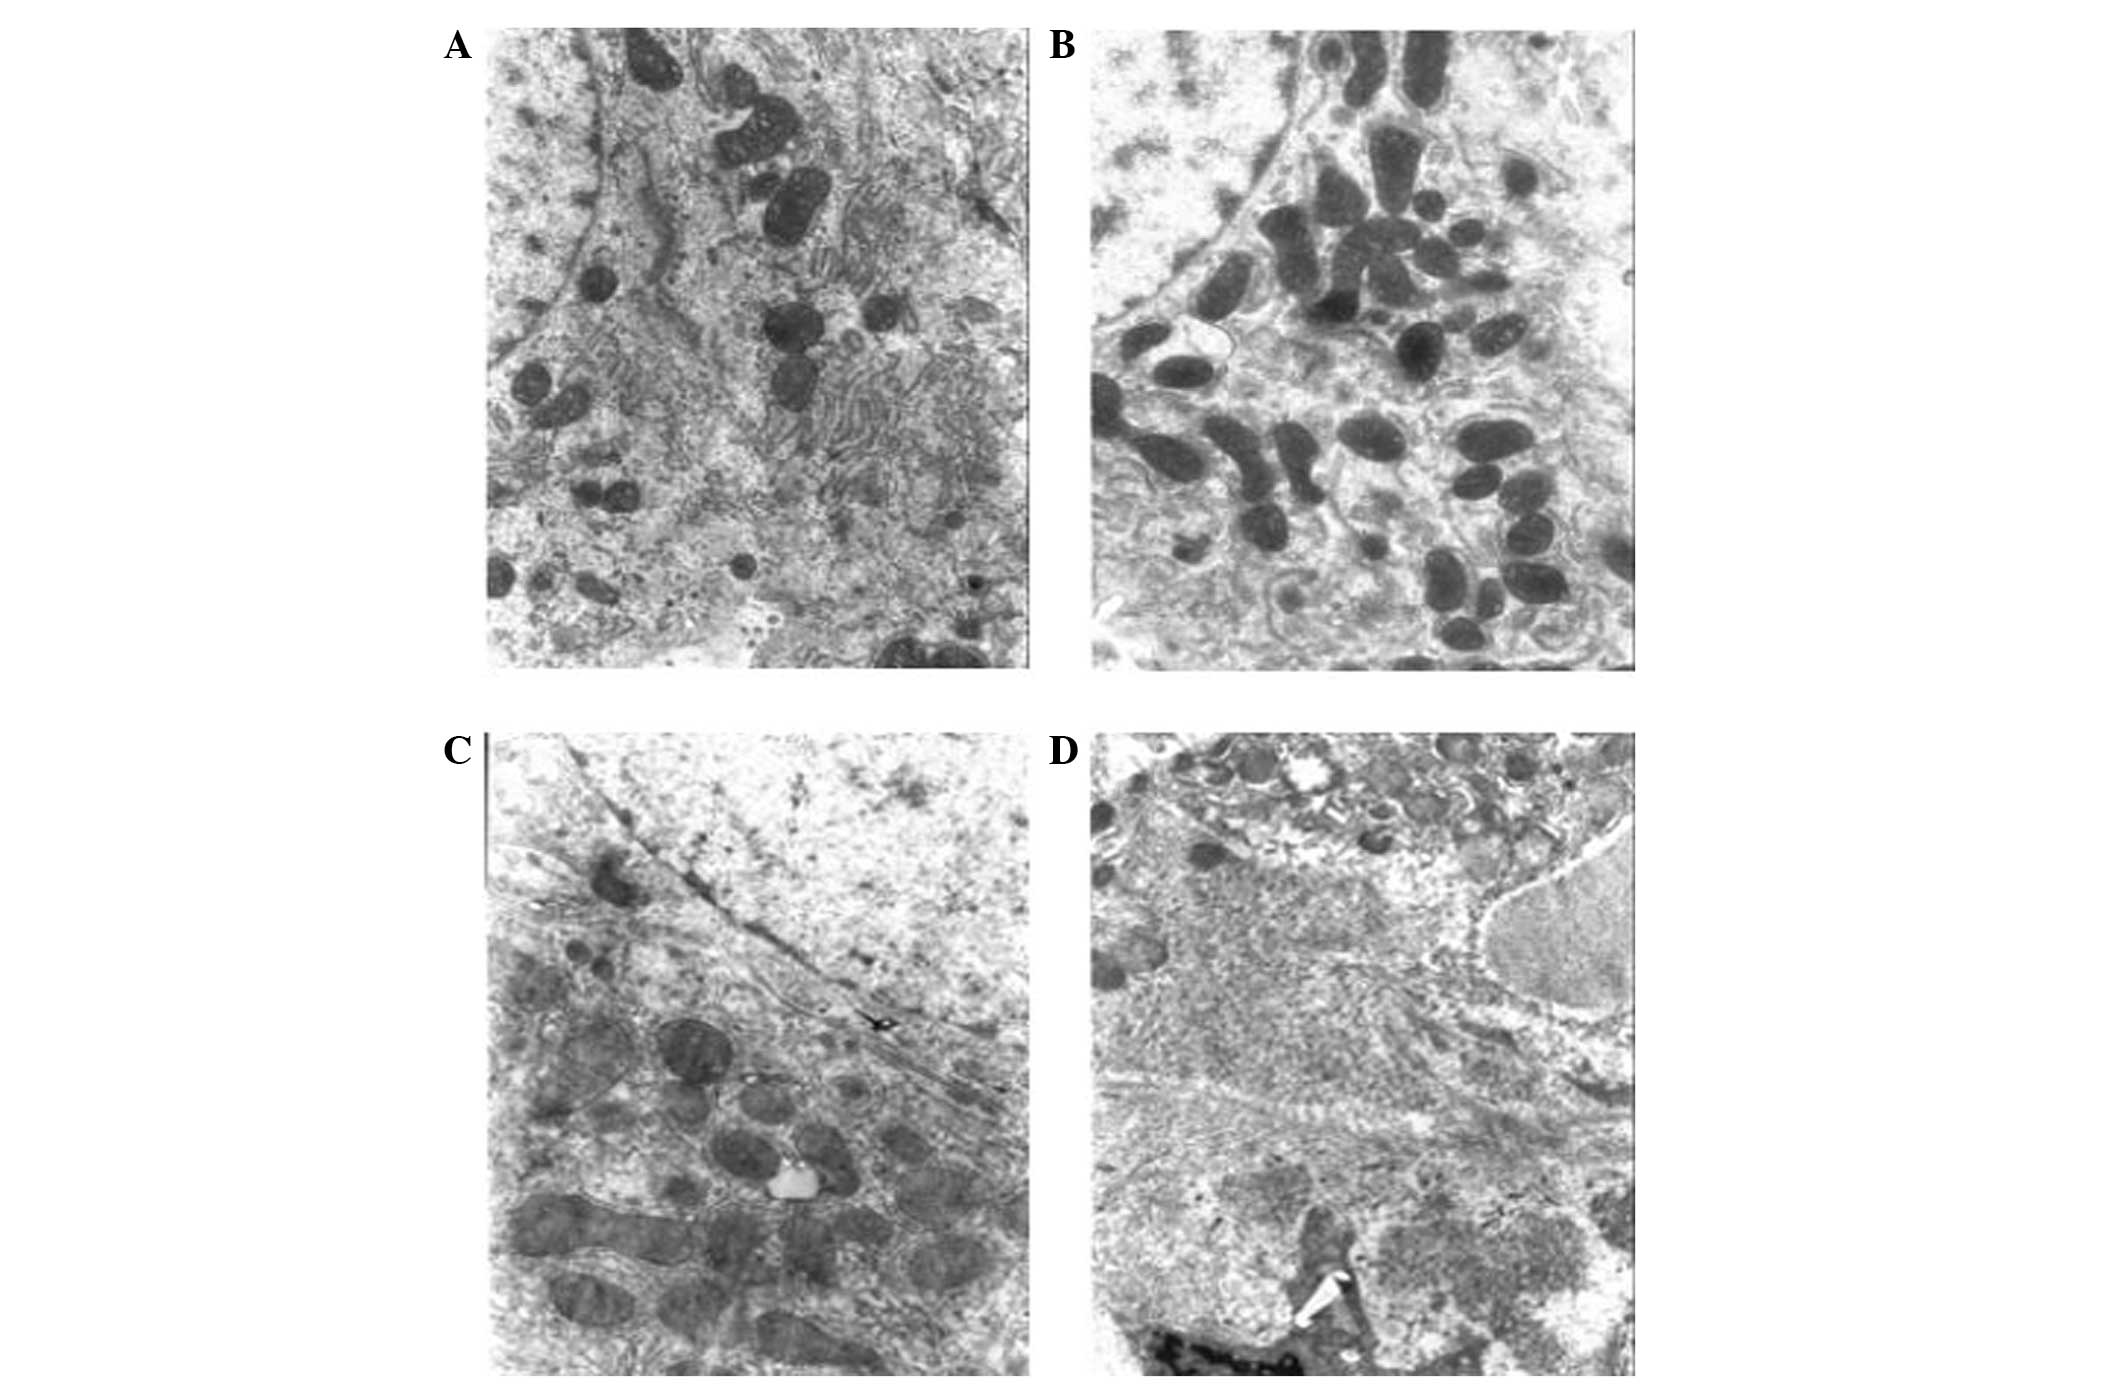 | Figure 3Changes in liver tissue in
diethylnitrosamine (DEN)-induced rat liver cancer observed by
electron microscopy (magnification, ×6,000). (A) Normal group, the
hepatocytes are round or oval and in regular arrays, the ratio of
nucleus to cytoplasm is normal and cytoplasmic organelles are
abundant. (B) Experimental group (early carcinogenesis; 1–8 weeks),
the hepatocytes are swollen, with swollen mitochondria. The
granular matrix has disappeared and granulovacuolar degeneration
can be observed. (C) Experimental group (interim carcinogenesis;
9–15 weeks), hepatocyte chromatin is aggregated, the number of
mitochondria has increased, the cristae of the mitochondria are
disrupted, the rough endoplasmic reticulum is dilated, the nuclear
membrane is uneven and the nucleolus has moved to the side of the
cell. (D) Experimental group (late carcinogenesis; 16–20 weeks),
the hepatocyte nuclei are larger, the number of mitochondria is
reduced, the structure of the mitochondria is disrupted, the rough
endoplasmic reticulum has lost its layered structure, the plasma
membrane is fragmented and the ribosomes have separated from the
rough endoplasmic reticulum. |
The experimental rat liver pathology may be divided
into three temporal stages: The early carcinogenesis-hepatocyte
injury period at 1–8 weeks, the interim carcinogenesis-sclerosis
period at 9–15 weeks and the late carcinogenesis-cancer period at
16–20 weeks. In the early carcinogenesis-hepatocyte injury period,
the appearance of the liver was not evidently abnormal (Fig. 1B); when observed by light
microscopy, the architecture of the hepatic lobes was complete,
however, ballooning degeneration was exhibited by certain cells.
Visible intralobular focal necrosis with inflammatory cell
infiltration, and gradual emergence of fibrous tissue proliferation
and the regeneration of hepatocytes were identified (Fig. 2B). In addition, electron microscopy
revealed swelling hepatocytes, with swelling mitochondria and the
disappearance of the granular matrix, which was accompanied by
granulovacuolar degeneration (Fig.
3B). In the interim carcinogenesis-sclerosis period at 9–15
weeks, the surface of the liver gradually roughened, and varying
numbers of large and small gray lesions appeared (Fig. 1C). Furthermore, light microscopy
revealed that the normal lobular structure had been destroyed, the
hepatocytes had been replaced by fibrous tissue and the typical
pseudolobular structure had formed (Fig. 2C). Additionally, electron microscopy
revealed aggregated hepatocyte chromatin, an increased number of
mitochondria, disrupted mitochondrial cristae, dilated rough
endoplasmic reticulum, an uneven nuclear membrane and nucleoli that
had moved to the edges of the cells (Fig. 3C). In the late carcinogenesis-cancer
period at 16–20 weeks, the surface of the liver was covered with
multiple large and small nodules (Fig.
1D). Furthermore, light microscopy revealed that the cancer
cells exhibited evident atypia, with larger nuclei and less
cytoplasm than normal. A number of monocytes and mitotic figures
were also identified (Fig. 2D).
Additionally, electron microscopy revealed hepatocyte nuclei of
increased size, decreased numbers of mitochondria, a disrupted
mitochondrial structure, loss of the layered structure of the rough
endoplasmic reticulum, plasma membrane fragmentation and
dissociation of the ribosomes from the endoplasmic reticulum
(Fig. 3D).
Sustained expression of STAT-3 and the
expression of MMP-10, VEGF, KDR, HIF-1α, bFGF and IL-10
Expression of STAT-3 and p-STAT-3 increased
marginally in early carcinogenesis (4–8 weeks), while in middle-
and late-stage (post-12 weeks) carcinogenesis, the expression
gradually increased. A significant difference was identified
(P<0.01) when compared with the normal group (week 0). The
expression of MMP-10, VEGF, KDR, HIF-1α, bFGF and IL-10 was
consistent with the changes in the expression of STAT-3 and
p-STAT-3.
The western blotting results are shown in Fig. 4A and B. Correlation analysis
revealed that changes in the expression of the STAT-3 and p-STAT-3
proteins positively correlated with the expression of the MMP-10,
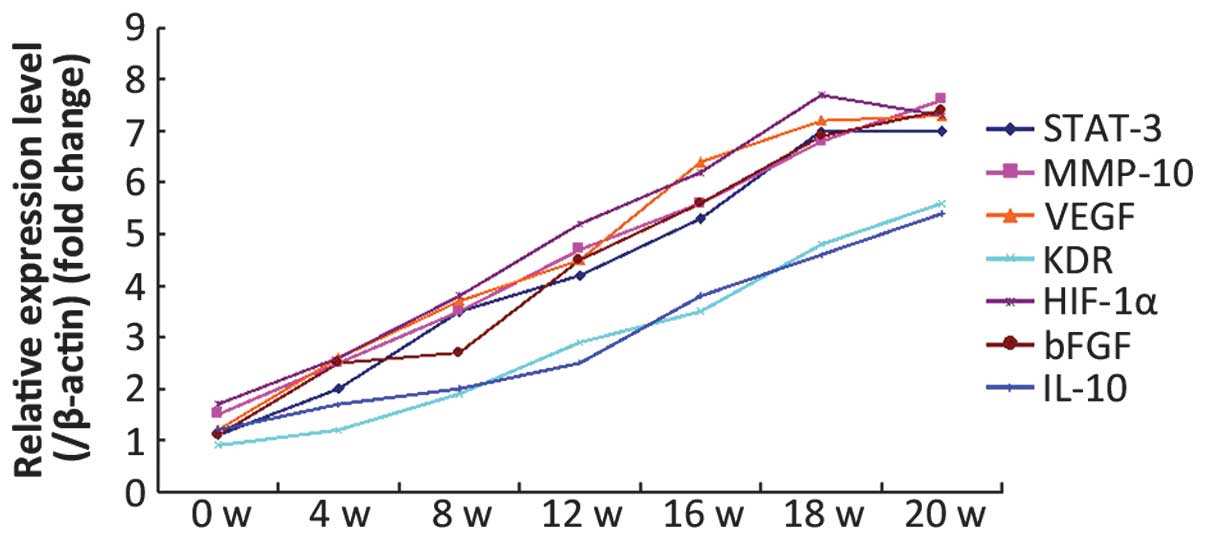
VEGF, KDR, HIF-1α, bFGF and IL-10 proteins (P<0.001) (Table II). qPCR was used to assess the RNA
levels of the genes encoding the STAT-3, p-STAT-3, MMP-10, VEGF,
KDR, HIF-1α, bFGF and IL-10 proteins. The results showed that the
changes in the RNA levels of MMP-10, VEGF, KDR, HIF-1α, bFGF, IL-10
and p-STAT-3 correlated with the protein expression results
(Fig. 5; Table III).
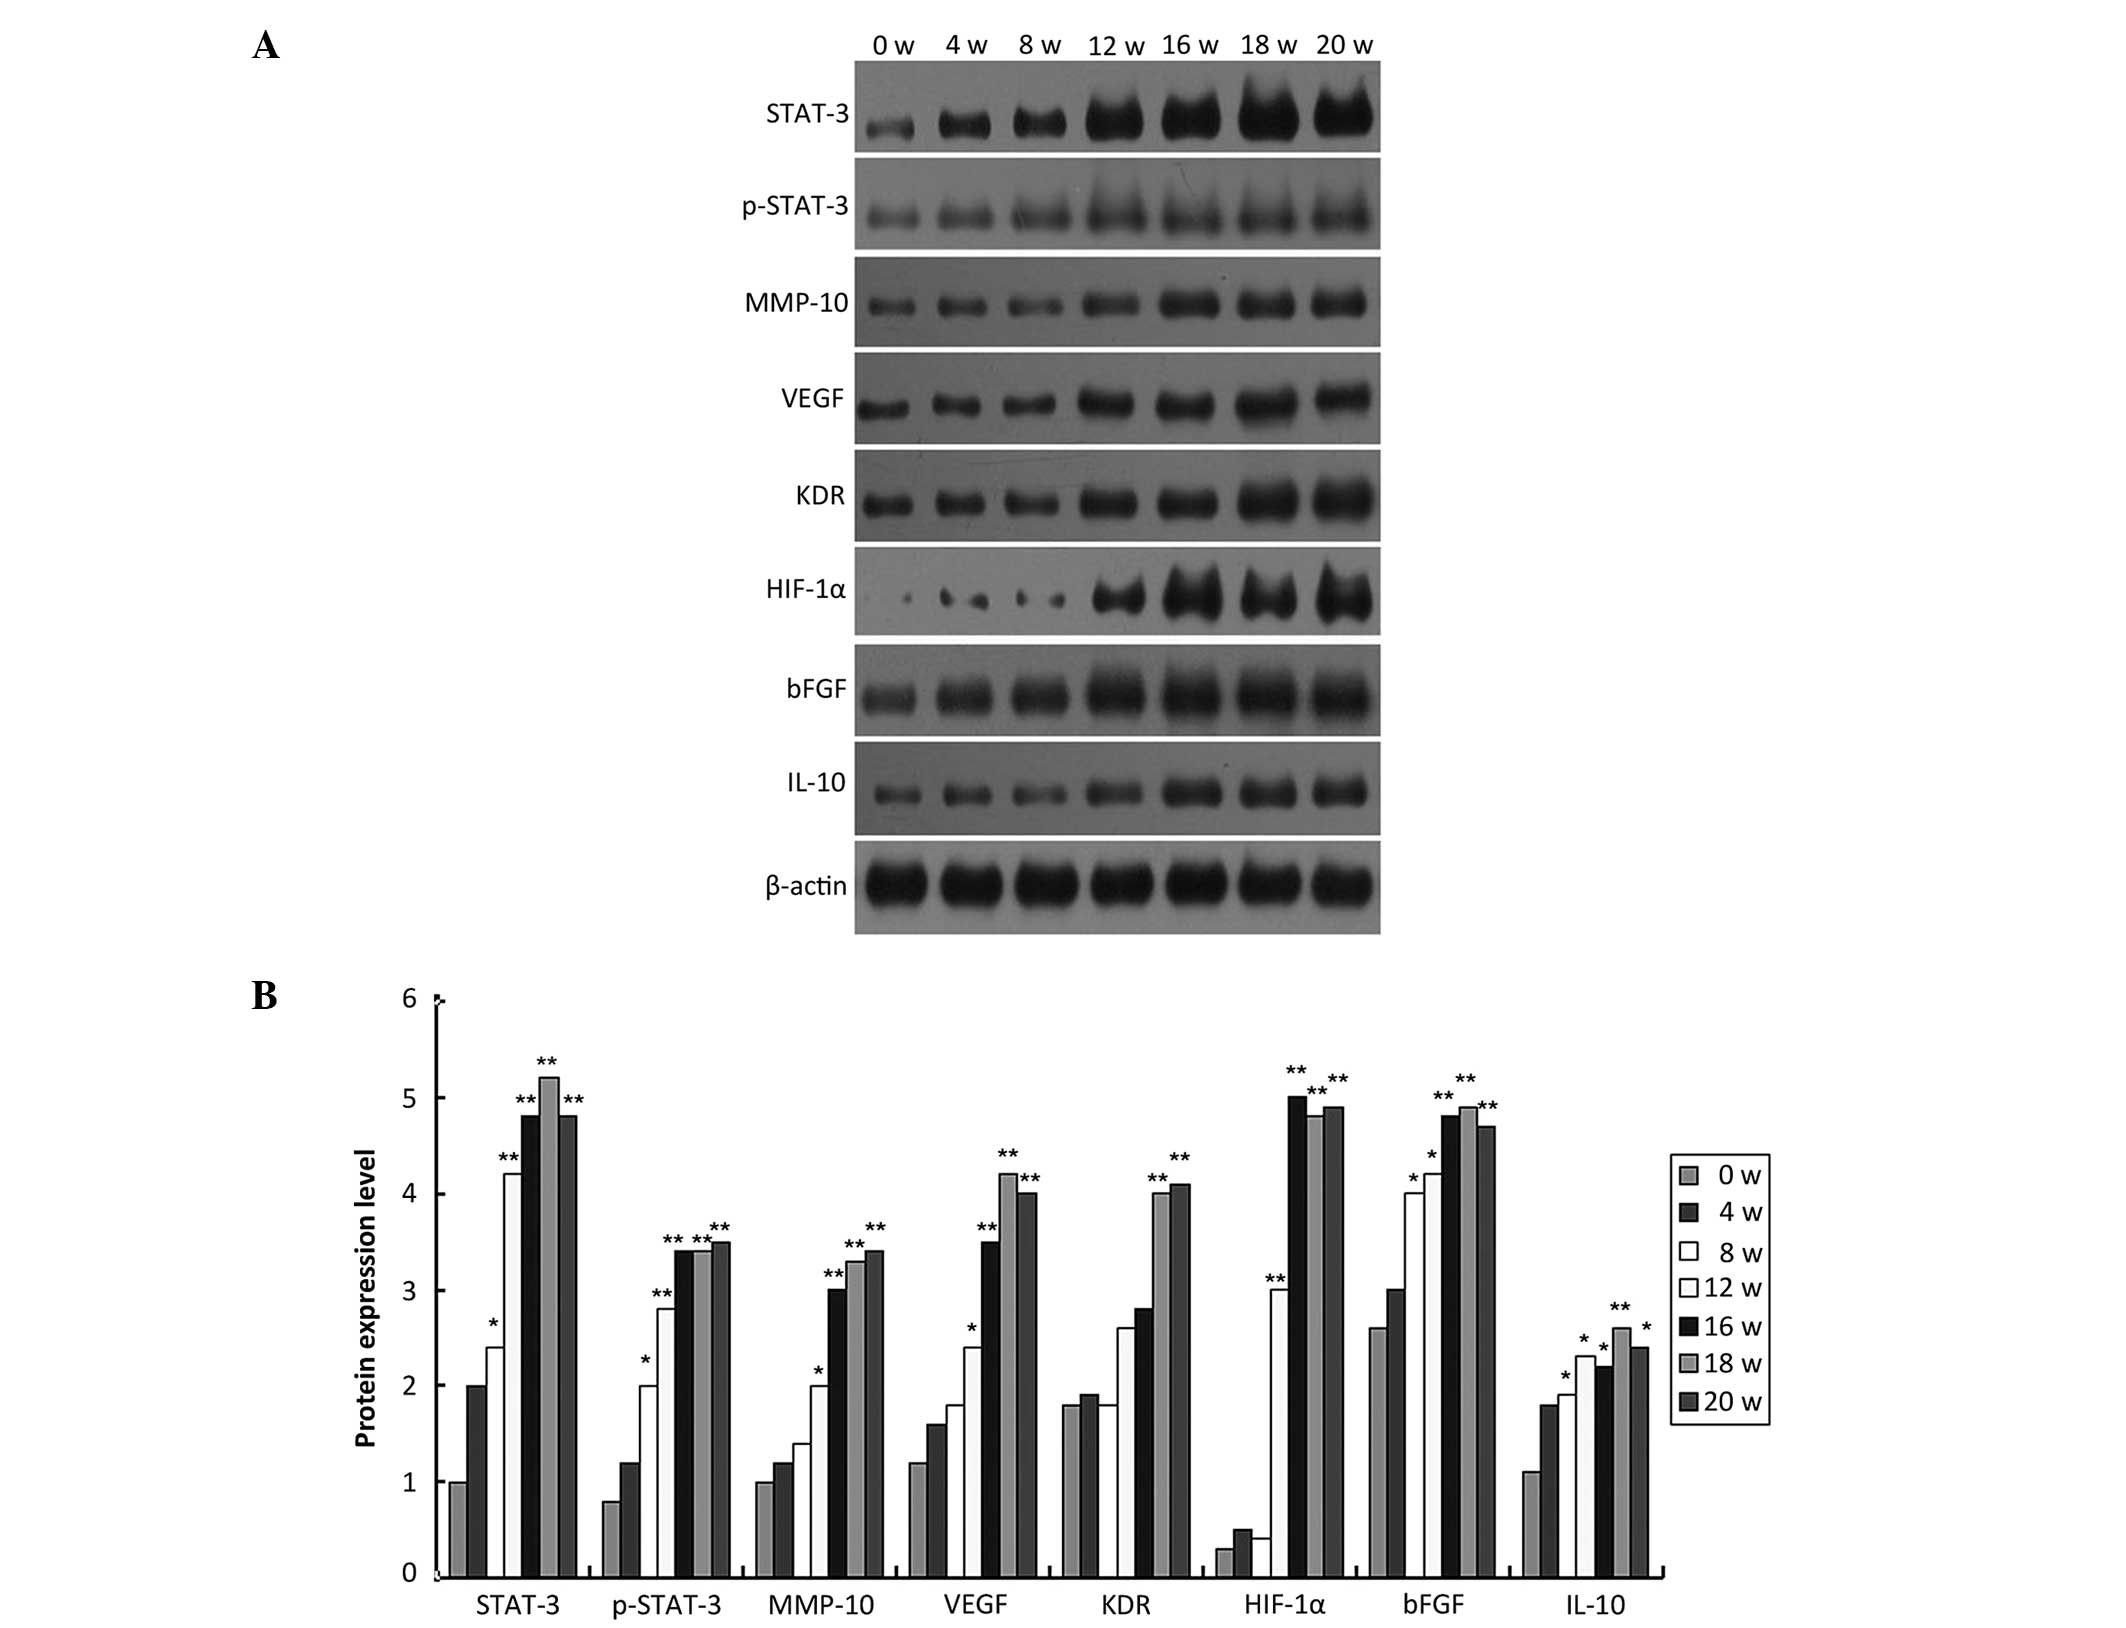 | Figure 4(A) Western blotting detected the
expression of STAT-3, p-STAT-3, MMP-10, VEGF, KDR, HIF-1α, bFGF and
IL-10 in rat liver tissue of diethylnitrosamine (DEN)-treated rats.
(B) The intensity of the STAT-3, p-STAT-3, MMP-10, VEGF, KDR,
HIF-1α, bFGF and IL-10 protein bands was determined and normalized
against β-actin using the ultraviolet crosslinkers imager, and then
plotted (*P<0.05, **P<0.01 vs. control
group). p-STAT-3, phosphorylated signal transducer and activator of
transcription-3; MMP10, matrix metalloproteinase-10; VEGF, vascular
endothelial growth factor; KDR, kinase insert domain receptor;
bFGF, basic fibroblast growth factor; HIF-1α, hypoxia inducible
factor-1α; IL-10, interleukin-10. |
| Table IICorrelation analysis of STAT-3 and
p-STAT-3 protein expression and the expression of the MMP-10, VEGF,
KDR, HIF-1α, bFGF and IL-10 proteins. |
Table II
Correlation analysis of STAT-3 and
p-STAT-3 protein expression and the expression of the MMP-10, VEGF,
KDR, HIF-1α, bFGF and IL-10 proteins.
| Protein | STAT-3 (r-value) | P-value | p-STAT-3 (r) | P-value |
|---|
| MMP10 | 0.820 | <0.01 | 0.969 | <0.001 |
| VEGF | 0.825 | <0.01 | 0.979 | <0.001 |
| KDR | 0.738 | <0.01 | 0.950 | <0.001 |
| bFGF | 0.675 | <0.05 | 0.849 | <0.01 |
| HIF-1α | 0.752 | <0.05 | 0.916 | <0.01 |
| IL-10 | −0.748 | <0.05 | −0.935 | <0.001 |
| Table IIICorrelation analysis of mRNA levels,
comparing STAT-3 with MMP-10, VEGF, KDR, HIF-1α, bFGF and
IL-10. |
Table III
Correlation analysis of mRNA levels,
comparing STAT-3 with MMP-10, VEGF, KDR, HIF-1α, bFGF and
IL-10.
| Name | STAT-3 (r-value) | P-value |
|---|
| MMP10 | 0.990 | <0.001 |
| VEGF | 0.985 | <0.001 |
| KDR | 0.994 | <0.001 |
| bFGF | 0.991 | <0.001 |
| HIF-1α | 0.984 | <0.001 |
| IL-10 | 0.978 | <0.001 |
Discussion
Human hepatoma develops as a multi-stage process
whereby damage due to hepatitis B or C viral infection causes
chronic hepatitis or cirrhosis and then adenomatous hyperplasia
nodules form. Early hepatocellular carcinoma (HCC) develops, prior
to advanced HCC and HCC metastasis. This multi-stage occurrence and
developmental model has been confirmed by pathological analysis and
clinical cases (7). In the present
study, a modified intermittent administration method developed by
Zhang et al (8) was used to
successfully induce the hepatoma model in Wistar rats. The model is
simple, with a brief tumorigenic cycle, and the pathological
process follows the general development of human liver cancer
(6). The results of the present
study were similar to those aforementioned, indicating that this
model is stable and has reproducibility.
Tumorigenesis and development are closely associated
with signal transduction, and the significant components in signal
transduction are the transcription factors, which regulate the
expression of oncogenes and thus, indirectly regulate the
downstream genes associated with tumor development and diffusion
(9,10). STAT-3 is a transcription factor
responsive to a variety of cytokines and growth factors via the
JAK-STAT signal transduction pathway, which is important in tumor
invasion, metastasis, angiogenesis and tumor immune escape
(11). The tumor cells must
penetrate the barrier formed by the basement membrane and ECM
during invasion and metastasis, and damage to the integrity of the
basement membrane is a sign of the beginning of malignant tumor
invasion. MMPs are able to degrade the majority of the proteins in
the basement membrane and ECM. Furthermore, a number of studies
(12–14) have found that MMP-10 is expressed in
human glioblastoma, and oral, esophageal, stomach, colon,
colorectal and liver cancer, as well as other malignant cells.
MMP-10 degrades ECM components, including collagen III, collagen
IV, gelatin, casein, laminin and proteoglycan elastic hard protein,
which is considered to be an important activating factor in human
tumor cells that may be activated in other pro-MMPs. In addition,
MMP-10 and other activated MMPs may disrupt the basement membrane,
providing the necessary conditions for the invasion and metastasis
of tumor cells through the vasculature. In the present study, in
the DEN-treated rat liver tissue, the expression of MMP-10
increased in a time-dependent manner and degraded the proteins in
the basement membrane and ECM, allowing the damaged liver cells to
pass through this basement membrane, resulting in the overgrowth of
liver cells and finally, carcinogenesis.
Tumor angiogenesis is the basis of tumor cell
invasion and metastasis. VEGF is the predominant factor that acts
directly to stimulate tumor angiogenesis, and the persistent
activation of STAT-3 induces VEGF expression, resulting in tumor
angiogenesis (15). VEGF binds to
VEGF receptors (VEGFRs), including VEGFR-1 (Flt-1), VEGFR-2 (KDR),
VEGFR-3 (Flt-4). KDR is the predominant functional receptor for
VEGF. bFGF is another significant pro-angiogenic factor. Tumor
cells produce bFGF, and may also induce endothelial cells to
produce bFGF, thereby stimulating angiogenesis (16). HIF-1α is a transcription factor that
responds to hypoxia. In the present study, DEN treatment was found
to promote the expression of HIF-1α in the rat liver tissue, as it
bound to the regulatory sequences of the VEGF and bFGF genes,
resulting in the increased transcription of VEGF and bFGF, thereby
enabling the increased expression of KDR.
Tumor cells use immune suppression and immune
tolerance mechanisms to evade surveillance and destruction by the
immune system, and promote their own migration and invasion. A
previous study (17) demonstrated
that STAT-3, by affecting the differentiation and maturation of
dendritic cells (DCs), interfered with immune recognition by T
cells and thus, the immune system became tolerant of the tumor
cells. The results of the present study revealed that activated
STAT-3 stimulated the injured liver cells to secrete VEGF and IL-10
to affect the differentiation and maturation of DCs, and thereby
inhibited the immune response, allowing the tumor cells to escape
it.
In conclusion, the expression of STAT-3, p-STAT-3,
MMP-10, VEGF, KDR, HIF-1α, bFGF and IL-10 was investigated in the
DEN-induced rat liver cancer model at various stages of
carcinogenesis, which confirmed that tumor metastasis, invasion,
angiogenesis and immune escape are associated with the sustained
activation of STAT-3, thus providing experimental data to support
the use of STAT-3 to inhibit HCC.
Acknowledgements
This study was supported by the National Natural
Science Foundation of China (grant no. 81260655) and the Key
Project of Science and Technology Research of the Ministry of
Education (grant no. 2010-55).
References
|
1
|
Stefanatos RK and Vidal M: Tumor invasion
and metastasis in Drosophila: a bold past, a bright future. J Genet
Genomics. 38:431–438. 2011.
|
|
2
|
Uluer ET, Aydemir I, Inan S, Ozbilgin K
and Vatansever HS: Effects of 5-fluorouracil and gemcitabine on a
breast cancer cell line (MCF-7) via the JAK/STAT pathway. Acta
Histochem. 114:641–646. 2012.
|
|
3
|
Xiong H, Chen ZF, Liang QC, et al:
Inhibition of DNA methyltransferase induces G2 cell cycle arrest
and apoptosis in human colorectal cancer cells via inhibition of
JAK2/STAT3/STAT5 signalling. J Cell Mol Med. 13:3668–3679.
2009.
|
|
4
|
Constantinescu SN, Girardot M and Pecquet
C: Mining for JAK-STAT mutations in cancer. Trends Biochem Sci.
33:122–131. 2008.
|
|
5
|
Jenkins BJ, Grail D, Nheu T, et al:
Hyperactivation of Stat3 in gp130 mutant mice promotes gastric
hyperproliferation and desensitizes TGF-beta signaling. Nat Med.
11:845–852. 2005.
|
|
6
|
Haura EB, Turkson J and Jove R: Mechanisms
of disease: Insights into the emerging role of signal transducers
and activators of transcription in cancer. Nat Clin Pract Oncol.
2:315–324. 2005.
|
|
7
|
Sakamoto M, Hirohashi S and Shimosato Y:
Early stages of multistep hepatocarcinogenesis: adenomatous
hyperplasia and early hepatocellular carcinoma. J Third Mil Med
Univ. 22:172–178. 1991.
|
|
8
|
Zhang ZM, Wang G, Chen C, et al:
Pathologic and morphologic study on modified DEN-induced
hepatocarcinoma model in rats. Acat Academia Medicine Militaris
Tertiae. 29:1164–1167. 2007.
|
|
9
|
Munir S, Frøsig TM, Hansen M, Svane IM and
Andersen MH: Characterization of T-cell responses against IκBα in
cancer patients. Oncoimmunology. 1:1290–1296. 2012.
|
|
10
|
Lin L, Fuchs J, Li C, Olson V, Bekaii-Saab
T and Lin J: STAT3 signaling pathway is necessary for cell survival
and tumorsphere forming capacity in
ALDH+/CD133+ stem cell-like human colon
cancer cells. Biochem Biophys Res Commun. 416:246–251. 2011.
|
|
11
|
Minakhina S, Tan W and Steward R: JAK/STAT
and the GATA factor Pannier control hemocyte maturation and
differentiation in Drosophila. Dev Biol. 352:308–316. 2011.
|
|
12
|
Yen CY, Chen CH, Chang CH, et al: Matrix
metalloproteinases (MMP) 1 and MMP10 but not MMP12 are potential
oral cancer markers. Biomarkers. 14:244–249. 2009.
|
|
13
|
Saini S, Liu J, Yamamura S, Majid S,
Kawakami K, Hirata H and Dahiya R: Functional significance of
secreted Frizzled-related protein 1 in metastatic renal cell
carcinomas. Cancer Res. 69:6815–6822. 2009.
|
|
14
|
Aung PP, Oue N, Mitani Y, et al:
Systematic search for gastric cancer-specific genes based on SAGE
data: melanoma inhibitory activity and matrix metalloproteinase-10
are novel prognostic factors in patients with gastric cancer.
Oncogene. 25:2546–2557. 2006.
|
|
15
|
Goydos JS and Gorski DH: Vascular
endothelial growth factor C mRNA expression correlates with stage
of progression in patients with melanoma. Clin Cancer Res.
9:5962–5967. 2003.
|
|
16
|
Pandya NM, Dhalla NS and Santani DD:
Angiogenesis-a new target for future therapy. Vascul Pharmacol.
44:265–274. 2006.
|
|
17
|
Burdelya L, Kujawski M, Niu G, et al:
Stat3 activity in melanoma cells affects migration of immune
effector cells and nitric oxide-mediated antitumor effects. J
Immunol. 174:3925–3931. 2005.
|