Introduction
Advanced-stage oral cancer is associated with high
incidences of mortality, morbidity and disfigurement worldwide.
Therefore, it is important that oral cancer is detected early for
improved prevention, prognosis and treatment (1). Recently, a number of novel techniques
have been developed that aid with the early detection of oral
cancer (2), for example
metabolomics assesses and validates metabolite concentrations
within cells, tissues and biofluid. In addition, it has been
applied to investigate the underlying mechanisms and, thus, the
early detection of oral cancer (3–8).
Metabolomic analyses of the biofluid of oral cancer
patients (such as urine, serum and saliva) have been performed
using differential measurement techniques, including nuclear
magnetic resonance (NMR), high performance liquid
chromatography-mass spectrometry (HPLC-MS) and gas chromatography
(GC)-MS. Additionally, data were processed using multivariate
statistical analyses, such as principal component analysis (PCA)
and partial least-squares discriminant analysis (PLS-DA). Previous
studies, including our previous study (3–7) have
analyzed human biofluid to demonstrate the applicability of
metabolomics in the diagnosis and prognosis of oral cancer.
However, metabolomics is sensitive to a number of variables,
including host susceptibility and resistance, diet, lifestyle and
geographical location (9).
Difficulty identifying the metabolic markers of oral cancer and
metabolic differences between the stages of oral carcinogenesis
(healthy, oral leukoplakia [OLK] and oral squamous cell carcinoma
[OSCC]) may be due to variations in the above-mentioned human
variables.
A 4-nitroquinoline-1-oxide (4NQO) rat model of oral
carcinogenesis exhibits all stages of oral carcinogenesis, and has
been reported as histologically and molecularly similar to human
oral carcinogenesis (10,11). In addition, a rat model allows
conditions to be maintained with limited variation, providing
reproducible isolation of all stages of carcinogenesis. Therefore,
4NQO-induced rats are an effective model for the investigation of
various metabolites in the neoplastic progression of oral
cancer.
The aim of the present study was to identify
potential biomarkers for the diagnosis and classification of OSCC
and precancerous lesions by identifying important plasma
metabolites, as well as analyzing their concentration trends in the
principal stages of oral carcinogenesis via 4NQO-induced oral
carcinogenesis in rats.
Materials and methods
Animal treatment and sampling
Forty male, specific pathogen-free Sprague-Dawley
rats (age, eight weeks; weight, ~250 g) were obtained from the
Experimental Animal Center of Sichuan University (Chengdu, China).
The rats were maintained under controlled conditions at 24±2°C on a
12-h light-dark cycle and with free access to water and a
commercial diet. (rat and mouse feed; Dasuo Bio-Technology Ltd.,
Chengdu, China) Following one week of acclimatization, the rats
were randomly divided into two groups: A 4NQO-treated group, n=30
(treatment, 50 parts per million [ppm] 4NQO solution); and a
healthy control group, n=10 (treatment, water). Following 16 and 24
weeks of 4NQO and water treatment, the rats were sacrificed by
intraperitoneal injection of 3 ml/kg sodium pentobarbital
(Sigma-Aldrich, St. Louis, MO, USA) and autopsied. The rats were
divided into three groups as demonstrated in Table I. A total of 30 plasma samples (1 ml
of plasma for each sample) were obtained and stored at −80°C prior
to 1H NMR spectroscopic analysis. Tongue samples were
collected for histopathological examination.
 | Table IRat groups and treatment
strategies. |
Table I
Rat groups and treatment
strategies.
| Group | Treatment | Time, weeks | Rats, n |
|---|
| Control (n=10) | Water | 16 | 5 |
| 24 | 5 |
| OLK | 50 ppm 4NQO
solution | 16 | 10 |
| OSCC | 50 ppm 4NQO
solution | 24 | 10 |
All experimental protocols were approved by the
Animal Experimental Ethics Committee of Sichuan University
(Chengdu, China) and conformed to procedures described in the
Guiding Principles for the Use of Laboratory Animals (12).
Histopathological evaluation
The whole tongue was excised, flattened on a
transparency plate and fixed in 4% phosphate-buffered
saline-buffered formalin. The formalin-fixed tongues were then cut
into four sections, processed and embedded in paraffin. The 5-μm
thick sections were stained with hematoxylin and eosin for
histopathological analysis. OLK and OSCC were diagnosed according
to the World Health Organization classification of tumors (2005)
(13) and Warnakulasuriya et
al (14).
Sample preparation and NMR
spectroscopy
Samples were prepared by mixing plasma (250 μl )
with 99.9% deuterium oxide (250 μl) and leaving to stand for 10 min
to obtain a deuterium lock signal for NMR spectrometry. The
mixtures (500 μl) were then transferred into 5-mm NMR capillary
tubes. 1H NMR spectra were measured at 600.13 MHz on a
Bruker Avance™ II 600 spectrometer (Bruker Biospin, Rheinstetten,
Germany) using a 5-mm PATXI probe at a temperature of 300 K. The
spectra were acquired using a one dimensional (1D)
Carr-Purcell-Meiboom-Gill (CPMG) pulse sequence (CPMGpr), which
attenuated the broad protein signal in the plasma. This sequence is
a modification of the CPMG pulse sequence that suppresses the
residual water signal (15). For
each sample, the 1D 1H NMR spectrum was collected with
64 K data points, 64 scans and 15-ppm spectral width. Furthermore,
the acquisition parameters included a 5-μsec relaxation delay,
eight dummy scans, 400-μsec fixed echo time to allow the
elimination of J-modulated spin-echo, and 400 CPMG loops for T2
filter.
Data were processed using MestReNova software 6.0.4
(Mestrelab Research, S.L, Santiago de Compostela, Spain). The NMR
spectra acquired were manually phased, corrected for baseline
distortion using the Whittaker smooth algorithm (16), and referenced to the lactic acid
doublet at 1.30 and 4.11 ppm. The spectral regions of residual
water were excluded from analysis (4.3–6.5 ppm). The spectral
region of δ9.00-0.50 was segmented into 314 bins (width, 0.02 ppm).
The resulting 314 integrals were normalized to the sum of the
spectral intensity to compensate for differences in the
concentrations of the samples. Metabolites were identified by
comparing their 1H chemical shifts and coupling patterns
with the corresponding values from the Human Metabolome Data Bank
(http://www.hmdb.ca).
Multivariate statistical analysis
Following data normalization, the data set was input
into SIMCA-P 11.5 software (Umetrics, Umeå, Sweden), pareto-scaled
in a column-wise manner and processed using the unsupervised method
of PCA. This provided an analysis of the overall distribution of
the data set and was used to identify and eliminate abnormal
samples from the three groups. The supervised method of PLS-DA was
also used to maximize variation between the three groups and to
identify the metabolites important in oral carcinogenesis.
The results are presented as principal component
score plots, with each point in the plot representing an individual
sample. The quality of the PCA and PLS-DA models is depicted by the
cross-validation parameters, R2 and Q2, representing the explained
variance and the predictive capability of the model, respectively.
R2X and R2Y represent the fraction of variance of the X and Y
matrix, respectively, and Q2Y represents the predictive accuracy of
the model, with cumulative (cum) values of R2X, R2Y and Q2Y
equating to ~1 indicating an effective model. Furthermore,
permutation tests (200 cycles) were conducted to assess the
robustness of the PLS-DA model when using a small sample size
(17).
Discriminant plasma metabolites from the OSCC, OLK
and control groups were defined by a statistically significant
threshold of variable importance in the projection (VIP), which was
derived from the PLS-DA model. VIP>1.0 was considered sufficient
for group discrimination (18).
Univariate statistical analysis
Univariate statistical analysis was used to verify
the significance of the metabolites that were screened using
multivariate statistical analysis. Online software (www.metaboanalyst.ca) (19) was applied to perform an analysis of
variance (ANOVA) and P<0.05 was considered to indicate a
statistically significant difference. Thus, the variables selected
were those with VIP>1 and P<0.05 according to PLS-DA and
ANOVA, respectively.
Results
4NQO-induced oral carcinogenesis
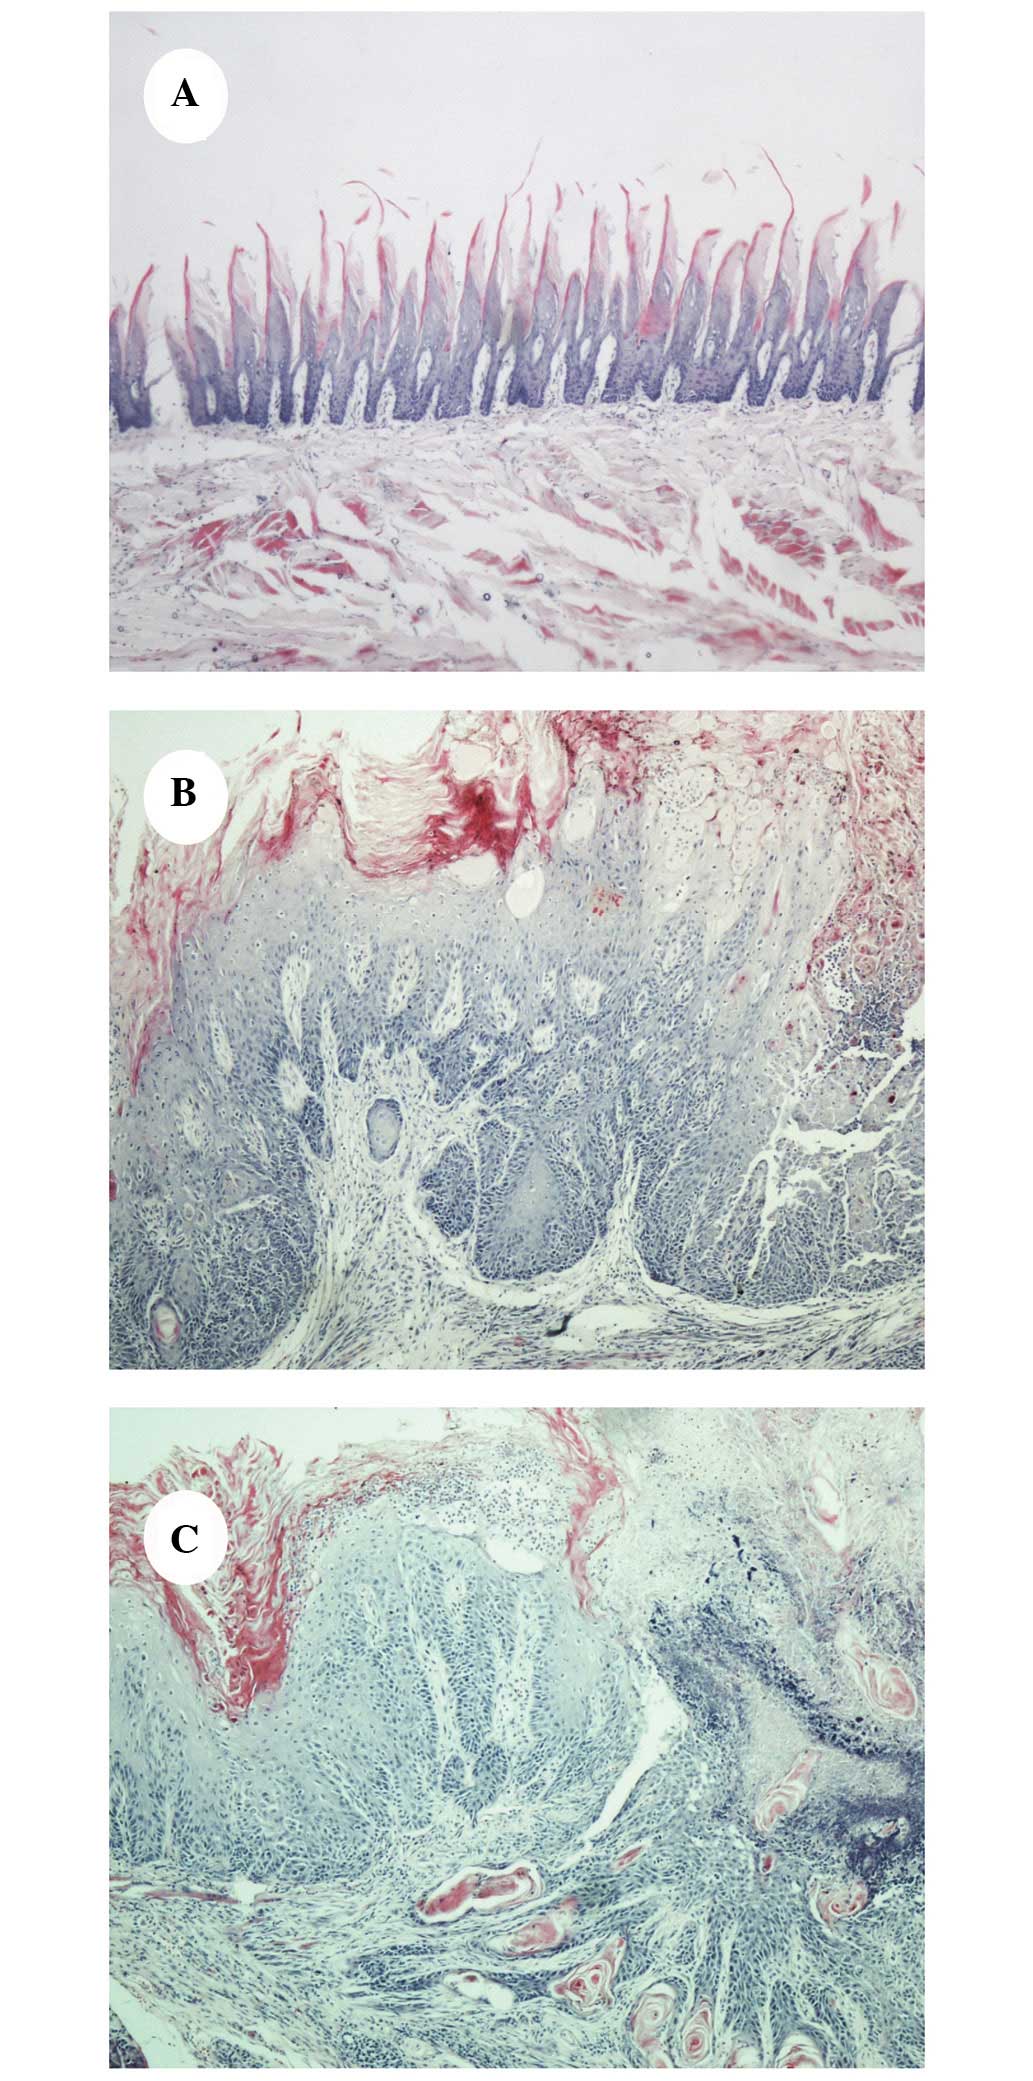
Prolonged application of the carcinogenic agent
(4NQO) caused the tongue mucosa of the 4NQO-treated rats to present
with varying degrees of dysplasia. All rats in the healthy control
group appeared histologically normal. The majority of the
4NQO-treated rat tongue mucosas exhibited hyperemia and ulceration
at weeks 10–12; a visibly rough, granular mucosal surface with
varying degrees of erythema, as well as occasional white
plaque-like lesions were observed at weeks 14–16 and OSCC presented
at weeks 22–24. The typical histopathology of the 4NQO-induced oral
lesions of the control, OLK and OSCC groups are demonstrated in
Fig. 1A–C, respectively.
1H NMR spectra of the rat
plasma samples
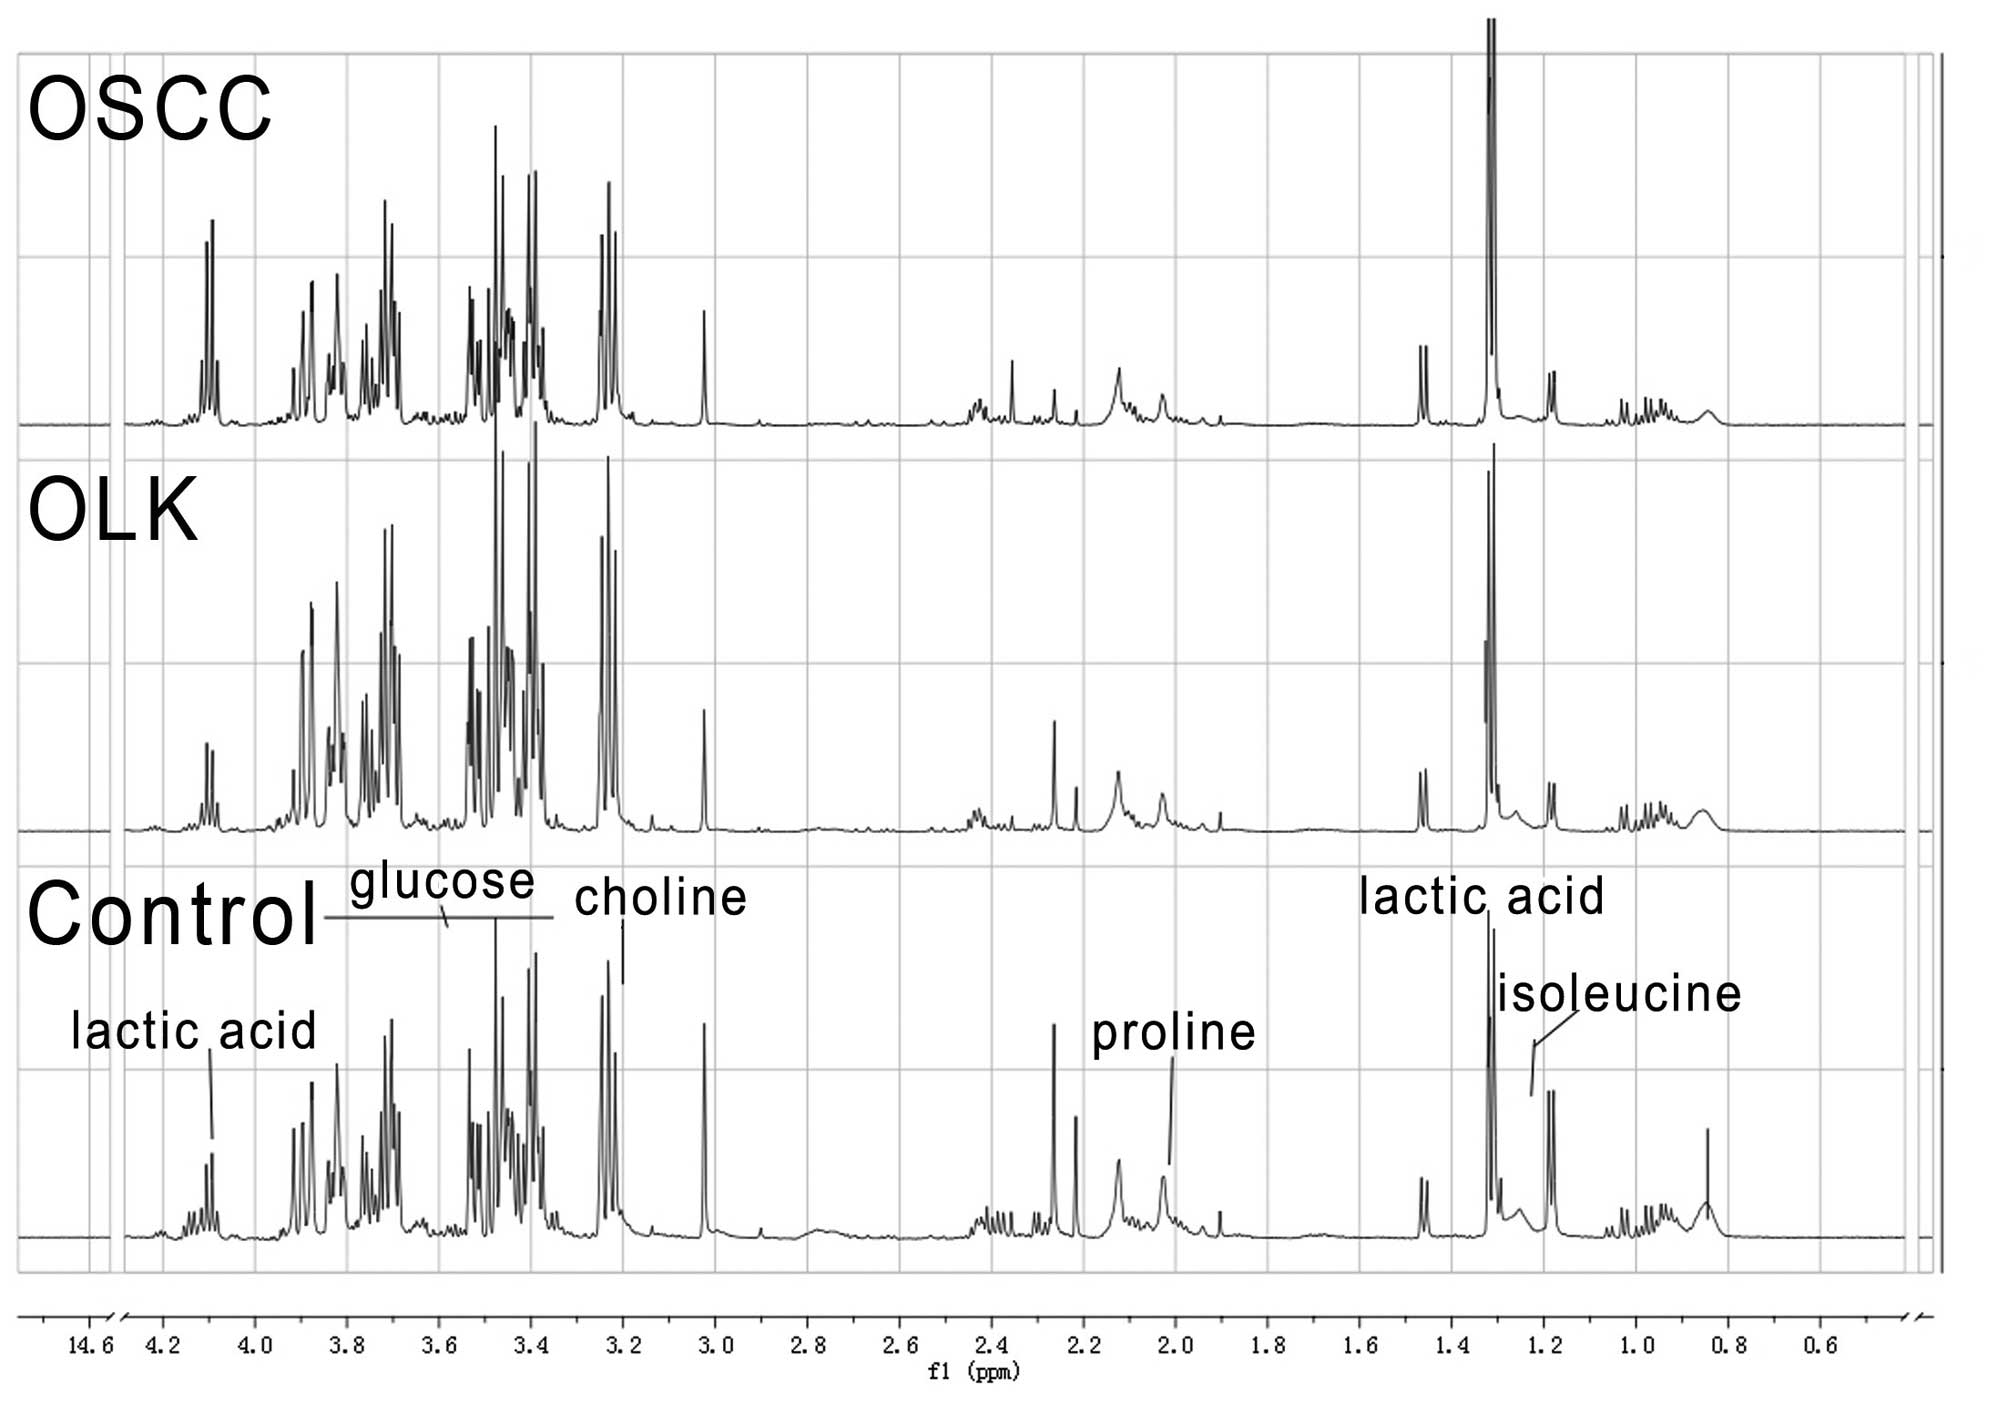
Fig. 2 depicts the
representative 1H NMR spectra, which demonstrates the
common signals from the control, OLK and OSCC group samples. The
spectra are dominated by carbohydrate resonances, in particular,
the two anomeric forms of glucose (3.0–5.5 ppm) and various
intermediate metabolites of the glycolytic pathway, such as lactic
acid (1.31 and 4.10 ppm). Other compounds, in particular the amino
acids, valine (0.9–1.1 ppm) and proline (2.02 ppm), exhibit large
methyl signals in the spectrum.
Multivariate statistical analysis
The data set from the 1H NMR spectra was
processed using the unsupervised method of PCA using SIMCA-P 11.5
software (Umetrics) to generate an unbiased overview of the major
metabolic differences between the control, OLK and OSCC groups. As
indicated in Fig. 3A, three groups
exhibited a trend of intergroup separation on the score plot
(R2X[cum]=70.6%; Q2[cum]=56.3%).
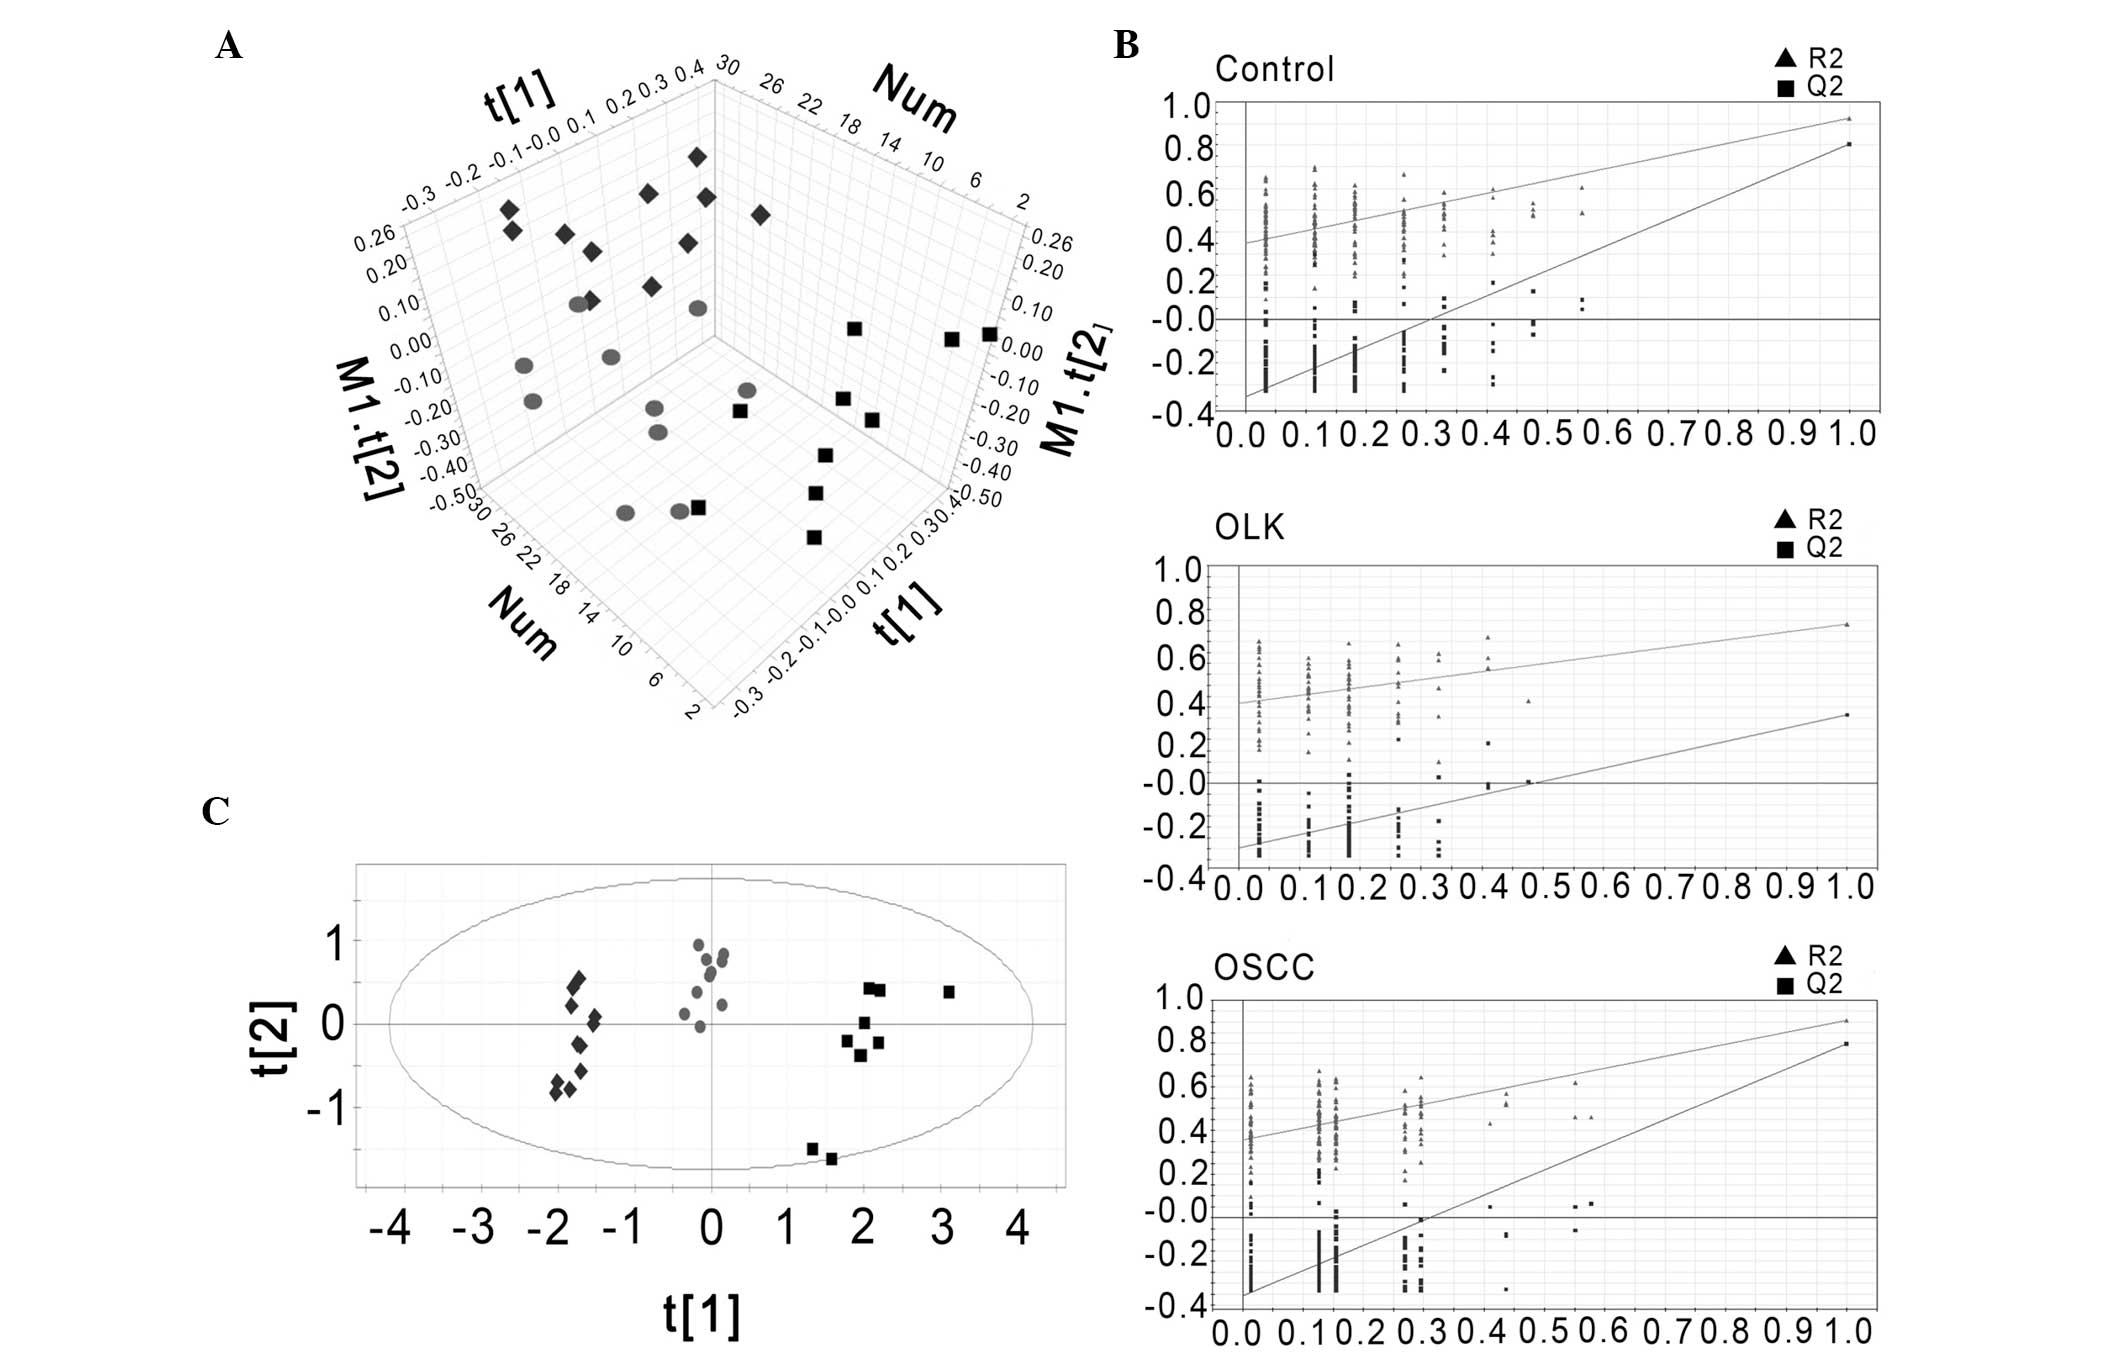 | Figure 3(A) Principal component analysis score
plot of 1H NMR spectra of rat plasma. (B) Validation
plots of the PLS-DA model for rat plasma using a permutation test
that was randomly permuted 200 times with the first principal
component (▲, R2; ■, Q2). (C) PLS-DA scatter plot derived from
1H NMR spectra of rat plasma samples (groups: Control,
■; ●, OLK; and ◆, OSSC). OLK, oral leukoplakia; OSCC, oral squamous
cell carcinoma; PLS-DA partial least-squares discriminant analysis;
NMR, nuclear magnetic resonance; R2, explained variance; Q2,
predictive capability of the model. |
To obtain a more reliable statistical analysis and
specific loadings, a PLS-DA model was used to discriminate samples
from the control, OLK and OSCC groups. A cluster of 200 permutated
models from the first component were visualized using validation
plots (Fig. 3B). In the permutation
test, all permutated R2 and Q2 values to the left were lower than
the original point to the right, and lower than the original
values, which is an indication of the validity of the original
models. According to VIP, the most significant discriminatory
metabolites between the three groups were lactic acid (VIP, 12.15),
choline (VIP, 3.73), and glucose (VIP, 2.22), and proline (VIP,
3.55), valine (VIP, 3.27), isoleucine (VIP, 2.89), aspartic acid
(VIP, 2.12), glutamine (VIP, 2.02) and 2-hydroxybutyric acid (VIP,
1.78). The plasma concentrentions of lactic acid, choline, and
glucose were increased, while those of proline, valine, isoleucine,
aspartic acid, glutamine and 2-hydroxybutyric acid were decreased.
The score plot is presented in Fig.
3C, and demonstrates three distinct clusters (the OSCC, OLK and
control groups; R2X=0.705; R2Y=0.787; Q2[cum]=0.641).
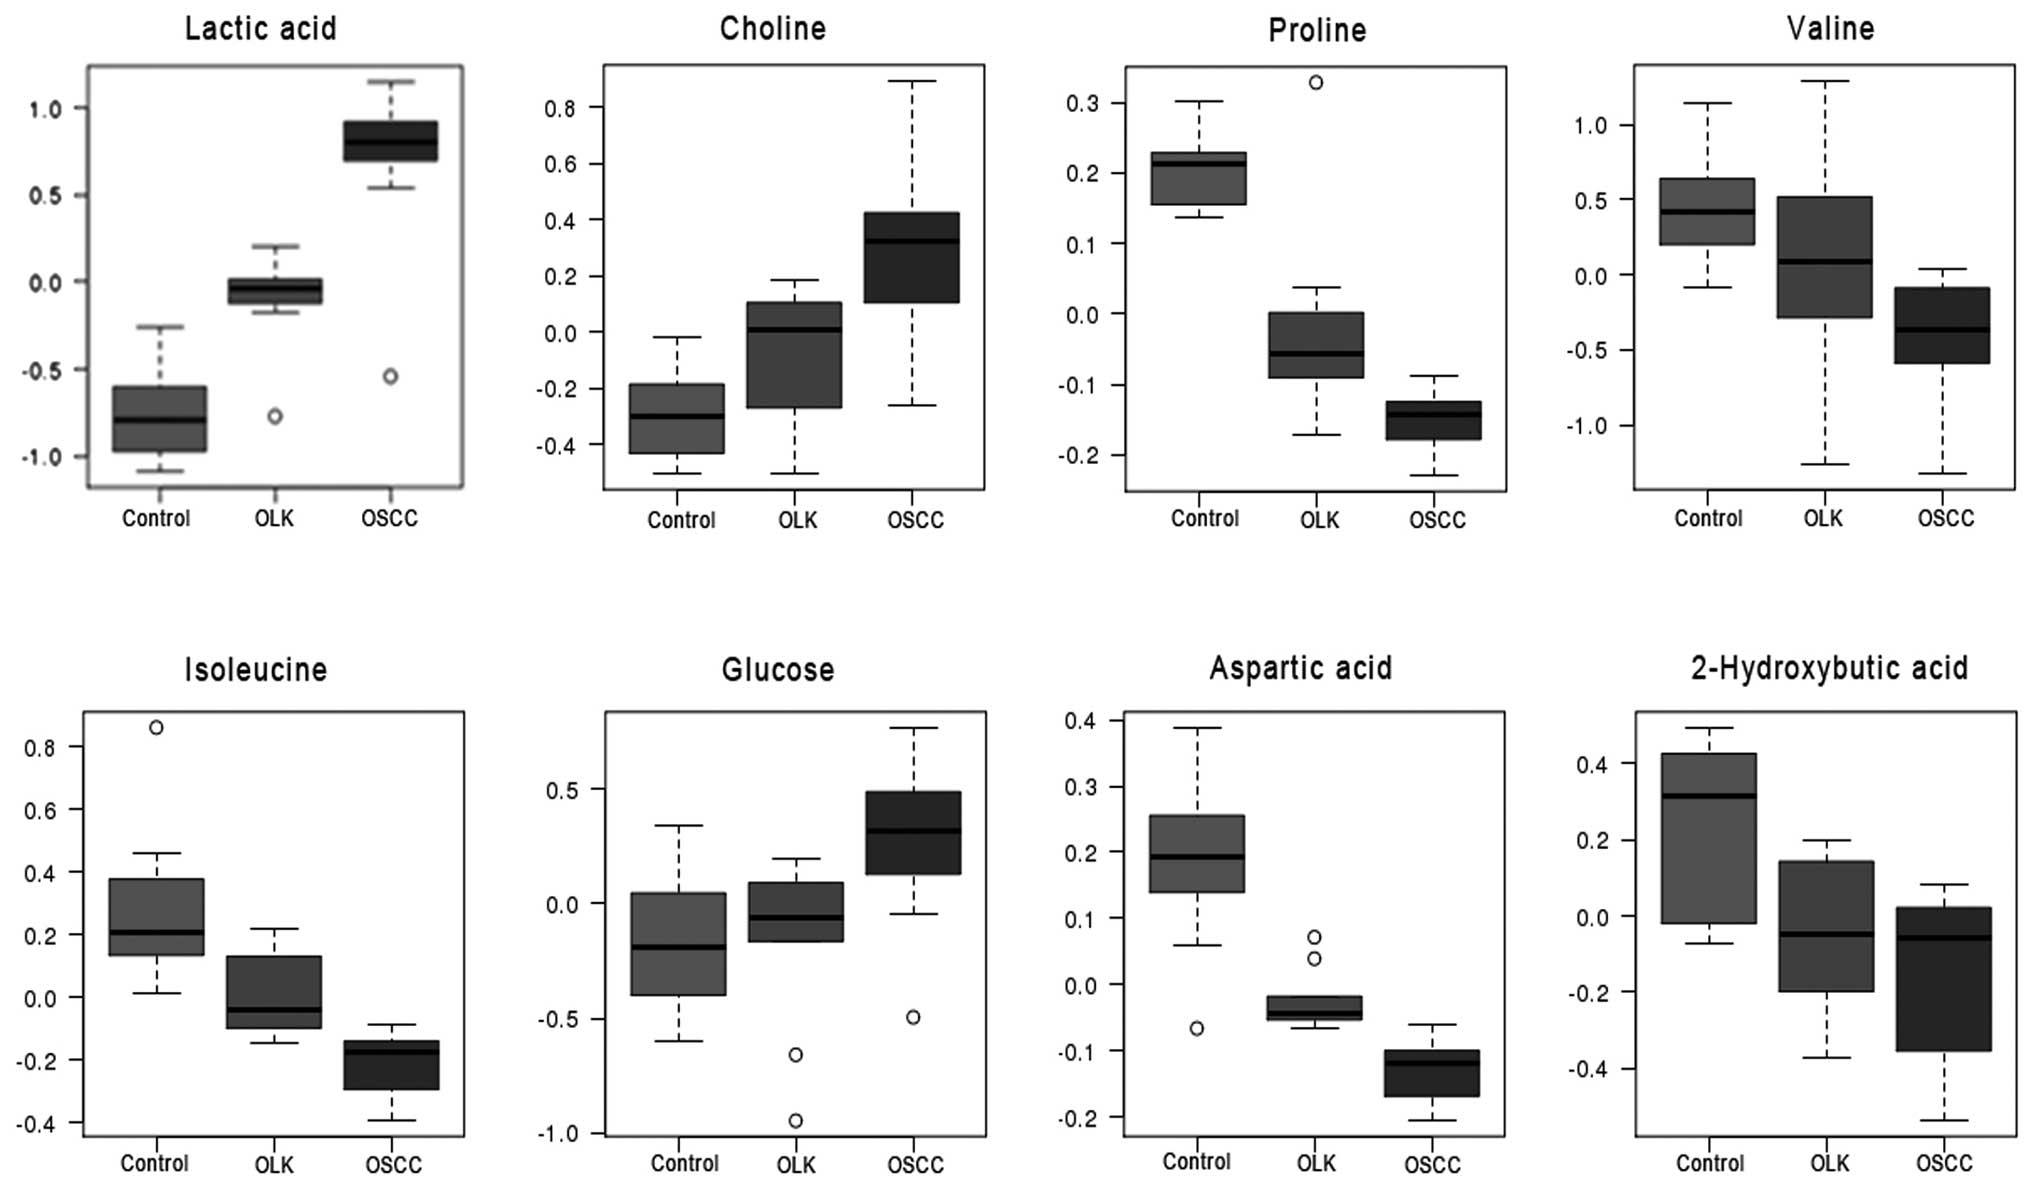
ANOVA of discriminatory metabolites in
the plasma
ANOVA was applied to to further verify the
significance of the discriminatory metabolites screened in PLS-DA
(VIP>1). The ANOVA results were generally consistent with those
that were derived from the PLS-DA model, with the exception of
glutamine, which demonstrated no significant difference between the
three groups. The discriminant metabolites, lactic acid, choline,
and glucose increased, whereas proline, valine, isoleucine,
aspartic acid and 2-hydroxybutyric acid decreased in the plasma at
various stages of oral carcinogenesis (Fig. 4).
Discussion
In the present study, PCA and PLS-DA were used to
analyze the 1H NMR-spectra of plasma using a
4NQO-induced oral carcinogenesis rat model and to identify
metabolic biomarkers in the development of oral cancer. The data
from the present study indicates that 1H NMR-based
metabolomic analyses of plasma distinguish between OSCC, OLK and
healthy rats. Furthermore, using the rat model, significant
increases in lactic acid, choline, and glucose (P<0.05), and
significant decreases in proline, valine, isoleucine, aspartic acid
and 2-hydroxybutyric acid were observed in the plasma during
4NQO-induced oral carcinogenesis, indicating that the changes of
these eight metabolites may be related to each other and viewed as
a concentration profile which may be important in the development
of oral cancer.
The development of oral cancer is a multistep
process, which includes a sequence of changes from hyperplasia
through to dysplasia (leukoplakia) and finally to carcinoma
(20). The majority of recent
metabolic studies of oral cancer have focused on patients’
biofluid, such as urine, serum and saliva. For example, Tiziani
et al (4) used PCA and
PLS-DA to investigate metabolic data derived from serum NMR
spectroscopy of OSCC patients and healthy subjects. The serum
1H NMR spectra of the OSCC patients were clearly
distinguishable from those of the healthy controls, and 23
differential metabolites were determined. Our previous study
applied 1H NMR-based metabonomic methods to investigate
the differences in plasma metabolite concentration between OSCC,
OLK and healthy control groups. Furthermore, various discriminatory
metabolites were identified and PLS-DA analysis was applied to
determine an effective model for the detection of 1H NMR
data that differentiates OSCC patients from OLK or control patients
(5). Salivary and urinary
metabonomic analyses have also been conducted using HPLC-MS or
GC-MS and have demonstrated that various saliva- or urine-derived
metabolites may serve as diagnostic tools for the early detection
of oral cancer (6,8). However, studies regarding
discriminatory metabolites have produced conflicting results,
possibly due to variations within individuals analyzed in the
studies, which may hinder the analysis of metabolite biomarker
concentration during oral carcinogenesis. In the present study,
animal models were raised in controlled conditions, avoiding the
possible variations that are observed in the human studies and
aiding with the analysis of metabolic biomarkers in oral
carcinogenesis.
Wei et al (8)
reported a metabolomic study using a classical model of
7,12-dimethylbenz(a)anthracene (DMBA)-induced oral carcinogenesis
in hamsters to delineate characteristic metabolic transformation
during carcinogenesis using GC time-of-flight MS. The animal model
of oral carcinogenesis provided a reproducible and continuous model
for reducing the impact of human variables. Although the study
revealed various differential metabolites, they were only
identified between two groups (healthy vs. OLK subjects; healthy
vs. OSCC subjects; or OLK vs. OSCC subjects) rather than between
three groups (healthy vs. OLK vs. OSCC subjects), which may not
represent the continuous change of discriminatory metabolites
during oral carcinogenesis.
In the present study, a 4NQO-induced oral
carcinogenesis model was used to identify the metabolic biomarkers
of oral cancer development. This method is simpler and safer than
surgery and avoids the mechanical stimulation resulting from the
use of a needle. The 4NQO-induced model of oral carcinogenesis has
been applied in numerous studies, and is a classic and effective
model, which is histologically and molecularly similar to human
oral carcinogenesis.
The present study identified a gradually increasing
plasma concentration of lactic acid, choline and glucose, and a
stepwise reduction in the plasma concentration of proline, valine,
isoleucine, aspartic acid and 2-hydroxybutyric acid in healthy, OLK
and OSCC groups, indicating a time-dependent progression of
metabolic changes that are associated with oral carcinogenesis.
Tiziani et al (4) identified that lactic acid
concentration decreased in human patients exhibiting OSCC; however,
a different study identified that lactic acid concentration
increased in hamsters exhibiting dysplasia and OSCC (8), which is consistent with the
observation of 4NQO-induced oral carcinogenesis in rats in the
present study. An elevated lactic acid concentration may be
associated with the Warburg effect (21), tumor hypoxia (22) and the low pH of the tumor
microenvironment (23).
Furthermore, consistent with Tiziani et al (4), the present study observed relatively
high concentrations of glucose, possibly due to an increase in the
demand of carbon skeletons and energy required to sustain metabolic
activities (24). Therefore,
elevated glucose uptake and enhanced glycolytic pathway activity
resulted in increased glucose and lactic acid concentrations during
oral carcinogenesis. However, in contrast to Tiziani et al
(4), the present report identified
a decrease in 2-hydroxybutyric acid concentration during the
development of oral cancer. This may be due to the decrease in
aerobic oxidation resulting in a reduction in the
NADH2/NAD ratio (25).
In the present study, amino acids, including valine,
isoleucine, aspartic acid and proline were observed to gradually
decline during the development of oral cancer. Valine and
isoleucine are branched-chain amino acids, which are supplemented
by food uptake and used preferentially during tumor development
(26). The present study identified
a decrease in valine and isoleucine concentration, possibly due to
difficulty in food uptake as a result of tongue damage and
increased metabolic utilization during oral carcinogenesis. A
reduction in aspartic acid and proline concentration was also
observed that may have been due to their role in the tricarboxylic
acid cycle, which is upregulated in response to the increased
demand for glucose and protein synthesis during cancer cell
proliferation.
Various studies have demonstrated that increases in
choline-associated metabolites are associated with genetic
alterations typically detected in cancer cells (27). Choline-associated metabolites are
increasingly being used as an adjunct in the diagnosis of primary
malignant tumors of the brain (28), prostate (29) and breast (30). Consistent with Tiziani et al
(4), the present study identified a
stepwise elevation in the plasma choline concentration of OSCC
patients during 4NQO-induced oral carcinogenesis. Choline, as well
as lactic acid, glucose, 2-hydroxybutyric acid, valine, isoleucine,
aspartic acid, and proline exhibited a distinct differentiation
pattern in healthy, OLK and OSCC groups. This differentiation
pattern indicates that these metabolites may be used in combination
as metabolic biomarkers for discriminating between OSCC, OLK and
healthy subjects.
In conclusion, the 4NQO-induced rat model of oral
carcinogenesis is an effective model for analyzing metabolic
biomarkers in the development of oral cancer using 1H
NMR spectroscopy, PCA, PLS-DA and ANOVA. A concentration profile of
the healthy, OLK, and OSCC groups was formed by measuring the
change in lactic acid, glucose, 2-hydroxybutyric acid, valine,
isoleucine, aspartic acid, proline and choline concentrations. This
concentration profile may be a valuable tool for discriminating
between OSCC, OLK, and healthy subjects or OLK and healthy
subjects, as well as for predicting the occurrence and development
of oral cancer. However, further research should be combined with
various analytical techniques, such as LC-MS, GS-MS, and different
types of biofluid, such as urine and saliva, to obtain systematic
metabolic differences at all stages of oral cancer. Investigating
the association between metabolites and the genes or proteins
involved in the relative metabolic pathways of oral cancer may
assist in providing a metabolic mechanism for oral
carcinogenesis.
Acknowledgements
The present study was supported by grants from the
Key Research Project of the Ministry of Education in China (grant
no. 307022) and the National Natural Science Foundation of China
(grant nos. 30901689 and 81172579). 1H NMR spectra were
obtained at the Analytical and Testing Center of Sichuan University
(Chengdu, China).
References
|
1
|
Nair DR, Pruthy R, Pawar U and Chaturvedi
P: Oral cancer: Premalignant conditions and screening - an update.
J Cancer Res Ther. 8(Suppl 1): S57–S66. 2012.
|
|
2
|
Mehrotra R and Gupta DK: Exciting new
advances in oral cancer diagnosis: avenues to early detection. Head
Neck Oncol. 3:332011. View Article : Google Scholar : PubMed/NCBI
|
|
3
|
Yan SK, Wei BJ, Lin ZY, et al: A
metabonomic approach to the diagnosis of oral squamous cell
carcinoma, oral lichen planus and oral leukoplakia. Oral Oncol.
44:477–483. 2008. View Article : Google Scholar
|
|
4
|
Tiziani S, Lopes V and Günther UL: Early
stage diagnosis of oral cancer using 1H NMR-based
metabolomics. Neoplasia. 11:269–276. 2009.
|
|
5
|
Zhou J, Xu B, Huang J, et al:
1H NMR-based metabonomic and pattern recognition
analysis for detection of oral squamous cell carcinoma. Clin Chim
Acta. 401:8–13. 2009. View Article : Google Scholar
|
|
6
|
Wei J, Xie G, Zhou Z, et al: Salivary
metabolite signatures of oral cancer and leukoplakia. Int J Cancer.
129:2207–2217. 2011. View Article : Google Scholar
|
|
7
|
Xie GX, Chen TL, Qiu YP, et al: Urine
metabolite profiling offers potential early diagnosis of oral
cancer. Metabolomics. 8:220–231. 2012. View Article : Google Scholar
|
|
8
|
Wei J, Xie G, Ge S, et al: Metabolic
transformation of DMBA-induced carcinogenesis and inhibitory effect
of salvianolic acid b and breviscapine treatment. J Proteome Res.
11:1302–1316. 2012. View Article : Google Scholar
|
|
9
|
Kanojia D and Vaidya MM:
4-nitroquinoline-1-oxide induced experimental oral carcinogenesis.
Oral Oncol. 42:655–667. 2006. View Article : Google Scholar : PubMed/NCBI
|
|
10
|
Nauta JM, Roodenburg JL, Nikkels PG,
Witjes MJ and Vermey A: Epithelial dysplasia and squamous cell
carcinoma of the Wistar rat palatal mucosa: 4NQO model. Head Neck.
18:441–449. 1996. View Article : Google Scholar : PubMed/NCBI
|
|
11
|
Tang XH, Knudsen B, Bemis D, Tickoo S and
Gudas LJ: Oral cavity and esophageal carcinogenesis modeled in
carcinogen-treated mice. Clin Cancer Res. 10:301–313. 2004.
View Article : Google Scholar : PubMed/NCBI
|
|
12
|
Qing C, Zhang LF, Wei H, Gu WW and Wang J:
Laboratory animal science. Beijing: People’s medical publishing
house; 2010
|
|
13
|
Barnes L, Eveson JW, Reichart P and
Sidransky D: World Health Organization Classification of Tumours.
Pathology and Genetics of Head and Neck Tumours. IARC Press; Lyon:
2005
|
|
14
|
Warnakulasuriya S, Reibel J, Bouquot J and
Dabelsteen E: Oral epithelial dysplasia classification systems:
predictive value, utility, weaknesses and scope for improvement. J
Oral Pathol Med. 37:127–133. 2008. View Article : Google Scholar : PubMed/NCBI
|
|
15
|
Lucas LH, Larive CK, Wilkinson PS and Huhn
S: Progress toward automated metabolic profiling of human serum:
comparison of CPMG and gradient-filtered NMR analytical methods. J
Pharm Biomed Anal. 39:156–163. 2005. View Article : Google Scholar : PubMed/NCBI
|
|
16
|
Vilela M, Borges CC, Vinga S, et al:
Automated smoother for the numerical decoupling of dynamics models.
BMC bioinformatics. 8:305–312. 2007. View Article : Google Scholar : PubMed/NCBI
|
|
17
|
Zhong F, Liu X, Zhou Q, et al:
1H NMR spectroscopy analysis of metabolites in the
kidneys provides new insight into pathophysiological mechanisms:
applications for treatment with Cordyceps sinensis. Nephrol Dial
Transplant. 27:556–565. 2012. View Article : Google Scholar
|
|
18
|
Weljie AM, Bondareva A, Zang P and Jirik
FR: 1H NMR metabolomics identification of markers of
hypoxia-induced metabolic shifts in a breast cancer model system. J
Biomol NMR. 49:185–193. 2011. View Article : Google Scholar : PubMed/NCBI
|
|
19
|
Xia J and Wishart DS: Web-based inference
of biological patterns, functions and pathways from metabolomic
data using MetaboAnalyst. Nat Protoc. 6:743–760. 2011. View Article : Google Scholar : PubMed/NCBI
|
|
20
|
Lippman SM, Sudbø J and Hong WK: Oral
cancer prevention and the evolution of molecular-targeted drug
development. J Clin Oncol. 23:346–356. 2005. View Article : Google Scholar : PubMed/NCBI
|
|
21
|
Ristow M: Oxidative metabolism in cancer
growth. Curr Opin Clin Nutr Metab Care. 9:339–345. 2006. View Article : Google Scholar : PubMed/NCBI
|
|
22
|
Brizel DM, Schroeder T, Scher RL, et al:
Elevated tumor lactate concentrations predict for an increased risk
of metastases in head-and-neck cancer. Int J Radiat Oncol Biol
Phys. 51:349–353. 2001. View Article : Google Scholar : PubMed/NCBI
|
|
23
|
Gatenby RA and Gawlinski ET: A
reaction-diffusion model of cancer invasion. Cancer Res.
56:5745–5753. 1996.PubMed/NCBI
|
|
24
|
Wopereis S, Rubingh CM, van Erk MJ, et al:
Metabolic profiling of the response to an oral glucose tolerance
test detects subtle metabolic changes. PLoS One. 4:e45252009.
View Article : Google Scholar : PubMed/NCBI
|
|
25
|
Landaas S and Pettersen JE: Clinical
conditions associated with urinary excretion of 2-hydroxybutyric
acid. Scand J Clin Lab Invest. 35:259–266. 1975. View Article : Google Scholar : PubMed/NCBI
|
|
26
|
Wagle SR, Morris HP and Weber G:
Comparative biochemistry of hepatomas. V Studies on amino acid
incorporation in liver tumors of different growth rates. Cancer
Res. 23:1003–1007. 1963.PubMed/NCBI
|
|
27
|
Glunde K, Jacobs MA and Bhujwalla ZM:
Choline metabolism in cancer: implications for diagnosis and
therapy. Expert Rev Mol Diagn. 6:821–829. 2006. View Article : Google Scholar : PubMed/NCBI
|
|
28
|
Möller-Hartmann W, Herminghaus S, Krings
T, et al: Clinical application of proton magnetic resonance
spectroscopy in the diagnosis of intracranial mass lesions.
Neuroradiology. 44:371–381. 2002. View Article : Google Scholar : PubMed/NCBI
|
|
29
|
van Dorsten FA, van der Graaf M,
Engelbrecht MR, et al: Combined quantitative dynamic
contrast-enhanced MR imaging and 1H MR spectroscopic
imaging of human prostate cancer. J Magn Reson Imaging. 20:279–287.
2004. View Article : Google Scholar : PubMed/NCBI
|
|
30
|
Jacobs MA, Barker PB, Bottomley PA,
Bhujwalla Z and Bluemke DA: Proton magnetic resonance
spectroscoptic imaging of human breast cancer: a preliminary study.
J Magn Reson Imaging. 19:68–75. 2004. View Article : Google Scholar
|