Introduction
MicroRNAs (miRNAs) are non-coding (nc) RNAs of ~22
nucleotides in length, the mutation or deregulated expression of
which are associated with a number of types of human cancers.
Furthermore, miRNAs act as tumor suppressor genes or oncogenes
(1). Profiling experiments have
determined that changes in the levels of miRNA expression are more
effective predictors of tumor type than changes in mRNA expression
levels. This led to the identification of miRNA signatures for
specific types of cancer (2).
Depending on their target genes, miRNAs may serve to stimulate or
suppress tumor formation and growth.
p27 is an atypical tumor suppressor that regulates
the G0/S phase transition by binding to and regulating
the activity of cyclin-dependent kinases (CDKs) (3). As a member of the Cip/Kip family, p27
binds to the catalytic cleft of the cyclin/CDK complex to prevent
ATP recognition. Notably, in the majority of human cancers the
expression levels of p27 protein are reduced or the protein is
mislocalized, which are associated with a poor prognosis.
Additionally, translation of p27 is downregulated by
miRNAs via their interactions with the 3′-untranslated region (UTR)
of mRNAs (4). It has been reported
that miR-221 and miR-222 bind to the 3′-UTR of p27 mRNA and inhibit
their translation. Hence, the miRNA-mediated inhibition of p27
translation may be a novel mechanism that reduces the expression
levels of p27 in certain types of human cancer. miR-150 is one of
the most extensively investigated miRNAs. It acts as a tumor
suppressor, and the downregulation of miR-150 induces the
activation of the PI3K-AKT pathway, leading to the activation of
telomerase and the immortalization of cancer cells (5). In the current study, the association
between miR-150 and p27 was investigated in order to elucidate the
regulatory mechanism of p27 at transcriptional and
post-transcriptional levels.
Materials and methods
Bioinformatics analysis
Analysis of the predicted miRNA targets was
undertaken using algorithms from TargetScan (http://genes.mit.edu/targetscan/). The biological
characters of these target genes were analyzed using the Database
for Annotation, Visualization and Integrated Discovery (DAVID;
http://david.abcc.ncifcrov/). In the
University of California, Santa Cruz database (UCSC; http://genome.ucsc.edu), a sequence between -2000 and
2000 bp of miR-150 was selected. Using the Match database, the
transcription factors (TF1) that may bind to the upstream sequence
of miR-150 were identified. In the same manner, the transcription
factors (TF2) that regulate p27 expression were identified. By
comparing TF1 and TF2, common transcription factors were identified
between miR-150 and p27.
Cell culture
THP1 and MCF-7 cell lines (Shanghai Institutes for
Biological Sciences, Chinese Academy of Sciences, Shanghai, China)
were cultured in RPMI-1640 medium (Invitrogen Life Technologies,
Carlsbad, CA, USA) supplemented with 10% fetal bovine serum
(Gibco-BRL, Carlsbad, CA, USA) at 37°C in a humidified atmosphere
with 5% CO2.
Plasmid construction and luciferase
assay
The entire human p27 3′-UTR was amplified by
polymerase chain reaction (PCR) using human genomic DNA as a
template. The PCR products were inserted into the p-GL3-report
plasmid (The University of Tokyo, Tokyo, Japan). Correct insertion
was confirmed using sequencing. For the luciferase reporter assays,
the cells were cultured in six-well plates. Each culture was
transfected with 2 μg firefly luciferase reporter plasmid (Jiangsu
Diabetes Center, State Key Laboratory of Pharmaceutical
Biotechnology, Nanjing University, Nanjing, China), 2 μg
β-galactosidase expression vector (Ambion Life Technologies,
Carlsbad, CA, USA), and equal amounts of scrambled ncRNA, a
synthetic RNA oligonucleotide mimicking miR-150 precursors
(pre-miR-150), or a chemically modified antisense oligonucleotide
designed to specifically target mature miR-150 (anti-miR-150) using
Lipofectamine 2000 (Invitrogen Life Technologies). The
β-galactosidase vector was used as a transfection control. At 24 h
post-transfection, the cells were assayed using a luciferase assay
kit (Promega, Madison, WI, USA). Data are representative of three
independent experiments performed on different days.
Overexpression or knockdown of
miR-150
miR-150 overexpression was achieved by transfecting
cells with pre-miR-150, whereas miR-150 knockdown was performed by
transfecting cells with anti-miR-150. An equal amount (200 pmol) of
scrambled ncRNA served as the negative control. MCF-7 cells were
seeded in six-well plates or 60-mm dishes and then transfected the
following day using Lipofectamine 2000, according to the
manufacturer’s instructions.
RNA isolation and reverse transcription
quantitative PCR (RT-qPCR)
Total RNA was extracted from the cultured cells
using TRIzol (Invitrogen Life Technologies) according to the
manufacturer’s instructions. For RT-qPCR analysis of p27 and
β-actin, cDNA was reverse transcribed from1 μg total RNA using
oligdT and Thermoscript (Takara, Dalian, China). qPCR analyses of
p27 and β-actin were performed on an ABI 7300 Sequence Detection
System (Applied Biosystems, Foster City, CA, USA) using SYBR green
dye (Invitrogen Life Technologies). The reaction included 1 μl
cDNA, 1× QuantiTect SYBR Green PCR master mix (Invitrogen Life
Technologies), and 0.5 μM of each sense and antisense primer, with
a final volume of 20 μl. All PCR was run in triplicate. Threshold
cycles (CT) were determined using fixed threshold settings. Primer
sequences were as follows: Forward, 5′-AGAGCCAACAGAACAGAAGAA-3′,
and reverse, 5′-AGAGGCAGATCATTTAAGAGTG-3′ for p27; and forward,
5′-AGGGAAATCGTGCGTGAC-3′ and reverse, 5′-CGCTCATTGCCGATAGTG-3′ for
β-actin.
Assays to quantify the levels of mature miR-150 were
performed using TaqMan microRNA probes (Applied Biosystems) as
previously described (6). Briefly,
5 μl total RNA was reverse transcribed to cDNA using AMV reverse
transcriptase (Takara) and a stem-loop RT primer (Applied
Biosystems). qPCR was performed using a TaqMan PCR kit (Takara) on
the ABI 7300 Sequence Detection System. All PCR experiments,
including the no template controls, were run in triplicate. The
miRNA expression levels were normalized using U6 snRNA as an
internal control (7). The relative
levels of miR-150 to U6 were calculated using the 2−ΔΔCT
equation, in which ΔCT = CTmiR-150 -
CTU6.
Western blotting
The expression levels of p27 protein were quantified
via western blot analysis of the whole cell extracts using a
monoclonal rabbit anti-human antibody against p27 (1:1,000; 3688,
Cell Signaling Technology, Inc., Danvers, MA, USA). Samples were
normalized by blotting with a polyclonal rabbit anti-human antibody
against α-tubulin (1:1,000; 2144, Cell Signaling Technology,
Inc.).
Statistical analysis
All images of western blotting and semi-quantitative
RT-PCR are representative of at least three independent
experiments. RT-qPCR and luciferase reporter assays were performed
in triplicate. Data are presented as the mean ± standard deviation
of at least three independent experiments.
Results
Bioinformatics analysis of miR-150
Using TargetScan, 275 target genes were identified
for miR-150 (Table I), including
p27. By the same method, it was determined that a number of miRNAs,
including miR-150, may bind to the 3′-UTR of p27 mRNA.
 | Table ITarget genes of miR-150 in the
TargetScan database. |
Table I
Target genes of miR-150 in the
TargetScan database.
| miRNA | Target genes |
|---|
| miR-150 | MYB, ADIPOR2, IRAK2,
PDCD4, C13orf34, ENSA, C22orf46, CBL, SV2B, CALCR, GABRA4, MTCH2,
ITGB3, DNAJB7, C7orf68, SP5, TADA1, ATP6V1H, USP13, ZNF229, ZEB1,
EPB41L5, WTAP, GLE1, LTBP2, MBD6, BASP1, ZBTB4, OSBPL9, ADAM19,
RORB, ENTPD1, ELOVL3, FOXD3, CAST MDGA1, TRIM66, CDKN1B,
CPD, CMTM6, NKX24, FADS1, PLP2, PISD, EIF4B, C7orf64, GCM2, TP53,
PIK3AP1, TMEM48, SORCS3, KIAA1274, VSIG10, PAN2, CAMK2G, MMP14,
GABRG2, GGNBP2, CNPPD1, UST, MBTD1, CACNA1G, LRRC58, PPFIA3,
TBC1D14, PAPPA, PRICKLE2, EP300, GRIPAP1, FTO, ARIH2, MRPL27,
FAM134C, S
TX5, UBFD1, EBF3, IRF2BP2, JPH2, C1orf183, EGR2, RIIAD1, SHISA4,
ZCCHC17, ZMAT2, ETF1, ITPRIPL2, RAB11A, SH3BP5L |
miR-150 is potent suppressor of p27
expression
miRNA associates with mRNA via complementary
Watson-Crick base pairing. The common criteria to determine whether
a transcript is a target for a miRNA is base pairing between the
‘seed’ and target, and an inverse correlation between the miRNA
expression levels and its target levels. The seed sequence (the
binding sequence of the target mRNA) has varying degrees of
complementarity with the miRNA (8).
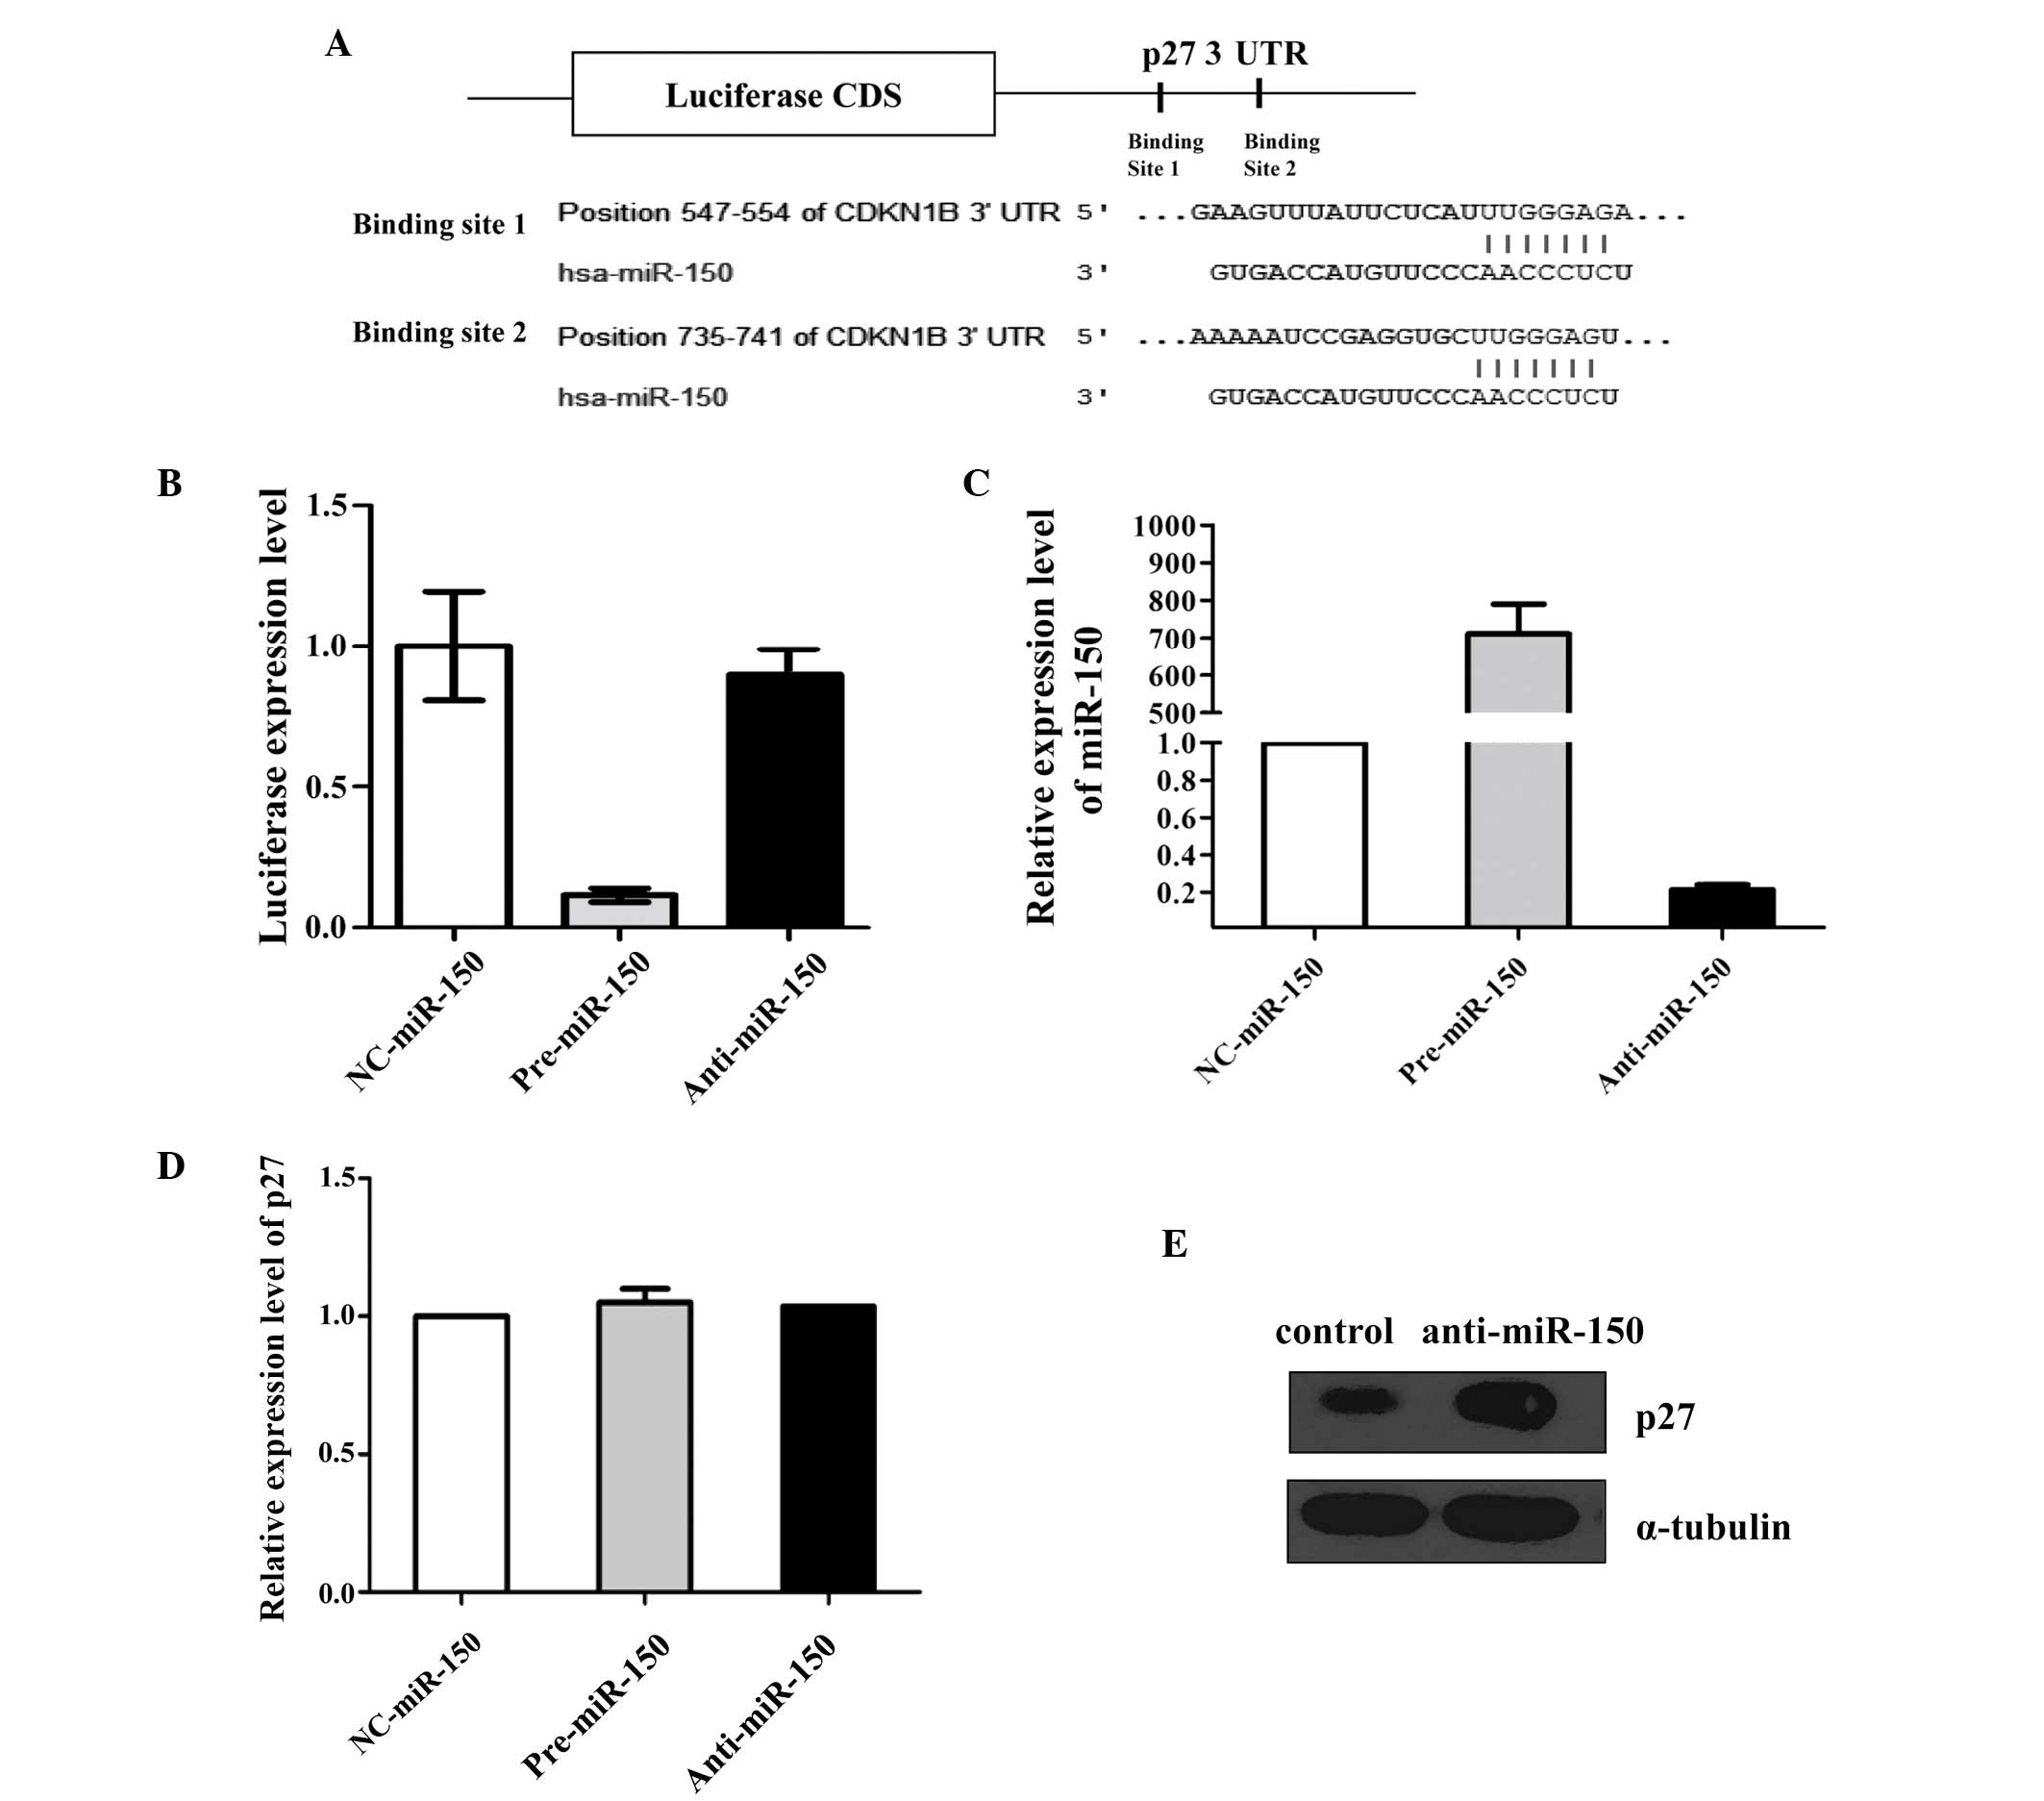
The results of the present study revealed that the p27 3′-UTR
harbors two sites that are likely recognized by miR-150, located at
nucleotides 547–554 and 735–741 of the p27 mRNA (NM_004064.0)
(Fig. 1A).
p27 is a direct target of miR-150
To investigate whether the negative regulation of
p27 expression by miR-150 occurred via binding to the
aforementioned complementary sites within the 3′-UTR of the p27
mRNA, the whole of the p27 3′-UTR was added to the downstream
position in a firefly luciferase reporter plasmid. Subsequently,
the plasmid was transfected into MCF-7 cells along with a
transfection control plasmid (β-gal) and pre-miR-150, anti-miR-150
or scrambled ncRNA. The overexpression of miR-150 resulted in a
significant decrease in the level of luciferase reporter activity
(normalized to β-gal activity) compared with that of the cells
transfected with the scrambled ncRNA. However, the inhibition of
miR-150 resulted in a less significant increase in reporter
activity (Fig. 1B). This finding
suggests that these binding sites strongly contribute to the
miRNA-mRNA interaction that mediates the post-transcriptional
inhibition of p27 expression.
This result was validated by performing an RT-qPCR
assay. MCF-7 cells were transfected with ncRNA, pre-miR-150 or
anti-miR-150 and analyzed for expression of miR-150 and p27 mRNA
using RT-qPCR at 24 h post-transfection (Fig. 1C and D). All of the cells that were
transfected with pre-miR-150 demonstrated increased levels of
miR-150 relative to those in the cells transfected with ncRNA. By
contrast, transfection with anti-miR-150 resulted in a significant
reduction in the expression levels of miR-150 in MCF-7 cells.
Western blot analysis of p27 protein levels in THP1 cells
demonstrated that the expression of p27 protein was elevated
following transfection with anti-miR-150 (Fig. 1E).
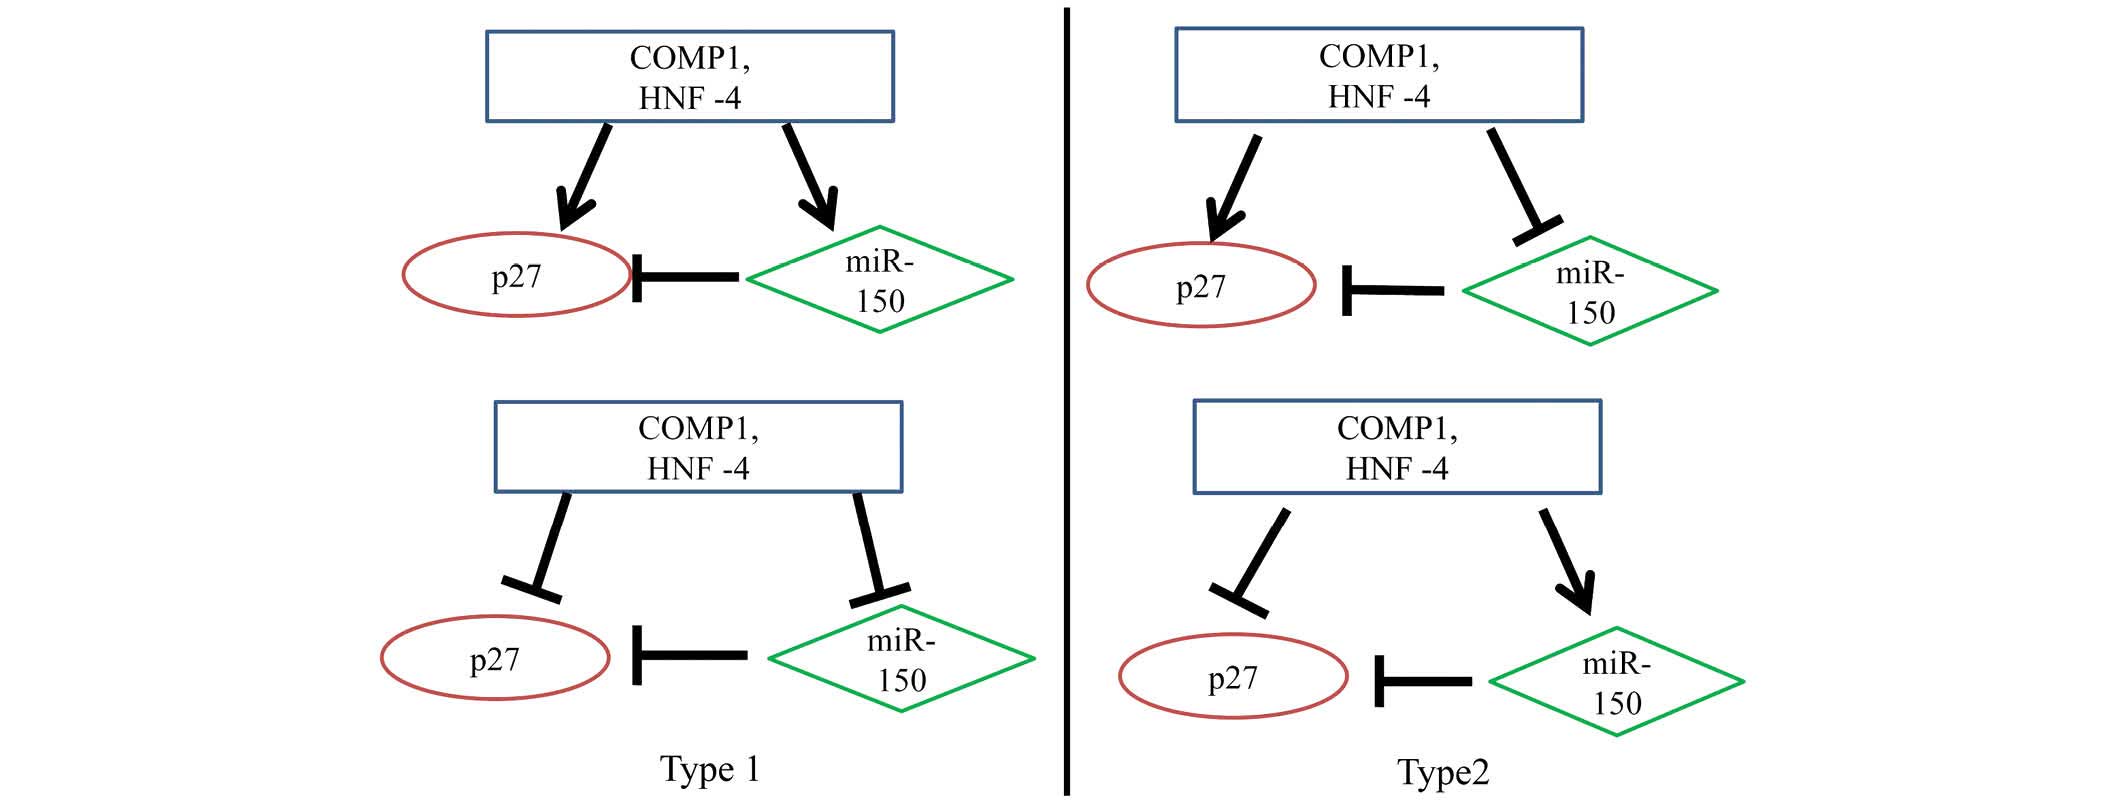
Analysis of transcription factors for
miR-150 and p27 expression
The transcription factors for miR-150 and p27
expression included Oct-1, AP-1, NF-1, Pax-4, USF, cooperates with
myogenic proteins 1 (COMP1), hepatocyte nuclear factor (HNF)-1,
SOX-9, Pax-6, Pax-4, HNF-4, Cart-1, Elk-1, HNF-3β and FOXD3. Using
the UCSC and Match databases, COMP1 and HNF-4 were identified as
common transcription factors for miR-150 and p27 expression. Using
DAVID, it was determined that p27 was involved in pathways
regulated by miR-150. Therefore, these results have revealed a
regulatory loop involving COMP1 and HNF-4-miR-150-p27. The
transcription factors COMP1 and HNF-4 may enhance or attenuate the
regulation of miR-150 and p27. Due to the computational procedure
adopted to identify the regulatory loop based on sequence analysis
only, it was not possible to determine whether the actions of COMP1
and HNF-4 were excitatory or inhibitory. Therefore, we propose
there are two types of interactions (Fig. 2) (9). The results of the current study
attained that there are two kinds of microRNA-transcription factor
feed-forward regulatory circuits, which are referred to as Type I
and Type II circuits (10). Tsang
et al (10) reported that
Type I circuits stabilize the steady state production of a protein
by dumping transcriptional fluctuations, whereas Type II (coherent)
circuits lead to the reinforcement of transcriptional regulation at
the post-transcriptional level. COMP1 and HNF-4 act as master
transcription factors, inducing the expression of miR-150 and the
joint target p27, which in turn, is repressed by miR-150.
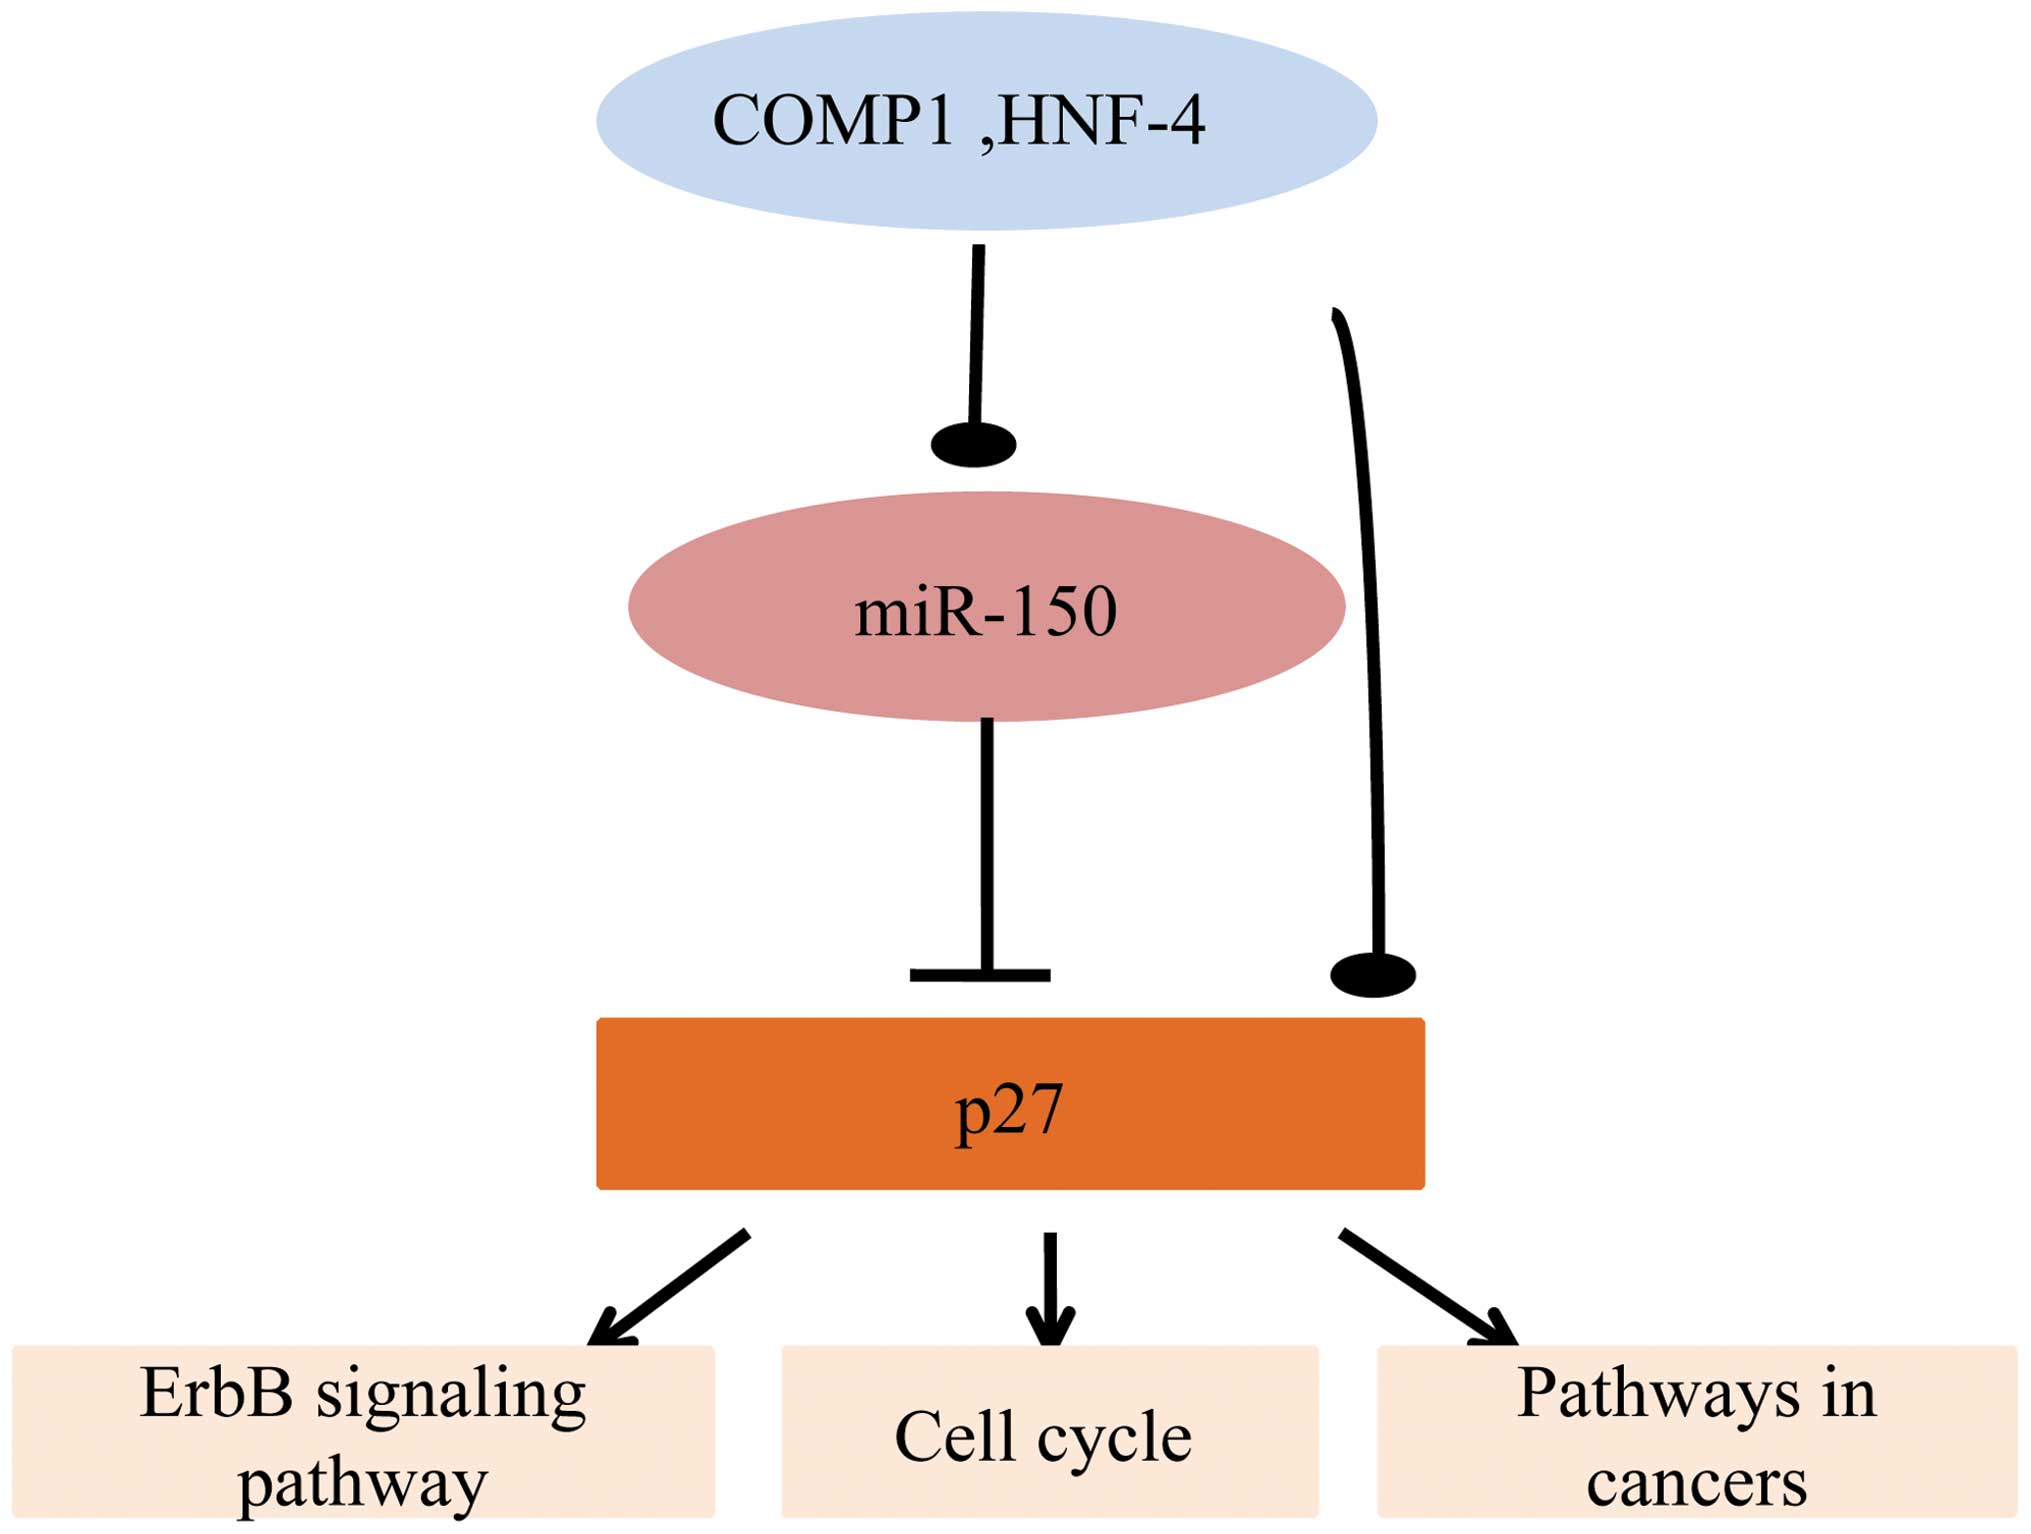
Bioinformatics analysis of the characters
of miR-150
The target genes of miR-150 were imported into
DAVID. The gene ontology (GO) biological processes (BP), GO
molecular functions (GOMF), and Kyoto Encyclopedia of Genes and
Genomes (KEGG) pathways were analyzed. It was determined that
miR-150-p27 participated in important GOBP, including the
regulation of microtubule cytoskeleton organization, the regulation
of phosphorus metabolic processes, the negative regulation of
transcription and programmed cell death. Additionally, miR-150-p27
was involved in important GOMF, including protein kinase regulator
activity and kinase regulator activity. In addition, they were
involved in certain important signaling pathways, including the
ErbB signaling pathway and pathways involved in cancer and the cell
cycle (Table II). Hence, we
propose that the regulatory loop of COMP1 and HNF-4-miR-150-p27 has
a complicated role in these critical biological processes (Fig. 3).
| Table IIKEGG pathways regulated by miR-150
target genes. |
Table II
KEGG pathways regulated by miR-150
target genes.
| KEGG Pathway | Involved gene |
|---|
| hsa04012: ErbB
signaling pathway | PRKCA, CDKN1B,
CAMK2G, GSK3B, CBL, GAB1, MAP2K4, ELK1, AKT3 |
| hsa05213: Endometrial
cancer | GSK3B, TP53, ELK1,
AKT3, APC |
| hsa05217: Basal cell
carcinoma | GSK3B, TP53, FZD4,
APC |
| hsa05210: Colorectal
cancer | ACVR1B, GSK3B, TP53,
FZD4, AKT3, APC |
| hsa05220: Chronic
myeloid leukemia | ACVR1B, CDKN1B, CBL,
TP53, AKT3 |
| hsa04310: Wnt
signaling pathway | PRKCA, EP300, CAMK2G,
GSK3B, BTRC, PRICKLE2, TP53, FBXW11, FZD4, APC |
| hsa04912: GnRH
signaling pathway | PRKCA, MAPK13,
CAMK2G, MAP2K4, ELK1, MMP14 |
| hsa04722:
Neurotrophin signaling pathway | IRAK2, MAPK13,
CAMK2G, GSK3B, GAB1, TP53, AKT3 |
| hsa05215: Prostate
cancer | CDKN1B, EP300, GSK3B,
TP53, AKT3 |
| hsa04340: Hedgehog
signaling pathway | GSK3B, BTRC,
FBXW11 |
| hsa04664: Fc epsilon
RI signaling pathway | PRKCA, MAPK13,
MAP2K4, AKT3 |
| hsa05222: Small
cell lung cancer | COL4A4, CDKN1B, TP53,
AKT3 |
| hsa04514: Cell
adhesion molecules (CAMs) | GLG1, PECAM1, PVRL2,
NFASC, NLGN3, NEGR1 |
| hsa05212: Pancreatic
cancer | ACVR1B, TP53,
AKT3 |
| hsa04010: MAPK
signaling pathway | PRKCA, ACVR1B, DUSP3,
MAPK13, MAP2K4, CACNA1G, TP53, ELK1, AKT3, MAP3K12 |
| hsa05200: Pathways
in cancer | PRKCA, COL4A4,
ACVR1B, CDKN1B, EP300, GSK3B, CBL, SLC2A1, TP53, FZD4, AKT3,
APC |
| hsa04110: Cell
cycle | CDKN1B, EP300, GSK3B,
TP53 |
| hsa04120: Ubiquitin
mediated proteolysis | BTRC, CBL, FBXW11,
UBE2R2 |
| hsa04060:
Cytokine-cytokine receptor interaction | CSF3, ZFP91, ACVR1B,
EDA, CCL5 |
Discussion
Using the UCSC and Match databases, two common
transcription factors were identified for miR-150 and p27: COMP1
and HNF-4. In addition, the possible biological roles of this
regulatory loop were analyzed using DAVID. Furthermore, it was
determined that miR-150-p27 participated in the regulation of
microtubule cytoskeleton organization, the regulation of phosphorus
metabolic processes, and the negative regulation of transcription
and programmed cell death. miR-150-p27 was also involved in the
regulation of protein kinase regulator activity and kinase
regulator activity. Notably, miR-150-p27 participated in crucial
signaling pathways, including the ErbB signaling pathway and
pathways involved in cancer and the cell cycle. Therefore, the
results of this study indicate that there may be a regulatory loop
between COMP1 and HNF-4-miR-50-p27. Further study is required to
test this hypothesis and comprehensively examine the regulation of
p27 expression by miR-150.
Expression of p27 is regulated at multiple levels,
including transcription, mRNA stability, translation, proteolysis,
and subcellular localization. Several mechanisms of regulation may
coexist in a single cell depending on the cell type, extracellular
stimuli and biological circumstances (11). miRNAs have been recognized as key
regulators of p27 mRNA expression. The first indications that
miRNAs play a role in the expression of p27 were observed in
Drosophila (12).
The results of the current study, which identified
p27 as a target of miR-150 in carcinoma cell lines, are in
agreement with the dynamic view of the miRNA-mediated regulation of
gene expression. The association between miRNAs and target mRNAs is
not a ‘one to one’ association, as the same mRNA can be regulated
by more than one miRNA. Furthermore, the degree to which miRNAs
target a specific 3′-UTR are strongly determined by the specific
cellular environment (13).
miR-150 is specifically expressed in mature
lymphocytes. A major predicted target of miR-150 is c-Myb, a
transcription factor that controls multiple steps of lymphocyte
development (13). Furthermore,
control of the Notch pathway through miR-150 may have an important
effect on T-cell development. The results of the current study
suggest that miR-150 may regulate p27 at the post-transcription
level.
Investigation of transcription factor binding sites
indicates that transcriptional and post-transcriptional regulatory
interactions can be predicted in silico by searching for
over-represented short sequences of nucleotides present in
promoters or 3′-UTRs (14).
Therefore, the aim of the current study was to use computational
tools to generate a list of regulatory loops in wfhich a master
transcription factor regulated a miRNA together with target genes
(15). As a result, a regulatory
loop involving COMP1 and HNF-4-miR-150-p27 was revealed. The
primary purpose of this study was to systematically investigate the
associations between the transcriptional and post-transcriptional
network interactions of p27. A regulatory loop has been previously
validated for MYC-E2F2/E2F1-miR-20a (13), which is a Type I.
In conclusion, additional functional studies are
required to understand the molecular basis of the formation of this
regulatory loop, and to provide insight towards the development of
innovative therapies targeting specific tumor markers.
Acknowledgements
This study was supported by a research grant from
the National Natural Foundation of China (no. 81272252) and by the
Foundation for Clinical Medicine, Science and Technology Project of
Jiangsu Province, China (no. BL2014071).
References
|
1
|
Esquela-Kerscher A and Slack FJ:
Oncomirs-microRNAs with a role in cancer. Nat Rev Cancer.
6:259–269. 2006. View
Article : Google Scholar : PubMed/NCBI
|
|
2
|
Lee YS and Dutta A: MicroRNAs in cancer.
Annu Rev Pathol. 4:199–227. 2009. View Article : Google Scholar :
|
|
3
|
Chu IM, Hengst L and Slingerland JM: The
Cdk inhibitor p27 in human cancer: prognostic potential and
relevance to anticancer therapy. Nat Rev Cancer. 8:253–267. 2008.
View Article : Google Scholar : PubMed/NCBI
|
|
4
|
le Sage C, Nagel R and Agami R: Diverse
ways to control p27Kip1 function: miRNAs come into play. Cell
Cycle. 6:2742–2749. 2007. View Article : Google Scholar : PubMed/NCBI
|
|
5
|
Watanabe A, Tagawa H, Yamashita J, Teshima
K, Nara M, Iwamoto K, Kume M, Kameoka Y, Takahashi N, Nakagawa T,
Shimizu N and Sawada K: The role of microRNA-150 as a tumor
suppressor in malignant lymphoma. Leukemia. 25:1324–1334. 2011.
View Article : Google Scholar : PubMed/NCBI
|
|
6
|
Chen C, Ridzon DA, Broomer AJ, Zhou Z, Lee
DH, Nguyen JT, Barbisin M, Xu NL, Mahuvakar VR, Andersen MR, Lao
KQ, Livak KJ and Guegler KJ: Real-time quantification of microRNAs
by stem-loop RT-PCR. Nucleic Acids Res. 33:e1792005. View Article : Google Scholar : PubMed/NCBI
|
|
7
|
Schmittgen TD, Jiang J, Liu Q and Yang L:
A high-throughput method to monitor the expression of microRNA
precursors. Nucleic Acids Res. 32:e432004. View Article : Google Scholar : PubMed/NCBI
|
|
8
|
Edelstein LC and Bray PF: MicroRNAs in
platelet production and activation. Blood. 117:5289–5296. 2011.
View Article : Google Scholar : PubMed/NCBI
|
|
9
|
Hornstein E and Shomron N: Canalization of
development by microRNAs. Nat Genet. 38:S20–S24. 2006. View Article : Google Scholar : PubMed/NCBI
|
|
10
|
Tsang J, Zhu J and van Oudenaarden A:
MicroRNA-mediated feedback and feedforward loops are recurrent
network motifs in mammals. Mol Cell. 26:753–767. 2007. View Article : Google Scholar : PubMed/NCBI
|
|
11
|
Chu I, Sun J, Arnaout A, Kahn H, Hanna W,
Narod S, Sun P, Tan CK, Hengst L and Slingerland J: p27
phosphorylation by Src regulates inhibition of cyclin E-Cdk2. Cell.
128:281–294. 2007. View Article : Google Scholar : PubMed/NCBI
|
|
12
|
Haag A: A trip of a lifetime. Nature.
435:1018–1020. 2005. View
Article : Google Scholar : PubMed/NCBI
|
|
13
|
Meltzer PS: Cancer genomics: small RNAs
with big impacts. Nature. 435:745–746. 2005. View Article : Google Scholar : PubMed/NCBI
|
|
14
|
Elnitski L, Jin VX, Farnham PJ and Jones
SJ: Locating mammalian transcription factor binding sites: a survey
of computational and experimental techniques. Genome Res.
16:1455–1464. 2006. View Article : Google Scholar : PubMed/NCBI
|
|
15
|
Re A, Corá D, Taverna D and Caselle M:
Genome-wide survey of microRNA-transcription factor feed-forward
regulatory circuits in human. Mol Biosyst. 5:854–867. 2009.
View Article : Google Scholar : PubMed/NCBI
|