Introduction
microRNA (miRNA/miR) is a ~22 nt long, non-coding
small RNA that is essential in post-transcriptional regulation and
has been suggested to directly and indirectly regulate genesis,
differentiation, proliferation, growth and apoptosis in eukaryotes,
particularly in carcinogenesis (1–4).
As one well-established technique used to
quantitatively study micromolecules, in situ hybridization
(ISH) is favored due to its ability to directly observe the spatial
expression of the studied candidate. Through utilizing radioactive
isotopes, fluorophores or chromophores as indicators to label any
single complementary DNA or RNA strand so that the strand serves as
a probe and targets specific counterstrands of interest, ISH allows
the visualization of minute changes within cells (5,6).
Variant forms of ISH have been derived and widely applied in the
field of diagnostics, as well as in fundamental studies (6).
Multispectral imaging microscopy (MSI) is an
advanced method applied in the analysis of macro- and microscopic
samples from a three-dimensional aspect (7,8). MSI
is a quantitative technique that adds spatial resolution to the
spectral images when analyzing samples, first performed by
assigning intensity as a function of wavelength, then by acquiring
an image as a constellation of pixel units, with each pixel unit
classified by its spectral signature, and genuinely creating an
image cube that contains spectral and spatial information (8,9). This
does not only resolve the expression of numerous components within
a single cell, but also generates information on any dynamic
changes from normal to aberrant cells, providing a simple yet
convenient method for biomedical studies (9–11).
The present study attempted to observe the changes
in the expression level of miR-92a at a tissue level, as miR-92a
had been previously proven to increase at the cellular, plasma and
fecal levels during the development of colorectal adenocarcinoma
(CA) (12–14). It was found that quantitation of
miRNAs was not realized by ISH independently, as miR-92a was only
expressed in cells with a differentiation in level, which was
consistent with the findings of Liang et al (15). Therefore, a secondary approach of
employing a spectral imaging technique followed by ISH was
developed in an attempt to quantitate the changes in level of
miR-92a expression.
Materials and methods
Tissue samples
In total, 34 tissue samples of colorectal lesions
collected from the surgically resected specimens obtained from
colorectal cancer patients who underwent hemicolorectomies and
colorectomies at Huashan Hospital (Shanghai, China) between 2009
and 2012, that represented three consecutive stages were grouped as
follows: 10 samples of low-grade intraepithelial neoplasia (LGIN),
11 samples of high-grade intraepithelial neoplasia (HGIN) and 13
samples of CA. For the internal normal control, 31 normal
paralesional tissue samples were obtained, and were divided into
three groups: Nine normal controls for LGIN (LGIN-N), 10 for HGIN
(HGIN-N) and 12 for CA (CA-N). Three samples possessed no adjacent
normal mucosa samples. Diagnoses were confirmed by two senior
pathologists in the Department of Pathology (School of Basic
Medical Sciences, Fudan University, Shanghai, China). The study was
approved by the ethics committee of Shanghai Medical College, Fudan
University. Written informed consent was obtained from all
patients.
miRNA in situ hybridization
All samples were fixed with 10% buffered formalin
and were paraffin embedded. Each sample block was sectioned into
6-μm thick slices and mounted on charged slides. Hybridization was
performed following the procedures reported previously (16,17).
Briefly, the slides were deparaffinized and dehydrated with xylene
and an ascending gradient of ethanol and the slides were then
rehydrated using phosphate-buffered saline (PBS) at pH 7.4.
Subsequently, proteinase digestion was performed using proteinase K
(15 μg/ml; Exiqon, Vedbaek, Denmark) for 8 min at 37°C, and the
slides were washed with 3× PBS at pH 7.4. Hybridization was
performed with a locked nucleic acid (LNA)-modified,
5′-digoxigenin-labeled probe of miR-92a (sense,
5′-ACAGGCCGGGACAAGTGCAATA-3′; Exiqon) at a concentration of 40 nM,
using PTC-100™ Programmable Thermal Controller (MJ Research, Inc.,
Waltham, MA, USA) at 55°C for 1 h. Following hybridization, a
stringency wash was performed on the slides with a descending
gradient of saline-sodium citrate (5×, 2× and 0.2×) at 4°C
(17). Blocking was performed using
anti-digoxigenin alkaline-phosphatase combined with sheep serum
(DIG Nucleic Acid Detection kit; Roche Diagnostics, Indianapolis,
IN, USA) at room temperature for 1 h. The slides were then stained
with nitro blue tetrazolium/5-bromo-4-chloro-3-indolyl phosphate
(NBT/BCIP; SIGMAFAST™ BCIP®/NBT; Sigma-Aldrich, St.
Louis, MO, USA) for signal development, and the nuclei were
counterstained with methyl green.
Visual grading of ISH result
The average expression of miR-92a on the slides was
visually and individually graded by two pathologists using a light
microscope at ×200 magnification (Carl Zeiss Microscopy GmbH,
Göttingen, Germany). A four-tier scoring system was devised
according to the cytoplasmic staining intensity: i) Negative,
unstained cytoplasm or cytoplasm exhibiting only background color;
ii) weak positive, cytoplasm exhibiting a light indigo color; iii)
moderate, cytoplasm exhibiting a weak to moderate indigo stain; and
iv) strong positive, cytoplasm exhibiting a dark indigo stain.
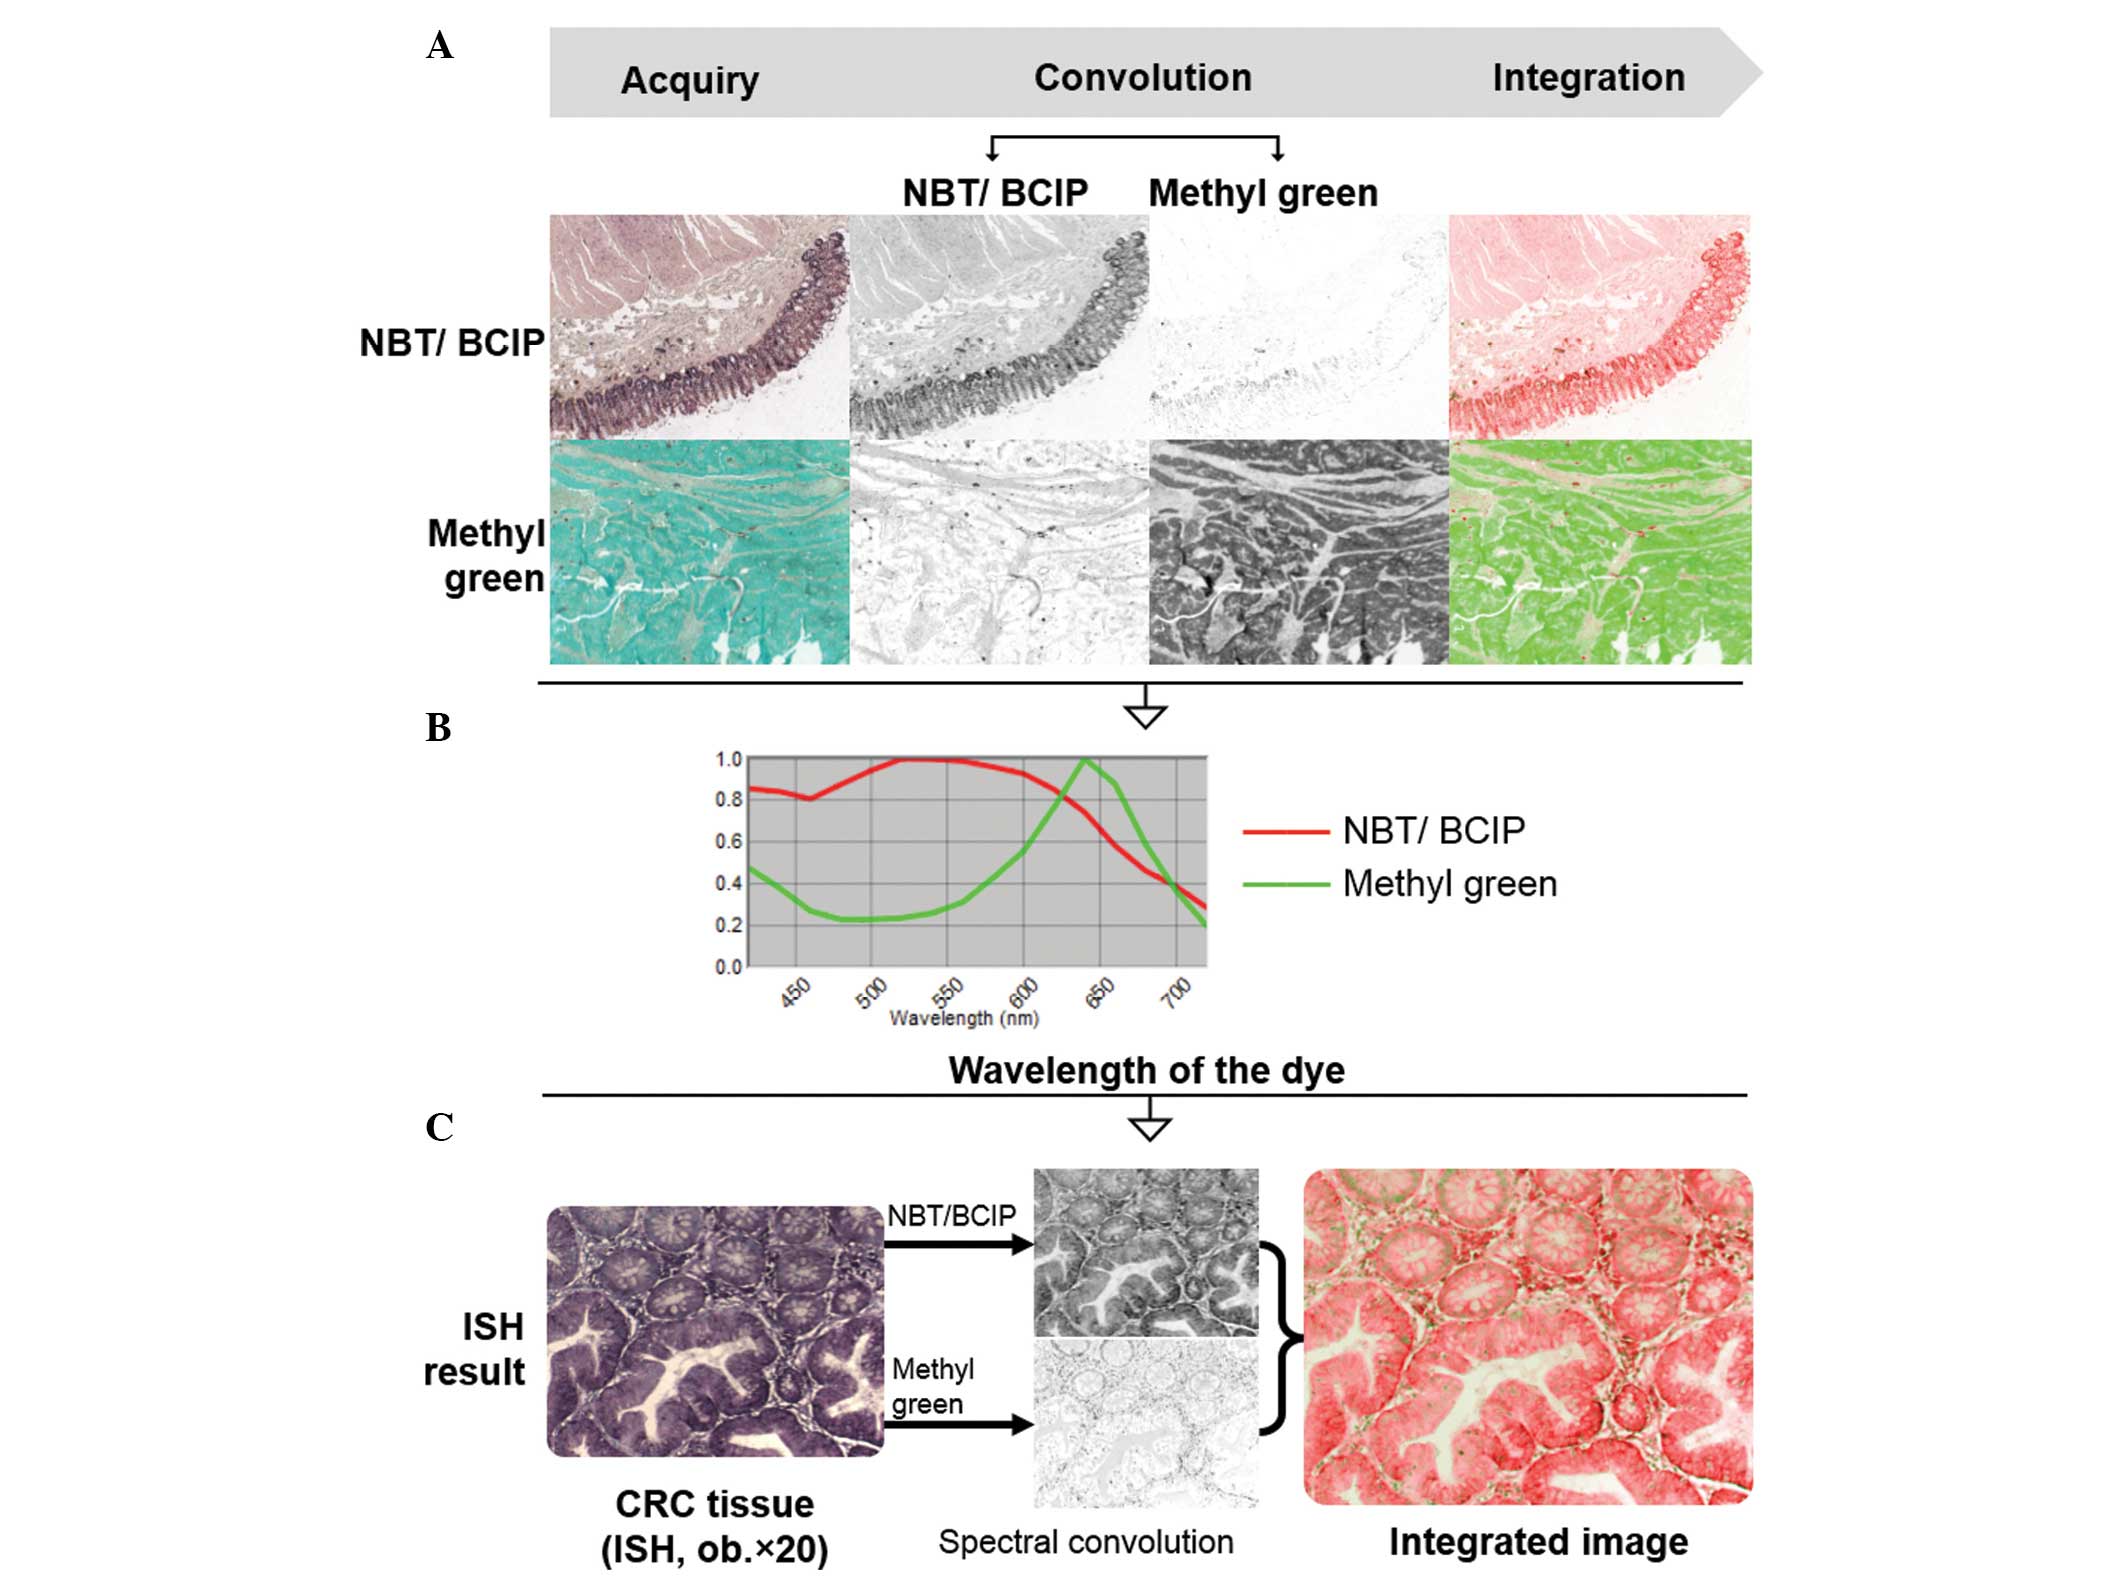
Image acquisition and signal
interpretation by MSI system
Using the CRi-Nuance™ Multispectral Imaging System
(Cambridge Research and Instrumentation Inc., Woburn, MA, USA), one
representative unstained slide from each of the three investigated
groups was selected and stained with NBT/BCIP and methyl green,
respectively. These slides were used to obtain spectral references,
as shown in Fig. 1. For each tissue
sample, a region of interest (ROI) demonstrating the average visual
grading was randomly selected within the site of miR-92a
expression, and images were then acquired under ×200 magnification
using a charge-coupled device (CCD) camera to accompany the imaging
system. The average NBT/BCIP optical density (OD) signal was
detected from each field, and the average signal and pixel areas
were further generated within the ROI by the Nuance analyzer
(Cambridge Research and Instrumentation Inc.) as shown in Fig. 2. Signal interpretation was also
devised into a four-tiered system by a quartile cut-off value
according to the minimum (0.20825) and maximum (0.9455) OD: i)
Negative, OD ≤0.377; ii) weak positive, OD 0.378–0.5105; iii)
moderate, OD 0.5106–0.68025; and iv) strong positive, OD
>0.68025. The average signal was calculated from the area using
unit pixels and the concentration of miR-92a in the cytoplasm, as
represented by the NBT/BCIP concentration, as follows: Average
signal = Total signal / Area pixels. Provided that miR-92a
concentration per cell = total NBT / BCIP concentration per cell,
miR-92a concentration per cell = miR-92a concentration within
(cytoplasm + nucleus): NBT/BCIP cytoplasm = [total signal (full
image) − total signal (overlap)] / [total signal (full image) −
total signal (overlap)]. Thus, miR-92a concentration within the
cytoplasm = total NBT/BCIP concentration per cell − NBT/BCIP
concentration within the nucleus, which was therefore, the
concentration of NBT/BCIP in the cytoplasm, the non-overlapped area
with NBT/BCIP expression per cell.
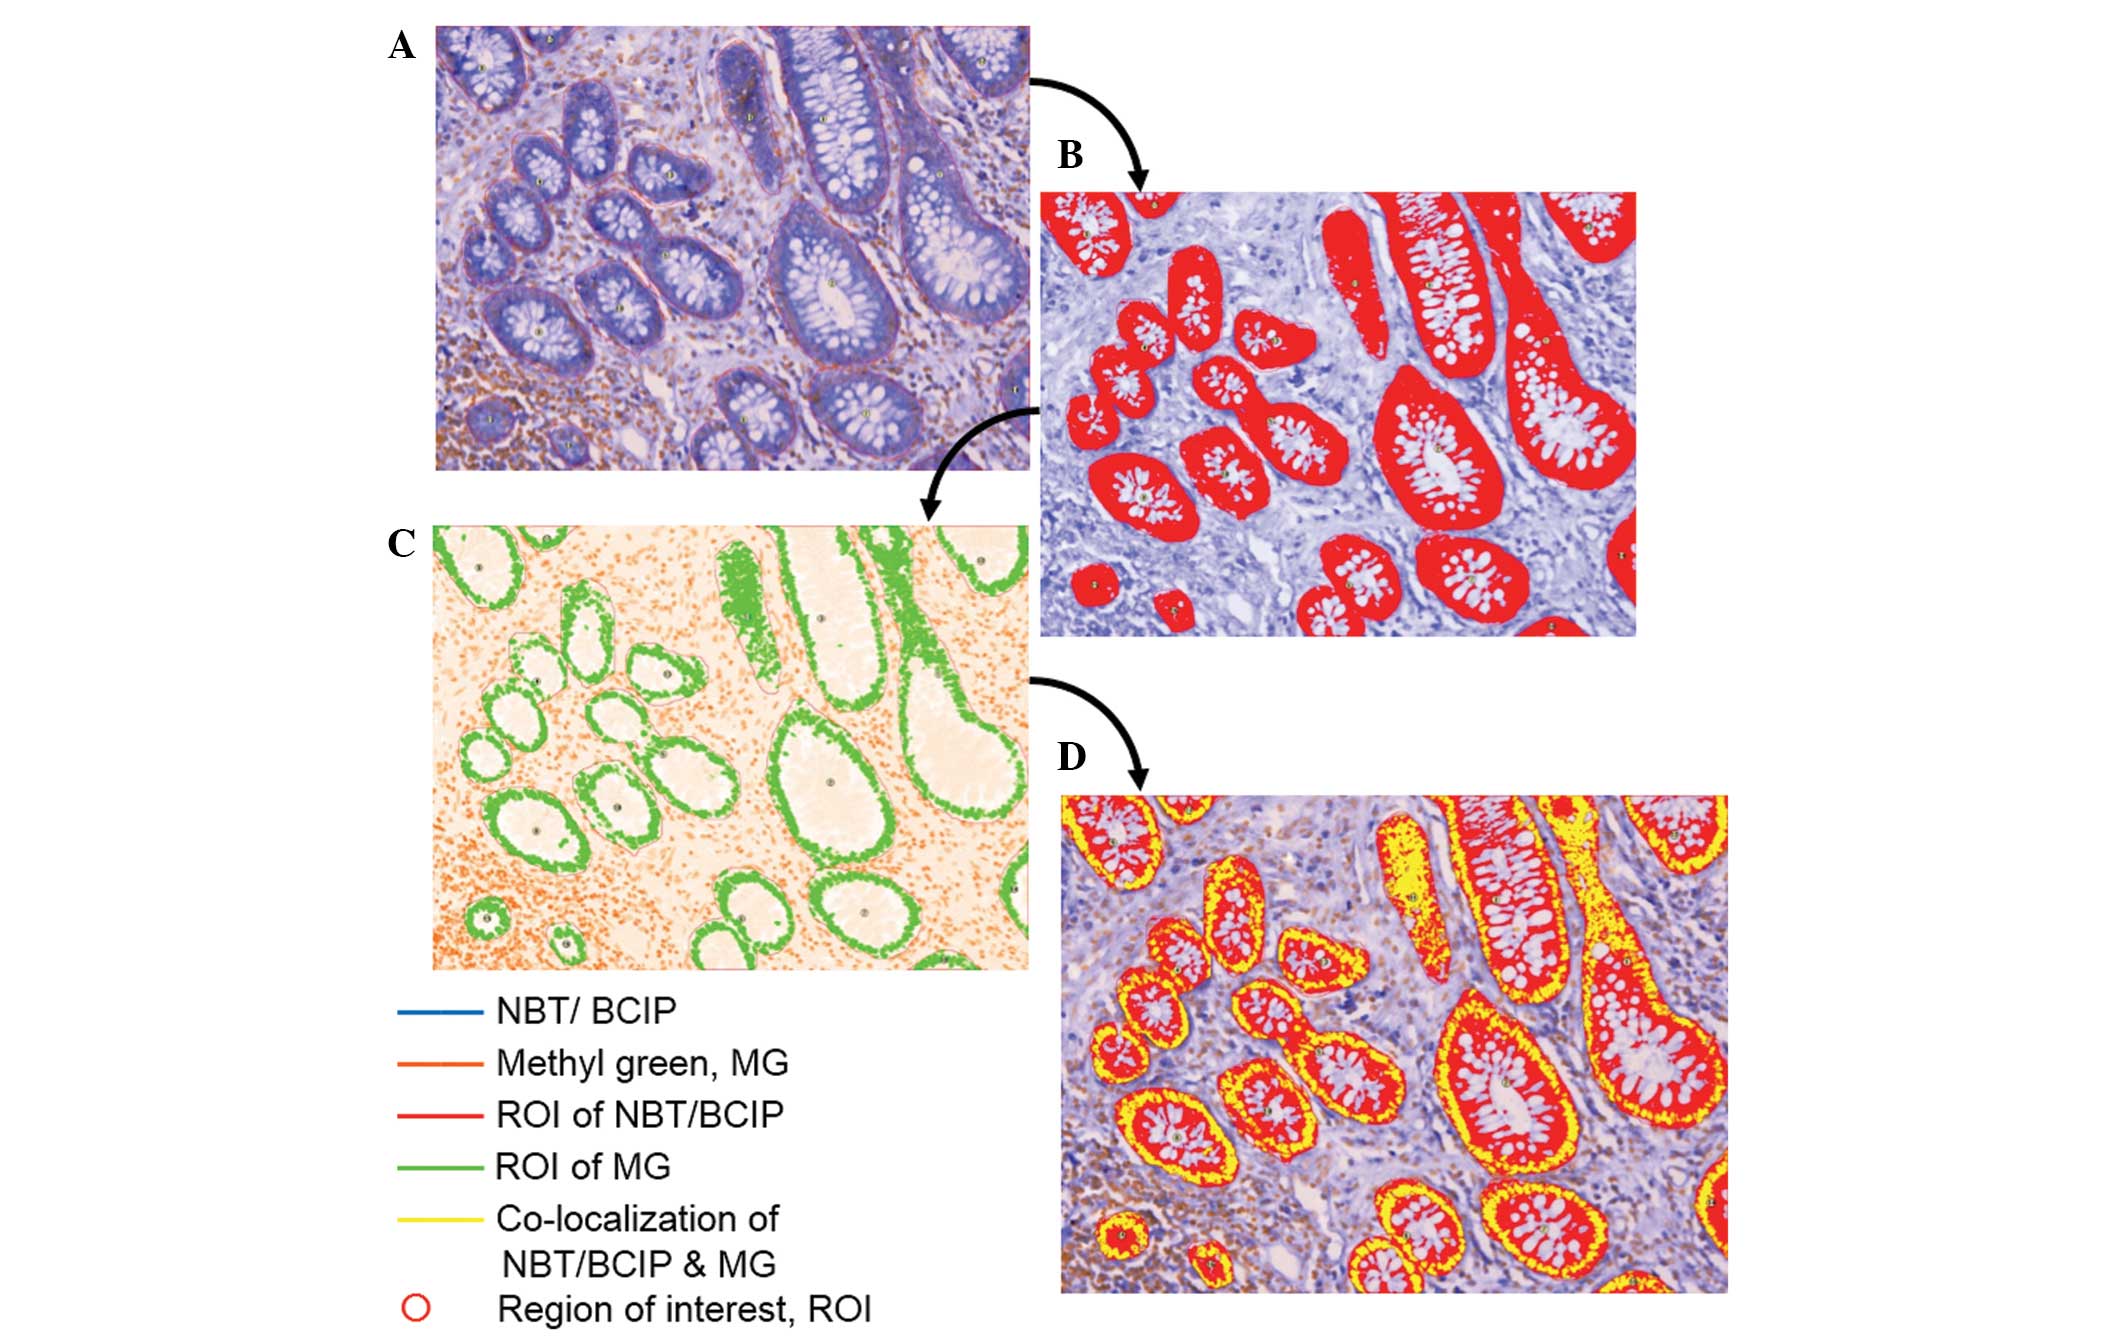 | Figure 2CRi-Nuance™ Multispectral Imaging
System was applied to analyze the expression level of miR-92a in
colorectal adenocarcinoma and its precancerous lesions. Applying
the function of co-localization of Nuance to analyze the expression
level of miR-92a in colorectal tissue, the expression pattern and
intensity were then generated as raw data for further statistical
assay. (A) A different color was appointed to represent NBT/BCIP
and MG, and the region of interest was circled. In the image, blue
represents NBT/ BCIP, orange represents MG and red circles
represent the region of interest. (B) The threshold of ROI was
adjusted and the orange color represents the area where miR-92a is
expressed. (C) The threshold of MG was adjusted and the green color
represents the area stained with the dye. (D) The threshold of the
channel was adjusted, indicating co-localization of NBT/BCIP and
MG. The yellow color represents data generated based on the pixel
area, followed by calculation of the concentration of NBT/BCIP in
the cytoplasm with the formula as provided, which represented the
expression of miR-92a. NBT/BCIP, nitro blue
tetrazolium/5-bromo-4-chloro-3-indolyl phosphate; ROI, region of
interest; MG, methyl green. |
Statistical analysis
Using Microsoft Excel 2007 (Microsoft, Redmond, WA,
USA), a t-test with unequal variance was used to compare
LGIN, HGIN, CA and their paralesional normal counterparts, LGIN-N,
HGIN-N and CA-N, to estimate the differential expression of
miR-92a. Statistical significance was defined as the two-tailed
P-value for rejecting the hypothesis of zero correlation and
indicated using P<0.05. A scatter diagram was plotted by
Graphpad Prism® (Version 5.0; GraphPad Software, Inc.,
La Jolla, CA, USA) to illustrate the association between the visual
grading of ISH and the OD value obtained from ISH-MSI.
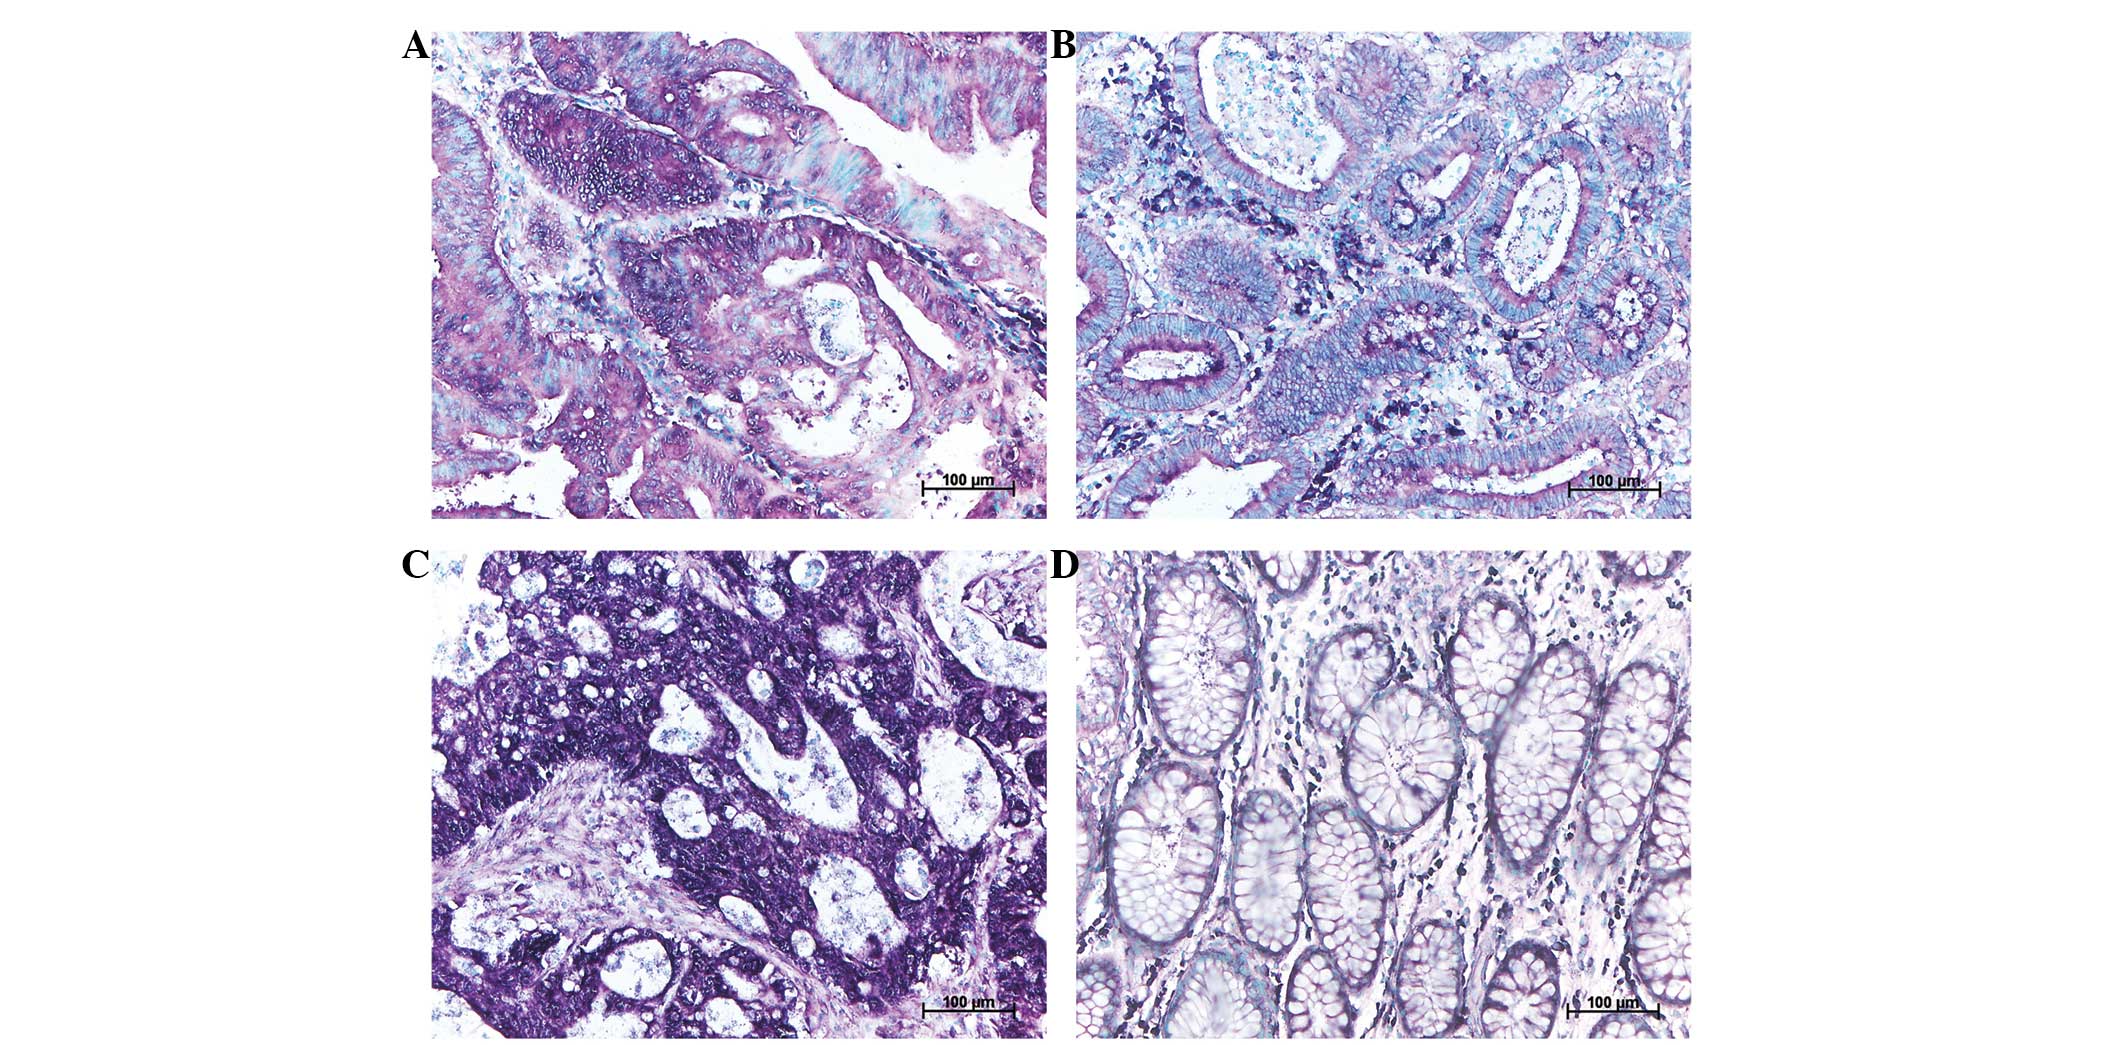
Results
miR-92a expression level is visually
indeterminable by ISH in CA, LGIN, HGIN and each of their
corresponding paralesional normal controls
All tissue sections indicated at least partial
positivity for miR-92a expression. Therefore, no section was graded
as negative in Fig. 3. The median
visual grading (VDx) of staining intensity was moderate for
CA, CA-N, LGIN and LGIN-N, while for HGIN and HGIN-N the VDx
was moderate to positive and moderate, respectively.
miR-92a expression level significantly
differs between CA, LGIN, HGIN and their paralesional normal
controls, as determined by MSI analysis
Using the MSI system, the expression level of
miR-92a in the cytoplasm was isolated and further analyzed
following the aforementioned calculations. Statistically
significant differences were observed in the expression level of
miR-92a between various categories of CA, CA-N, LGIN and HGIN, and
their paralesional normal controls, LGIN-N and HGIN-N,
respectively. In particular, for the average pixel area of the
cytoplasm covered with NBT/BCIP, which determined the expression
area of miR-92a, a significant difference was revealed when CA was
compared with CA-N (P=0.020) and LGIN (P=0.018), when HGIN was
compared with CA-N (P=0.027) and LGIN (P=0.018), when LGIN-N was
compared with HGIN (P=0.012) and CA (P=0.0014), and when HGIN-N was
compared with LGIN-N (P=0.0009). In the nuclei, the average pixel
area of NBT/BCIP presented a significant difference in miR-92a
expression when LGIN-N was compared with CA-N (P=0.019) and HGIN-N
(P=0.031), when CA was compared with CA-N (P=0.0099), when CA-N was
compared with LGIN (P=0.004) and when HGIN-N was compared with CA
(P=0.014) and LGIN (P=0.006). For the expression intensity of
miR-92a, denoted by NBT/BCIP, a significant difference was revealed
when LGIN was compared with HGIN-N (P=0.012) and when CA-N was
compared with LGIN (P=0.0006). For the nuclei to cytoplasm ratio of
miR-92a expression intensity, a significant difference was revealed
when HGIN-N was compared with CA (P=0.017), LGIN (P=0.038) and
LGIN-N (P=0.046). Also, there was a significant difference when
CA-N was compared with HGIN (P=0.028). For the expression area of
miR-92a over the ROI, a significant difference was revealed when
HGIN-N was compared with CA (P=0.032), LGIN (P=0.002) and LGIN-N
(P=0.011), when HGIN was compared with CA-N (P=0.032) and LGIN
(P=0.011), when CA was compared with CA-N (P=0.005), and when CA-N
was compared with LGIN (P=0.001) and LGIN-N (P=0.003). All these
data are summarized and extrapolated in Fig. 4.
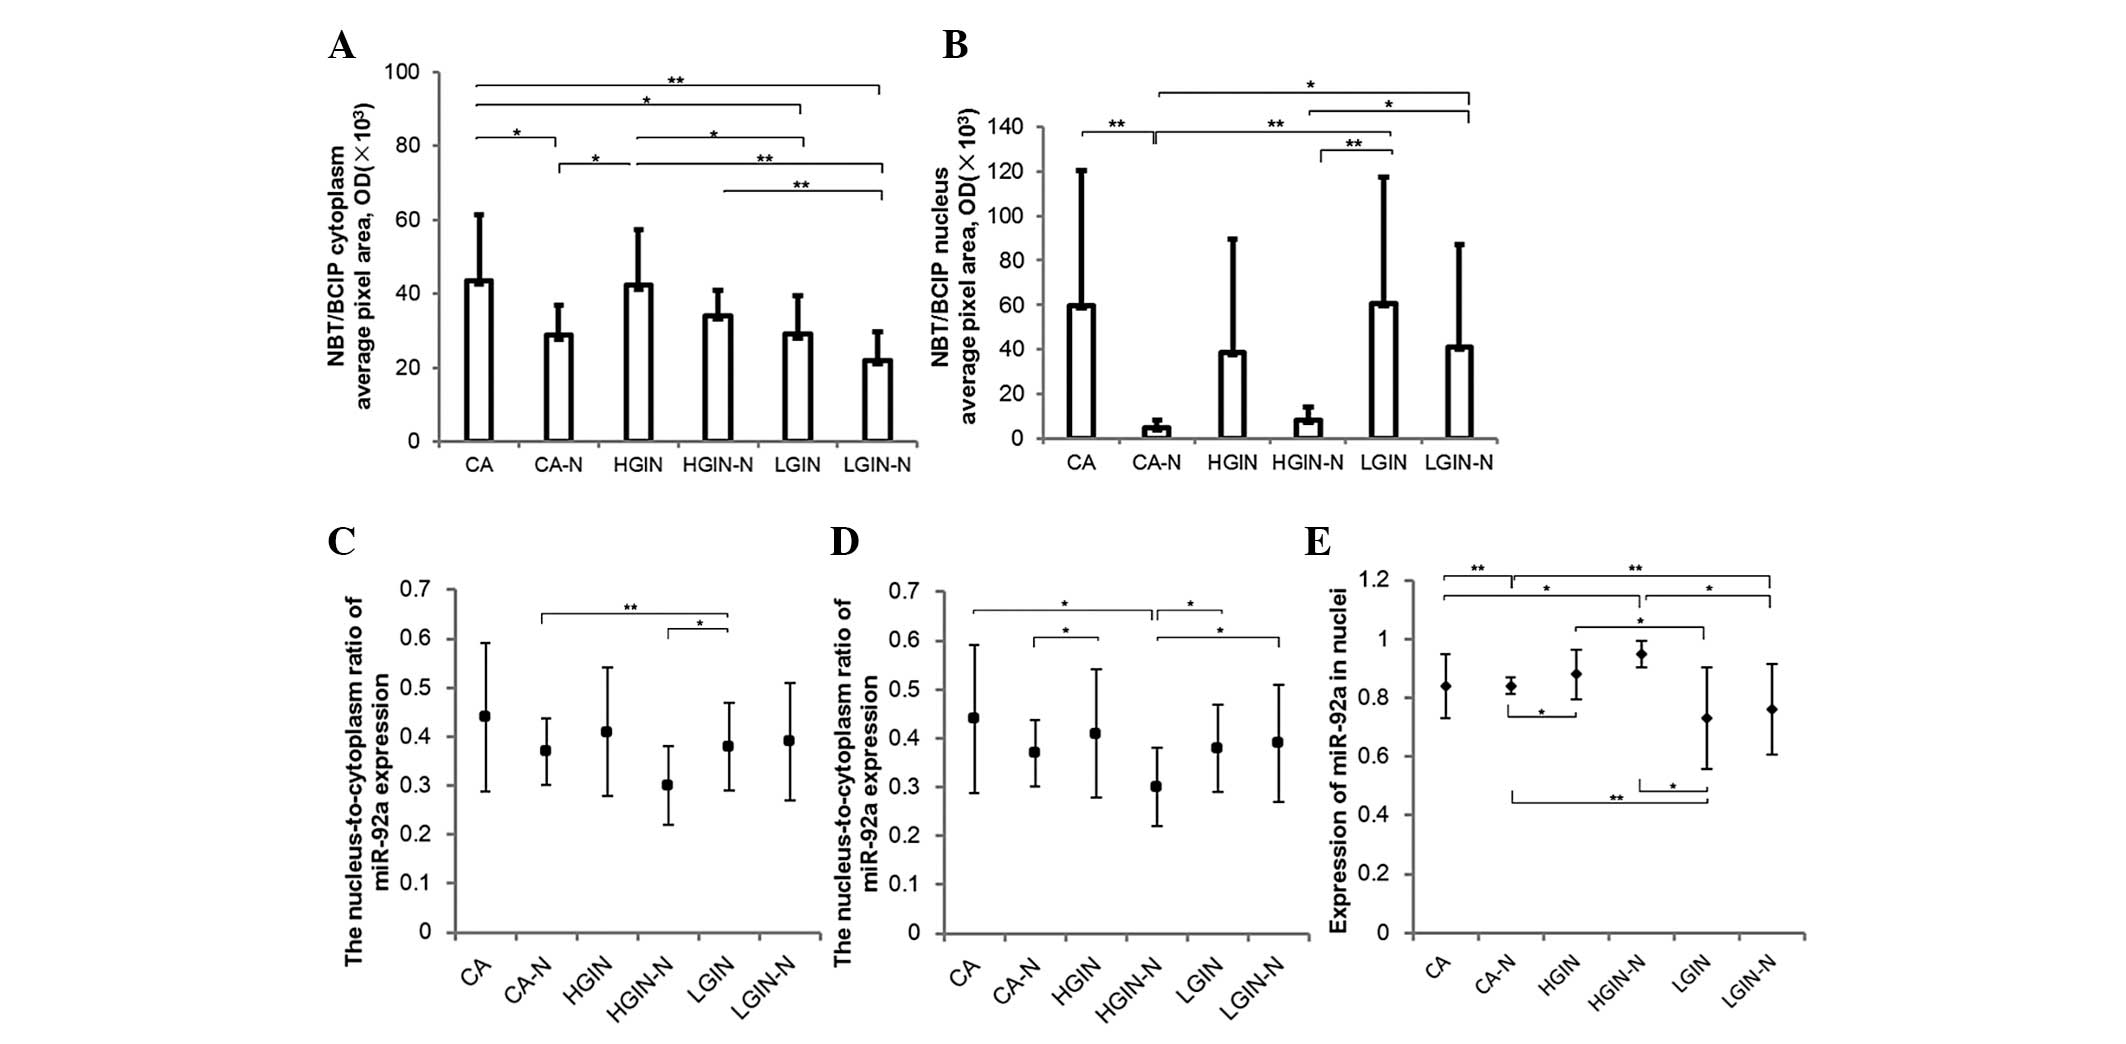 | Figure 4Multispectral imaging analysis of the
expression level of miR-92a in 34 samples of colorectal
adenocarcinoma (CA) and its precancerous lesions (CA, n=13; CA-N,
n=12; HGIN, n=11; HGIN-N, n=10; LGIN, n=10; and LGIN-N, n=9). (A)
The average expression level of miR-92a in the cytoplasm of the
tissue, determined by pixel area. (B) The average expression level
of miR-92a in the nuclei of the tissue, determined by pixel area.
(C) The average expression intensity of miR-92a in the cytoplasm of
the tissue, determined by OD. (D) The nucleus-to-cytoplasm ratio of
miR-92a expression in each group. (E) The expression of miR-92a in
the nuclei of each group. The above data is calculated by the
formula mentioned in the Materials and methods section. Each sample
was repeated three times and the error bar represents the standard
deviation. *P<0.05; **P<0.01. CA,
colorectal carcinoma; CA-N, CA paralesional normal tissue; HGIN,
high-grade intraepithelial neoplasia; HGIN-N, HGIN paralesional
normal tissue; LGIN, low-grade intraepithelial neoplasia; LGIN-N,
LGIN paralesional normal tissue; NBT/ BCIP, nitro blue
tetrazolium/5-bromo-4-chloro-3-indolyl phosphate; OD, optical
density. |
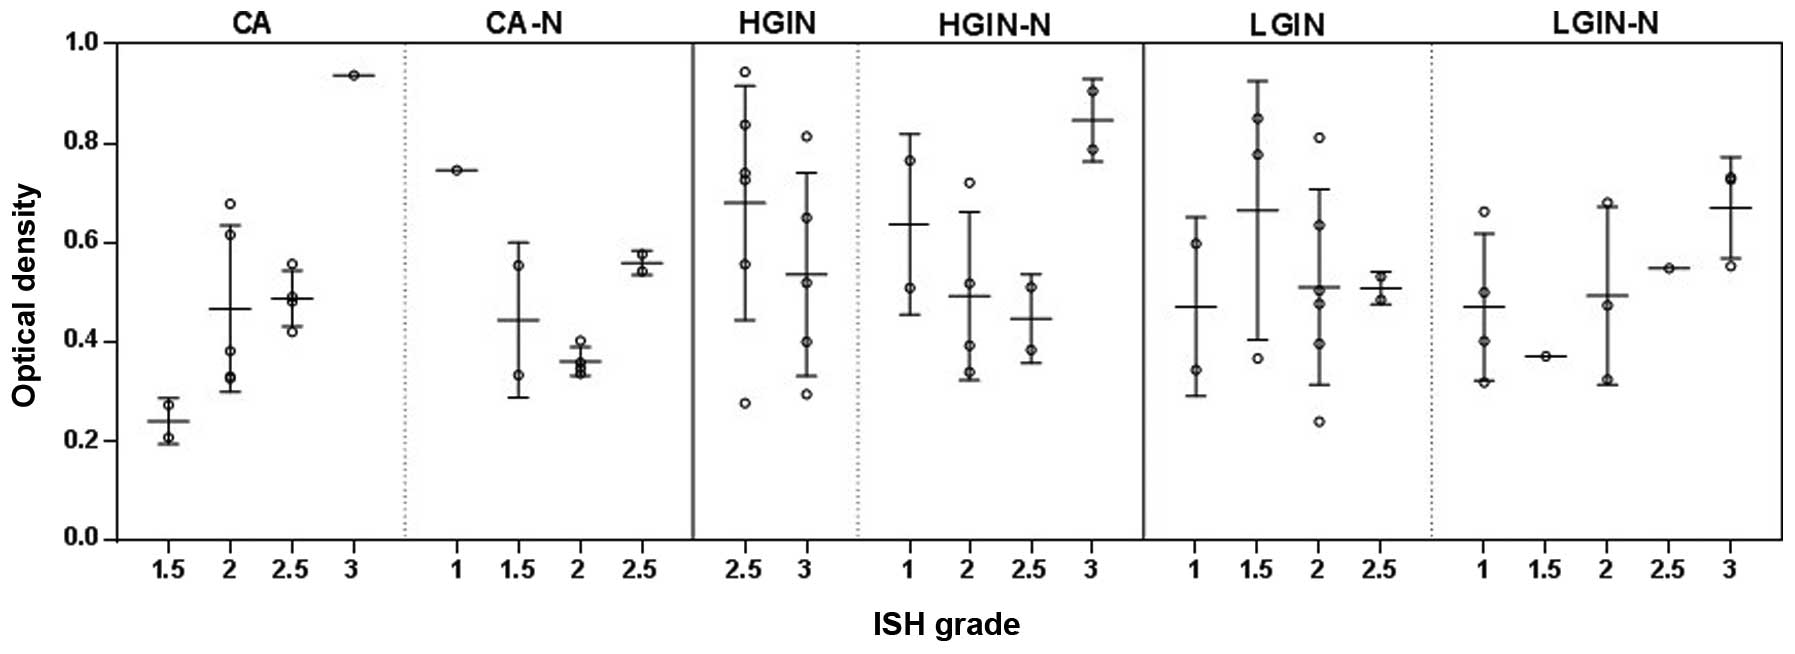
ISH combined with MSI legibly evaluates
changes of miR-92a expression level in CA, LGIN, HGIN and their
paralesional normal controls
The visual grading of the ISH results from the 34
samples was compared with the OD obtained by the combination of ISH
and MSI in order to determine whether this modified technique could
better evaluate the change in miR-92a expression. A scatter diagram
plotted the visual grading of ISH (x-axis) against the OD value
obtained from ISH-MSI (y-axis), as shown in Fig. 5. Linear regression analysis revealed
no significant correlation between the two quantification methods
(rs=0.25; P>0.05).
Discussion
The latest development of miRNA quantitation
techniques initially focused on the cellular level to the body
fluids, and included quantitative PCR assays (18,19),
next-generation sequencing (21),
MSI (20) and miRNA sensing in
living cells based on peptide nucleic acid and nano-graphene oxide
(21). Until recently, no concrete
method was designed to directly observe changes in the expression
of miRNAs through immediate tissue observation. In several studies,
the miR-92a expression level has been revealed to be elevated
during the progression of CA (22–24).
The hybridization signal on tissue sections did not provide a
similar conclusion, as it revealed that miR-92a is universally, but
unevenly, expressed in all studied samples, in CA, LGIN, HGIN and
their paralesional normal controls. Nevertheless, this finding was
consistent with the results of the study by Liang et al,
which noted the expression of miR-92a in normal and cancerous
organs (15). Compared with other
common tumor indicators that are expressed in an all or nothing
manner in cells, the expression characteristics of miR-92a resulted
in an inconclusive, moderate, visual scoring for all studied
samples containing colorectal lesions at various stages, with the
exception of between HGIN and its normal control, inferring that an
additional approach is required to evaluate the changes in the
expression level of miR-29a.
Since the visual judgment of staining intensity was
based on color development, MSI was recruited in the present study.
MSI encompassed the ability to discriminate a wide color spectrum
and evaluate the concentration of dye, as shown when this method
was analogously applied in a study quantitating thymidylate
synthase in CA (11). CISH was
performed prior to imaging analysis, followed by the detection of
expression level by the MSI system, using chromogens within the
spectrum of 420 to 700 nm at the visible wavelength. The expression
details, area and intensity, were calculated to precisely and
objectively evaluate the differential expression of miR-92a from
normal to cancerous colonic tissues. The results from quantitating
the expression of miR-92a in CA, LGIN, HGIN and their paralesional
normal controls with ISH-MSI revealed a significant difference
between certain considered criteria, particularly the pattern and
concentration of miR-92a expression in the nuclei and cytoplasm,
assessed by the average pixel area and intensity from OD,
respectively. The accretion of miR-92a from the precancerous
lesions to CA by the nucleus-to-cytoplasm ratio and its amplitude
of expression over the area studied demonstrated consistency with
the findings of studies at the cellular, plasma and fecal levels
(22–24), demonstrating that the observation of
changes in the expression level of miRNA may be assessed at the
microscopic level.
In the present study, objective visualization of the
changes in miRNA expression was achieved with the implementation of
CISH and MSI. ISH of miRNAs uses factitiously designed
LNA-oligonucleotide probes that steadily and specifically detect
minute concentrations of miRNA (25,26).
Likewise, hybridization using chromogens possesses several
advantages compared with its fluorescence counterpart, as
chromogen-labeling permits tangibility of specific cell types,
which enables selection and observation of the region of interest
for study under the light microscope, including the recognition of
cancerous and normal colonic cells in the present study, since
fluorophore-labeling techniques ambiguously discriminate between
various cell types in the dark field. In addition, CISH requires a
longer preservation period, with the generation of well-defined
signals and the ability to select the definite regions of interest
that radioactive and fluorescence counterparts cannot guarantee
(27,28). However, MSI demonstrates the
capability of measuring multiple analytes carrying specific spectra
at one time (29), which accurately
resolves and relatively quantitates the changes in the miRNA
expression level of various cell types, which conventional ISH
would not achieve. This provides an objective and easy to use
platform that is widely applied in a plethora of fields in
biomedical research, including cytology, immunohistochemistry and
nanoparticle studies (7,8,30,31).
Out of the available spectral imaging technology, the system
employed in the present study used liquid crystal tunable filters,
which confer advantages of a narrow spectral bandwidth, 7–20 nm,
with an improved spectral resolution and a changeable wavelength at
different ranges, such as the visible wavelength at 420–720 nm and
near infra-red at 850–1,800 nm, which allows evaluation for the
fluorescence- and chromogen-based samples (9,29).
Coupling with a cooled scientific-grade monochrome CCD camera, the
system produces excellent signal discrimination and image quality
(9,11).
Regardless of the frequent suggestions that the
reproducibility of MSI could be undermined by artifacts generated
during specimen preparation and the standardization of any
parameters taken into the analysis, it has been suggested that,
under strict and controlled conditions, artificial biases could be
reduced to an optimal extent (32).
In conclusion, the co-utilization of ISH and
spectral imaging analysis could validate the expression of miRNA
through spectral and spatial evaluation, providing an improved
understanding of its functions during the progression of diseases,
generating valuable information for further study, in order to
supply an effective and efficient diagnostic parameter for future
clinical practice.
References
|
1
|
Wienholds E, Kloosterman WP, Miska E, et
al: MicroRNA expression in zebrafish embryonic development.
Science. 309:310–311. 2005. View Article : Google Scholar : PubMed/NCBI
|
|
2
|
Zhang B and Farwell MA: microRNAs: a new
emerging class of players for disease diagnostics and gene therapy.
J Cell Mol Med. 12:3–21. 2008. View Article : Google Scholar
|
|
3
|
Lu J, Getz G, Miska EA, et al: MicroRNA
expression profiles classify human cancers. Nature. 435:834–838.
2005. View Article : Google Scholar : PubMed/NCBI
|
|
4
|
Yang L, Belaguli N and Berger DH: MicroRNA
and colorectal cancer. World J Surg. 33:638–646. 2009. View Article : Google Scholar : PubMed/NCBI
|
|
5
|
Guiot Y and Rahier J: The effects of
varying key steps in the non-radioactive in situ hybridization
protocol: a quantitative study. Histochem J. 27:60–68. 1995.
View Article : Google Scholar : PubMed/NCBI
|
|
6
|
Levsky JM and Singer RH: Fluorescence in
situ hybridization: past, present and future. J Cell Sci.
116:2833–2838. 2003. View Article : Google Scholar : PubMed/NCBI
|
|
7
|
Levenson RM: Spectral imaging perspective
on cytomics. Cytometry A. 69:592–600. 2006. View Article : Google Scholar : PubMed/NCBI
|
|
8
|
Barber PR, Vojnovic B, Atkin G, Daley FM,
et al: Applications of cost-effective spectral imaging microscopy
in cancer research. J Phys D Appl Phys. 36:1729–1738. 2003.
View Article : Google Scholar
|
|
9
|
Farkas DL, Du C, Fisher GW, et al:
Non-invasive image acquisition and advanced processing in optical
bioimaging. Comput Med Imaging and Graph. 22:89–102. 1998.
View Article : Google Scholar
|
|
10
|
Levenson R, Beechem J and McNamara G:
Spectral imaging in preclinical research and clinical pathology.
Stud Health Technol Inform. 185:43–75. 2013.PubMed/NCBI
|
|
11
|
Atkin G, Barber PR, Vojnovic B, et al:
Correlation of spectral imaging and visual grading for the
quantification of thymidylate synthase protein expression in rectal
cancer. Hum Pathol. 36:1302–1308. 2005. View Article : Google Scholar : PubMed/NCBI
|
|
12
|
Slaby O, Svoboda M, Michalek J and Vyzula
R: MicroRNAs in colorectal cancer: translation of molecular biology
into clinical application. Mol Cancer. 8:1022009. View Article : Google Scholar : PubMed/NCBI
|
|
13
|
Ahmed FE, Jeffries CD, Vos PW, et al:
Diagnostic microRNA markers for screening sporadic human colon
cancer and active ulcerative colitis in stool and tissue. Cancer
Genomics Proteomics. 6:281–295. 2009.PubMed/NCBI
|
|
14
|
Wang S, Wang L, Bayaxi N, et al: A
microRNA panel to discriminate carcinomas from high-grade
intraepithelial neoplasms in colonoscopy biopsy tissue. Gut.
62:280–289. 2013. View Article : Google Scholar
|
|
15
|
Liang Y, Ridzon D, Wong L and Chen C:
Characterization of microRNA expression profiles in normal human
tissues. BMC Genomics. 8:1662007. View Article : Google Scholar : PubMed/NCBI
|
|
16
|
Jørgensen S, Baker A, Møller S and Nielsen
BS: Robust one-day in situ hybridization protocol for detection of
microRNAs in paraffin samples using LNA probes. Methods.
52:375–381. 2010. View Article : Google Scholar : PubMed/NCBI
|
|
17
|
Nuovo GJ, Elton TS, Nana-Sinkam P, et al:
A methodology for the combined in situ analyses of the precursor
and mature forms of microRNAs and correlation with their putative
targets. Nat Protoc. 4:107–115. 2009. View Article : Google Scholar : PubMed/NCBI
|
|
18
|
Zhang Q, He XJ, Liu YJ, Ma LP and Pan XY:
Profiling of microRNAs in mouse brain with real-time PCR array.
Beijing Da Xue Xue Bao. 41:152–157. 2009.(In Chinese). PubMed/NCBI
|
|
19
|
Chugh P, Tamburro K and Dittmer DP:
Profiling of pre-micro RNAs and microRNAs using quantitative
real-time PCR (qPCR) arrays. J Vis Exp. 3:22102010.
|
|
20
|
Mansfield JR: Cellular context in
epigenetics: quantitative multicolor imaging and automated per-cell
analysis of miRNAs and their putative targets. Methods. 52:271–280.
2010. View Article : Google Scholar : PubMed/NCBI
|
|
21
|
Ryoo SR, Lee J, Yeo J, et al: Quantitative
and multiplexed microRNA sensing in living cells based on peptide
nucleic acid and nano graphene oxide (PANGO). ACS Nano.
7:5882–5891. 2013. View Article : Google Scholar : PubMed/NCBI
|
|
22
|
Huang Z, Huang D, Ni S, et al: Plasma
microRNAs are promising novel biomarkers for early detection of
colorectal cancer. Int J Cancer. 127:118–126. 2010. View Article : Google Scholar
|
|
23
|
Ng EK, Chong WW, Jin H, et al:
Differential expression of microRNAs in plasma of patients with
colorectal cancer: a potential marker for colorectal cancer
screening. Gut. 58:1375–1381. 2009. View Article : Google Scholar : PubMed/NCBI
|
|
24
|
Link A, Balaguer F, Shen Y, et al: Fecal
MicroRNAs as novel biomarkers for colon cancer screening. Cancer
Epidemiol Biomarkers Prev. 19:1766–1774. 2010. View Article : Google Scholar : PubMed/NCBI
|
|
25
|
Kloosterman WP, Wienholds E, de Bruijn E,
Kauppinen S and Plasterk RH: In situ detection of miRNAs in animal
embryos using LNA-modified oligonucleotide probes. Nat Methods.
3:27–29. 2006. View
Article : Google Scholar
|
|
26
|
Stenvang J, Silahtaroglu AN, Lindow M,
Elmen J and Kauppinen S: The utility of LNA in microRNA-based
cancer diagnostics and therapeutics. Semin Cancer Biol. 18:89–102.
2008. View Article : Google Scholar : PubMed/NCBI
|
|
27
|
Hara M, Yamada S and Hirata K:
Nonradioactive In Situ Hybridization: Recent Techniques and
Applications. Endocr Pathol. 9:21–29. 1998. View Article : Google Scholar
|
|
28
|
Crabb ID, Hughes SS, Hicks DG, et al:
Nonradioactive in situ hybridization using digoxigenin-labeled
oligonucleotides. Applications to musculoskeletal tissues. Am J
Pathol. 141:579–589. 1992.PubMed/NCBI
|
|
29
|
Ornberg RL, Woerner BM and Edwards DA:
Analysis of stained objects in histological sections by spectral
imaging and differential absorption. J Histochem Cytochem.
47:1307–1314. 1999. View Article : Google Scholar : PubMed/NCBI
|
|
30
|
Levenson RM and Hoyt CC: Spectral imaging
and microscopy. Am Lab. 32:26–34. 2000.
|
|
31
|
Kavvadias V, Epitropou G, Georgiou N, et
al: A novel endoscopic spectral imaging platform integrating
k-means clustering for early and non-invasive diagnosis of
endometrial pathology. Conf Proc IEEE Eng Med Biol Soc.
2013:4442–4445. 2013.PubMed/NCBI
|
|
32
|
Seidal T, Balaton AJ and Battifora H:
Interpretation and quantification of immunostains. Am J Surg
Pathol. 25:1204–1207. 2001. View Article : Google Scholar : PubMed/NCBI
|