Introduction
Lung cancer is a common malignancy, and radiotherapy
is an essential method of treatment. Radiation pneumonitis (RP) is
the most common dose-limiting complication in lung cancer
radiotherapy, and 13 to 37% of lung cancer patients develop RP
following radiotherapy (1). RP often
leads to irreversible pulmonary fibrosis, and the prognosis of
significant RP is poor, with ~50% of patients succumbing within 2
months of diagnosis (2). Thus, it is
of great importance to predict the occurrence of RP accurately.
18F-fluorodeoxyglucose
(18F-FDG) positron emission tomography/computed
tomography (PET-CT) can diagnose disease at the molecular level
prior to the occurrence of anatomical structural changes,
identified through observing changes in metabolism. RP is an
inflammatory reaction within irradiated lung tissues in response to
radiation injury (3,4), and as such may be detectable by
18F-FDG PET-CT. However, there have been no studies
regarding whether the standardized uptake value (SUV) and its
changes can predict the occurrence of RP.
The purpose of the present study was to determine if
18F-FDG PET-CT is useful for the prediction of RP in
patients with non-small cell lung cancer (NSCLC) who receive
radiotherapy.
Patients and methods
Patients
A total of 40 patients (27 males and 13 females)
with NSCLC treated with radiotherapy between January 2004 and June
2007 at the Department of Radiation Oncology of Shandong Tumor
Hospital and Institute (Jinan, China) were included in the present
study. The average age of the patients was 63 years (range, 39–82
years), and 22 patients were >60 years of age and 18 were ≤60
years of age. The inclusion criteria were: i) A diagnosis of NSCLC
confirmed by cytology or pathology; ii) no prior surgery for the
disease; iii) no pericardial effusion, pleural effusion, diabetes
mellitus, anemia or cardiopulmonary insufficiency; iv) a Karnofsky
performance scale score of ≥70; and v) a 18F-FDG PET-CT
examination performed within 4 weeks of treatment and at 6–10 weeks
after treatment. Patients found to have RP prior to the second
18F-FDG PET-CT examination were excluded. Written
informed consent was obtained from all patients and ethical
approval was obtained from the ethics committee of Shandong Tumor
Hospital and Institute.
Treatments
All patients were treated with three-dimensional
(3D) radiation therapy using a Varian 2100C linear accelerator with
a 15-MV beam (Varian Medical Systems, Inc, Milpitas, CA, USA). The
target was outlined by radiotherapists and radiologists according
to CT combined with 18F-FDG PET-CT findings, and
included the primary pulmonary lesion and metastatic lymph modes.
The clinical target volume was a 10–15-mm expansion of the edge of
the target area. Radiotherapy was administered five times per week
at 1.8–2.0 Gy per time, for a total dose of 60–66 Gy. Patients also
received 3–4 cycles of a platinum-based chemotherapy combined with
paclitaxel (135 mg/m2), gemcitabine (1,000
mg/m2) and vinorelbine (25 mg/m2). The agents
were administered by i.v. drip on days 1 and 8 of each 21-day
cycle.
18F-FDG PET-CT
The 18F-FDG PET-CT scanner and FDG
synthesis modules were produced by GE Healthcare (Pittsburgh, PA,
USA). FDG with a radiochemical purity of >95% was derived from
the cyclotron. The blood glucose level of the patients was <6
mmol/l prior to the examination. Patients were injected with
18F-FDG (7.4 MBq/kg) in an antecubital vein and then
rested for 60 min, remaining quiet for 6 h. A row-spiral CT scan
(scanning parameters: 140 kv; 90 mA; pitch, 0.75; table speed, 15
mm/rotation; after −5 mm, 50-cm primary field of view) was
performed, followed by a full-body PET-CT (after −4.25 mm, 50-cm
apparent field of view; mean beds, 6; 4 min/bed; checking time, 30
min) from the top of the cranium to the top of the femur using a GE
Discovery LS PET-CT scanner (GE Healthcare).
PET cross-sectional, coronal and sagittal image
reconstructions were performed using the two-dimensional
acquisition ordered subsets-expectation maximization method in a
LERWAS workstation using CT attenuation correction data, and were
fused with CT images on a multi-level and multi-image basis. The
mean SUV of lung tissue was measured by two or more nuclear
medicine physicians according to the 3D conformal radiotherapy
treatment planning system: <5 Gy, 5 to ≤14.9 Gy and 15 to ≤34.9
Gy, 35 to ≤59.9 Gy and ≥60 Gy equal dose curves corresponding to
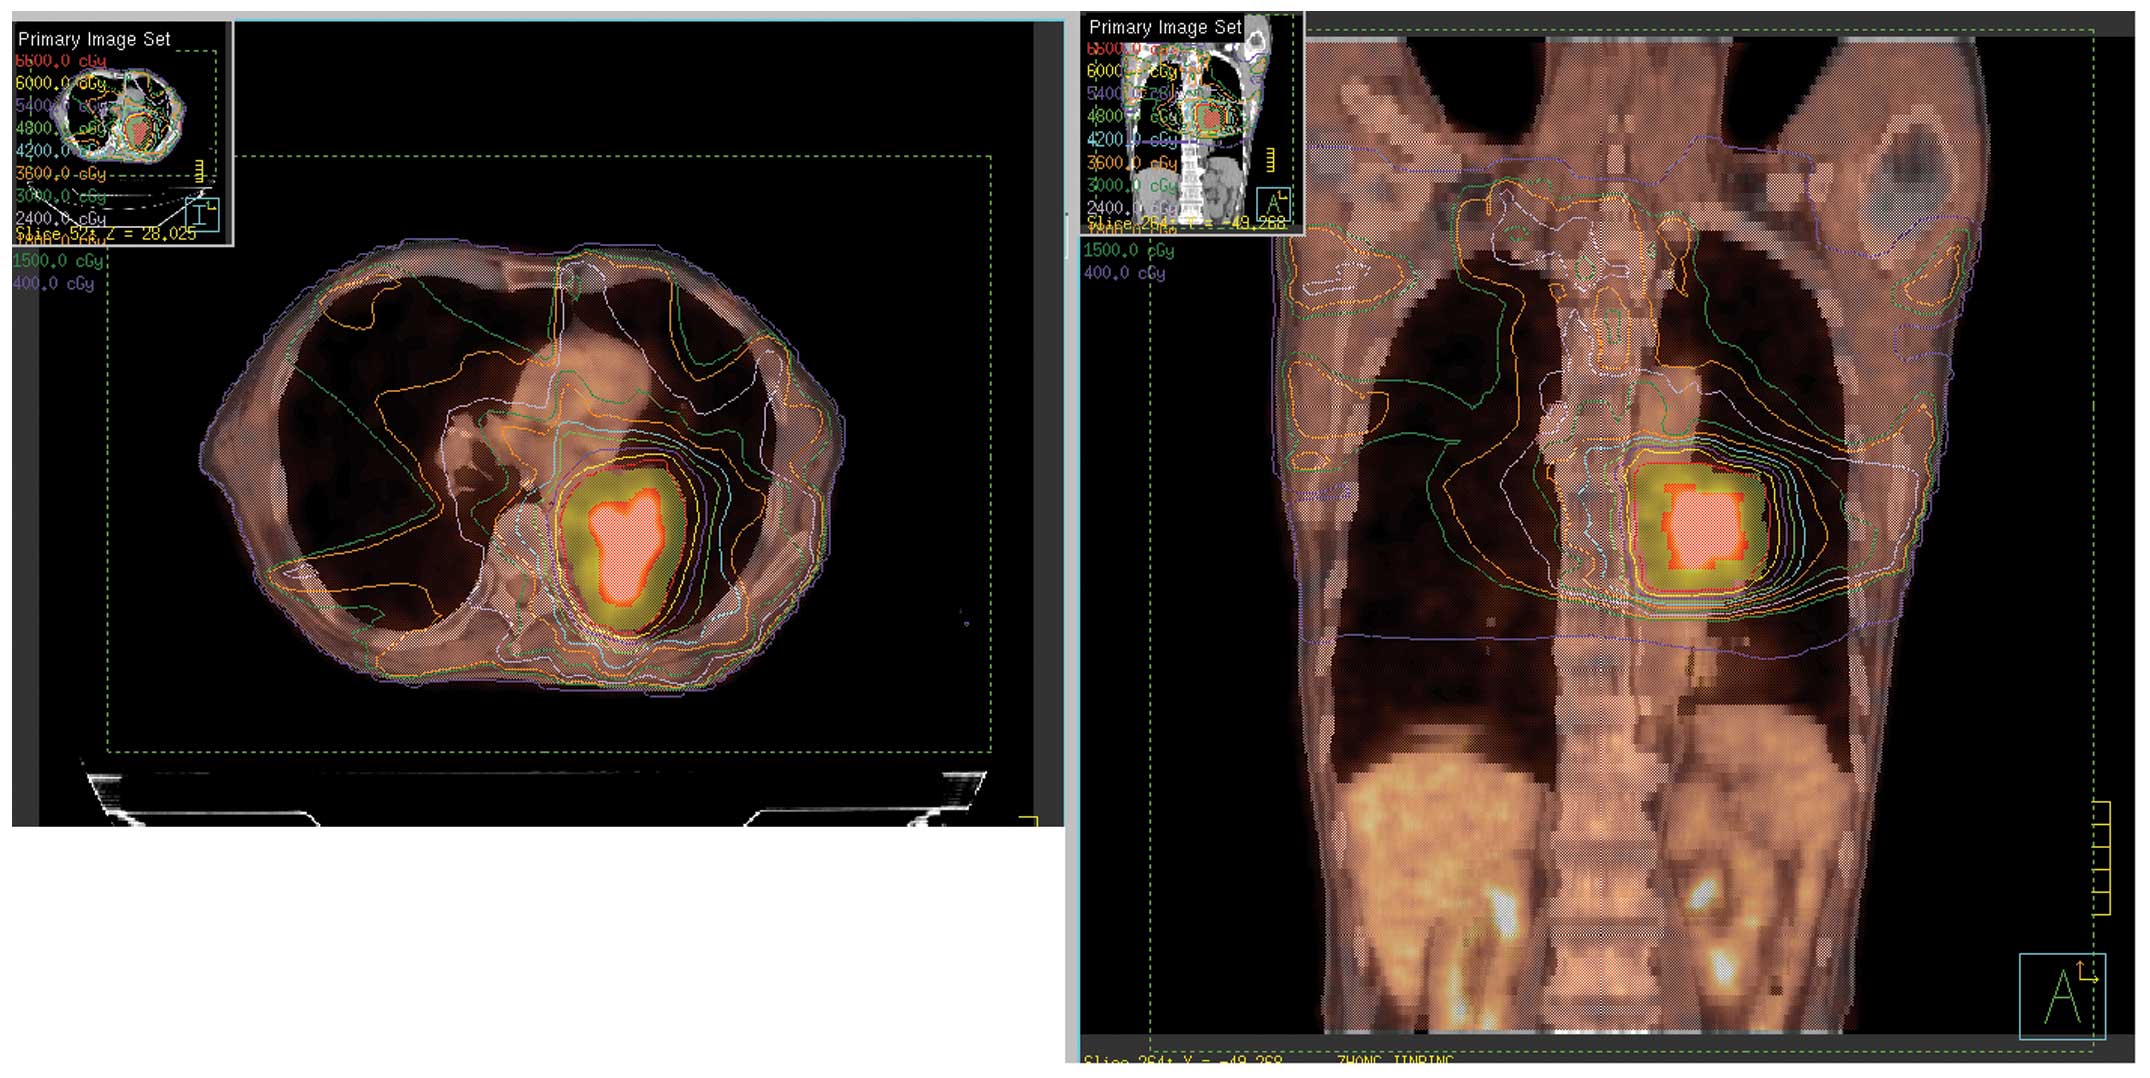
the anatomy prior to and following radiotherapy. The SUV of three
defined points (the distance between any two points being ≥10 mm)
of lung tissue enveloped by the dose curves >10%, 10 to 20%, 20
to 50%, 50 to 90% and >90% corresponding to ≤5 Gy, 5 to ≤14.9
Gy, 15 to ≤34.9 Gy, 35 to ≤59.9 Gy and ≥60 Gy, respectively, were
measured. Next, the mean of the three points within the framework
of the lung tissue was used to indicate the SUV. The dose curves
derived from 18F-FDG PET-CT image fusion with the
Eclipse™ treatment planning systems (Varian Medical Systems, Inc.
Palo Alto, CA, USA) are illustrated in Fig. 1.
Follow-up
Patients were followed-up every 2 or 3 months after
the treatment and received physical examinations, tests of liver
and kidney function and tumor markers, chest X-rays and enhanced
chest CT scans.
Statistical methods
The mean SUV of the RP group and the no RP group
prior to and following irradiation were compared by t-test.
The comparison of the rates of RP was performed by χ2
test. All statistical analyses were performed with SPSS, version
12.0 (SPSS, Inc., Chicago, IL, USA). P<0.05 was considered to
indicate a statistically significant difference.
Results
Follow-up
In April 2008, the follow-up rate was 100%, with a
median follow-up time of 13.5 months (range, 9–23 months). Among
the 40 patients, 8 developed RP (≥grade 2) following treatment,
which accounted for 20% of the whole group. Patient data are
summarized in Table I. The Criteria
of the Radiation Therapy Oncology Society of the United States was
used as the standard to diagnose RP, and the detailed grades are
shown in Table II (5)
 | Table I.Patient characteristics. |
Table I.
Patient characteristics.
| Characteristic | RP group | No RP group | P-value |
|---|
| Patients, n |
8 |
32 | 0.043 |
| Age, years |
63 |
61 | 2.546 |
| Gender, n |
|
|
|
| Male |
5 |
22 | 0.046 |
|
Female |
3 |
10 | 0.032 |
| Smoking history,
n |
|
|
|
| ≤20
years |
3 |
13 | 0.054 |
| ≥20
years |
6 |
18 | 0.032 |
| Tumor location,
n |
|
|
|
|
Upper |
3 |
11 | 0.210 |
|
Middle |
2 |
8 | 0.036 |
|
Lower |
3 |
13 | 0.041 |
| GTV,
cm3 | 156 | 148 | 6.354 |
| Mean lung volume,
cm3 | 3218 | 3276 | 9.012 |
| Pathological type,
n |
|
|
|
| Squamous
carcinoma |
3 |
13 | 0.037 |
|
Adenocarcinoma |
5 |
19 | 0.026 |
| Tumor stage, n |
|
|
|
| I–II |
3 |
15 | 0.025 |
|
III–VI |
5 |
17 | 0.031 |
| V20, n |
|
|
|
| ≤25% |
1 |
6 | 0.044 |
| 25%
<V20 <35% |
2 |
17 | 0.015 |
| ≥35% |
5 |
9 | 0.086 |
| MLD, n |
|
|
|
| ≤15
Gy |
3 |
18 | 0.047 |
| >15
Gy |
6 |
14 | 0.562 |
| Time to development
of RP, days |
|
|
|
| Mean | 82.4 | 78.4 | 0.947 |
|
Range | 78–86 | 60–83 | 0.032 |
| Interval between PET
and |
|
|
|
| radiotherapy,
days |
|
|
|
| Mean |
42 |
44 | 6.451 |
|
Range | 28–56 | 28–60 | 1.011 |
| Radiation dose,
Gy |
|
|
|
| Mean | 65.6 | 62.8 | 7.518 |
|
Range | 60–72 | 60–72 | 6.312 |
| Chemotherapy, n |
|
|
|
| Single
agent |
0 |
2 | 5.138 |
|
Combined |
8 |
30 | 0.087 |
| Table II.Radiation therapy oncology group
pneumonitis toxicity criteria. |
Table II.
Radiation therapy oncology group
pneumonitis toxicity criteria.
| Grade | Clinical
symptoms |
|---|
| 0 | None |
| 1 | Asymptomatic or mild
symptoms (dry cough); slight radiographic appearances |
| 2 | Moderate symptomatic
fibrosis or pneumonitis (severe cough); low grade fever; patchy
radiographic appearances |
| 3 | Severe symptomatic
fibrosis or pneumonitis; dense radiographic changes; intermittent
O2; requires steroids |
| 4 | Severe respiratory
insufficiency; continuous O2; assisted ventilation |
| 5 | Mortality |
SUV prior to radiotherapy
There were no statistically significance differences
in the mean SUV between the no RP group and the RP group who
received radiation at doses of <5 Gy, 5 to ≤14.9 Gy and 15 to
≤34.9 Gy and 35 to ≤59.9 Gy (all P>0.05). However, there were
statistically significant differences in the mean SUV of lung
tissue within (t=1.98, P=0.029; t=2.32, P=0.018) or between
(t=2.13, P=0.025; t=2.42, P=0.015) the no RP and RP groups with
radiation doses of 35 to ≤59.9 Gy and ≥60 Gy, respectively
(Tables IV and V). of the group with a radiation dose of ≥60
Gy compared with the mean SUV of lung tissue of the other groups. A
summary of the mean SUV data is shown in Tables III and IV.
| Table IV.Lung tissue SUV of the no radiation
pneumonitis group prior to and following radiotherapy. |
Table IV.
Lung tissue SUV of the no radiation
pneumonitis group prior to and following radiotherapy.
| SUV of lung tissue
at different exposures | Prior to
radiotherapy | Standard
deviation | Following
radiotherapy | Standard
deviation | P-value |
|---|
| ≥60 Gy | 0.67 | 0.038 | 1.02 | 0.246 | 0.029 |
| 35 to ≤59.9 Gy | 0.46 | 0.023 | 0.76 | 0.125 | 0.018 |
| 15 to ≤34.9 Gy | 0.42 | 0.018 | 0.61 | 0.112 | 1.084 |
| 5 to ≤14.9 Gy | 0.42 | 0.015 | 0.52 | 0.048 | 3.052 |
| ≤5 Gy | 0.38 | 0.016 | 0.42 | 0.032 | 0.059 |
| Table V.Numbers of patients from the
radiation pneumonitis group who received different radiotherapy
exposures. |
Table V.
Numbers of patients from the
radiation pneumonitis group who received different radiotherapy
exposures.
| Ratio | ≥60 Gy | 35 to ≤59.9 Gy | 15 to ≤34.9 Gy | 5 to ≤14.9 Gy | P-value |
|---|
| L/B ≥3 | 4 | 0 | 0 | 0 | 0.026 |
| 2.5 ≤L/B <3 | 4 | 3 | 0 | 0 | 0.018 |
| 2 ≤L/B <2.5 | 0 | 5 | 3 | 0 | 0.625 |
| 1 ≤L/B <2 | 0 | 0 | 5 | 8 | 2.054 |
| Table III.Lung tissue SUV of radiation
pneumonitis group prior to and following radiotherapy. |
Table III.
Lung tissue SUV of radiation
pneumonitis group prior to and following radiotherapy.
| SUV of lung tissue
at different exposures | Prior to
radiotherapy | Standard
deviation | Following
radiotherapy | Standard
deviation | P-value |
|---|
| ≥60 Gy | 0.68 | 0.042 | 1.47 | 0.285 | 0.025 |
| 35 to ≤59.9 Gy | 0.44 | 0.026 | 0.97 | 0.154 | 0.015 |
| 15 to ≤34.9 Gy | 0.45 | 0.021 | 0.65 | 0.120 | 6.051 |
| 5 to ≤14.9 Gy | 0.41 | 0.018 | 0.58 | 0.058 | 4.025 |
| ≤5 Gy | 0.39 | 0.022 | 0.44 | 0.036 | 1.337 |
SUV following radiotherapy
There were no statistically significant differences
in the mean SUV of lung tissue within groups or between the no RP
and RP groups with radiation doses of ≤5 Gy, 5 to ≤14.9 Gy and 15
to ≤34.9 Gy (all P>0.05). However, there were statistically
significant differences in the mean SUV of lung tissue within
groups or between the no RP and RP groups with radiation doses of
35 to ≤59.9 Gy and ≥60 Gy (intergroup: t=2.13 and 2.42;
P=0.025 and 0.015, respectively; within group: t=1.98 and
2.32; P=0.029 and 0.018, respectively) (Tables IV and V).
L/B ratio
When the L/B ratio was ≥3, the incidence of RP was
50%, and when the L/B ratio was ≥2.5, the incidence was 40.7%. The
differences compared with the 20% incidence of the whole group were
statistically significant (χ2=4.18 and 4.92; P<0.05).
When the L/B ratio was ≥2.5, the incidence of RP was 25%, and the
difference compared with the whole group was not statistically
significant (χ2=0.41; P>0.05). At an L/B ratio of
≥2.5, all the lung tissues received an exposure dose of ≥35 Gy
(lung tissues circumscribed by the 50% equal dose curve). Taking
the L/B ratio of ≥2.5 as the standard, the predictive sensitivity
and specificity for RP were 72.7 and 90.9%, respectively (Tables V and VI).
| Table VI.Numbers of patients from the no
radiation pneumonitis group who received different radiotherapy
exposures. |
Table VI.
Numbers of patients from the no
radiation pneumonitis group who received different radiotherapy
exposures.
| Ratio | ≥60 Gy | 35 to ≤59.9 Gy | 15 to ≤34.9 Gy | 5 to ≤14.9 Gy | P-value |
|---|
| L/B ≥3 | 4 | 0 | 0 | 0 | 0.025 |
| 2.5 ≤L/B <3 | 6 | 6 | 0 | 0 | 0.015 |
| 2 ≤L/B <2.5 | 19 | 15 | 5 | 2 | 0.952 |
| 1 ≤L/B <2 | 3 | 11 | 27 | 30 | 4.051 |
Volume of lung receiving at least 20
Gy (V20) and mean lung dose (MLD)
When the V20 was ≤25%, 25% <V20 <35%, and
≥35%, the incidence of RP was 14.3, 13.6 and 33.3%, respectively.
When the MLD was ≤15 Gy and >15 Gy, the incidence of RP was 11.5
and 27.3%, respectively. There were no statistically significant
differences in the occurrence of RP between a V20 ≥35% and MLD
>15 Gy, V20 ≥35% and L/B ≥2.5, and MLD >15 Gy and L/B ≥2.5
(χ2=0.18, 0.33 and 1.27, respectively; P>0.05).
Discussion
RP, which has a big effect on lung function and
quality of life in patients, is the most common dose-limiting
complication of radiation therapy (6). Although the occurrence of RP has been
known about for a number of years, it is difficult to predict when
it will occur. The ability to provide early adjunctive therapy to
high-risk patients may improve a patient's quality of life and
survival. The present study investigated whether FDG PET-CT can
predict the occurrence of RP based on the SUV.
Studies have shown that the occurrence of RP is
associated with the susceptibility, exposure dose and volume.
Graham et al (7) analyzed 99
patients with NSCLC who received 3D radiotherapy and found that the
incidence of RP of a grade ≥2 was associated with the V20
(P=0.001). In this study, the incidence of fatal RP was 4%.
However, the single patient who succumbed to RP had a V20 of 22%,
which is considered to be safe. Similarly, patients with a lower
V20 developed RP of grade ≥3. However, numerous patients with a
higher V20 in the study did not develop RP. Kwa et al
(8) analyzed the dose-volume
histograms of 540 patients with lung cancer and breast cancer who
received radiotherapy; 73 developed RP of a grade ≥2 and there was
a significant statistical difference between lung cancer and breast
cancer RP (P=0.02). The present results are similar to those of
other studies; with an increase in V20 and MLD, the incidence of RP
increased. It has been hypothesized that patients are safe from RP
when the V20 is <25%, however, in the present study, one case of
RP of grade ≥2 occurred. These data indicate that the V20 is not
adequate for predicting RP.
PET-CT can provide information on the metabolism and
pathophysiology of pathological changes. In particular, PET-CT is
superior to CT for the formation of precise radiotherapy plans,
reducing the development of radiation injury, evaluating the
therapeutic effect, and identifying residual tumors and fibrosis
subsequent to chemotherapy. Furthermore, 18F-FDG PET-CT
is able to detect the inflammation and fibrosis caused by
radiotherapy (9–11). 18F-FDG PET-CT can visualize
and quantitate endotoxin-induced pneumonitis in normal healthy
volunteers (12) and in patients
affected by cystic fibrosis (13).
The main characteristic of RP is the presence of leukocytes
migrating from the blood to the irradiated lung tissues; therefore,
on FDG-PET imaging, the more intense the inflammatory response, the
greater the FDG uptake (12).
To date, no conclusions have been made with regard
to whether FDG PET-CT can predict the occurrence of RP. Guerrero
et al (14) examined 36
patients with esophageal carcinoma 4–12 weeks after completion of
radiotherapy with 18F-FDG PET-CT and found a linear
association between the radiation dose and normalized FDG uptake in
the lung. The slope rate range of the linear association was
0.0048–0.069. The present study analyzed the SUV of 40 patients who
received PET-CT examination prior to and following radiotherapy,
and found no statistical significance in lung tissues anywhere
except for lung tissue enveloped by 90% of the isodose curve. The
SUV of lung tissue enveloped by 90% of the isodose curve is higher
than in other areas, as it is close to the tumor. In the current
study, there were no statistically significant differences in the
average SUV of lung tissue within groups or between the no RP and
RP groups with radiation doses of <5 Gy, 5 to ≤14.9 Gy and 15 to
≤34.9 Gy (all P>0.05). However, there were statistically
significant differences in the mean SUV of lung tissue within
groups or between the no RP and RP groups with radiation doses of
35 to ≤59.9 Gy and ≥60 Gy. There was no marked change in lung
tissues with an exposure dose of ≤35 Gy at 6–10 weeks after
radiotherapy. The mean SUV of lung tissues was higher in the no RP
group and the RP group following exposure to 35 to ≤59.9 Gy or ≥60
Gy, compared with other exposure doses. This indicates that the SUV
of lung tissue is correlated with the radiation dose.
As the SUV is affected by individual differences, in
order to compare the difference in the SUV of lung tissue in
different exposure regions, the L/B ratio (the SUV of radiated lung
tissue/the SUV of non-radiated lung tissue) was examined. When the
L/B ratio was ≥3, the incidence of RP was 50%, and when the L/B
ratio was ≥2.5, the incidence was 40.7%. The differences compared
with the 20% incidence of the whole group were statistically
significant (χ2=4.18 and 4.92; P<0.05). When the L/B
ratio was ≥2.5, the incidence of RP was 25%, and the difference
compared with the whole group was not statistically significant
(χ2=0.41; P>0.05). At an L/B ratio of ≥2.5, all the
lung tissues received an exposure dose of ≥35 Gy (lung tissues
circumscribed by the 50% equal dose curve). Based on these
findings, adjuvant therapy should be administered to patients when
the L/B ratio is ≥2.5, and when it is 2 ≤L/B <2.5, patients
should be observed closely. In the present study, when the V20 was
<25%, one patient developed RP, but the L/B ratio was ≥2.5. When
the L/B ratio was <2, there were no cases of RP. This shows that
FDG PET-CT can predict RP through the molecular metabolism of the
lung tissue itself, which is different from dose and volume
factors. Thus, it is superior to the V20 method, as it avoids the
effect of individual dose susceptibility. When the L/B ratio is ≥3,
the region exposure is ≥60 Gy; that is, in the lung tissue
enveloped by the 90% isodose curve, SUV is affected by the uptake
value of the tumor itself and the tumor regression region. Thus, we
suggest that for the prediction of RP, the L/B ratio of lung
tissues should be located outside the 90% isodose curve.
In the present study, the FDG uptake in lung tissue
following irradiation was associated with the radiation dose.
18F-FDG PET-CT can be used to predict RP using the L/B
ratio, and the L/B ratio is positively correlated with the
occurrence of RP. The importance of variation in individual
susceptibility for RP was shown in this study.
References
|
1
|
Clade L, Pérol D, Ginestet C, Falchero L,
Arpin D, Vincent M, Martel I, Hominal S, Cordier JF and Carrie C: A
prospective study on radiation pneumonitis following conformal
radiation therapy in non-small-cell lung cancer: Clinical and
dosimetric factors analysis. Radiother Oncol. 71:175–181. 2004.
View Article : Google Scholar : PubMed/NCBI
|
|
2
|
Schild SE, Stella PJ, Geyer SM, Bonner JA,
McGinnis WL, Mailliard JA, Brindle J, Jatoi A and Jett JR: North
Central Cancer Treatment Group: The outcome of combined modality
therapy for stage III non-small-cell lung cancer in the elderly. J
Clin Oncol. 21:3201–3206. 2003. View Article : Google Scholar : PubMed/NCBI
|
|
3
|
Fajardo LF, Berthrong M and Anderson RE:
Radiation Pathology. Oxford University Press; New York: pp.
200–206. 2001
|
|
4
|
Robets CM, Foulcher E, Zaunders JJ, Bryant
DH, Freund J, Cairns D, Penny R, Morgan GW and Breit SN: Radiation
pneumonitis: A possible lymphocyte-mediated hypersensitivity
reaction. Ann Intern Med. 118:696–700. 1993. View Article : Google Scholar : PubMed/NCBI
|
|
5
|
Cox JD, Stetz J and Pajak TF: Toxicity
criteria of the Radiation Therapy Oncology Group (RTOG) and the
European Organization for Research and Treatment of Cancer (EORTC).
Int J Radiat Oncol Biol Phys. 31:1341–1346. 1995. View Article : Google Scholar : PubMed/NCBI
|
|
6
|
Magaña E and Crowell RE: Radiation
pneumonitis successfully treated with inhaled corticosteroids.
South Med J. 96:521–524. 2003. View Article : Google Scholar : PubMed/NCBI
|
|
7
|
Graham MV, Purdy JA, Emami B, Harms W,
Bosch W, Lockett MA and Perez CA: Clinical dose-volume histogram
analysis for pneumonitis after 3D treatment for non-small-cell lung
cancer (NSCLC). Int J Radiat Oncol Biol Phys. 45:323–329. 1999.
View Article : Google Scholar : PubMed/NCBI
|
|
8
|
Kwa SL, Lebesque JV, Theuws JC, Marks LB,
Munley MT, Bentel G, Oetzel D, Spahn U, Graham MV, Drzymala RE, et
al: Radiation pneumonitis as a function of mean lung dose: An
analysis of pooled data of 540 patients. Int J Radiat Oncol Biol
Phys. 42:1–9. 1998. View Article : Google Scholar : PubMed/NCBI
|
|
9
|
Hicks RJ, Kalff V, MacManus MP, Ware RE,
Hogg A, McKenzie AF, Matthews JP and Ball DL: (18)F-FDG PET-CT
provides high-impact and powerful prognostic stratification in
staging newly diagnosed non-small cell lung cancer. J Nucl Med.
42:1596–1604. 2001.PubMed/NCBI
|
|
10
|
Yan R, Song J, Wu Z, et al: Detection of
myocardial metabolic abnormalities by 18F-FDG PET/CT and
corresponding pathological changes in Beagles with local heart
irradiation. Korean J Radiol. 16:919–928. 2015. View Article : Google Scholar : PubMed/NCBI
|
|
11
|
Akhurst T, Downey RJ, Ginsberg MS, Gonen
M, Bains M, Korst R, Ginsberg RJ, Rusch VW and Larson SM: An
initial experience with PDG-PET in the imaging of residual disease
after induction therapy for lung cancer. Ann Thorac Surg.
73:259–264. 2002. View Article : Google Scholar : PubMed/NCBI
|
|
12
|
Chen DL, Ferkol TW, Mintun MA, Pittman JE,
Rosenbluth DB and Schuster DP: Quantifying pulmonary inflammation
in cystic fibrosis with position emission tomography. Am J Respir
Crit Care Med. 173:1363–1369. 2006. View Article : Google Scholar : PubMed/NCBI
|
|
13
|
Chen DL, Rosenbluth DB, Mintun MA and
Schuster DP: FDG-PET imaging of pulmonary inflammation in healthy
volunteers after airway instillation of endotoxin. J Appl Physiol
(1985). 100:1602–1609. 2006. View Article : Google Scholar : PubMed/NCBI
|
|
14
|
Guerrero T, Johnson V, Hart J, Pan T, Khan
M, Luo D, Liao Z, Ajani J, Stevens C and Komaki R: Radiation
pneumonitis: Local dose versus [18F]-fluorodeoxyglucose uptake
response in irradiated lung. Int J Radiat Oncol Biol Phys.
68:1030–1035. 2007. View Article : Google Scholar : PubMed/NCBI
|