Introduction
Glioblastoma (GB) is the most common and aggressive
type of malignant primary brain tumor. The current standard of care
for GB, as established by Stupp et al (1), is maximal safe surgical resection,
followed by temozolomide chemotherapy and radiation. This current
standard therapeutic regimen has increased the median survival rate
of patients with GB to 12.1–14.6 months, with a median 2-years
survival rate of 26% (2). However,
mortality from GB inevitably occurs, due to the recurrence or
progression of the disease (3).
Previous studies have indicated that recurrence of GB is
unavoidable, following a median survival time of 8–9 months
(3). Once a patient with GB relapses
following initial surgery, radiotherapy and chemotherapy, the
salvage strategies available are often limited, and the survival
time is short (4,5). This is most likely due to molecular and
genetic alterations within the tumor itself, or as a consequence of
preceding therapies (3).
Therefore, novel therapeutic approaches to treat GB,
and scientific and clinical advances in the treatment of this
disease are required. The identification of molecular biomarkers
for the management and monitoring of patients with cancer may
improve their clinical outcome. Numerous biomarker candidates have
been generated by high-throughput technologies, which are powerful
and promising methods for evaluating the expression of a large
number of genes and detecting alterations in genome-wide expression
analyses (6). An important aspect of
GB invasion is the elaboration by the tumor cells of a
migration-enhancing extracellular matrix (ECM), and the secretion
of proteolytic enzymes that permit cell invasion through this
matrix (7). This hypothesis is
consistent with previous gene expression profiling studies, which
identified a subset of tumors with increased expression of ECM
components and intracellular proteins associated with cell motility
(8,9).
The interplay between the various matrix and growth factor
receptors, and the activation of signaling pathways that facilitate
the invasion of tumor cells, has been recently recognized as a
composite, dynamic consequence of altered cell-cell adhesion,
proteolytic remodeling and synthesis of ECM, and selective
expression and activation of integrins (10). Furthermore, in the past few years,
several signaling pathways have been associated with reduced
sensitivity of GB cells to radiation and chemotherapy (11). Numerous genes involved in these
pathways have been demonstrated to be regulated by microRNAs
(miRNAs), which are important regulators in cancer cell biology,
and promising biomarkers or therapeutic targets in GB (11,12).
However, despite all the molecular information on GB
gathered thus far, the optimal management of patients with GB
remains elusive, due to the absence of validated data from clinical
studies, and the great heterogeneity of this fragile subpopulation,
in terms of their physical condition, co-morbidity status,
tolerance to treatment and clinical prognosis (13). The invasive nature of GB growth and
its fast proliferation rate are the major reasons for therapeutic
failure in patients with GB (14).
Therefore, a detailed characterization of the molecular mechanisms
involved in the development of GB is required, in order to improve
the accuracy of the prediction models, regarding the prognosis and
response to therapies in patients with GB.
In order to improve the understanding of the
dynamics of the genomic alterations associated with tumor relapse,
and to provide novel information on the aggressive behavior of GB
tumors, primary GB tumors of patients with GB displaying short or
long recurrence-free survival (RFS) outcome, were molecularly
characterized and compared in the present study.
In particular, 19 GB samples were characterized
according to the presence of mutations in the isocitrate
dehydrogenase 1 (IDH1) gene, amplification of the epidermal growth
factor receptor (EGFR) gene, presence of the EGFR variant III
(EGFRvIII), and methylation of the promoter region of the
O6-methylguanine-DNA methyltransferase (MGMT) gene.
Furthermore, the expression of 84 genes known to be important for
cell-cell and cell-matrix interactions, and that of 84 miRNAs known
to switch their expression pattern during nervous system-associated
carcinogenesis, were profiled. In addition, a copy number variation
analysis of 23 genes, whose expression has been previously reported
to be frequently altered in human glioma tumors (15), was also performed.
Materials and methods
Patients and tumors
The present study included 19 newly diagnosed cases
of GB, who presented to the Department of Translational Research
and of New Surgical and Medical Technologies of the University
Hospital of Pisa (Pisa, Italy). The patients, who were initially
diagnosed by resection with GB grade IV (according to the World
Health Organization classification criteria) (16), did not present any previous record of
brain neoplasm. The GB tumors isolated from the patients were
stored as formalin-fixed, paraffin-embedded (FFPE) specimens.
The GB cases included in the present study were
selected according to their differences in progression-free
survival. Of the 19 included GB cases, 10 cases, were classified as
‘short RFS’ and first displayed recurrence earlier than 6 months,
and 9 cases, were classified as ‘long RFS’ and first displayed
recurrence later than 14 months.
The median age of the patients was 61 years, and the
gender distribution was 9/19 (47%) males and 10/19 (53%) females.
The short RFS GB patients presented a median age of 63 years;
gender distribution of 4/10 (40%) males and 6/10 (60%) females; and
a mean RFS of 4.5 months, ranging from 2 to 6 months. The long RFS
GB patients presented a median age of 58 years; gender distribution
of 4/9 (44%) males and 5/9 (56%) females; and a mean RFS of 27
months, ranging between 14 and 71 months (Table I). The information regarding the size
of the tumors and their localization within a certain brain region
in relation to the duration of RFS is presented in Table II.
 | Table I.Demographic characteristics of the
patient population at the time of diagnosis, and molecular
characterization of the glioblastoma tumors. |
Table I.
Demographic characteristics of the
patient population at the time of diagnosis, and molecular
characterization of the glioblastoma tumors.
| Patient features at
diagnosis | Overall, n (%) | Short RFS, n (%) | Long RFS, n (%) |
|---|
| Total (n) | 19 | 10 | 9 |
| Gender |
|
|
|
|
Female | 10 (53) | 6 (60) | 4 (44) |
| Male | 9
(47) | 4 (40) | 5 (56) |
| Age |
|
|
|
| Mean ±
standard deviation | 60±6.9 | 63±6.2 | 58±6.8 |
| <60
years | 9
(47) | 4 (40) | 5 (56) |
| ≥60
years | 10 (53) | 6 (60) | 4 (44) |
| Molecular
alterations |
|
|
|
| EGFR |
|
|
|
|
wt | 10 (53) | 7 (70) | 3 (33) |
|
ampl | 9
(44) | 3 (30) | 6 (67) |
| EGFRvIII
in EGFR ampl |
|
|
|
|
Yes | 3 (33) | 1 (33) | 2 (33) |
|
No | 6 (67) | 2 (67) | 4 (67) |
| MGMT |
|
|
|
|
wt | 11 (58) | 5 (50) | 6 (67) |
|
met | 8
(42) | 5 (50) | 3 (33) |
| IDH1 |
|
|
|
|
wt | 19
(100) | 10
(100) |
9 (100) |
|
mut | 0 (0) | 0 (0) | 0 (0) |
| Table II.Brain region localization, size
(height × width × length) and area of the glioblastoma tumors in
the short (n=10) and long (n=9) RFS cohorts. |
Table II.
Brain region localization, size
(height × width × length) and area of the glioblastoma tumors in
the short (n=10) and long (n=9) RFS cohorts.
| Surgical pathology
number | RFS group | Brain region | Tumor size
(cm) | Tumor area
(cm2) |
|---|
| 298/09 | Short | Parietal | 4.0×3.0×2.0 | 52 |
| 476/06 | Long | Righ temporal | 5.5×5.0×2.0 | 97 |
| 2102/08 | Long | N/A | 2.0×1.5×1.0 | 13 |
| 3605/06 | Short | Left frontal | 5.8×4.5×3.0 | 114 |
| 4096/10 | Short | Frontal | 4.5×4.0×2.0 | 70 |
| 4239/12 | Short | Right temporal | 4.0×2.5×1.0 | 33 |
| 4318/07 | Long | Frontal | 2.5×2.5×2.0 | 33 |
| 4382/05 | Short | Right insula | 1.4×1.0×0.8 |
7 |
| 4534/11 | Long | N/A | 3.0×2.0×0.5 | 17 |
| 4561/12 | Long | N/A | 5.0×2.0×0.3 | 24 |
| 4619/07 | Long | Frontal | 1.2×0.6×0.5 |
3 |
| 5165/11 | Long | N/A | 2.0×1.5×1.0 | 13 |
| 6043/08 | Long | N/A | 5.0×5.0×2.0 | 90 |
| 7031/07 | Long | Basal temporal
lobe | 4.5×3.5×1.0 | 48 |
| 7624/05 | Short | Right
temporoparietal | 4.0×3.6×1.7 | 55 |
| 7901/09 | Short | Left pre-rolandic
(frontal) | 4.0×2.0×1.0 | 28 |
| 9298/07 | Short | Right frontal | 6.5×5.0×3.5 | 146 |
| 9303/09 | Short | N/A | 2.5×2.0×0.5 +
3.0×3.0×0.5 | 27 |
| 10504/10 | Short | N/A | 4.0×3.0×1.5 | 45 |
Ethical board
The present study was approved by the Internal
Review Board of the University Hospital of Pisa. All patients
provided their consent for participation in the study.
DNA and RNA extraction
DNA and RNA were extracted from 2 10-µm sections of
each FFPE specimen, using NucleoSpin Tissue (Machery-Nagel, Düren,
Germany) and RNeasy FFPE Kit (Qiagen GmbH, Hilden, Germany) to
extract the genomic DNA and total RNA from the tissues,
respectively. The extracted DNA and RNA were quantified using Qubit
2.0 Fluorometer (Life Technologies, Grand Island, USA), according
to the manufacturer's instructions. The DNA and RNA yields ranged
from 50 to 500 ng/µl.
Molecular markers
The samples were molecularly characterized by
investigating the most studied molecular markers alterations in GB
tumors, including mutations in the IDH1 gene; amplification of the
EGFR gene; presence of EGFRvIII, the active mutant variant form of
the EGFR gene; and methylation of the MGMT promoter:
IDH1 mutation
For the detection of IDH1 mutations, Primer3
software (http://primer3.ut.ee/) was used to
design the following primers, in order to amplify the exon 4 of the
IDH1 gene: Forward, 5′-AGC TCT ATA TGC CAT CAC TGC-3; and reverse,
5′-TTC ATA CCT TGC TTA ATG GGT GT-3). Polymerase chain reaction
(PCR) amplification was performed with AmpliTaq Gold DNA Polymerase
with Buffer II and MgCl2 (Life Technologies), according
to the manufacturer's protocol. The PCR products were loaded onto a
2% agarose gel, subjected to DNA gel electrophoresis, stained with
ethidium bromide and verified by sequencing. For this purpose, the
PCR bands were excised from the gel and purified using QIAquick Gel
Extraction Kit (Qiagen GmbH), prior to being subjected to direct
sequencing in both directions with the aforementioned primers,
using the BigDye Terminator v3.1 Cycle Sequencing Kit (Applied
Biosystems Life Technologies, Foster City, USA). The sequencing
reaction was conducted on an ABI PRISM 3130xl Genetic Analyzer
(Applied Biosystems Life Technologies), according to the
manufacturers protocol.
Copy number variation
Analyses of the number of copies of the EGFR gene
and the presence of the EGFRvIII variant were performed with SALSA
MLPA P105 Glioma-2 probemix (MRC-Holland, Amsterdam, The
Netherlands), according to the manufacturers protocol. Fragment
analysis was performed on an ABI PRISM 3130xl Genetic Analyzer
(Applied Biosystems Life Technologies).
MGMT promoter methylation
Analysis of the methylation status of the MGMT
promoter was performed with the MGMT plus kit (Diatech
Pharmacogenetics, Jesi, Italy), according to the manufacturers
instructions. Following bisulfite conversion, the DNA was amplified
with bisulfite-specific primers, using TaKaRa Ex Taq Hot Start DNA
Polymerase (Clontech Laboratories, Inc., Mountainview, USA),
according to the manufacturer's protocol, and analyzed on a
PyroMark Q96 ID (Qiagen GmbH), using Pyro Q-CpG software (Qiagen
GmbH).
PCR commercial arrays
ECM and adhesion molecules
100 ng of isolated RNA was reverse transcribed to
cDNA, and pre-amplified using the RT2 PreAMP cDNA Synthesis Kit
(Qiagen GmbH). The cDNA was aliquoted with Mastermix (Qiagen GmbH)
and added to the wells of an ECM microarray plate (catalogue no.
PAHS-0013; SABiosciences, Frederick, USA), according to the
manufacturers instructions.
Brain cancer miRNA
250 ng of isolated RNA was reverse transcribed to
cDNA using miScript II RT Kit (Qiagen GmbH). The cDNA generated was
subsequently used as a template for qPCR, using the miScript SYBR
Green PCR Kit (SABiosciences, Qiagen GmbH) and the Human Brain
Cancer miRNA PCR Array (catalogue no. MIHS-108Z; SABiosciences),
according to the manufacturers instructions.
Glioma copy number
800 ng of extracted DNA was aliquoted with
qBiomarker SYBR Mastermix (Qiagen GmbH, Hilden, Germany) and added
to the wells of a Human Glioma Copy Number PCR Array Plate
(catalogue no. VAHS-0053Z, SABiosciences), according to the
manufacturers instructions.
All the above PCR array analyses were performed
calculating the ΔCT value for each gene profiled in the plate,
using the formula ΔCT = CT (gene of interest) - average CT
(reference gene). The fold difference value, used for statistical
analysis, was equated to 2–ΔΔCT.
Statistical analyses
The χ2 test was used to establish whether
there was any association between the 2 categorical variables,
short/long RFS group, and any alterations in molecular markers,
including mutations in the IDH1 gene, EGFR amplification, presence
of the mutant form EGFRvIII and methylation of the MGMT promoter.
Differences in the gene expression levels between the 2 groups were
analyzed by one-way analysis of variance. Discriminant analysis was
conducted to predict the probability of a particular sample to
belong to the short or the long RFS group, based on the expression
levels of the profiled genes exhibited by the sample.
Principal component analysis (PCA) was used to
convert a set of observations of possibly correlated variables
(gene expression levels) into a set of values of linearly
uncorrelated variables termed PCs. PCs are guaranteed to be
independent if the data set is jointly normally distributed
(17). A tridimensional PCA
scatter-plot was generated with R software (R Foundation for
Statistical Computing, Vienna, Austria; https://www.r-project.org/).
Leave-one-out cross-validation (LOOCV) was used as
resampling method to estimate the prediction error of the model.
Its indicator, the error rate, defined as 1 - accuracy rate, states
the probability of misclassification of a classifier. In LOOCV, 1
instance is eliminated from the dataset, and the classifier is
created on the remaining instances, in order to assess the
correctness of the prediction of the eliminated instance. This
process is then repeated for all the instances.
Logistic regression analysis was performed using
Stata SE12.0 software (StataCorp LP, College Station, USA),
considering short/long RFS group as the dependent variable, and the
area of the tumor and the patient's age and gender as the
independent variables.
Results
Demographic characteristics of the
patients and molecular characterization of the tumors
Patients with GB were classified in 2 groups, based
on their duration of RFS: Patients were defined as short RFS, if
RFS = <6 months, and long RFS, if RFS = >14 months.
The comparison between the patient's
characteristics, including age, gender and localization of the
tumor, and the 2 lengths of RFS, did not identify any significant
associations (data not shown). The calculated average tumor area
was smaller in the long RFS group compared with the short RFS group
(38 vs. 58 cm2, respectively; Table II), but this difference was not
observed to be statistically significant (data not shown).
Furthermore, using logistic regression analysis, the
role of potential interference factors, including the patient's
age, size of the tumor and extent of surgery, were excluded from
the short/long RFS classification (data not shown).
Molecular markers
Codon 132 in the IDH1 gene was confirmed to be
wild-type in all the 19 GB samples analyzed, while 9/19 (44%) GB
samples presented with EGFR amplification, and 3/9 (33%) samples
carried the EGFRvIII variant (Table
I). Among the short RFS samples, 3/10 (30%) cases presented
with EGFR amplification, and 1/3 (33%) carried the EGFRvIII
variant; whereas in the long RSF samples, 6/9 (67%) cases presented
with EGFR amplification, and 2/6 (33%) carried the EGFRvIII variant
(Table I). Overall, 8/19 (42%) GB
samples exhibited MGMT promoter methylation, 5 of which belonged to
the 10 short RFS group (50%), whereas only 3 (33%) of those samples
with MGMT promoter methylation belonged to the 9 long RSF group
(Table I).
Molecular markers and RFS association
analysis
The comparison between the frequencies of
alterations in the molecular marker that were identified in the
patients with GB, and the differences in RFS displayed by these
patients, did not reveal any significant differences. Furthermore,
no significant correlations were observed among all the molecular
alterations analyzed.
PCR array data and RFS association
analysis
The differences between the short and long RFS
groups, regarding the expression levels and copy number of 191
genes, were analyzed using 3 PCR arrays. The results revealed
significant differences in the expression levels of miRNA-150-5p
between the 2 groups (P=0.040; Table
III).
| Table III.Differences in the expression levels
of the 5 selected genes among the patients with glioblastoma,
belonging to the short (n=10) or long (n=9) RFS groups. |
Table III.
Differences in the expression levels
of the 5 selected genes among the patients with glioblastoma,
belonging to the short (n=10) or long (n=9) RFS groups.
|
| RFS (mean) |
|
|---|
|
|
|
|
|---|
| Gene | Short | Long | P-value |
|---|
| miRNA-150-5p | 0.075 | 0.192 | 0.040a |
| miRNA-328-3p | 0.042 | 0.192 | 0.060 |
| SELE | 0.006 | 0.000 | 0.094 |
| SELL | 0.027 | 0.010 | 0.076 |
| ADAMTS13 | 0.013 | 0.002 | 0.059 |
5-genes combination
In order to perform a discriminant analysis and
predict the probability of a GB case to belong to the short or long
RFS group, based on their gene expression levels, 5 genes with the
lowest P-value (P<0.095), including miRNA-150-5p and −328-3p,
selectin E (SELE) and L (SELL), and a disintegrin and
metalloproteinase with a thrombospondin type 1 motif, member 13
(ADAMTS13), were selected for the analysis (Table III).
The combination of the expression levels of the
above 5 genes was able to correctly classify the GB samples into
their corresponding short or long RFS group, with a precision of 90
and 100%, respectively (Table IV).
Overall, 94.74% (18/19) GB cases were correctly classified with
this method (P=0.008; Table IV). The
probability of each sample to belong to one or the other group is
also indicated in Table IV. Among
the 18 samples correctly classified, 12 (66%) were assigned a
probability >90%, including 7 cases (34%) whose probability was
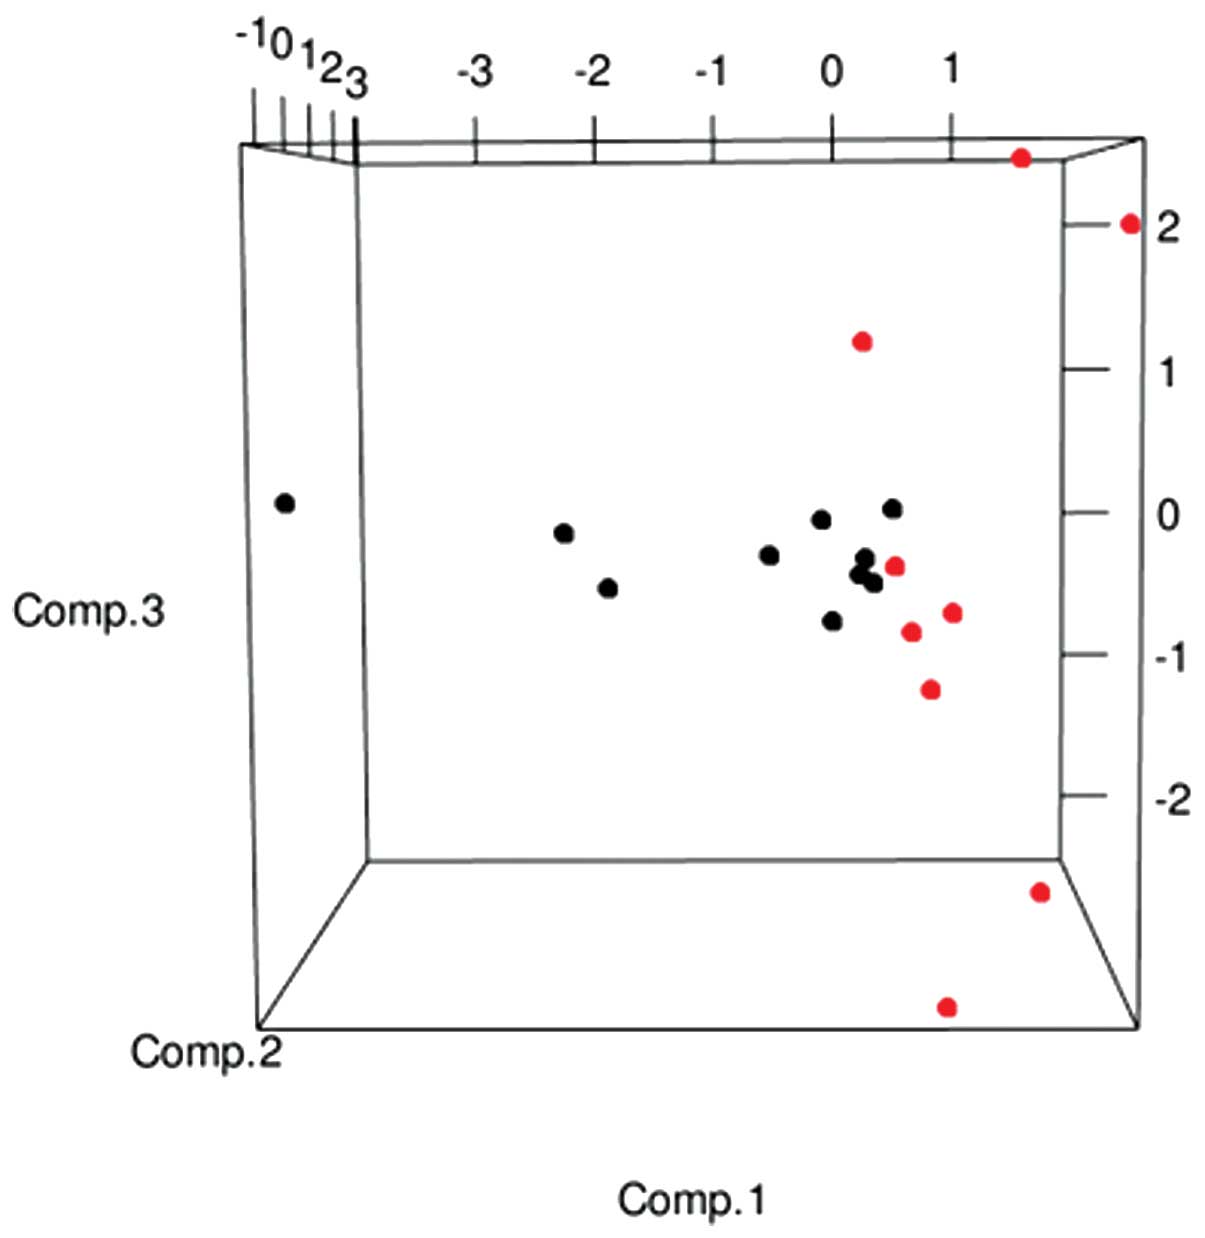
>99% (Table IV). Using the
expression levels of the aforementioned 5 selected genes
(miRNA150-5p, miRNA328-3p, SELE, SELL and ADAMTS13) as data
variables, a PCA was performed, which clearly indicated a
well-defined separation of the 2 RFS populations in a
tridimensional space (Fig. 1).
| Table IV.Classification of observations based
on the derived discriminant functions. |
Table IV.
Classification of observations based
on the derived discriminant functions.
| A,
Classification |
|
|
|
|
|
|---|
|
|---|
|
|
|
| Predicted RFS, n
(%) |
|---|
|
|
|
|
|
|---|
| Actual RFS | Actual RFS, total
n |
| Short |
| Long |
|---|
| Short | 10 |
| 9
(90) |
| 1 (10) |
| Long | 9 |
| 0 (0) |
| 9
(100) |
|
| B,
Probabilities |
|
|
|
|
|
|
| Surgical pathology
number | Actual RFS
group | Predicted RFS
group | Prob. | Second predicted
RFS group | Prob. |
|
| 298/09 | Short | Short | 0.9989 | Long | 0.0011 |
| 476/06 | Long | Long | 0.9912 | Short | 0.0088 |
| 2102/08 | Long | Long | 0.9872 | Short | 0.0128 |
| 3605/06 | Short | Short | 0.9992 | Long | 0.0008 |
| 4096/10 | Short | Short | 0.8672 | Long | 0.1328 |
| 4239/12 | Short | Short | 0.6459 | Long | 0.3541 |
| 4318/07 | Long | Long | 0.9998 | Short | 0.0002 |
| 4382/05 | Short | Short | 0.9962 | Long | 0.0038 |
| 4534/11 | Long | Long | 0.5913 | Short | 0.4087 |
| 4561/12 | Long | Long | 0.8025 | Short | 0.1975 |
| 4619/07 | Long | Long | 0.6960 | Short | 0.3040 |
| 5165/11 | Long | Long | 0.9139 | Short | 0.0861 |
| 6043/08 | Long | Long | 0.9152 | Short | 0.0848 |
| 7031/07 | Long | Long | 0.9983 | Short | 0.0017 |
| 7624/05 | Short | Short | 0.9909 | Long | 0.0091 |
| 7901/09 | Short | Short | 0.9753 | Long | 0.0247 |
| 9298/07 | Short | Short | 0.8214 | Long | 0.1786 |
| 9303/09 | Short |
Longa | 0.5591 |
Shorta | 0.4409 |
| 10504/10 | Short | Short | 0.9618 | Long | 0.0382 |
Cross-validation of the 5-genes
combination
The prediction error of the 5-genes combination
approach was estimated via cross-validation, using a resampling
method. In this type of methodology, the prediction error is
calculated for each measured tree from a presumed distribution of
errors, and a dataset is subsequently generated as the sum of a
prediction and a random prediction error.
The percentage of cases correctly classified
following this method was 90% (9/10) in the short RFS samples, and
78% (7/9) in the long RFS samples, with a total error rate of
0.1579 (Table V).
| Table V.Overall cross-validation error
rate. |
Table V.
Overall cross-validation error
rate.
| A, Value
prediction |
|
|
|
|---|
|
|---|
| RFS | Recall |
| 1-precision |
|---|
| Short | 0.9000 |
| 0.1818 |
|---|
| Long | 0.7778 |
| 0.1250 |
|---|
|
|---|
| B, Confusion
matrix |
|
|
|
|
|---|
| RFS | Short | Long | Total |
|
|---|
| Short | 9 | 1 | 10 |
| Long | 2 | 7 | 9 |
| Total | 11 | 8 | 19 |
Discussion
In regards to GB, it is of importance to identify
key molecular markers, and to perform simple and prompt molecular
diagnostic tests that are able to predict the survival time and
therapeutic response of patients. In the present study, a wide
molecular characterization, including analysis of miRNA, RNA and
DNA, was performed on 19 GB cases with different RFS outcome, in an
attempt to better understand the dynamics of the genomic
alterations associated with relapse in patients with GB. A
long-term recurrence GB group, with an RFS ranging from 14 to 71
months (mean RFS = 27 months), was included in the study. This
group represents rare cases of GB, compared with the GB RFS
reported in the literature (3).
Based on the clinical history of the patients and
the molecular features of their tumors, all the cases were
classified as primary GBs. The patients did not present any
previous records of brain neoplasm, and their median age at the
time of diagnosis was 60 years, which is in agreement with previous
studies that reported the mean age of patients clinically diagnosed
with primary GB to be 62 years, and 45 years in the case of
patients clinically diagnosed with secondary GB (18). In addition, the patients of the
present study exhibited a high frequency of overexpression of EGFR
(44%) and absence of IDH1 mutations, which are typical features of
primary GBs (18).
The expression levels of 84 miRNAs whose expression
pattern is altered during nervous system-associated carcinogenesis,
and 84 genes whose products are involved in cell-cell and
cell-matrix interaction processes, were evaluated by qPCR array.
Additionally, a copy number PCR array analysis was performed on 23
genes whose expression pattern has been reported to be frequently
altered in human glioma tumors (15).
The results revealed significant differences in the expression
levels of miRNA150-5p between the short and long RFS groups.
The 5 genes with the highest differences in gene
expression levels that were identified in the study, including
miRNA150-5p, miRNA328-3p, SELE, SELL and ADAMTS13, were selected
for subsequent analysis, despite their P-values were not
significant (P<0.095). The resulting 5-genes combination
approach was able to correctly classify 94.74% of the 19 GB samples
into their corresponding short or long RFS groups. To the best of
our knowledge, the expression pattern of the above 5 genes has
never been associated with RFS in GB thus far.
Next, an LOOCV was performed to evaluate the
performance of this 5-genes combination approach, and a low error
rate (0.1579) was obtained for this method, indicating that 84% of
the 19 GB cases were correctly classified following this
approach.
Of the aforementioned genes, SELE, SELL and ADAMTS13
were observed to be overexpressed in the short RFS GB samples,
which is the group with the worst prognosis. ADAMTS13 has been
previously associated with the degradation and remodeling of the
ECM, while SELE and SELL are cell adhesion molecules (CAMs) that
mediate cell attachment, migration and signaling to and from the
ECM (15). Alterations of CAMs have
been reported to be common in cancer, where the disruption of
cell-cell or cell-ECM adhesion significantly contributes to
uncontrolled cell proliferation and progressive distortion of the
architecture of normal tissue (19).
Furthermore, alterations in CAMs have been involved in tumor
dissemination, since the loss of cell-cell adhesion enables the
malignant cells to detach and subsequently migrate from the primary
mass (19).
By contrast, miRNA-150-5p and 328-3p were observed
to be overexpressed in the long RFS GB group, which is the group
with the best prognosis. Previous studies have demonstrated that
the increased expression of miR-150 inhibited breast cancer cell
migration and invasion in vitro, and decreased cell
proliferation and induced apoptosis in natural killer and T-cells
(20,21). A previous study revealed that patients
with GB whose expression levels of miR-328 were lower than the
median value, exhibited poor survival, since miR-328 is associated
with the cell cycle progression (22). Therefore, the ectopic expression of
miR-328 in GB cells may suppress cell proliferation (22).
In the present study, the GB samples were divided
and compared, according to their short or long RFS time, despite
not being 2 distinct clinical or pathological entities. All the
patients with GB displayed the same histological and pathological
features, including high malignancy, invasive behavior and poor
prognosis, regardless of their short or long RFS. Therefore, it is
not easy to differentiate between short and long RFS in patients
with GB. However, it is of importance to understand the mechanisms
leading to aggressive GB tumors with high spreading capacities,
which are not susceptible to standard treatments, including
surgery, radiotherapy and chemotherapy, whereas other GB tumors are
more manageable, and enable patients to live >1 year. Although
tumor invasion and metastasis are known to be the main causes of
mortality in patients with solid cancer, including GB, the
characterization of the molecular and cellular mechanisms behind
these processes is limited.
In conclusion, the present study has demonstrated
that alterations in the expression pattern of certain miRNAs, mRNAs
and genomic DNA constitute a particular molecular hallmark, which
may increase or reduce the aggressive behavior of GB tumors, thus
influencing the survival time, response to therapy and tendency to
experience a tumor relapse of patients with GB. In particular, the
5-genes combination approach performed in the present study was
able to correctly predict the short or long RFS outcome in the
majority of patients with GB. The high sensitivity and precision of
this approach, as confirmed by LOOCV, provide a strong foundation
for further validation of the association between alterations in
the expression of the aforementioned 5 genes and the RFS of
patients with GB in a larger population.
References
|
1
|
Stupp R, Mason WP, van den Bent MJ, Weller
M, Fisher B, Taphoorn MJ, Belanger K, Brandes AA, Marosi C, Bogdahn
U, et al: European Organisation for Research and Treatment of
Cancer Brain Tumor and Radiotherapy Groups; and National Cancer
Institute of Canada Clinical Trials Group: Radiotherapy plus
concomitant and adjuvant temozolomide for glioblastoma. N Engl J
Med. 352:987–996. 2005. View Article : Google Scholar : PubMed/NCBI
|
|
2
|
Grossman SA, Ye X, Piantadosi S, Desideri
S, Nabors LB, Rosenfeld M and Fisher J: NABTT CNS Consortium:
Survival of patients with newly diagnosed glioblastoma treated with
radiation and temozolomide on research studies in the United
States. Clin Cancer Res. 16:2443–2449. 2010. View Article : Google Scholar : PubMed/NCBI
|
|
3
|
Hou LC, Veeravagu A, Hsu AR and Tse VC:
Recurrent glioblastoma multiforme: A review of natural history and
management options. Neurosurg Focus. 20:E52006.PubMed/NCBI
|
|
4
|
Wong ET, Hess KR, Gleason MJ, Jaeckle KA,
Kyritsis AP, Prados MD, Levin VA and Yung WK: Outcomes and
prognostic factors in recurrent glioma patients enrolled onto phase
II clinical trials. J Clin Oncol. 17:2572–2578. 1999.PubMed/NCBI
|
|
5
|
Lamborn KR, Yung WK, Chang SM, Wen PY,
Cloughesy TF, DeAngelis LM, Robins HI, Lieberman FS, Fine HA, Fink
KL, et al: North American Brain Tumor Consortium: Progression-free
survival: An important end point in evaluating therapy for
recurrent high-grade gliomas. Neuro Oncol. 10:162–170. 2008.
View Article : Google Scholar : PubMed/NCBI
|
|
6
|
Zhang W, Zhang J, Yan W, You G, Bao Z, Li
S, Kang C, Jiang C, You Y, Zhang Y, et al: Whole-genome microRNA
expression profiling identifies a 5-microRNA signature as a
prognostic biomarker in Chinese patients with primary glioblastoma
multiforme. Cancer. 119:814–824. 2013. View Article : Google Scholar : PubMed/NCBI
|
|
7
|
Knott JC, Mahesparan R, Garcia-Cabrera I,
Bølge Tysnes B, Edvardsen K, Ness GO, Mørk S, Lund-Johansen M and
Bjerkvig R: Stimulation of extracellular matrix components in the
normal brain by invading glioma cells. Int J Cancer. 75:864–872.
1998. View Article : Google Scholar : PubMed/NCBI
|
|
8
|
Freije WA, Castro-Vargas FE, Fang Z,
Horvath S, Cloughesy T, Liau LM, Mischel PS and Nelson SF: Gene
expression profiling of gliomas strongly predicts survival. Cancer
Res. 64:6503–6510. 2004. View Article : Google Scholar : PubMed/NCBI
|
|
9
|
Phillips HS, Kharbanda S, Chen R, Forrest
WF, Soriano RH, Wu TD, Misra A, Nigro JM, Colman H, Soroceanu L, et
al: Molecular subclasses of high-grade glioma predict prognosis,
delineate a pattern of disease progression, and resemble stages in
neurogenesis. Cancer Cell. 9:157–173. 2006. View Article : Google Scholar : PubMed/NCBI
|
|
10
|
Berens ME and Giese A: ‘…those left
behind.’ Biology and oncology of invasive glioma cells. Neoplasia.
1:208–219. 1999. View Article : Google Scholar : PubMed/NCBI
|
|
11
|
Besse A, Sana J, Fadrus P and Slaby O:
MicroRNAs involved in chemo- and radioresistance of high-grade
gliomas. Tumour Biol. 34:1969–1978. 2013. View Article : Google Scholar : PubMed/NCBI
|
|
12
|
Ambros V: MicroRNAs: Tiny regulators with
great potential. Cell. 107:823–826. 2001. View Article : Google Scholar : PubMed/NCBI
|
|
13
|
Yin AA, Zhang LH, Cheng JX, Dong Y, Liu
BL, Han N and Zhang X: The predictive but not prognostic value of
MGMT promoter methylation status in elderly glioblastoma patients:
A meta-analysis. PLoS One. 9:e851022014. View Article : Google Scholar : PubMed/NCBI
|
|
14
|
Colen RR, Vangel M, Wang J, Gutman DA,
Hwang SN, Wintermark M, Jain R, Jilwan-Nicolas M, Chen JY, Raghavan
P, et al: TCGA Glioma Phenotype Research Group: Imaging genomic
mapping of an invasive MRI phenotype predicts patient outcome and
metabolic dysfunction: A TCGA glioma phenotype research group
project. BMC Med Genomics. 7:302014. View Article : Google Scholar : PubMed/NCBI
|
|
15
|
Qiagen: Glioma Copy Number PCR Array.
http://www.sabiosciences.com/copynumber_product/HTML/VAHS-0053Z.html
|
|
16
|
Louis DN, Ohgaki H, Wiestler OD, Cavenee
WB, Burger PC, Jouvet A, Scheithauer BW and Kleihues P: The 2007
WHO classification of tumours of the central nervous system. Acta
Neuropatho. 114:97–109. 2007. View Article : Google Scholar
|
|
17
|
Jolliffe IT: Springer Series in
Statistics: Principal Component Analysis. (2nd). (NY). Springer.
282002. ISBN: 978-0-387-95442-4
|
|
18
|
Ohgaki H and Kleihues P: The definition of
primary and secondary glioblastoma. Clin Cancer Res. 19:764–772.
2013. View Article : Google Scholar : PubMed/NCBI
|
|
19
|
Moh MC and Shen S: The roles of cell
adhesion molecules in tumor suppression and cell migration: A new
paradox. Cell Adhes Migr. 3:334–336. 2009. View Article : Google Scholar
|
|
20
|
Huang S, Chen Y, Wu W, Ouyang N, Chen J,
Li H, Liu X, Su F, Lin L and Yao Y: miR-150 promotes human breast
cancer growth and malignant behavior by targeting the pro-apoptotic
purinergic P2X7 receptor. PLoS One. 8:e807072013. View Article : Google Scholar : PubMed/NCBI
|
|
21
|
Caramuta S, Lee L, Ozata DM, Akçakaya P,
Georgii-Hemming P, Xie H, Amini RM, Lawrie CH, Enblad G, Larsson C,
et al: Role of microRNAs and microRNA machinery in the pathogenesis
of diffuse large B-cell lymphoma. Blood Cancer J. 3:e1522013.
View Article : Google Scholar : PubMed/NCBI
|
|
22
|
Wu Z, Sun L, Wang H, Yao J, Jiang C, Xu W
and Yang Z: MiR-328 expression is decreased in high-grade gliomas
and is associated with worse survival in primary glioblastoma. PLoS
One. 7:e472702012. View Article : Google Scholar : PubMed/NCBI
|