Introduction
Vulvar cancer is the fourth most common
gynecological cancer worldwide, comprising 5% of total malignancies
observed in the female reproductive tract (1). Squamous cell carcinoma is the most
commonly observed pathological type of vulvar cancer (2). Vulvar carcinoma is most frequently
diagnosed in postmenopausal females and the mean age at diagnosis
has been revealed to be 65 years, although this number has been
observed to be decreasing (3). In
recent years, vulvar squamous cell carcinoma (VSCC) incidence has
increased (4). Vulvar intraepithelial
neoplasia (VIN) is the precursor lesion of VSCC and its incidence
is also increasing, according to data from the Surveillance,
Epidemiology, and End Results Program (4). Young patients with VIN generally heal
spontaneously without treatment, howvever, patients >60 years
old or young patients with immunosuppression may develop invasive
cancer.
B cell-specific Moloney murine leukemia virus
integration site 1 (BMI-1) is a stem cell factor and member of the
polycomb group (PCG) family (5).
BMI-1 is important for cell cycle progression, cell immortalization
and senescence, and has been reported to regulate the proliferative
activities of normal, stem and progenitor cells (6). Numerous studies have demonstrated that
BMI-1 expression, which is upregulated in multiple types of cancer,
is positively correlated with clinical grade/stage and poor
prognosis in cervical (7), ovarian
(8), endometrial (9) and lung (10) cancer. Silencing of BMI-1 expression by
RNA interference (RNAi) has been observed to decrease the rate of
tumor cell growth, resulting in cell cycle arrest and inhibition of
the invasive ability of tumor cells (11–14). In
the present study, BMI-1 expression in VSCC was examined, and the
effect of small-interfering RNA (siRNA)-mediated silencing of BMI-1
in A-431 cells was investigated.
Materials and methods
Tissue samples
All experiments were approved by the Ethics
Committee of China Medical University (Liaoning, China). A total of
125 paraffin-embedded tissue specimens, including 75 VSCC, 40
vulvar intraepithelial neoplasia (VIN) and 10 normal vulvar samples
adjacent to the carcinoma, were subjected to immunohistochemical
analysis. The samples used in the present study were obtained from
the Department of Pathology of Shengjing Hospital (Liaoning,
China). Tissue samples were obtained during routine biopsies of the
vulva or vulvectomies. Representative immunohistochemically stained
sections of epithelium, including the adjacent mucosa, were
examined using light microscopy (BX60; Olympus Corporation, Tokyo,
Japan). VSCC samples were pathologically staged according to the
International Federation of Gynecology and Obstetrics 2009, and
divided into the following: 43 VSCC grade I, 16 VSCC grade II and
16 VSCC grade III tumors. The median age of patients with VSCC was
55 years (range, 39–74 years). The median age of patients with VIN
was 43 years (range, 23–68 years). and the median age of
individuals with normal vulvar tissue was 59 years (range, 38–68
years). No statistically significant differences were observed
between the three age distribution groups (P>0.05).
Immunohistochemistry
Serial longitudinal sections (4 µm) were cut, placed
onto slides, de-waxed in xylene (Sinopharm Chemical Reagent Co.,
Ltd., Shanghai, China) and rehydrated in graded ethanol (Sinopharm
Chemical Reagent Co., Ltd.) and distilled water. Sections were
treated with H2O2 (Sinopharm Chemical Reagent
Co., Ltd.) prior to immunostaining in order to block endogenous
peroxidase activity. For immunohistochemical staining, sections
were incubated with primary antibody (rabbit monoclonal anti-human
BMI-1; cat no. sc-10745; 1:400 dilution; Santa Cruz Biotechnology,
Inc., Dallas, TX, USA) in a refrigerator at 4°C overnight, at room
temperature for 40 min, then in a 37°C incubator for 40 min.
Subsequently, the sections were incubated with horseradish
peroxidase (HRP)-labeled streptavidin-biotin kit system (BIOSS,
Beijing, China) in a 37°C incubator for 30 min. Binding of
antibodies was visualized using 3,3′-diaminobenzidine (Sinopharm
Chemical Reagent Co., Ltd.), developed under light microscopic
control to optimize contrast. Sections were then counterstained
with hematoxylin (Beyotime Institute of Biotechnology, Shanghai,
China), dehydrated through graded ethanol and xylene and embedded.
Immunohistological evaluation of the paraffin-embedded sections was
performed by scoring two aspects as follows: Staining intensity [no
(0), weak (1), medium (2) and strong (3)] and the percentage of
positive tumor cells [<5% (0), 5–25% (1), 26–50% (2), 51–75% (3)
and >75% (4)]; the total score was the sum of the two individual
scores. BMI-1 expression was scored as follows: 0 and 1, (−); 2 and
3, (+); 4 and 5, (++); 6 and 7, (+++). BMI-1 overexpression was
indicated by (++) and (+++).
Cell line
The A-431 human epidermal squamous cell line was
obtained from the China Medical University Center laboratory
(Liaoning, China) and grown in Dulbecco's modified Eagle's medium
(Gibco Life Technologies, Carlsbad, CA, USA) supplemented with 10%
fetal bovine serum (Beyotime Institute of Biotechnology). The cells
were maintained at 37°C in a humidified atmosphere of 5%
CO2.
BMI-1 silencing by siRNA
Three siRNA constructs, which were obtained from
Shanghai GenePharma Co., Ltd. (Shanghai, China), were designed and
synthesized according to the GeneBank NM-005180 gene sequence
(http://www.ncbi.nlm.nih.gov/genbank),
and one control siRNA was obtained from Shanghai GenePharma Co.,
Ltd. All siRNA constructs were labeled by segment fluorescein by
Shanghai GenePharma Co., Ltd. The sequences were as follows: BMI-1
siRNA-1 sense, 5′-CCAGACCACUACUGAAUAUTT-3′ and antisense,
5′-AUAUUCAGUAGUGGUCUGGTT-3′; BMI-1 siRNA-2 sense,
5′-GGAUCGGAAAGUAAACAAATT-3′ and antisense,
5′-UUUGUUUACUUUCCGAUCCTT-3′; BMI-1 siRNA-3 sense,
5′-CCAGAUUGAUGUCAUGUAUTT-3′ and antisense,
5′-AUACAUGACAUCAAUCUGGTT-3′; negative control sense,
5′-UUCUCCGAACGUGUCACGUTT-3′ and antisense,
5′-ACGUGACACGUUCGGAGAATT-3′. A-431 cells were transfected using
Lipofectamine®2000 Reagent (Invitrogen Life Technologies, Carlsbad,
CA, USA) at 70% confluency. The optimal time of transfection was 24
h (transfection efficiency ≥80%), as determined by fluorescence
microscopy (BX51TF; Olympus Corporation). Western blotting and
reverse transcription-quantitative polymerase chain reaction
(RT-qPCR) were used to identify the most effective siRNA
construct.
RT-qPCR assay
Following 24 h of transfection, total RNA was
extracted from A-431 cells using TRIzol reagent (Invitrogen Life
Technologies) The primers used were as follows: BMI-1 sense,
5′-TGGACTGACAAATGCTGGAGA-3′ and antisense,
5′-GAAGATTGGTGGTTACCGCTG-3′; β-actin sense,
5′-CATTAAGGAGAAGCTGTGCT-3′ and antisense,
5′-GTTGAAGGTAGTTTCGTGGA-3′ (Shanghai GenePharma Co., Ltd.). RT-qPCR
reactions were performed using the SYBR Green method with the
AccuPower Greenstar qPCR Master mix (Bioneer Corp., Daejeon, Korea)
on a Rotor-Gene 6000 (Corbett Research Pty Ltd., Sydney,
Australia). The PCR reactions were conducted as follows: 94°C for 5
min, amplification for 40 cycles with denaturation at 94°C for 20
sec, annealing at 61°C for 20 sec and extension at 72°C for 20 sec.
All experiments were performed in duplicate or triplicate. Relative
expression was calculated using Relative Expression Software Tool
2009 software (Corbett Research Pty Ltd.).
Western blot assay
Total BMI-1 protein was isolated and quantified as
follows: Cells transfected for 24 h were harvested, washed with
ice-cold phosphate-buffered saline and lysed in lysis buffer
(Beyotime Institute of Biotechnology) at 4°C for 30 min, followed
by brief sonication (Vibra-Cell VCX750; Sonics & Materials,
Inc., Newtown, CT, USA). All experimental steps were performed on
ice. Following centrifugation at 16,000 × g for 10 min at 4°C,
supernatants were collected and the protein concentration was
measured using bicinchoninic acid assay reagent (BioTeke Corp.,
Beijing, China). Proteins were separated by 10% SDS-PAGE and
transferred onto a polyvinylidene difluoride membrane
(Immobilon-Ny+; both from Beyotime Institute of Biotechnology).
Following saturation, the membranes were incubated at room
temperature for 2 h in Tris-buffered saline with 0.1% Tween-20
(Beyotime Institute of Biotechnology) containing 5% non-fat dry
milk (Inner Mongolia Yili Industrial Group Co., Ltd., Hohhot,
China). The membranes were subsequently incubated with primary
antibodies against BMI-1 (1:400 dilution) overnight at 4°C and
subjected to secondary detection using HRP-conjugated
immunoglobulin G (H+L) antibodies [goat anti-rabbit polyclonal; cat
no. LK-GAR007; 1:4,000 dilution; Multi Sciences (Lianke) Biotech
Co., Ltd., Hangzhou, China] at room temperature for 2 h. Protein
detection was performed using an LumiPico® enhanced
chemiluminescence kit (Nanjing Keygen Biotech. Co. Ltd., Nanjing,
China). GAPDH antibody (mouse anti-human monocloanl; cat no.
sc-365062; 1:800 dilution; Santa Cruz Biotechnology, Inc.) was used
as a protein loading control.
MTT assay
In order to measure cell growth, cells transfected
for 24 h were seeded into 96-well plates at a density of
1×10⁵/ml in a volume of 100 µl, and allowed to grow for
6–8 h. Cells were then divided into three groups as follows: A
blank group, transfected with an identical volume of opti-MEM
medium/Lipofectamine 2000; a negative control group, transfected
with negative control siRNA/Lipofectamine 2000; and a best
transfection group, transfected with the most effective
siRNA/Lipofectamine 2000. Twenty-four hours following transfection,
20 µl MTT solution (5 mg/ml in PBS; Beyotime Institute of
Biotechnology) was added to each microtiter well and incubated for
4 h at 37°C. Following aspiration of the medium, 200 µl dimethyl
sulfoxide (Beyotime Institute of Biotechnology) was added and
mixed, and absorbance was measured at a wavelength of 570 nm
(DU-730; Beckman Coulter, Inc., Brea, CA, USA). Cell survival rate
was calculated as follows: [A-431(siRNA)/A-431(blank)] 100%, where
A-431(siRNA) is the absorbance of the cells transfected with siRNA
and A-431(blank) is the absorbance of the cells not transfected
with siRNA.
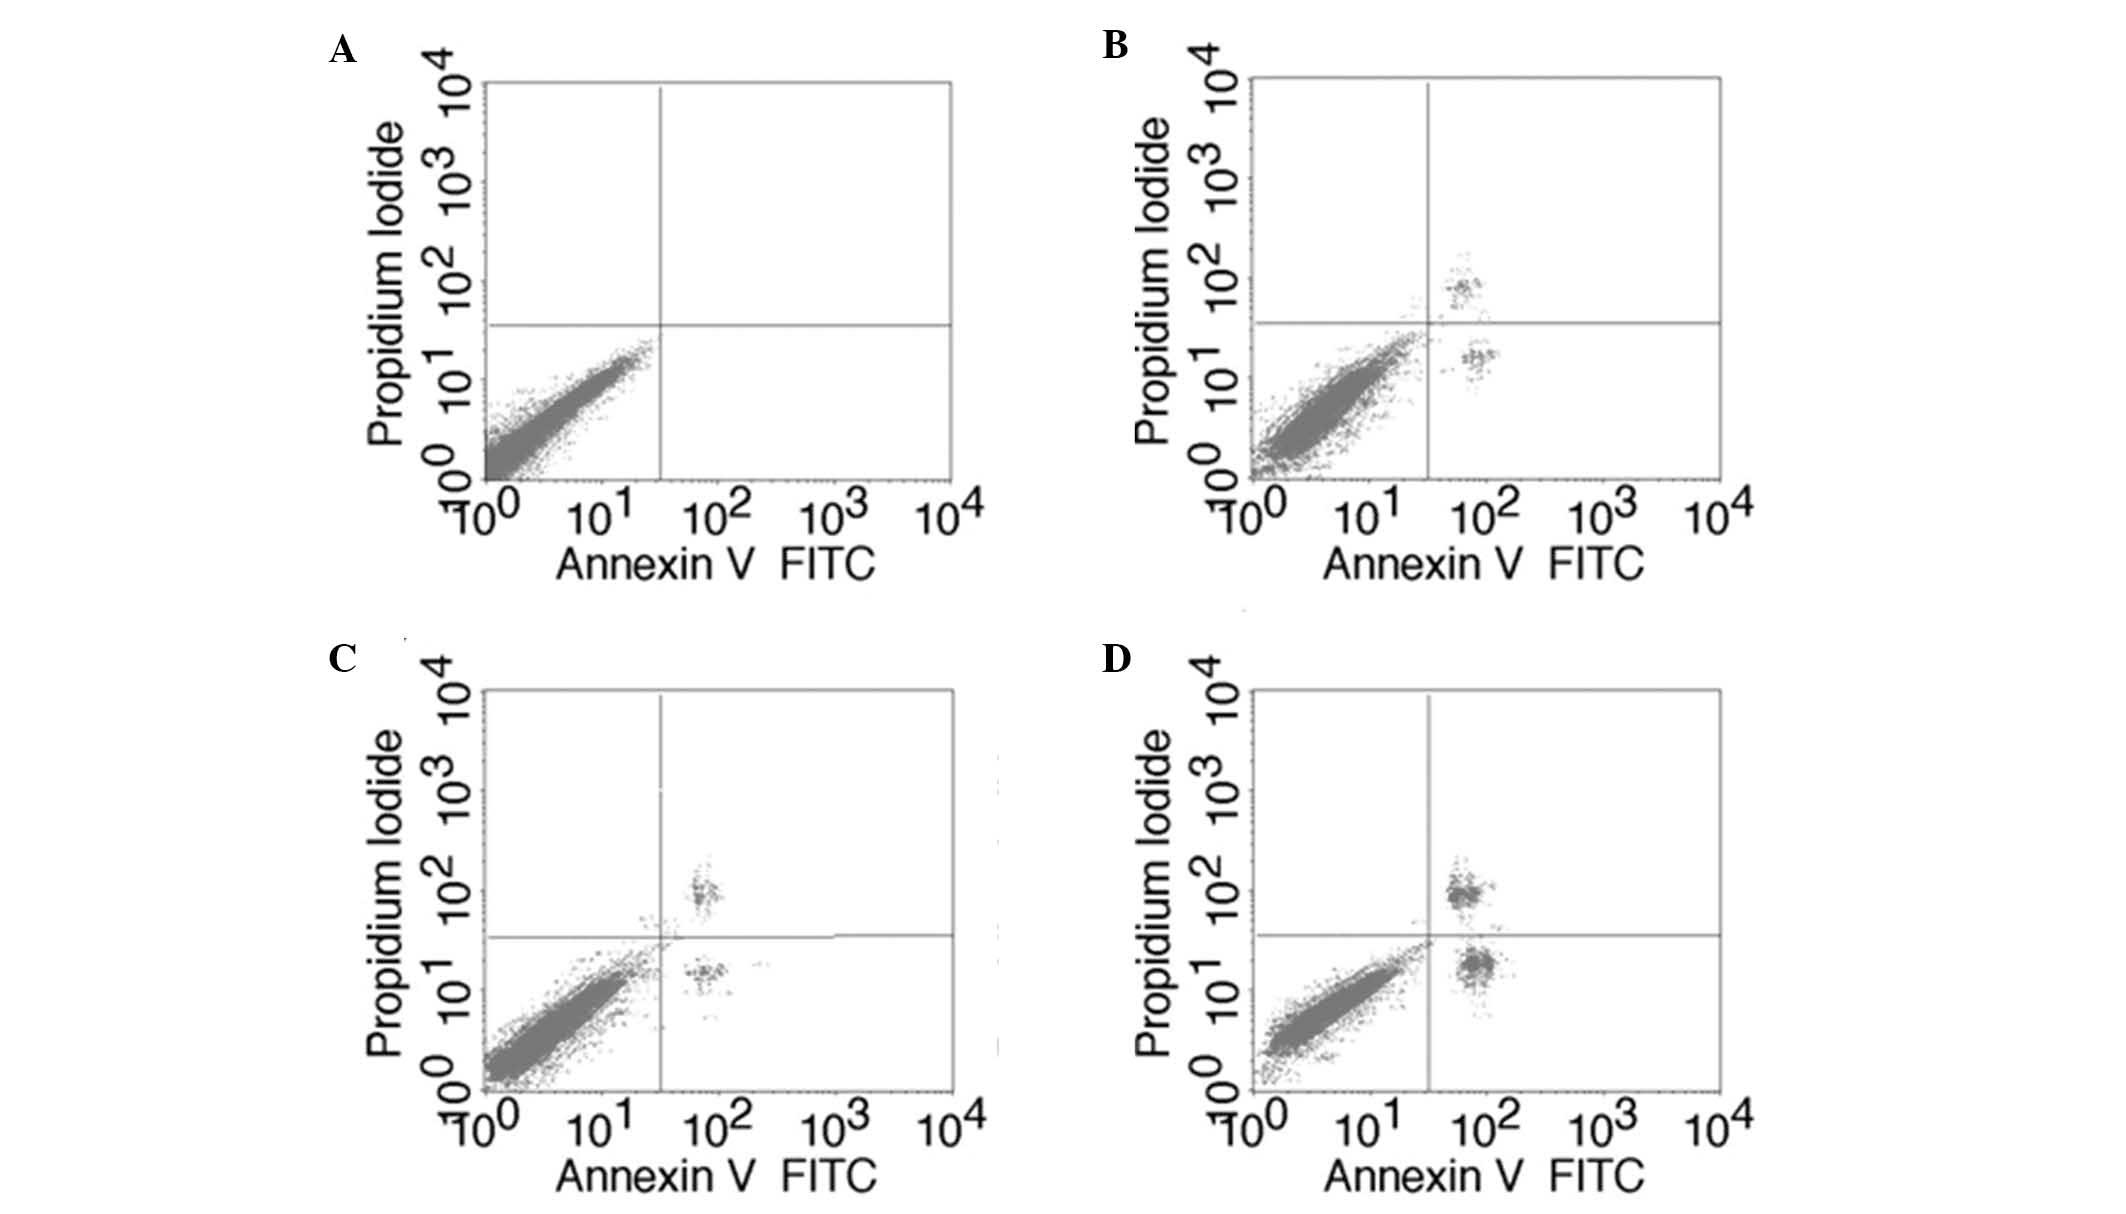
Apoptosis assay
Apoptosis was assayed using the Annexin
V-fluorescein isothiocyanate (FITC) apoptosis kit (Beyotime
Institute of Biotechnology). Briefly, cells transfected for 24 h
were harvested and washed twice with PBS, followed by resuspension
in 10 µl Annexin V binding buffer. Subsequently, FITC-conjugated
Annexin V and propidium iodide were added. Following incubation for
15 min at room temperature in the dark, an additional binding
buffer was added and cells were incubated for 5 min at 6–8°C.
Samples were analyzed immediately by flow cytometry (Cell Lab
Quanta™ SC; Beckman Coulter, Inc.). Cells were divided into three
groups as follows: Normal A-431 cells (without transfection),
negative control group (transfected with negative control siRNA)
and best transfection group (transfected with the most effective
siRNA).
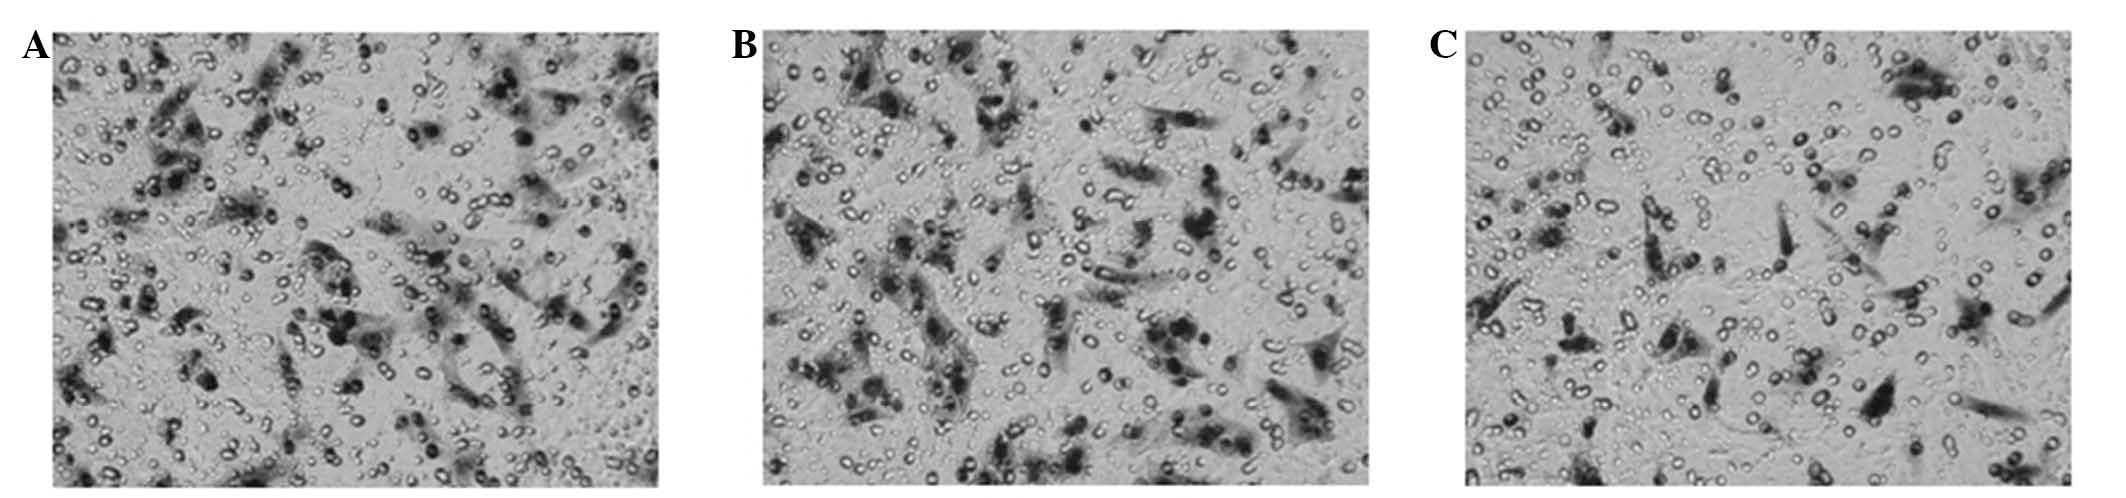
Transwell chamber invasion assay
The polycarbonate membranes (8 µm-pores) of
Transwell inserts were coated with Matrigel (BD Biosciences, San
Jose, CA, USA). Cells were resuspended in serum-free minimum
essential medium (MEM; Gibco Life Technologies) and seeded into the
upper wells in the three groups described previously. MEM medium
supplemented with 15% fetal bovine serum was placed into the lower
chamber. Following incubation for 24 h at 37°C, the inserts were
removed and cells which had migrated through the membranes and
attached to the lower chamber were photographed using an Olympus
BX60 microscope and counted.
Statistical analysis
All experiments were performed a minimum of three
times and the results were analyzed using SPSS version 17.0 (SPSS
Inc., Chicago, IL, USA). Values were expressed as the mean ±
standard deviation. The analysis of variance test was used when
>2 groups were compared and P<0.05 was considered to indicate
a statistically significant difference.
Results
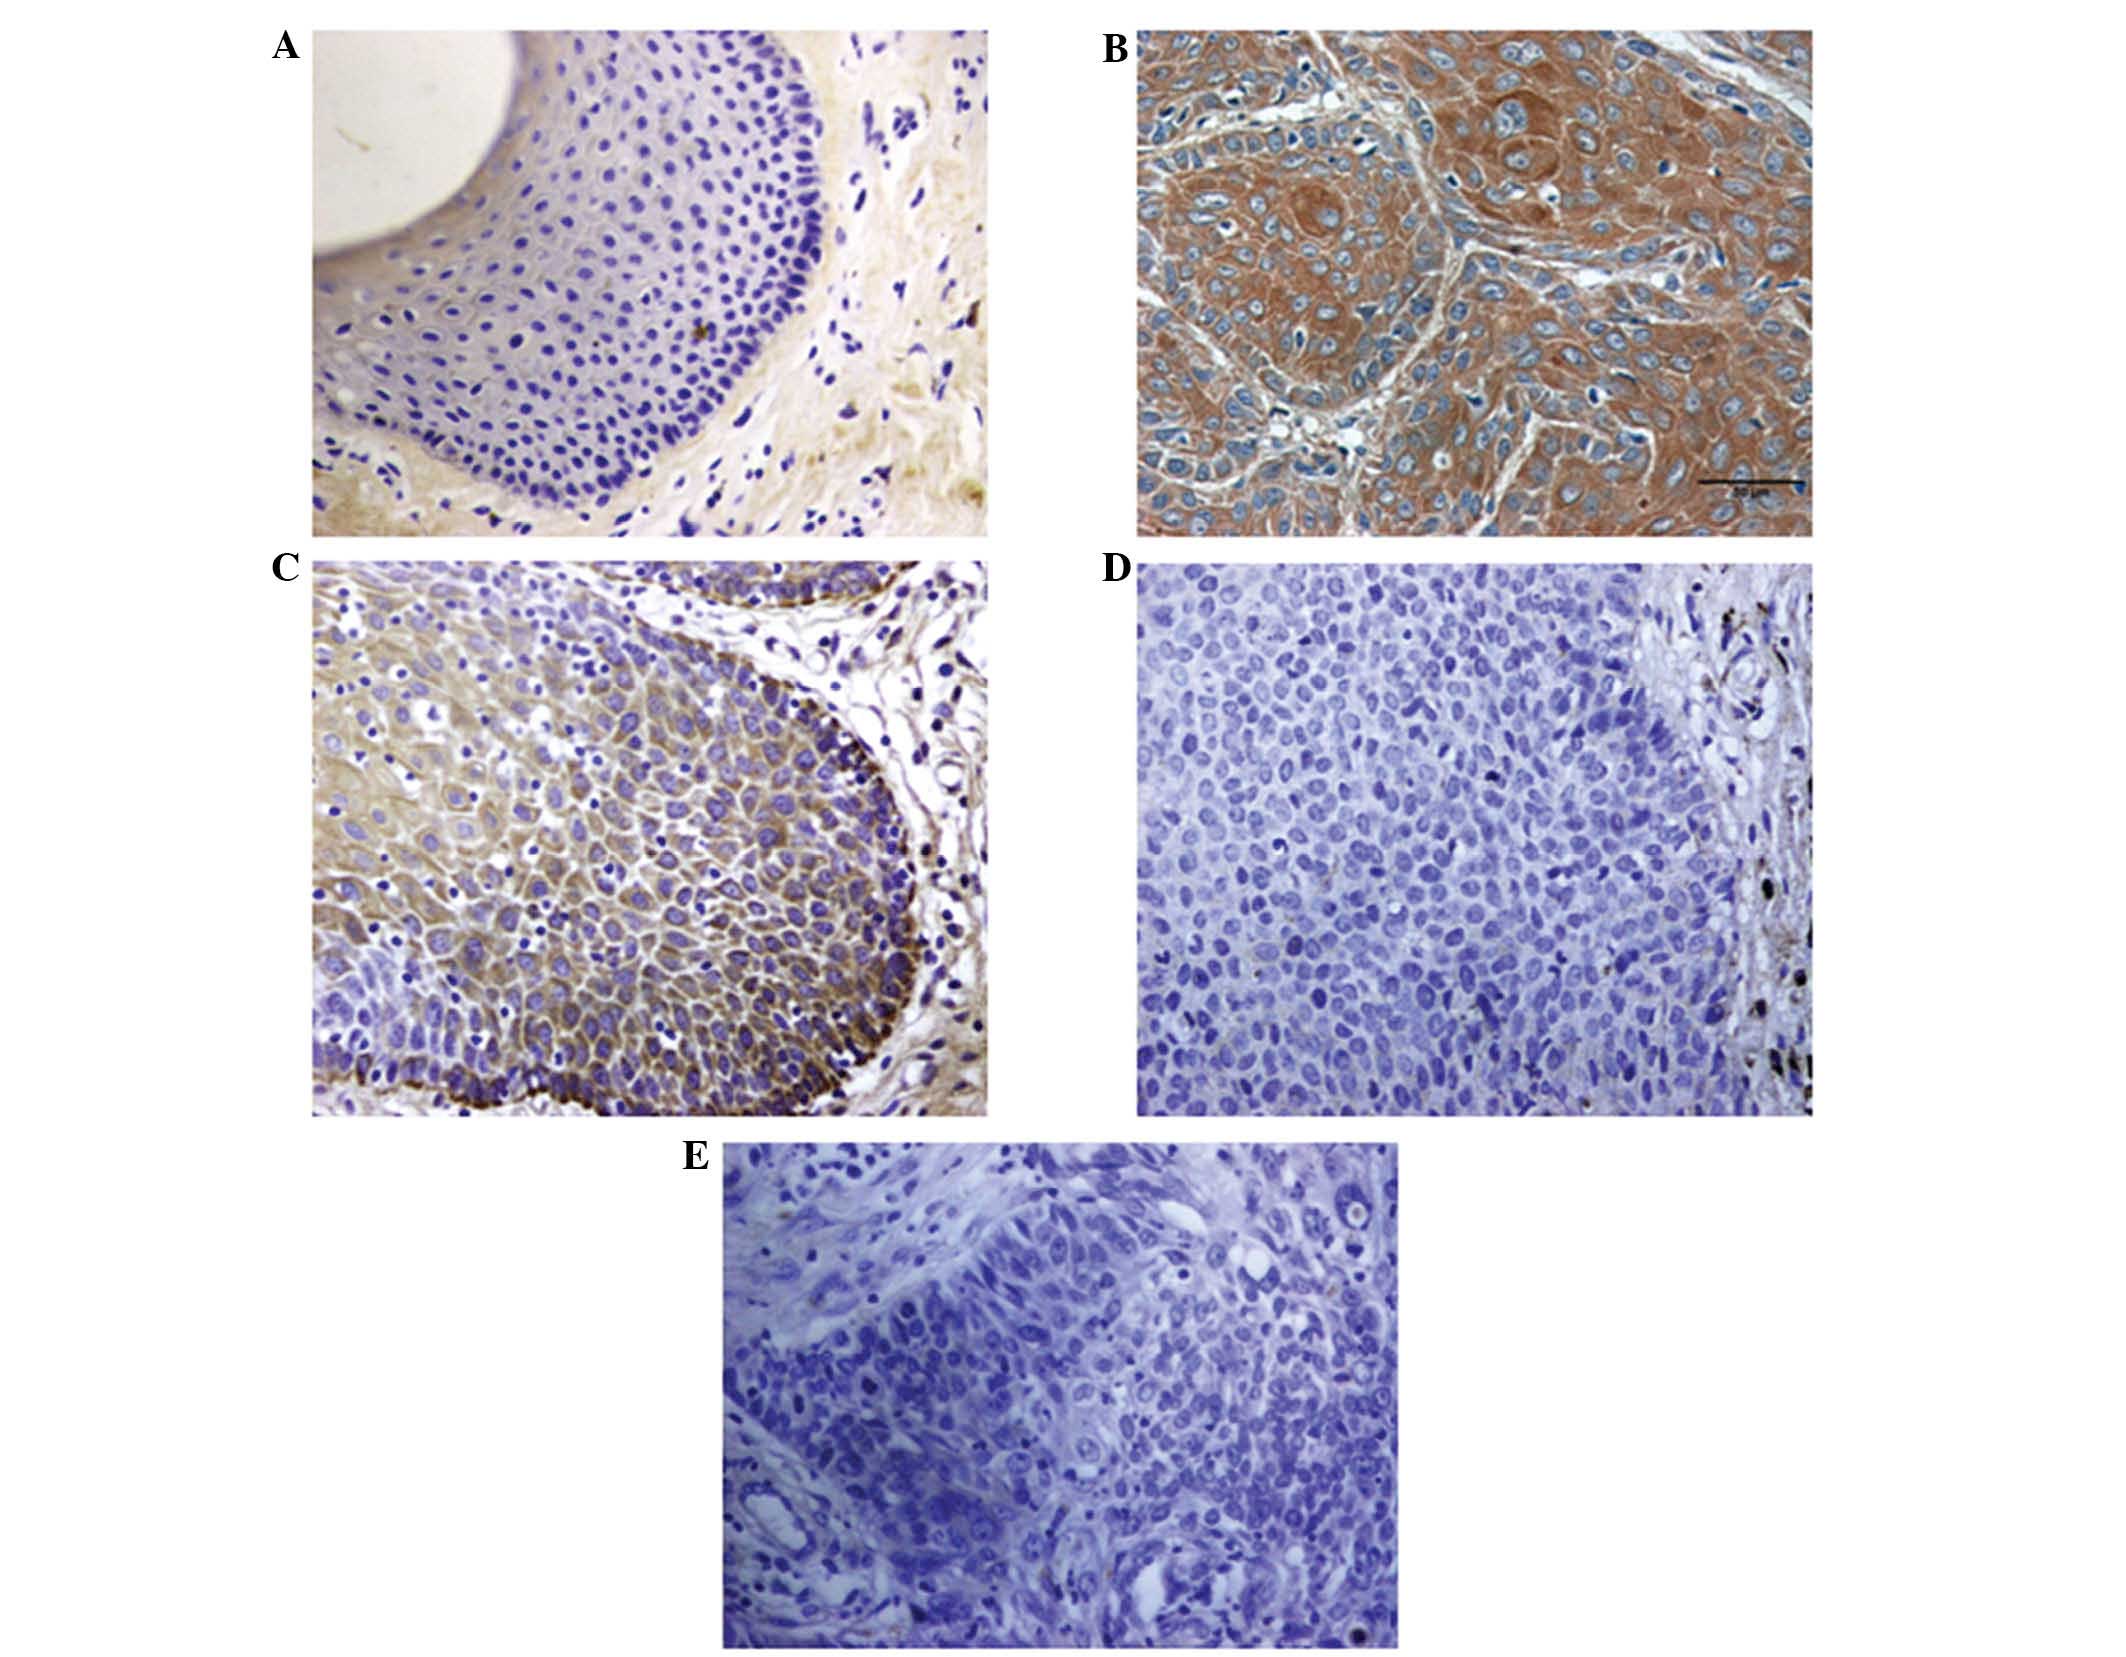
Differential expression of BMI-1 in
VSCC, VIN and normal vulvar tissues
Immunohistochemical staining demonstrated that the
expression rate of BMI-1 in VIN tissues differed significantly from
that in normal vulvar tissues (25 vs. 0%; P<0.05). In addition,
the positive expression rate of BMI-1 in VSCC tissues significantly
differed from that in VIN and normal vulvar tissues (68.0 vs. 25.0%
and 0%; both P<0.0001; Fig. 1;
Table I). BMI-1 protein
overexpression was not observed to be correlated with age,
pathological stage, lymph node metastasis or degree of
differentiation (P>0.05; Table
II).
 | Table I.Expression of BMI-1 in various types
of vulvar tissue. |
Table I.
Expression of BMI-1 in various types
of vulvar tissue.
|
|
| Expression of BMI-1,
n (%) |
|
|---|
|
|
|
|
|
|---|
| Tissue
organization | Cases, n | Positive | Negative | P-value |
|---|
| Normal | 10 | 0
(0) | 10 (100) |
<0.0001a |
| Vulvar
intraepithelial neoplasia | 40 | 10 (25) | 30 (75) |
<0.0001b |
| Vulvar squamous cell
carcinoma | 75 | 51 (68) | 24 (32) |
<0.0001c |
| Table II.Correlations between BMI-1 expression
and clinicopathological parameters. |
Table II.
Correlations between BMI-1 expression
and clinicopathological parameters.
|
|
| BMI-1, n (%) |
|---|
|
|
|
|
|---|
| Clinicopathological
parameter | Cases, n | ++/+++ | −/+ | P-value |
|---|
| Age, years |
|
|
| 0.921 |
|
<60 | 40 | 27 (67.5) | 13 (32.5) |
|
| ≥60 | 35 | 24 (68.6) | 11 (31.4) |
|
| Lymphatic
metastasis |
|
|
| 0.336 |
|
Positive | 15 | 8
(53.3) | 7
(46.7) |
|
|
Negative | 60 | 40 (66.7) | 20 (33.5) |
|
| Differentiation
degree |
|
|
| 1.000 |
|
Moderate | 25 | 18 (72.0) | 7
(28.0) |
|
| High | 50 | 36 (72.0) | 14 (28.0) |
|
| Clinical stage |
|
|
| 0.632 |
| I–II | 59 | 10 (23.3) | 33 (76.7) |
|
| III | 16 | 9
(28.2) | 23 (71.9) |
|
Effects of BMI-1 on the biological
behavior of A-431 cells
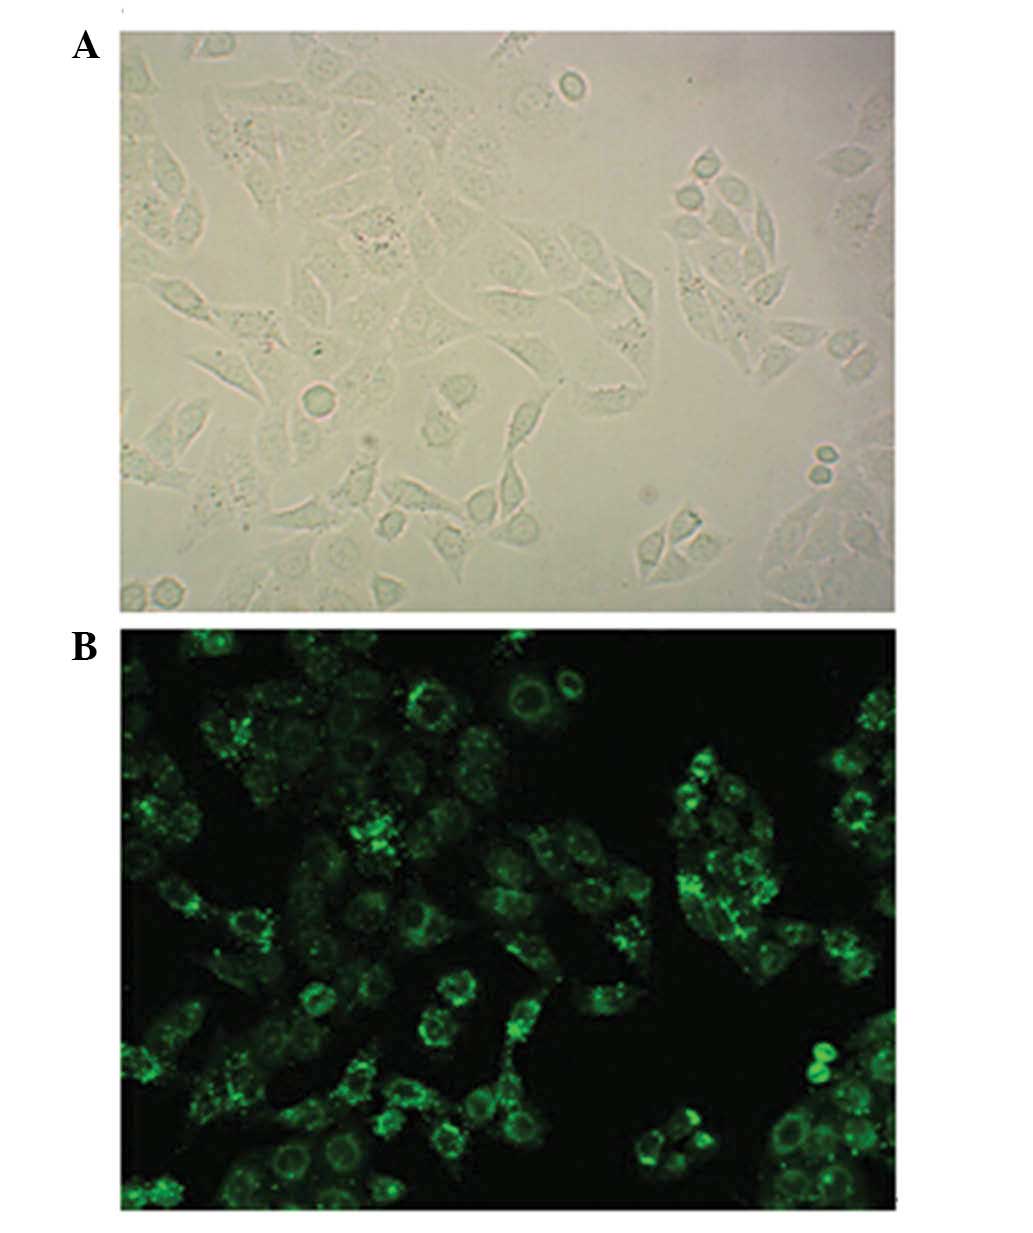
Transfection efficiency of BMI-1
siRNA-mediated BMI-1 silencing was used to examine
the effect of the BMI-1 protein on the biological behavior of A-431
cells. The highest transfection efficiency was observed at 24 h.
Cells were counted under a fluorescence microscope, which revealed
that the transfection efficiency was >80% at 24 h (data not
shown). Fig. 2 exhibits
representative images of fluorescent stained cells.
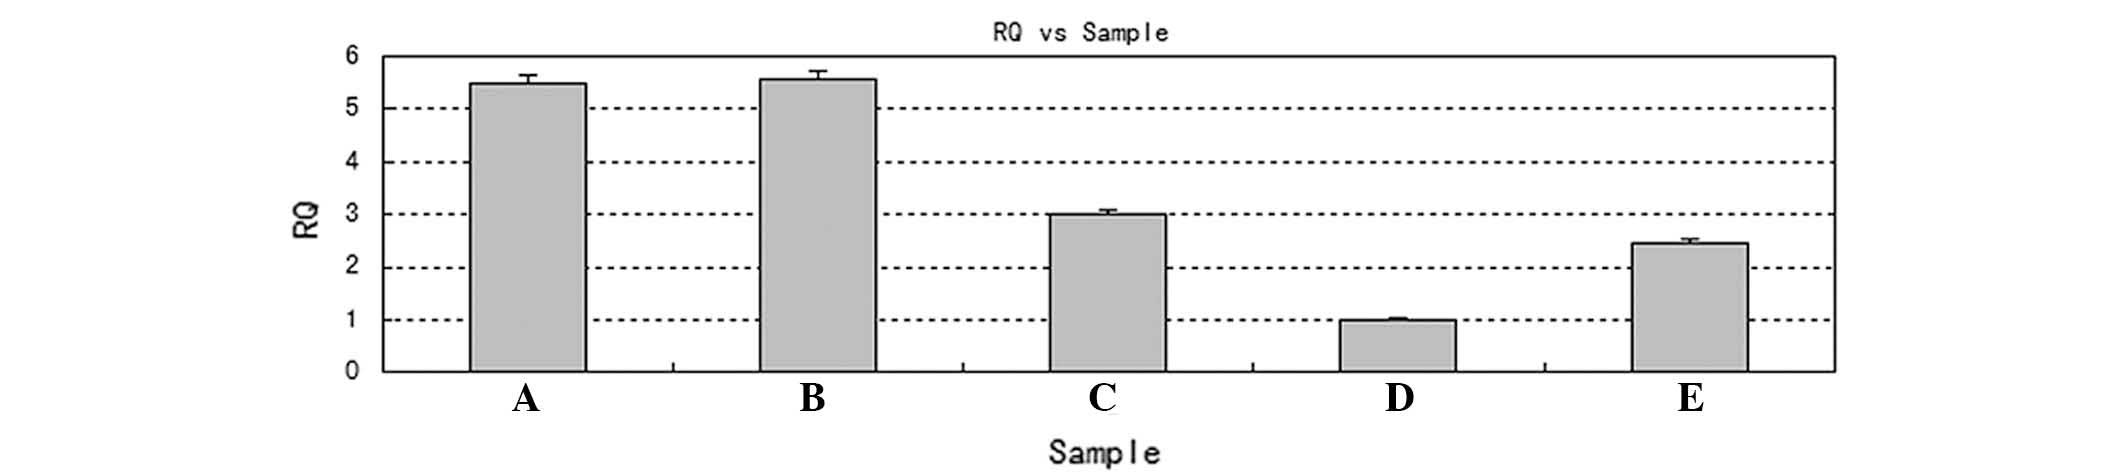
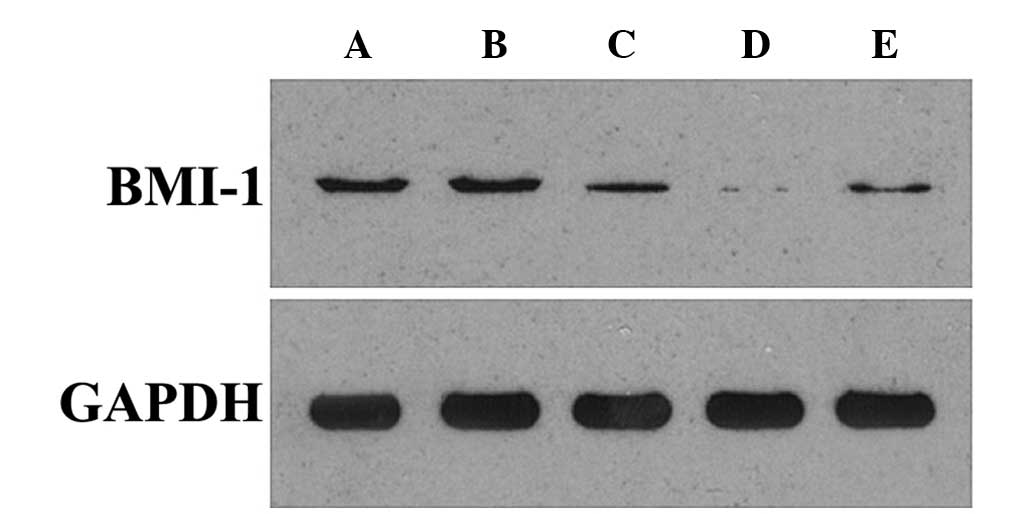
Protein and messenger RNA (mRNA) levels of BMI-1
are decreased following transfection
The mRNA and protein expression of BMI-1 was
assessed by RT-qPCR and western blotting, in order to select the
most efficient silencing construct. Tables III and IV and Fig. 3
and 4 reveal that, compared with the
blank and control siRNA groups, the experimental BMI-1 siRNAs
effectively inhibited BMI-1 expression at the mRNA and protein
levels in A-431 cells. This was particularly evident in the siRNA-2
group (siRNA-1 group vs. siRNA-2 group, P<0.0001; siRNA-3 group
vs. siRNA-2 group, P<0.0001; t-test method). Therefore, siRNA-2
was selected for use in all subsequent experiments.
| Table III.Relative expression levels of BMI-l
mRNA 24 h following transfection. |
Table III.
Relative expression levels of BMI-l
mRNA 24 h following transfection.
| Group | Relative levels of
BMI-1 mRNA | P-valuea |
|---|
| A-431 cell | 5.48±0.15 |
|
| Negative | 5.56±0.15 |
|
| siRNA-1 | 3.01±0.16 | <0.0001 |
| siRNA-2 | 0.10±0.13 | <0.0001 |
| siRNA-3 | 2.45±0.14 | <0.0001 |
| Table IV.Relative protein expression levels of
BMI-l and GAPDH 24 h following transfection. |
Table IV.
Relative protein expression levels of
BMI-l and GAPDH 24 h following transfection.
| Group | BMI-1 | GAPDH | P-valuea |
|---|
| A-431 cell | 68.71±3.05 | 267.91±2.49 |
|
| Negative | 70.72±4.27 | 267.66±4.35 |
|
| siRNA-1 | 40.92±4.31 | 263.77±3.20 | <0.0001 |
| siRNA-2 |
6.26±1.24 | 268.36±5.35 | <0.0001 |
| siRNA-3 | 29.76±2.08 | 264.88±3.04 | <0.0001 |
BMI-1 silencing reduces proliferation and
invasion, and enhances apoptosis in A-431 cells
MTT and Annexin V-FITC assays were used to evaluate
the proliferation and apoptosis of A-431 cells. The results of the
present study revealed that 24 h following transfection, the cell
survival rate of the siRNA-2 group was 53.17±1.53%, which was
significantly reduced compared with that of the blank (98.77±0.98%)
and control siRNA groups (98.79±1.74%; Table V). The apoptotic rate of the siRNA-2
group was 20.19±0.04%, which was significantly increased compared
with the apoptotic rates of the blank (5.75±0.08%) and control
siRNA groups (5.63±0.11%; Fig. 5;
Table VI). In invasion experiments,
the number of penetrating cells in the siRNA-2 group was
21.67±2.42, which was significantly reduced compared with the
number of penetrating cells in the blank (33.17±2.92) and control
siRNA groups (33.50±3.02) (Fig. 6;
Table VII).
| Table V.Survival rates of A-431 cells 24 h
following siRNA transfection. |
Table V.
Survival rates of A-431 cells 24 h
following siRNA transfection.
| Group | Survival rates,
% |
|---|
| A-431 | 98.77±0.98 |
| Negative
control | 98.79±1.74 |
| siRNA
transfected |
53.17±1.53a |
| Table VI.Apoptotic rates of A-431 cells 24 h
following siRNA transfection. |
Table VI.
Apoptotic rates of A-431 cells 24 h
following siRNA transfection.
| Group | Apoptotic rates,
% |
|---|
| A-431 | 5.75±0.08 |
| Negative
control |
5.63±0.11 |
| siRNA
transfecteda | 20.19±0.04 |
| Table VII.Invasive potential of A-431 cells 24
h following siRNA transfection. |
Table VII.
Invasive potential of A-431 cells 24
h following siRNA transfection.
| Group | Number of
penetrating cells |
|---|
| A-431 | 33.17±2.92 |
| Negative
control | 33.50±3.02 |
| siRNA
transfecteda | 21.67±2.42 |
Discussion
The occurrence and development of VSCC is a
multi-step process involving numerous factors. The BMI-1 gene is
involved in cell proliferation and apoptosis as an oncogene
(5). The results of the present study
demonstrate that BMI-1 is overexpressed in VSCC and VIN, which is
consistent with the results of previous studies of BMI-1
overexpression in cervical (7),
nasopharyngeal (8) and lung cancer
(10). A previous study revealed that
BMI-1 is expressed in the nucleus, since high BMI-1 expression
levels is able to inhibit Ink4a/Arf expression by increasing
H2AubiK119 and H3metK27 histone levels via the PCG pathway
(15). However, in the present study,
BMI-1 was detected mainly in the cytoplasm, suggesting that the
target of BMI-1 in VSCC may not be Ink4a/Arf. Further research may
be required to elucidate the underlying mechanisms.
The correlation between the BMI-1 expression in
tumors, and clinicopathological data, has been investigated in
several previous studies. Tong et al (7) demonstrated that overexpression of BMI-1
in cervical cancer was correlated with tumor progression, lymph
node metastasis, vascular invasion and HPV infection, suggesting
that subtypes of cervical cancer which overexpress BMI-1 may
possess a high metastatic potential. Choi et al (16) observed that patients with breast
cancer associated with BMI-1 overexpression possessed favorable
overall survival rates, particularly amongst patients with estrogen
receptor-positive breast cancer. However, in hepatocellular
carcinoma, Wang et al (17)
reported that overexpression of BMI-1 was not associated with
clinicopathological parameters. The results of the aforementioned
studies suggest that BMI-1 possesses varying roles in different
types of cancer. The results of the present study demonstrated that
the overexpression of BMI-1 in VSCC was not correlated with age,
pathological stage, lymph node metastasis or degree of
differentiation, which was in accordance with the findings of Wang
et al (17) and suggests that
BMI-1 may be a candidate biomarker for VSCC.
To investigate the effect of BMI-1 on VSCC cell
growth and malignant phenotypes, the RNAi method was used in the
present study to silence BMI-1 expression in A-431 cells. It was
demonstrated that the silencing of BMI-1 may significantly inhibit
A-431 cell proliferation through the promotion of apoptosis.
Numerous studies have revealed that BMI-1 has a role in tumor
development, invasion and metastasis (11–14,18).
Destruction of the extracellular matrix and migration into the
vascular system are key steps required for tumor metastasis
(19). In the present study, it was
demonstrated that silencing of BMI-1 expression efficiently
decreased the number of invading cells, indicating that BMI-1 may
be important in the determination of the invasive ability of VSCC
cells.
In conclusion, BMI-1 expression is altered in VIN
and VSCC and this may be significant for proliferation, apoptosis
and invasion. siRNA targeting of BMI-1 successfully silenced BMI-1
expression in A-431 cells, and silencing BMI-1 significantly
promoted apoptosis and inhibited the invasive and metastatic
abilities of A-431 cells in vitro. The results of the
present study suggest that BMI-1 may be a candidate biomarker for
VSCC and may provide an experimental target for VSCC gene
therapy.
Acknowledgements
Funding was received from the first batch of Science
and Technology Plan of Liaoning Province (Science and Technology
Fund of Liaoning Province; grant no. 2012225016).
References
|
1
|
Canavan TP and Cohen D: Vulvar cancer. Am
Fam Physician. 66:1269–1274. 2002.PubMed/NCBI
|
|
2
|
Schottenfeld D and Fraumeni J: Cancer
epidemiology and prevention (3rd). 2006. View Article : Google Scholar
|
|
3
|
Dittmer C, Katalinic A, Mundhenke C, Thill
M and Fischer D: Epidemiology of vulvar and vaginal cancer in
Germany. Arch Gynecol Obstet. 284:169–174. 2011. View Article : Google Scholar : PubMed/NCBI
|
|
4
|
Judson PL, Habermann EB, Baxter NN, Durham
SB and Virnig BA: Trends in the incidence of invasive and in situ
vulvar carcinoma. Obstet Gynecol. 107:1018–1022. 2006. View Article : Google Scholar : PubMed/NCBI
|
|
5
|
van Lohuizen MI, Verbeek S, Scheijen B, et
al: Identification of cooperating oncogenes in E mu-myc transgenic
mice by provirus tagging. Cell. 65:737–752. 1991. View Article : Google Scholar : PubMed/NCBI
|
|
6
|
Silva J, García JM, Peña C, García V,
Domínguez G, Suárez D, Camacho FI, Espinosa R, Provencio M, España
P and Bonilla F: Implication of polycomb members Bmi-1, Mel-18, and
Hpc-2 in the regulation of p16INK4a, p14ARF, h-TERT, and c-Myc
expression in primary breast carcinomas. Clin Cancer Res.
12:6929–6936. 2006. View Article : Google Scholar : PubMed/NCBI
|
|
7
|
Tong YQ, Liu B, Zheng HY, He YJ, Gu J, Li
F and Li Y: Overexpression of BMI-1 is associated with poor
prognosis in cervical cancer. Asia Pac J Clin Oncol. 8:e55–e62.
2012. View Article : Google Scholar : PubMed/NCBI
|
|
8
|
Yang GF, He WP, Cai MY, He LR, Luo JH,
Deng HX, Guan XY, Zeng MS, Zeng YX and Xie D: Intensive expression
of Bmi-1 is a new independent predictor of poor outcome in patients
with ovarian carcinoma. BMC Cancer. 10:1332010. View Article : Google Scholar : PubMed/NCBI
|
|
9
|
Dong P, Kaneuchi M, Watari H, Hamada J,
Sudo S, Ju J and Sakuragi N: MicroRNA-194 inhibits epithelial to
mesenchymal transition of endometrial cancer cells by targeting
oncogene BMI-1. Mol Cancer. 10:992011. View Article : Google Scholar : PubMed/NCBI
|
|
10
|
Hu J, Liu YL, Piao SL, Yang DD, Yang YM
and Cai L: Expression patterns of USP22 and potential targets
BMI-1, PTEN, p-AKT in non-small-cell lung cancer. Lung Cancer.
77:593–599. 2012. View Article : Google Scholar : PubMed/NCBI
|
|
11
|
Yang Hong, Chao Shang, Yi-Xue Xue and
Yun-Hui Liu: Silencing of Bmi-1 Gene Enhances Chemotherapy
Sensitivity in Human Glioblastoma Cells. Med Sci Monit.
21:1002–1007. 2015. View Article : Google Scholar : PubMed/NCBI
|
|
12
|
Jagani Z, Wiederschain D and Loo A: The
Polycomb group protein Bmi-1 is essential for the growth of
multiple myeloma cells. Cancer Res. 70:5528–5538. 2010. View Article : Google Scholar : PubMed/NCBI
|
|
13
|
Wei X, He J, Wang J, Yang X and Ma B:
Bmi-1 is essential for the oncogenic potential in CD133+ human
laryngeal cancer cells. Tumour Bio. Jun 17–2015. View Article : Google Scholar
|
|
14
|
Cheng Y, Yang X, Deng X, Zhang X, Li P,
Tao J and Lu Q: MicroRNA-218 inhibits bladder cancer cell
proliferation, migration, and invasion by targeting BMI-1. Tumour
Biol. May 14–2015. View Article : Google Scholar
|
|
15
|
Shilatifard A: Chromatin modifications by
methylation and ubiquitination: Implications in the regulation of
gene expression. Annu Rev Biochem. 75:243–269. 2006. View Article : Google Scholar : PubMed/NCBI
|
|
16
|
Choi YJ, Choi YL, Cho EY, Shin YK, Sung
KW, Hwang YK, Lee SJ, Kong G, Lee JE, Kim JS, et al: Expression of
Bmi-1 protein in tumor tissues is associated with favorable
prognosis in breast cancer patients. Breast Cancer Res Treat.
113:83–93. 2009. View Article : Google Scholar : PubMed/NCBI
|
|
17
|
Wang H, Pan K, Zhang HK, Weng DS, Zhou J,
Li JJ, Huang W, Song HF, Chen MS and Xia JC: Increased
polycomb-group oncogene Bmi-1 expression correlates with poor
prognosis in hepatocellular carcinoma. J Cancer Res Clin Oncol.
134:535–541. 2008. View Article : Google Scholar : PubMed/NCBI
|
|
18
|
Wu J, Hu D, Yang G, Zhou J, Yang C, Gao Y
and Zhu Z: Down-regulation of BMI-1 cooperates with artemisinin on
growth inhibition of nasopharyngeal carcinoma cells. J Cell
Biochem. 112:1938–1948. 2011. View Article : Google Scholar : PubMed/NCBI
|
|
19
|
Hanahan D and Weinberg RA: Hallmarks of
cancer: The next generation. Cell. 144:646–174. 2011. View Article : Google Scholar : PubMed/NCBI
|