Introduction
Gastric cancer (GC) is one of the leading causes of
cancer-related mortality worldwide, and is particularly prevalent
in East Asian countries, including China, Japan and Korea (1). Each year, ~990,000 people are diagnosed
with GC worldwide; ~738,000 of whom succumb to the disease
(2). The high patient mortality rate
is due to the fact that the clinical manifestations of GC usually
only become apparent at an advanced disease stage, when the current
available therapies will have a limited effect (3,4).
Therefore, it is of utmost importance to understand the associated
mechanisms and to identify biomarkers for the development of
strategies for the screening, early detection and treatment of
GC.
GC is a complicated and multifactorial disease, and
environmental and genetic factors play important roles in its
etiology (5). One of the
characteristics of gastric malignant cells is metastasis, whereby
cancer cells penetrate vascular channels and invade parenchymal
tissue to form satellite tumors in distant organs (6). In this process, the extracellular matrix
(ECM) and the basement membrane provide a protective barrier to
prevent cancer cell invasion and metastasis (7). Similar to other malignancies, gene
expression profiling using complementary DNA microarrays has been
used to identify genes involved in gastric carcinogenesis, and to
identify novel diagnostic and prognostic markers for GC (8–11). Recent
studies have reported genetic alterations in GC, involving tumor
suppressor genes, cell adhesion molecules, oncogenes and growth
factors, such as p53, trefoil factor 1 and E-cadherin (10,12–15).
However, these studies have yielded few useful biomarkers, most
likely due to shortcomings concerning the experimental design, the
validity of the supporting statistical analysis and the gene
selection in the studies. Thus, the present study focused on the
gene expression profiling of GC to identify novel biomarkers in
this disease.
With the same gene expression profile, Wang et
al performed gene set enrichment analysis and identified that
increased INHBA expression was associated with poor survival in GC
(16). A study by Liu et al
demonstrated that the ECM-receptor and cell cycle pathways may play
important roles in GC (17). In
addition, a study using the same microarray data revealed high
periostin expression in GC tissues, which was associated with gene
groups that regulated the cell proliferation and cell cycle
(18). The present study analyzed the
differentially-expressed genes (DEGs) in GC using gene expression
profiling. Comprehensive bioinformatics was used to analyze the
significant pathways and functions, and to construct the gene
co-expression network and sub-network to investigate the critical
DEGs of GC. The study aimed to obtain a better understanding of the
molecular circuitry in GC and to identify genes potentially useful
as novel diagnostic or therapeutic markers for GC.
Materials and methods
Affymetrix microarray data
The gene expression profile of GSE19826 (16) was downloaded from the Gene Expression
Omnibus database (19), which freely
distributes high-throughput molecular abundance data, largely gene
expression data generated by microarray technology. The platform
information is as follows: GPL570 [HG-U133_Plus_2] Affymetrix Human
Genome U133 Plus 2.0 Array (Affymetrix Inc., Santa Clara, CA, USA).
In this dataset, 12 cancerous portions of gastric specimens (from
Chinese patients) and 15 normal gastric tissues (controls) were
included.
Data preprocessing and screening of
DEGs
The preprocessed microarray data were obtained and
then log2 transformation was performed on these data. The most
popular method, the Linear Models for Microarray data (limma)
package (20) in R language (21), was used to analyze the chip data.
Upregulated and downregulated genes were identified between GC and
normal controls. The false discovery rate (FDR) (22) was utilized for multiple testing
correction using the Benjamini and Hochberg method (23). The threshold for the DEGs was set as
|log2 fold change (FC)|>1.5 and FDR <0.05.
Hierarchical clustering
Hierarchical clustering methodology is a powerful
data mining approach that has been extensively applied to identify
groups of similarly expressed genes or conditions from gene
expression data. In order to reveal sets of samples in which the
closest groups were adjacent, two-way hierarchical clustering
analysis (24) was performed on genes
and conditions using Euclidean distance (25) by the ‘pheatmap’ package (http://cran.r-project.org/web/packages/pheatmap/index.html)
in R language. The result was represented by a heatmap.
Co-expression network construction of
DEGs
From the perspective of systems biology,
functionally-related genes are frequently co-expressed across a set
of samples (26). COXPRESdb
(http://coxpresdb.jp) provides co-expression
associations for multiple species of mammals, as comparisons of
co-expressed gene lists can increase the reliability of gene
co-expression determinations (27).
The gene co-expression network was constructed to assess the
functional associations between co-expressed genes of DEGs using
COXPRESdb, in which genes were indexed by their Entrez Gene IDs. To
obtain the co-expression associations, a Pearson Correlation
Coefficient >0.6 was chosen as the threshold.
Selection of modules in co-expression
network
Gene products in the same module often have the same
or similar functions, and they work together to perform one
bio-function (28). Therefore, the
network was visualized using Cytoscape (29) and module division was made by using
the plugin ClusterOne (30) in
Cytoscape (parameters: Minimum size, 3; overlap threshold, 0.8),
then module function was annotated using another plugin-Bingo
(31) and the significant function of
each module was achieved.
Function and pathway enrichment
analysis of DEGs in modules
Gene Ontology and Kyoto Encyclopedia of Genes and
Genomes enrichment analyses were performed for the DEGs in the
co-expression network using the online tool, DAVID (32). P<0.05 was used to indicate
statistical significance.
Results
DEG screening
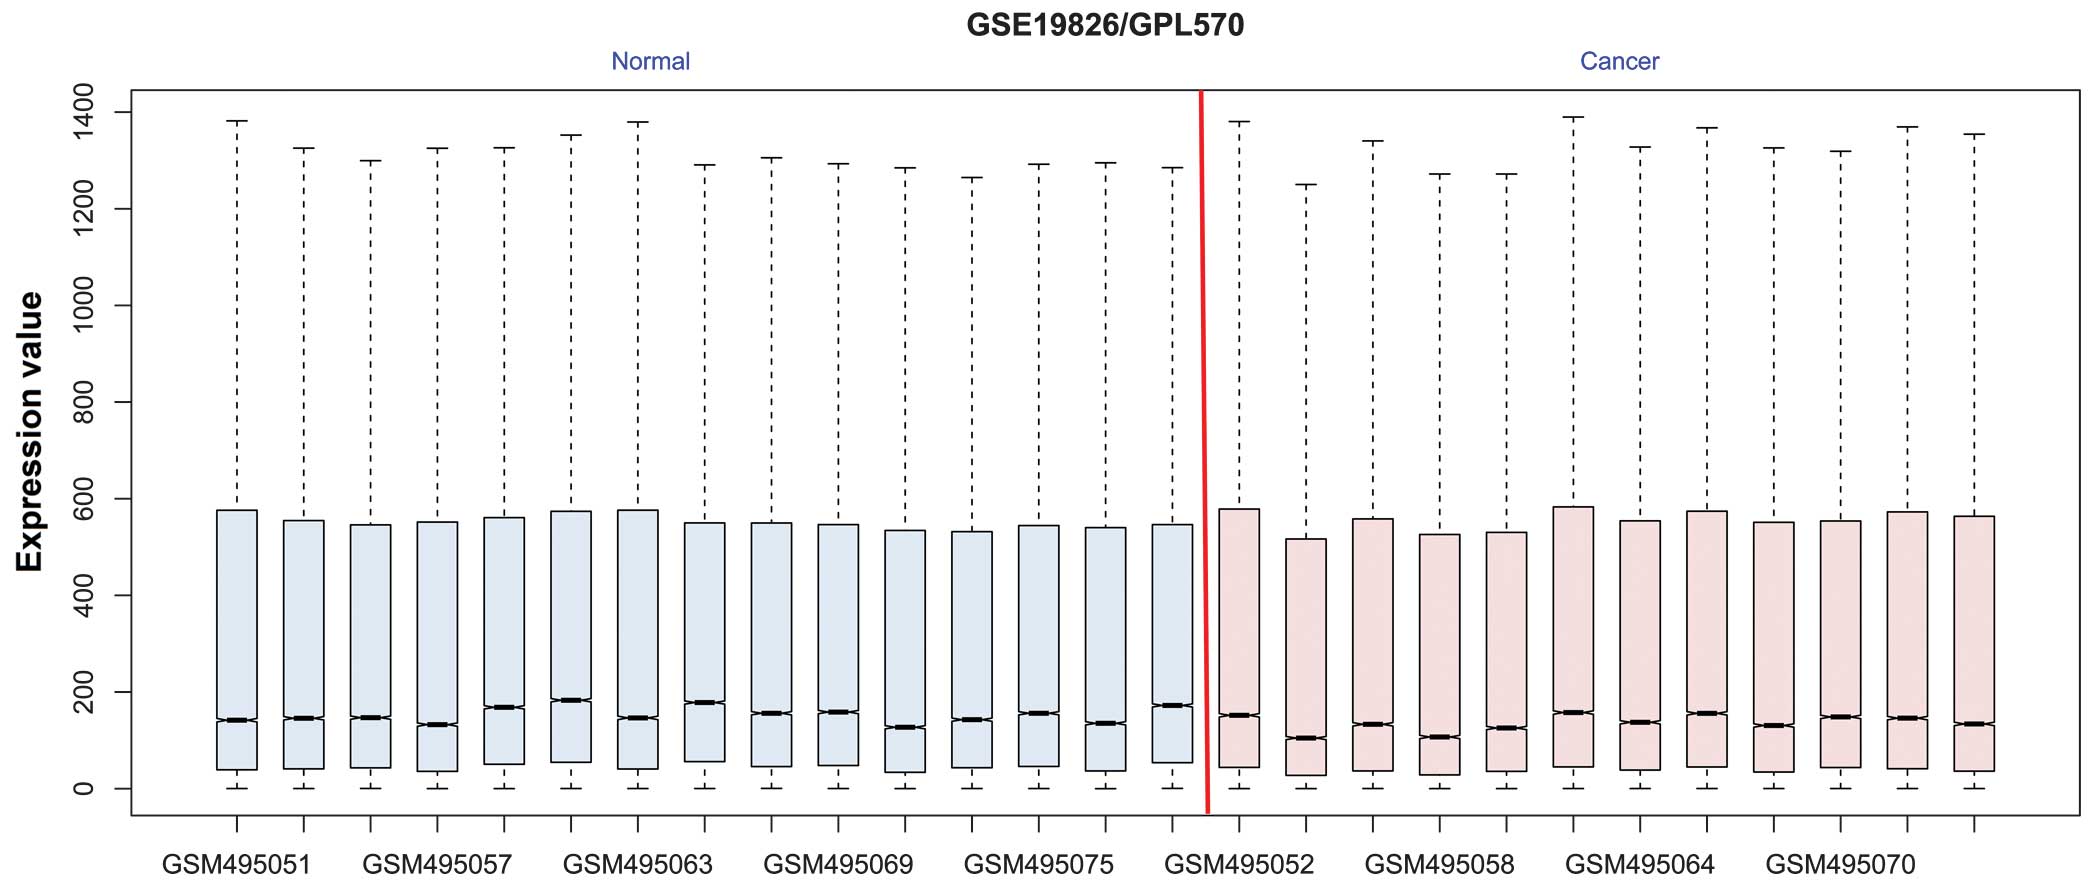
Following data preprocessing, 42,450 genes were
mapped to the probes; the gene expression profile after
normalization is shown in Fig. 1. The
black lines in each of the boxes, representing the medians of each
dataset, are almost in a straight line, indicating a good degree of
standardization. Compared with the normal tissues, a total of 596
genes were differentially expressed, consisting of 182 upregulated
and 414 downregulated genes.
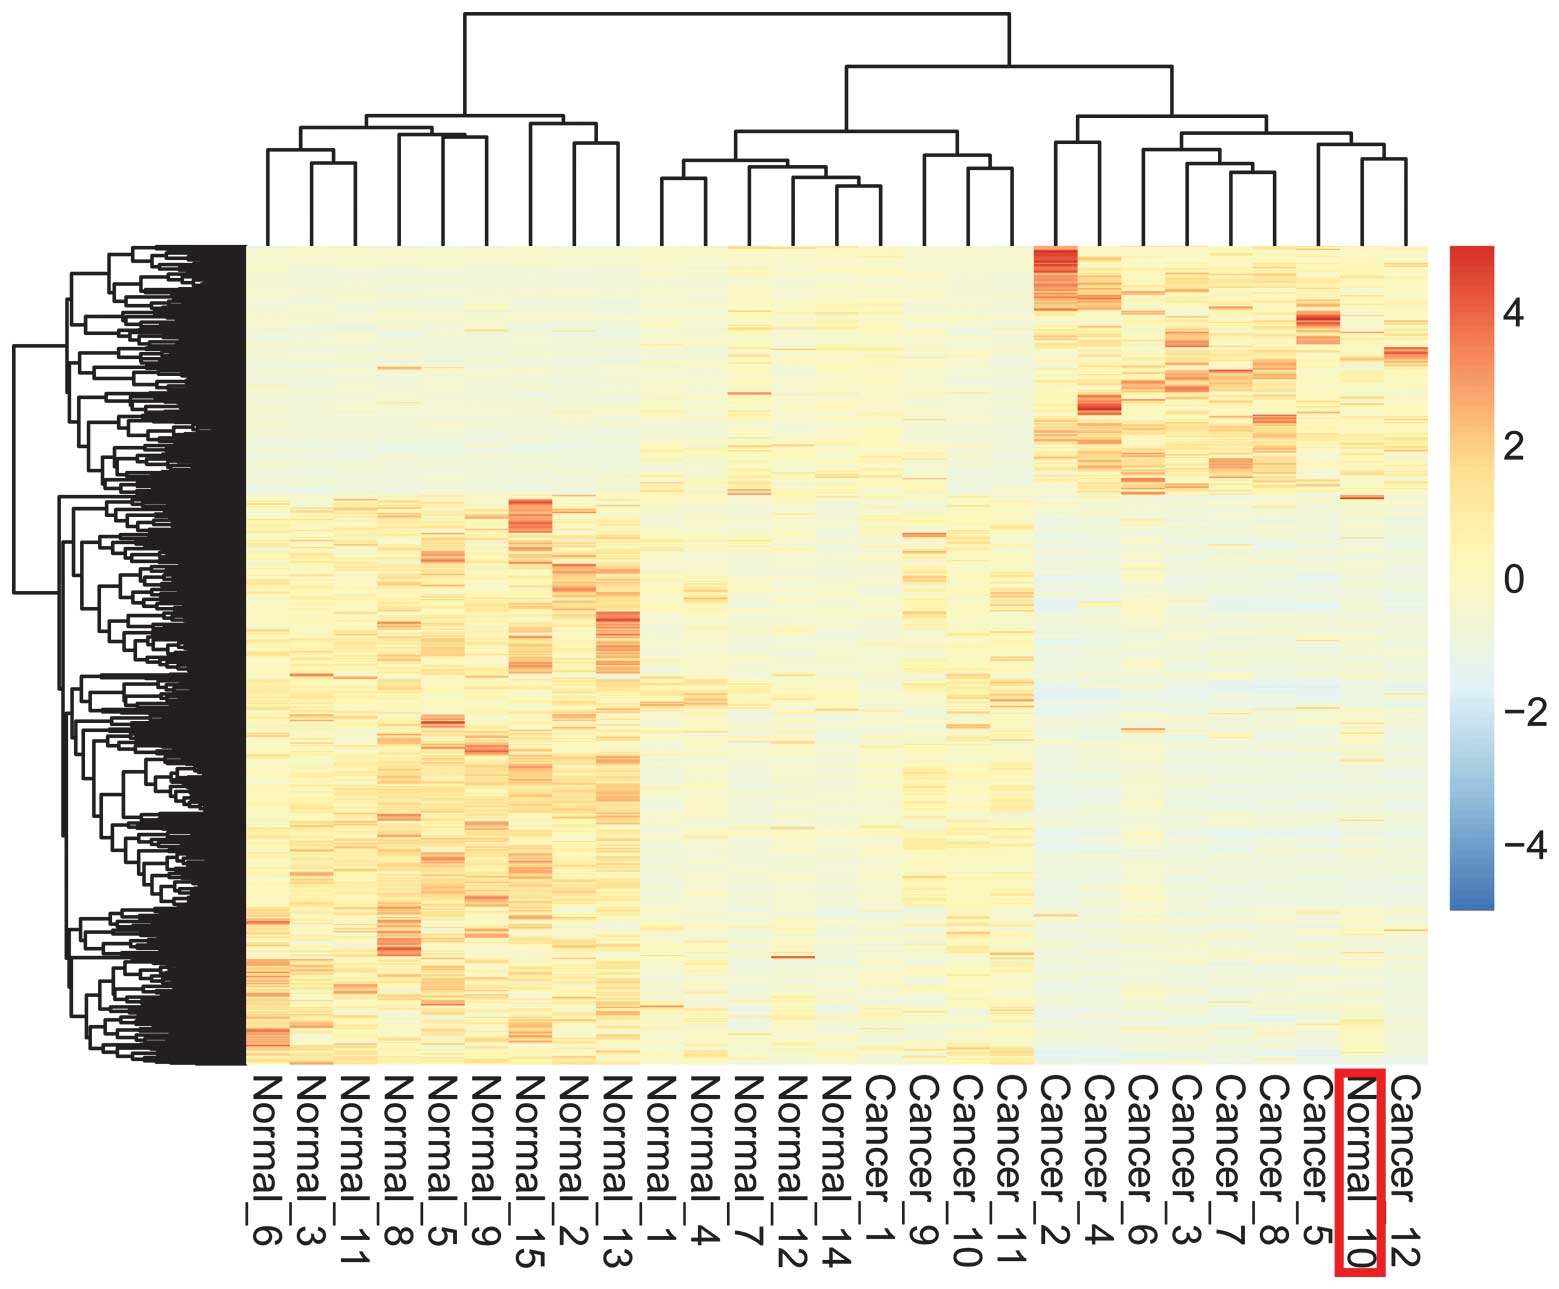
Hierarchical clustering
The hierarchical clustering algorithm was used to
group the genes and samples on the basis of similarities of gene
expression. In the results shown in Fig.
2, one normal sample was grouped into the region of GC samples,
suggesting that 93.33% of samples were classified correctly. Thus,
the DEGs screened had significant expression patterns that could
distinguish the disease samples from the normal controls.
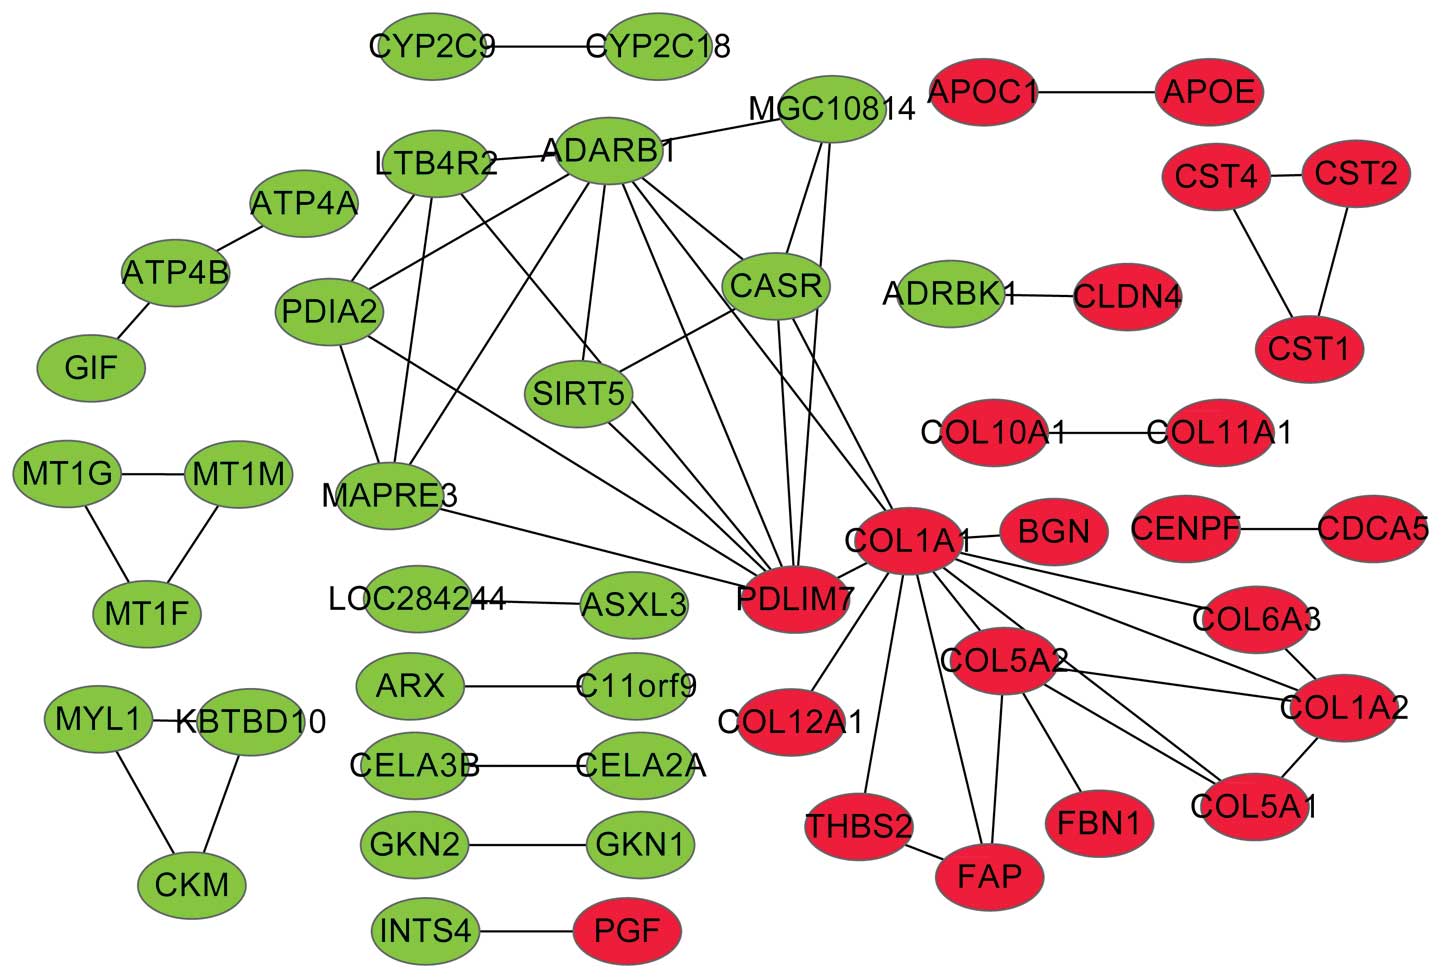
Co-expression network construction and
module selection
A total of 57 co-expressed gene pairs were
determined between DEGs. In Fig. 3,
the upregulated and downregulated genes tended to connect up,
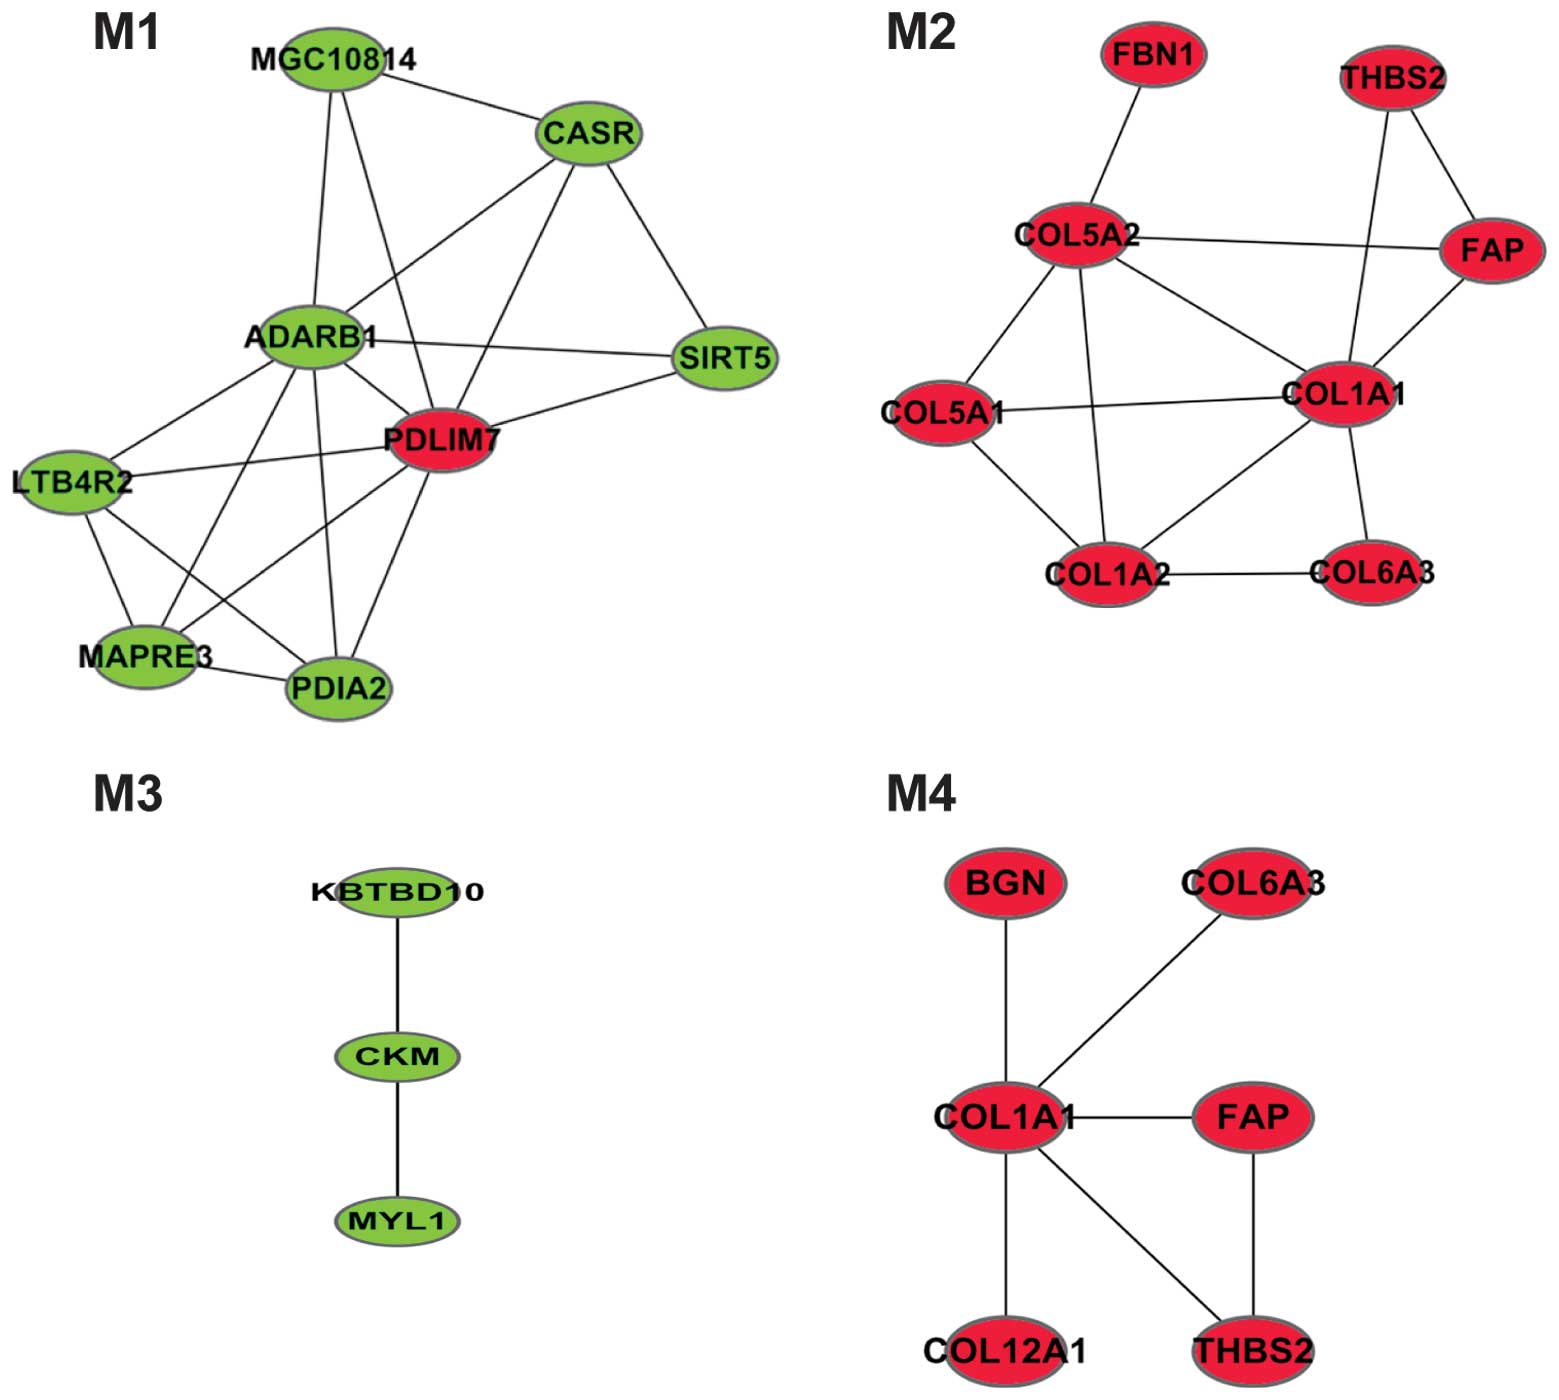
respectively. The study identified 4 modules from the network
(Fig. 4). The function of the DEGs in
each module is presented in Table I.
Module 1 had one upregulated gene, PDZ and LIM domain 7 (PDLIM7).
Genes in modules 2 and 4, which mostly belonged to the collagen
(COL) family, were significantly associated with phosphate
transport.
 | Table I.Functions of the genes in the
modules. |
Table I.
Functions of the genes in the
modules.
| GO-ID | corr P-value | N | Description | Genes in test
set |
|---|
| Module 1 |
|
|
|
|
|
31214 |
4.30×10⁻² | 2 | Biomineral
formation | CASR, PDLIM7 |
|
1503 |
4.30×10⁻² | 2 | Ossification | CASR, PDLIM7 |
| Module 2 |
|
|
|
|
|
6817 |
8.57×10⁻⁸ | 5 | Phosphate
transport | COL6A3, COL1A2,
COL1A1, COL5A2, COL5A1 |
|
15698 |
7.47×10⁻⁷ | 5 | Inorganic anion
transport | COL6A3, COL1A2,
COL1A1, COL5A2, COL5A1 |
|
6820 |
1.25×10⁻⁶ | 5 | Anion
transport | COL6A3, COL1A2,
COL1A1, COL5A2, COL5A1 |
|
6811 |
8.30×10⁻⁴ | 5 | Ion transport | COL6A3, COL1A2,
COL1A1, COL5A2, COL5A1 |
|
6810 |
3.10×10⁻² | 5 | Transport | COL6A3, COL1A2,
COL1A1, COL5A2, COL5A1 |
|
48513 |
1.76×10⁻⁴ | 6 | Organ
development | FAP, COL6A3, FBN1,
COL1A2, COL1A1, COL5A2 |
|
48731 |
9.03×10⁻⁴ | 6 | System
development | FAP, COL6A3, FBN1,
COL1A2, COL1A1, COL5A2 |
|
48856 |
1.64×10⁻³ | 6 | Anatomical
structure development | FAP, COL6A3, FBN1,
COL1A2, COL1A1, COL5A2 |
|
7275 |
4.45×10⁻³ | 6 | Multicellular
organismal development | FAP, COL6A3, FBN1,
COL1A2, COL1A1, COL5A2 |
|
51234 |
1.03×10⁻² | 6 | Establishment of
localization | FAP, COL6A3,
COL1A2, COL1A1, COL5A2, COL5A1 |
|
32502 |
1.29×10⁻² | 6 | Developmental
process | FAP, COL6A3, FBN1,
COL1A2, COL1A1, COL5A2 |
|
51179 |
1.62×10⁻² | 6 | Localization | FAP, COL6A3,
COL1A2, COL1A1, COL5A2, COL5A1 |
|
32501 |
2.24×10⁻² | 6 | Multicellular
organismal process | FAP, COL6A3, FBN1,
COL1A2, COL1A1, COL5A2 |
| Module 3 |
|
|
|
|
|
6936 |
2.46×10⁻³ | 2 | Muscle
contraction | MYL1, KBTBD10 |
|
3012 |
2.46×10⁻³ | 2 | Muscle system
process | MYL1, KBTBD10 |
| Module 4 |
|
|
|
|
|
6817 |
7.88×10⁻⁴ | 3 | Phosphate
transport | COL6A3, COL12A1,
COL1A1 |
|
15698 |
2.15×10⁻³ | 3 | Inorganic anion
transport | COL6A3, COL12A1,
COL1A1 |
|
6820 |
2.47×10⁻³ | 3 | Anion
transport | COL6A3, COL12A1,
COL1A1 |
|
22610 |
2.64×10⁻² | 3 | Biological
adhesion | COL6A3, COL12A1,
THBS2 |
|
7155 |
2.64×10⁻² | 3 | Cell adhesion | COL6A3, COL12A1,
THBS2 |
|
6811 |
3.28×10⁻² | 3 | Ion transport | COL6A3, COL12A1,
COL1A1 |
|
48513 |
1.16×10⁻² | 4 | Organ
development | FAP, COL6A3,
COL12A1, COL1A1 |
|
48731 |
2.64×10⁻² | 4 | System
development | FAP, COL6A3,
COL12A1, COL1A1 |
|
48856 |
3.20×10⁻² | 4 | Anatomical
structure development | FAP, COL6A3,
COL12A1, COL1A1 |
|
7275 |
3.46×10⁻² | 4 | Multicellular
organismal development | FAP, COL6A3,
COL12A1, COL1A1 |
|
51234 |
4.04×10⁻² | 4 | Establishment of
localization | FAP, COL6A3,
COL12A1, COL1A1 |
|
32502 |
4.11×10⁻² | 4 | Developmental
process | FAP, COL6A3,
COL12A1, COL1A1 |
|
51179 |
4.52×10⁻² | 4 | Localization | FAP, COL6A3,
COL12A1, COL1A1 |
Pathway annotation of the DEGs in
modules
Two pathways were found to be enriched (Table II), the ECM-receptor interaction and
focal adhesion pathways. Of these, the ECM-receptor interaction
pathway was most significantly enriched (P=9.44×10⁻⁵),
and 7 genes [collagen, type VI, α3 (COL6A3), COL1A2, COL1A1,
COL5A2, thrombospondin 2 (THBS2), COL11A1 and COL5A1] were
predicted to participate in the pathway.
| Table II.Significant pathways of DEGs in the
selected modules. |
Table II.
Significant pathways of DEGs in the
selected modules.
| Term | Count | FDR | Genes |
|---|
| hsa04512:
ECM-receptor interaction | 7 |
9.44×10⁻⁵ | COL6A3, COL1A2,
COL1A1, COL5A2, THBS2, COL11A1, COL5A1 |
| hsa04510: Focal
adhesion | 8 |
9.10×10⁻⁴ | PGF, COL6A3,
COL1A2, COL1A1, COL5A2, THBS2, COL11A1, COL5A1 |
Discussion
GC is the fourth most frequently occurring malignant
tumor worldwide, with high incidence and mortality rates.
Therefore, it is of great importance to conduct research on the
treatment of GC (33). Major efforts
are being made to understand GC at a molecular level (34). Since microarrays can simultaneously
investigate the expression levels of thousands of genes in the
human genome, use of the technique has been widely applied in the
identification of disease biomarkers (26,35). In
the present study, a total of 596 DEGs were identified in the GC
samples compared with the normal controls. Furthermore, the
co-expression interaction network of DEGs was construction and 4
modules were identified. The upregulated PDLIM7 gene was enriched
in module 1, while 7 other upregulated genes (COL6A3, COL1A2,
COL1A1, COL5A2, THBS2, COL11A1 and COL5A1) were involved in the
ECM-receptor interaction pathway. The COL family of genes were
mainly enriched in module 2, for which the function was phosphate
transport.
COL1A1 and COL1A2 encode the α1 and α2 chains of
type I collagen, respectively (36).
Collagen is the main constituent of the ECM component in tumors,
and a number of collagen types have been found in GC tissues
(37). The major constituents of the
ECM are collagens, adhesive glycoproteins and proteoglycans
(38). Specific interactions between
cells and ECM-mediated cell-surface-associated components and
transmembrane molecules result in the control of cellular
activities, such as adhesion and migration (39). Matsui et al showed that
collagen degradation, which was an essential step in the tumor cell
invasion of the surrounding tissues, was increased in GC tissues
(40). Su et al reported that
COL1A1 and COL1A2 were commonly upregulated in GC, and were
associated with invasion and metastasis (8). In line with this previous study, the
present results showed that COL1A1 and COL1A2 were upregulated in
GC, suggesting that they play an important role in cancer cell
invasion and metastasis in this disease. On the other hand, the COL
family genes were mainly enriched in modules 2 and 4, for which the
function is phosphate transport. COL6A3 was clustered into module
2. COL6A3 encodes one of the three α chains of type VI collagen.
Another significant DEG that was enriched in GC was COL11A1,
another member of the COL family, which encodes one of the two α
chains of type XI collagen. Using microarray technology, COL6A3 and
COL11A1 levels have been proven to be elevated in GC endothelium
when compared with normal endothelium (41,42). The
present study demonstrated that COL6A3 and COL11A1 were upregulated
and participated in the ECM-receptor interaction pathway, which was
in line with these previous studies. Taken together, the results
indicated that the COL family in the present study may be molecular
biomarkers for GC.
THBS2, which has demonstrated functions as a potent
inhibitor of tumor growth and angiogenesis, is a disulfide-linked
homotrimetric glycoprotein that mediates cell-to-matrix and
cell-cell interactions (43). Stamper
et al reported that genes associated with ECM-receptor
interactions, including TBHS2, underwent significant changes in
expression when comparing craniosynostosis patients and controls
(44). In addition, Yasui et
al suggested that changes in the ECM could be induced by the
degradation of collagen I, which was of great importance to the
infiltration and metastasis of cancer cells in GC (45). In line with this previous study, the
present results also indicated that TBHS2 was upregulated in GC
compared with normal controls, suggesting that TBHS2 may play a
role in ECM changes and promote GC progression.
PDLIM7 is a family of proteins composed of PDZ and
LIM domains that have been proposed to direct protein-protein
interactions. Wu et al demonstrated that the LIM domains of
Enigma recognized tyrosine-containing motifs with specificity
residing in the target structures and the LIM domains (46). Another study showed that receptor
tyrosine kinases play essential roles in the control of cancer cell
growth and differentiation (47). In
the present study, PDLIM7 was found to be upregulated, showing
enrichment in module 1, and interacted with other DEGs identified
in the study. Another hub gene in module 1 was adenosine deaminase,
RNA-specific, B1 (ADARB1) (Fig. 4).
ADARB1, also known as ADAR2, encodes the enzyme responsible for
pre-mRNA editing of the glutamate receptor subunit B by
site-specific deamination of adenosines (48). A previous study demonstrated that the
dysregulation of adenosine to inosine in human cancers possibly
contributed to the altered transcriptional program required to
sustain carcinogenesis (49).
Moreover, Camarata et al reported that PDLIM7 could regulate
T-box protein 5 transcriptional activity, which is involved in the
transcriptional regulation of genes required for mesoderm
differentiation (50). In this
context, we speculate that PDLIM7 may play a crucial role in GC
development via the interaction with ADARB1.
In conclusion, the present study investigated the
critical genes in GC based on microarray data. The target genes
COL1A1, COL1A2, COL6A3, THBS2, COL11A1, PDLIM7 and ADARB1 were
involved in the progression of GC. COL6A3, COL1A2, COL1A1, THBS2
and COL11A1were identified to be involved in the ECM-receptor
interaction pathway. Furthermore, the genes of the COL family were
associated with phosphate transport. COL1A1 and COL1A2 may play an
important role in tumor invasion and metastasis in GC. TBHS2 may
impact ECM changes and promote GC progression. Moreover, PDLIM7 may
play a crucial role in GC development via the interaction with
ADARB1. The genes identified in GC tissues in the present study may
prove to be molecular biomarkers for this disease, although further
studies must be performed to confirm these results.
Acknowledgements
The authors wish to express their warm thanks to
Fenghe (Shanghai) Information Technology Co., Ltd. (Shanghai,
China), whose ideas and assistance provided a valuable added
dimension to this study.
References
|
1
|
Polk DB and Peek RM Jr: Helicobacter
pylori: Gastric cancer and beyond. Nat Rev Cancer. 10:403–414.
2010. View
Article : Google Scholar : PubMed/NCBI
|
|
2
|
Ferlay J, Shin HR, Bray F, Forman D,
Mathers C and Parkin DM: Estimates of worldwide burden of cancer in
2008: GLOBOCAN 2008. Int J Cancer. 127:2893–2917. 2010. View Article : Google Scholar : PubMed/NCBI
|
|
3
|
Schønnemann K, Jensen HA, Yilmaz M, Jensen
BV, Larsen O and Pfeiffer P: Phase II study of short-time
oxaliplatin, capecitabine and epirubicin (EXE) as first-line
therapy in patients with non-resectable gastric cancer. Br J
Cancer. 99:858–861. 2008. View Article : Google Scholar : PubMed/NCBI
|
|
4
|
Cunningham D, Allum WH, Stenning SP,
Thompson JN, Van de Velde CJ, Nicolson M, Scarffe JH, Lofts FJ,
Falk SJ, Iveson TJ, et al: Perioperative chemotherapy versus
surgery alone for resectable gastroesophageal cancer. N Engl J Med.
355:11–20. 2006. View Article : Google Scholar : PubMed/NCBI
|
|
5
|
Guggenheim DE and Shah MA: Gastric cancer
epidemiology and risk factors. J Surg Oncol. 107:230–236. 2013.
View Article : Google Scholar : PubMed/NCBI
|
|
6
|
Tang W, Nakamura Y, Tsujimoto M, Sato M,
Wang X, Kurozumi K, Nakahara M, Nakao K, Nakamura M, Mori I and
Kakudo K: Heparanase: A key enzyme in invasion and metastasis of
gastric carcinoma. Mod Pathol. 15:593–598. 2002. View Article : Google Scholar : PubMed/NCBI
|
|
7
|
Gupta GP and Massagué J: Cancer
metastasis: Building a framework. Cell. 127:679–695. 2006.
View Article : Google Scholar : PubMed/NCBI
|
|
8
|
Yasui W, Oue N, Ito R, Kuraoka K and
Nakayama H: Search for new biomarkers of gastric cancer through
serial analysis of gene expression and its clinical implications.
Cancer Sci. 95:385–392. 2004. View Article : Google Scholar : PubMed/NCBI
|
|
9
|
Yasui W, Oue N, Aung PP, Matsumura S,
Shutoh M and Nakayama H: Molecular-pathological prognostic factors
of gastric cancer: A review. Gastric cancer. 8:86–94. 2005.
View Article : Google Scholar : PubMed/NCBI
|
|
10
|
Kim JM, Sohn HY, Yoon SY, Oh JH, Yang JO,
Kim JH, Song KS, Rho SM, Yoo HS, Kim YS, et al: Identification of
gastric cancer-related genes using a cDNA microarray containing
novel expressed sequence tags expressed in gastric cancer cells.
Clin Cancer Res. 11:473–482. 2005.PubMed/NCBI
|
|
11
|
Li BS, Zhao YL, Guo G, Li W, Zhu ED, Luo
X, Mao XH, Zou QM, Yu PW, Zuo QF, et al: Plasma microRNAs, miR-223,
miR-21 and miR-218, as novel potential biomarkers for gastric
cancer detection. PLoS One. 7:e416292012. View Article : Google Scholar : PubMed/NCBI
|
|
12
|
Wu MS, Lin YS, Chang YT, Shun CT, Lin MT
and Lin JT: Gene expression profiling of gastric cancer by
microarray combined with laser capture microdissection. World J
Gastroenterol. 11:7405–7412. 2005.PubMed/NCBI
|
|
13
|
Yokozaki H, Yasui W and Tahara E: Genetic
and epigenetic changes in stomach cancer. Int Rev Cytol. 204:49–95.
2001. View Article : Google Scholar : PubMed/NCBI
|
|
14
|
Rubin MA, Mucci NR, Figurski J, Fecko A,
Pienta KJ and Day ML: E-cadherin expression in prostate cancer: A
broad survey using high-density tissue microarray technology. Hum
Pathol. 32:690–697. 2001. View Article : Google Scholar : PubMed/NCBI
|
|
15
|
Ajani JA: Evolving chemotherapy for
advanced gastric cancer. Oncologist. 10(Suppl): 49–58. 2005.
View Article : Google Scholar : PubMed/NCBI
|
|
16
|
Wang Q, Wen YG, Li DP, Xia J, Zhou CZ, Yan
DW, Tang HM and Peng ZH: Upregulated INHBA expression is associated
with poor survival in gastric cancer. Med Oncol. 29:77–83. 2012.
View Article : Google Scholar : PubMed/NCBI
|
|
17
|
Liu P, Wang X, Hu C and Hu T:
Bioinformatics analysis with graph-based clustering to detect
gastric cancer-related pathways. Genet Mol Res. 11:3497–3504. 2012.
View Article : Google Scholar : PubMed/NCBI
|
|
18
|
Kikuchi Y, Kunita A, Iwata C, Komura D,
Nishiyama T, Shimazu K, Takeshita K, Shibahara J, Kii I, Morishita
Y, et al: The niche component periostin is produced by
cancer-associated fibroblasts, supporting growth of gastric cancer
through ERK activation. Am J Pathol. 184:859–870. 2014. View Article : Google Scholar : PubMed/NCBI
|
|
19
|
Barrett T, Troup DB, Wilhite SE, Ledoux P,
Rudnev D, Evangelista C, Kim IF, Soboleva A, Tomashevsky M, Edgar
R, et al: NCBI GEO: mining tens of millions of expression
profiles-database and tools update. Nucleic Acids Res. 35(Database
Issue): D760–D765. 2007. View Article : Google Scholar : PubMed/NCBI
|
|
20
|
Smyth GK: Limma: Linear models for
microarray data. Bioinformatics and Computational Biology Solutions
Using R and Bioconductor. Gentleman R, Carey V, Dudoit S, Irizarry
R and Huber W: Springer. 397–420. 2005. View Article : Google Scholar
|
|
21
|
Ihaka R and Gentleman R: R: A language for
data analysis and graphics. J Comput Graph Stat. 5:299–314. 1996.
View Article : Google Scholar
|
|
22
|
Reiner-Benaim A: FDR control by the BH
procedure for two-sided correlated tests with implications to gene
expression data analysis. Biom J. 49:107–126. 2007. View Article : Google Scholar : PubMed/NCBI
|
|
23
|
Benjamini Y and Hochberg Y: Controlling
the false discovery rate: A practical and powerful approach to
multiple testing. J R Statist Soc B. 57:289–300. 1995.
|
|
24
|
Szekely GJ and Rizzo ML: Hierarchical
clustering via joint between-within distances: Extending Ward's
minimum variance method. J Classif. 22:151–183. 2005. View Article : Google Scholar
|
|
25
|
Deza MM and Deza E: Encyclopedia of
distances. Berlin: Springer-Verlag. 2009. View Article : Google Scholar
|
|
26
|
Diao H, Li X, Hu S and Liu Y: Gene
expression profiling combined with bioinformatics analysis identify
biomarkers for Parkinson disease. PLoS One. 7:e523192012.
View Article : Google Scholar : PubMed/NCBI
|
|
27
|
Obayashi T, Okamura Y, Ito S, Tadaka S,
Motoike IN and Kinoshita K: COXPRESdb: A database of comparative
gene coexpression networks of eleven species for mammals. Nucleic
Acids Res. 41(Database Issue): D1014–D1020. 2013. View Article : Google Scholar : PubMed/NCBI
|
|
28
|
Barabasi AL and Oltvai ZN: Network
biology: Understanding the cell's functional organization. Nat Rev
Genet. 5:101–113. 2004. View
Article : Google Scholar : PubMed/NCBI
|
|
29
|
Smoot ME, Ono K, Ruscheinski J, Wang PL
and Ideker T: Cytoscape 2.8: New features for data integration and
network visualization. Bioinformatics. 27:431–432. 2011. View Article : Google Scholar : PubMed/NCBI
|
|
30
|
Bader GD and Hogue CW: An automated method
for finding molecular complexes in large protein interaction
networks. BMC Bioinformatics. 4:22003. View Article : Google Scholar : PubMed/NCBI
|
|
31
|
Maere S, Heymans K and Kuiper M: BiNGO: A
Cytoscape plugin to assess overrepresentation of gene ontology
categories in biological networks. Bioinformatics. 21:3448–3449.
2005. View Article : Google Scholar : PubMed/NCBI
|
|
32
|
da Huang W, Sherman BT and Lempicki RA:
Systematic and integrative analysis of large gene lists using DAVID
bioinformatics resources. Nat Protoc. 4:44–57. 2009. View Article : Google Scholar : PubMed/NCBI
|
|
33
|
Jemal A, Bray F, Center MM, Ferlay J, Ward
E and Forman D: Global cancer statistics. CA Cancer J Clin.
61:69–90. 2011. View Article : Google Scholar : PubMed/NCBI
|
|
34
|
Figueiredo C, GarciaGonzalez MA and
Machado JC: Molecular pathogenesis of gastric cancer. Helicobacter.
18(Suppl 1): 28–33. 2013. View Article : Google Scholar : PubMed/NCBI
|
|
35
|
Guttula SV, Allam A and Gumpeny RS:
Analyzing microarray data of Alzheimer's using cluster analysis to
identify the biomarker genes. Int J Alzheimers Dis.
2012:6494562012.PubMed/NCBI
|
|
36
|
Chan TF, Poon A, Basu A, Addleman NR, Chen
J, Phong A, Byers PH, Klein TE and Kwok PY: Natural variation in
four human collagen genes across an ethnically diverse population.
Genomics. 91:307–314. 2008. View Article : Google Scholar : PubMed/NCBI
|
|
37
|
Yin Y, Zhao Y, Li AQ and Si JM: Collagen:
A possible prediction mark for gastric cancer. Med Hypotheses.
72:163–165. 2009. View Article : Google Scholar : PubMed/NCBI
|
|
38
|
Bosman FT and Stamenkovic I: Functional
structure and composition of the extracellular matrix. J Pathol.
200:423–428. 2003. View Article : Google Scholar : PubMed/NCBI
|
|
39
|
Uitto VJ and Larjava H: Extracellular
matrix molecules and their receptors: An overview with special
emphasis on periodontal tissues. Crit Rev Oral Biol Med. 2:323–354.
1991.PubMed/NCBI
|
|
40
|
Matsui H, Kubochi K, Okazaki I, Yoshino K,
Ishibiki K and Kitajima M: Collagen biosynthesis in gastric cancer:
Immunohistochemical analysis of prolyl 4hydroxylase. J Surg Oncol.
70:239–246. 1999. View Article : Google Scholar : PubMed/NCBI
|
|
41
|
Hippo Y, Taniguchi H, Tsutsumi S, Machida
N, Chong JM, Fukayama M, Kodama T and Aburatani H: Global gene
expression analysis of gastric cancer by oligonucleotide
microarrays. Cancer Res. 62:233–240. 2002.PubMed/NCBI
|
|
42
|
Oue N, Hamai Y, Mitani Y, Matsumura S,
Oshimo Y, Aung PP, Kuraoka K, Nakayama H and Yasui W: Gene
expression profile of gastric carcinoma identification of genes and
tags potentially involved in invasion, metastasis and
carcinogenesis by serial analysis of gene expression. Cancer Res.
64:2397–2405. 2004. View Article : Google Scholar : PubMed/NCBI
|
|
43
|
Tokunaga T, Nakamura M, Oshika Y, Abe Y,
Ozeki Y, Fukushima Y, Hatanaka H, Sadahiro S, Kijima H, Tsuchida T,
et al: Thrombospondin 2 expression is correlated with inhibition of
angiogenesis and metastasis of colon cancer. Br J Cancer.
79:354–359. 1999. View Article : Google Scholar : PubMed/NCBI
|
|
44
|
Stamper BD, Park SS, Beyer RP, Bammler TK,
Farin FM, Mecham B and Cunningham ML: Differential expression of
extracellular matrix-mediated pathways in single-suture
craniosynostosis. PLoS One. 6:e265572011. View Article : Google Scholar : PubMed/NCBI
|
|
45
|
Su CQ, Qiu H and Zhang Y: Localization of
keratin mRNA and collagen I mRNA in gastric cancer by in situ
hybridization and hybridization electron microscopy. World J
Gastroenterol. 5:527–530. 1999.PubMed/NCBI
|
|
46
|
Wu R, Durick K, Songyang Z, Cantley LC,
Taylor SS and Gill GN: Specificity of LIM domain interactions with
receptor tyrosine kinases. J Biol Chem. 271:15934–15941. 1996.
View Article : Google Scholar : PubMed/NCBI
|
|
47
|
Gschwind A, Fischer OM and Ullrich A: The
discovery of receptor tyrosine kinases: Targets for cancer therapy.
Nat Rev Cancer. 4:361–370. 2004. View
Article : Google Scholar : PubMed/NCBI
|
|
48
|
Mittaz L, Scott HS, Rossier C, Seeburg PH,
Higuchi M and Antonarakis SE: Cloning of a human RNA editing
deaminase (ADARB1) of glutamate receptors that maps to chromosome
21q22. 3. Genomics. 41:210–217. 1997. View Article : Google Scholar : PubMed/NCBI
|
|
49
|
Miura K, Fujibuchi W and Sasaki I:
Alternative premRNA splicing in digestive tract malignancy. Cancer
Sci. 102:309–316. 2011. View Article : Google Scholar : PubMed/NCBI
|
|
50
|
Camarata T, Krcmery J, Snyder D, Park S,
Topczewski J and Simon HG: Pdlim7 (LMP4) regulation of Tbx5
specifies zebrafish heart atrio-ventricular boundary and valve
formation. Dev Biol. 337:233–245. 2010. View Article : Google Scholar : PubMed/NCBI
|