Introduction
Colorectal cancer (CRC) poses a major public health
issue worldwide; it is the third most common type of cancer and the
second leading cause of cancer-associated mortality (1,2). Several
randomized trials of chemoradiotherapy for CRC have demonstrated
improved local control and survival benefits (3,4). A
commonly used chemotherapy regimen for the treatment of CRC
includes folinic acid, 5-fluorouracil (FU) and oxaliplatin (FOLFOX
regimen); however, responses to FOLFOX vary significantly in
clinical settings (5) and may be
associated with expression levels of various host genes (6). To the best of our knowledge, there is no
widely accepted molecular marker to predict patient response to,
and outcome of, the FOLFOX regimen.
Protein kinase Cα (PKCα) is a member of the family
of serine- and threonine-specific protein kinases and is important
for numerous cellular functions, including adhesion and
transformation, cell cycle progression and cell volume control
(7–9).
PKCα also regulates tissue-dependent tumor growth and progression
(10). In certain circumstances, PKCα
acts as a tumor promoter while, in others, it acts as a tumor
suppressor. Overexpression of PKCα has been demonstrated in tissue
samples of prostate, endometrial, high-grade urinary bladder and
hepatocellular cancers (11–13), while downregulation of PKCα in
hematological malignancies, basal cell carcinoma and CRC has also
been observed (14,15). A previous study revealed that
inhibition of PKCα overcomes multidrug resistance in human CRC
cells (16). However, the role of
PKCα in patient responses to chemotherapy, particularly the FOLFOX
regimen, is largely unknown.
Kirsten rat sarcoma viral oncogene homolog (KRAS)
protein is a GTPase, and mutation of KRAS is an essential step in
the development of various types of cancer (17,18),
including CRC (19). Although KRAS
mutation is predictive of a poor response to panitumumab
(Vectibix®) and cetuximab (Erbitux®) therapy
in CRC patients (20), the role of
KRAS overexpression in response to the FOLFOX regimen remains to be
established. Additionally, several studies have revealed that PKCα
functionally interacts with KRAS (21,22).
Therefore, the present clinical study was designed to determine the
association between PKCα, KRAS expression and the response to the
FOLFOX regimen in patients with CRC.
Patients and methods
Patients
The current study recruited 152 patients with colon
adenocarcinoma who attended the Department of Oncology of the Third
Affiliated Hospital of Liaoning Medical College (Jinzhou, China)
between March 2008 and March 2011.: The inclusion criteria were as
follows: i) Patients with radical tumor resection; ii)
histologically diagnosed with colorectal cancer; and iii) medical
record contains all clinicopathological data. The exclusion
criteria were as follows: i) Severe dysfunctions of the kidney,
liver, or heart; ii) severe complications following surgery, such
as surgery-related intestinal fistula or stricture, or pancreatic
fistula; iii) history of organ transplantation or severe renal,
liver or heart diseases; and iv) lost to follow-up. Among the
included patients, 72 were male and 80 were female; 56 had
well-differentiated adenocarcinoma, 60 had
moderately-differentiated adenocarcinoma and 36 had
poorly-differentiated adenocarcinoma. Lymph node metastasis was
present in 82 cases. According to Dukes' staging method (23), 26, 44, 58 and 24 patients were of
stages A, B, C and D, respectively. There were 86 patients whose
tumors had invaded the serosa.
In addition, 20 normal colorectal mucosa samples
were obtained from resected specimens, and were taken from ≥10 cm
away from the tumor margins in the mucous membranes; the control
specimens were pathologically confirmed to be free of cancer cell
invasion. All fresh tissue samples were fixed in 10% formalin and
embedded in paraffin. Serial 4-µm sections were cut and underwent
hematoxylin and eosin and immunohistochemical (IHC) staining. All
patients were examined by computed tomography, magnetic resonance
imaging or other scans (such as chest X-ray) to monitor for tumor
recurrence or metastasis. Specimens were surgically removed and
pathologically confirmed.
All patients were treated with preoperative
radiotherapy and chemotherapy. To be eligible for chemotherapy,
patients were required to have liver and kidney functions in the
normal ranges [serum aminotransferase, ≤100 IU; and urine
creatinine level, ≤198.9 µmol/l (men) or ≤159.15 µmol/l (women)],
normal electrocardiogram findings and a Karnofsky performance
status (24) score of ≥70. The study
was approved by the review board of the hospital, and informed
consent was obtained from each participant.
Chemotherapeutic regimen
Prior to participating in the study, written
informed consent was obtained from each patient. The
chemotherapeutic regimen, FOLFOX6, included oxaliplatin [100
mg/m2, intravenous drops (IVgtt), day 1], calcium
folinate (200 mg/m2, IVgtt, days 1–2) and 5-FU (400
mg/m2 IV on day 1; and 2,400 mg/m2,
continuous IV for 46 h) as part of an mFOLFOX6 regimen. The regimen
was repeated every 3–4 weeks. The Response Evaluation Criteria in
Solid Tumors (25) were used to
evaluate each patient's status following 6 cycles of treatment.
Follow-up was performed until July 31st, 2012.
Evaluation and survival records
The initial date of treatment was set as the
starting point for survival analysis. Progression-free survival
(PFS) and overall survival (OS) were recorded and analyzed.
IHC assay
Rabbit anti-human PKCα polyclonal antibody (#BA1360;
dilution, 1:200) and rabbit anti-human KRAS polyclonal antibody
(#BA4371; dilution, 1:150) were purchased from Wuhan Boster
Biological Technology, Ltd. (Wuhan, China). IHC analyses of the
paraffin-embedded tissue sections were performed using a standard
protocol. Paraffin-embedded tissue sections were deparaffinized in
xylene for 2×10 min each and rehydrated in a graded series of
ethanol (100-50%). The sections were cooked in a high pressure
cooker in citric acid buffer (pH 6.0) for 5 min and subsequently
incubated in 3% H2O2 in phosphate-buffered saline (PBS)
for 10 min at room temperature, and then with 15% normal serum for
30 min in the room temperature. Subsequently, the sections were
incubated with a primary antibody at 4°C overnight. The following
day, the sections were washed three times with PBS and then
incubated with the polymer helper from the DAB color reaction kit
(Wuhan Boster Biological Technology, Ltd.) at 37°C for 10 min. The
sections were briefly washed with PBS three times, and further
incubated with goat anti-rabbit IgG (ready for use) from the same
kit at 37°C for 20 min. 3,3′-diaminobenzidine was used for color
reaction and the sections were counterstained with hematoxylin
solution and mounted with a coverslip. The stained sections were
reviewed and scored under a light microscope.
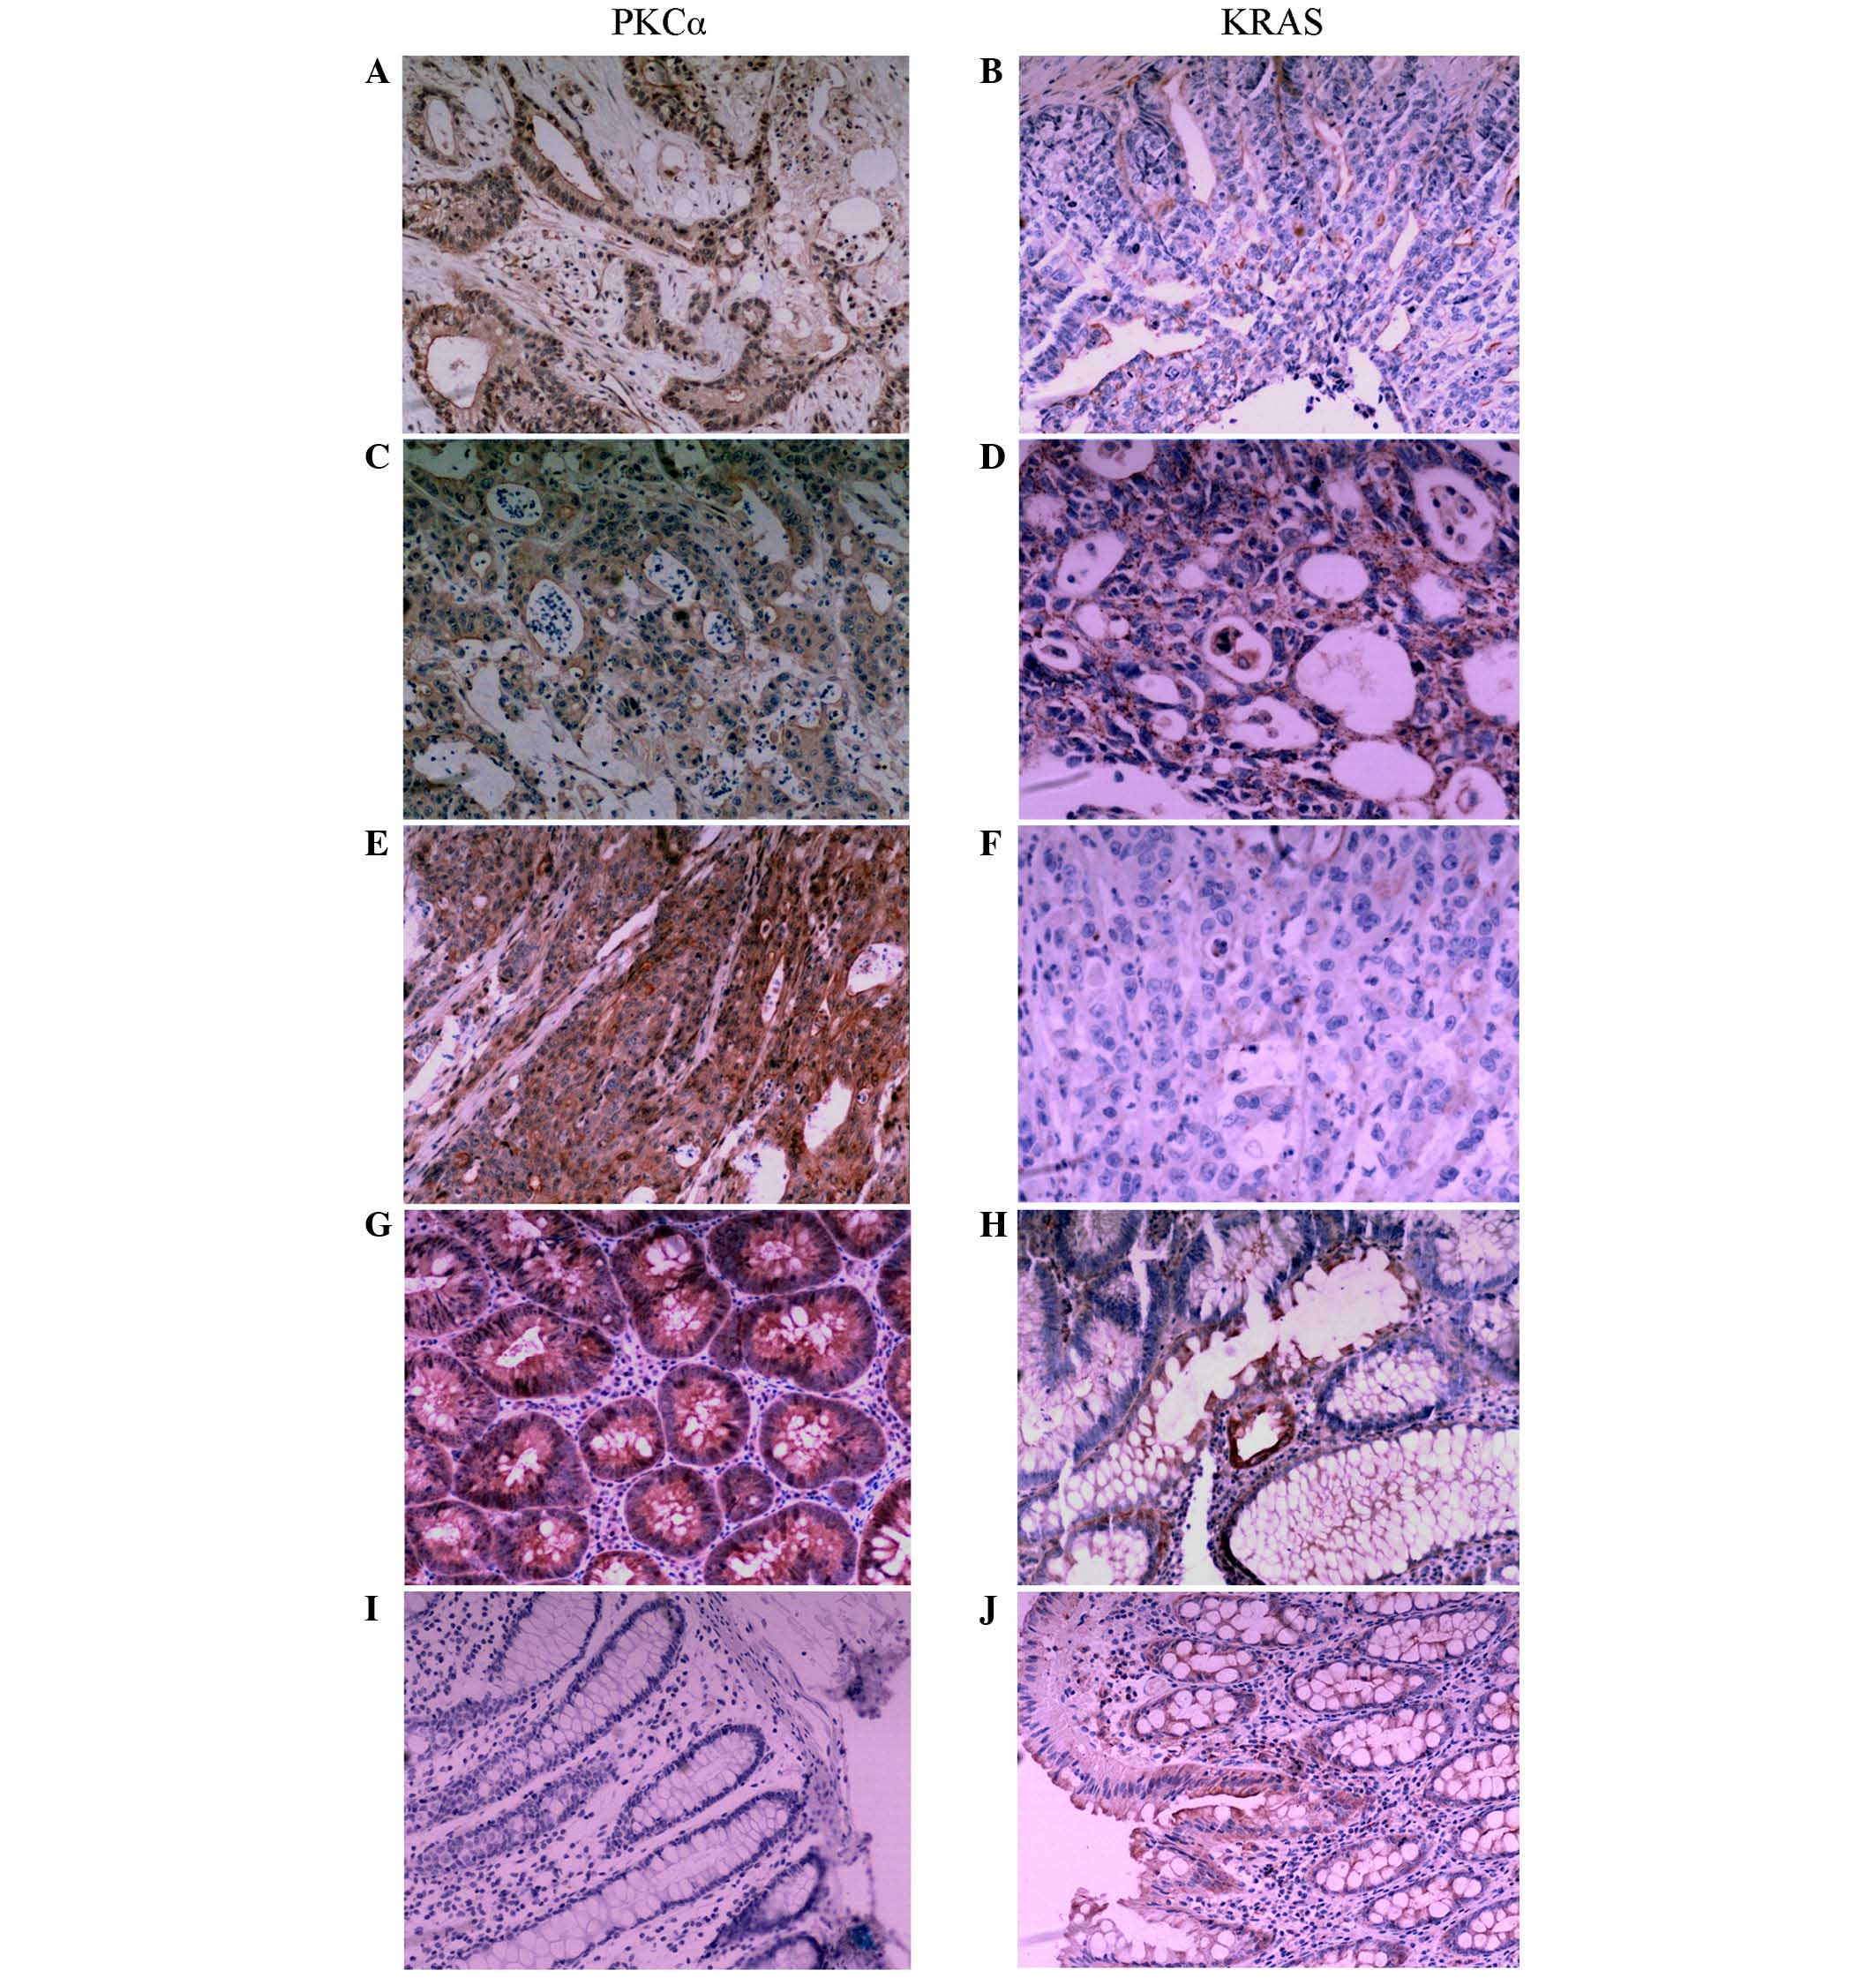
PKCα was expressed in the cytoplasm and cell
membrane; positive signals were visible as brown granules. A
staining intensity score was assigned to each sample according to
the following: 0, negative (no color); 1, weak positive (light
yellow); 2, positive (brown); 3, strong positive (dark brown). In
addition, a second score was assigned according to the percentage
of positive cells: 0, negative; 1, ≤10%; 2, 11–50%; 3, 51–75%; and
4, >75%. A final score was obtained by multiplying the staining
intensity score by the positive percentage score. Samples with a
final score of ≥2 were recorded as positive (+). KRAS was expressed
in the cytoplasm and the IHC results were recorded in the same
fashion as for PKCα.
Statistical analysis
All data were analyzed using SPSS version 13.0
(SPSS, Inc., Chicago, IL, USA). Positive rates for each group were
compared using a χ2 test. The Kaplan-Meier method was
used for survival analysis. Log-rank analysis was used to identify
prognostic factors and Cox regression analysis was used to identify
independent prognostic factors. Pearson's correlation test was
performed to analyze the association between two groups with
normally distributed data. All statistical tests were two-sided
probability tests and P<0.05 was considered to indicate a
statistically significant difference.
Results
PKCα and KRAS expression in CRC and
non-cancerous tissue, and association with clinicopathological
parameters
PKCα was located in the cytoplasm and cell membrane
and was observed as brown granules (Fig.
1). The rate of positive expression of PKCα in CRC tissues was
significantly lower than that in colorectal adenoma and normal
colorectal mucosa tissues (P=0.018; Table
I). KRAS immunoreactivity was observed in the cytoplasm
(Fig. 1). The KRAS protein expression
rate in CRC tissues was significantly higher compared with that in
colon adenoma and normal colon mucosa tissues (P=0.006) (Table I).
 | Table I.Expression of PKCα and KRAS in normal
colon tissue, colon adenoma and colon cancer, and its association
with clinicopathological parameters. |
Table I.
Expression of PKCα and KRAS in normal
colon tissue, colon adenoma and colon cancer, and its association
with clinicopathological parameters.
|
|
| PKCα + | KRAS + |
|---|
|
|
|
|
|
|---|
| Patients | Total | n | % | χ2 | P-value | n | % | χ2 | P-value |
|---|
| Colorectal
cancer | 152 | 54 | 35.5 | 7.983 | 0.018 | 104 | 68.4 | 10.086 | 0.006 |
| Colorectal
adenoma | 30 | 16 | 53.3 |
|
| 14 | 46.7 |
|
|
| Normal colon
tissue | 20 | 16 | 80.0 |
|
| 4 | 20.0 |
|
|
| Gender |
|
|
| 0.010 | 0.920 |
|
|
0.650 | 0.420 |
| Male | 72 | 26 | 36.1 |
|
| 46 | 63.9 |
|
|
|
Female | 80 | 28 | 35.0 |
|
| 58 | 72.5 |
|
|
| Age, years |
|
|
| 1.854 | 0.173 |
|
|
0.001 | 0.975 |
|
<60 | 32 | 16 | 50.0 |
|
| 22 | 68.8 |
|
|
|
≥60 | 120 | 38 | 31.7 |
|
| 82 | 68.3 |
|
|
| Pathological
differentiation |
|
|
| 8.728 | 0.013 |
|
| 17.667 | <0.001 |
|
High | 56 | 30 | 53.6 |
|
| 26 | 46.4 |
|
|
|
Moderate | 60 | 20 | 33.3 |
|
| 42 | 70.0 |
|
|
|
Low | 36 | 4 | 11.1 |
|
| 32 | 88.9 |
|
|
| Lymph node
metastasis |
|
|
| 2.727 | 0.099 |
|
|
2.129 | 0.145 |
|
Positive | 82 | 36 | 43.9 |
|
| 62 | 75.6 |
|
|
|
Negative | 70 | 18 | 25.7 |
|
| 42 | 60.0 |
|
|
| Dukes' stage |
|
|
| 2.790 | 0.248 |
|
|
2.492 | 0.288 |
| A | 26 | 6 | 23.1 |
|
| 14 | 53.8 |
|
|
| B | 44 | 12 | 27.3 |
|
| 28 | 63.6 |
|
|
|
C+D | 82 | 36 | 43.9 |
|
| 62 | 75.6 |
|
|
The rates of positive PKCα protein expression in
poorly, moderately and well-differentiated adenocarcinoma were
11.1% (4/36), 33.3% (20/60), and 53.6% (30/56), respectively
(P<0.013) (Table I). The positive
rates of PKCα protein in patients of Dukes' stages A, B and C+D
were 23.1% (6/26), 27.3% (12/44) and 43.9% (36/82), respectively.
Expression of PKCα was not associated with gender, age, lymph node
metastasis or Dukes' stage. Expression of KRAS was significantly
associated with the degrees of differentiation in CRC (P<0.001)
(Table I).
Expression of PKCα is negatively
correlated with KRAS expression in CRC
The association between PKCα and KRAS expression was
investigated in cancer tissues. There were 20 cases with
KRAS-positive expression out of 54 PKCα-positive cases, and 84
KRAS-positive cases in 98 PKCα-negative cases. The difference in
expression pattern was statistically significant (P=0.002; Table II). The expression of PKCα was
negatively correlated with KRAS expression in CRC (r=−0.930;
−1≤r<0, Pearson's correlation test; Table II).
| Table II.Correlation between PKCα and KRAS
expression in patients with colorectal adenocarcinoma. |
Table II.
Correlation between PKCα and KRAS
expression in patients with colorectal adenocarcinoma.
|
|
| KRAS, n |
|
|
|---|
|
|
|
|
|
|
|---|
| PKCα | Total | + | − | r | P-value |
|---|
| + | 54 | 20 | 34 | −0.930 | 0.002 |
| − | 98 | 84 | 14 |
|
|
| Total | 152 | 104 | 48 |
|
|
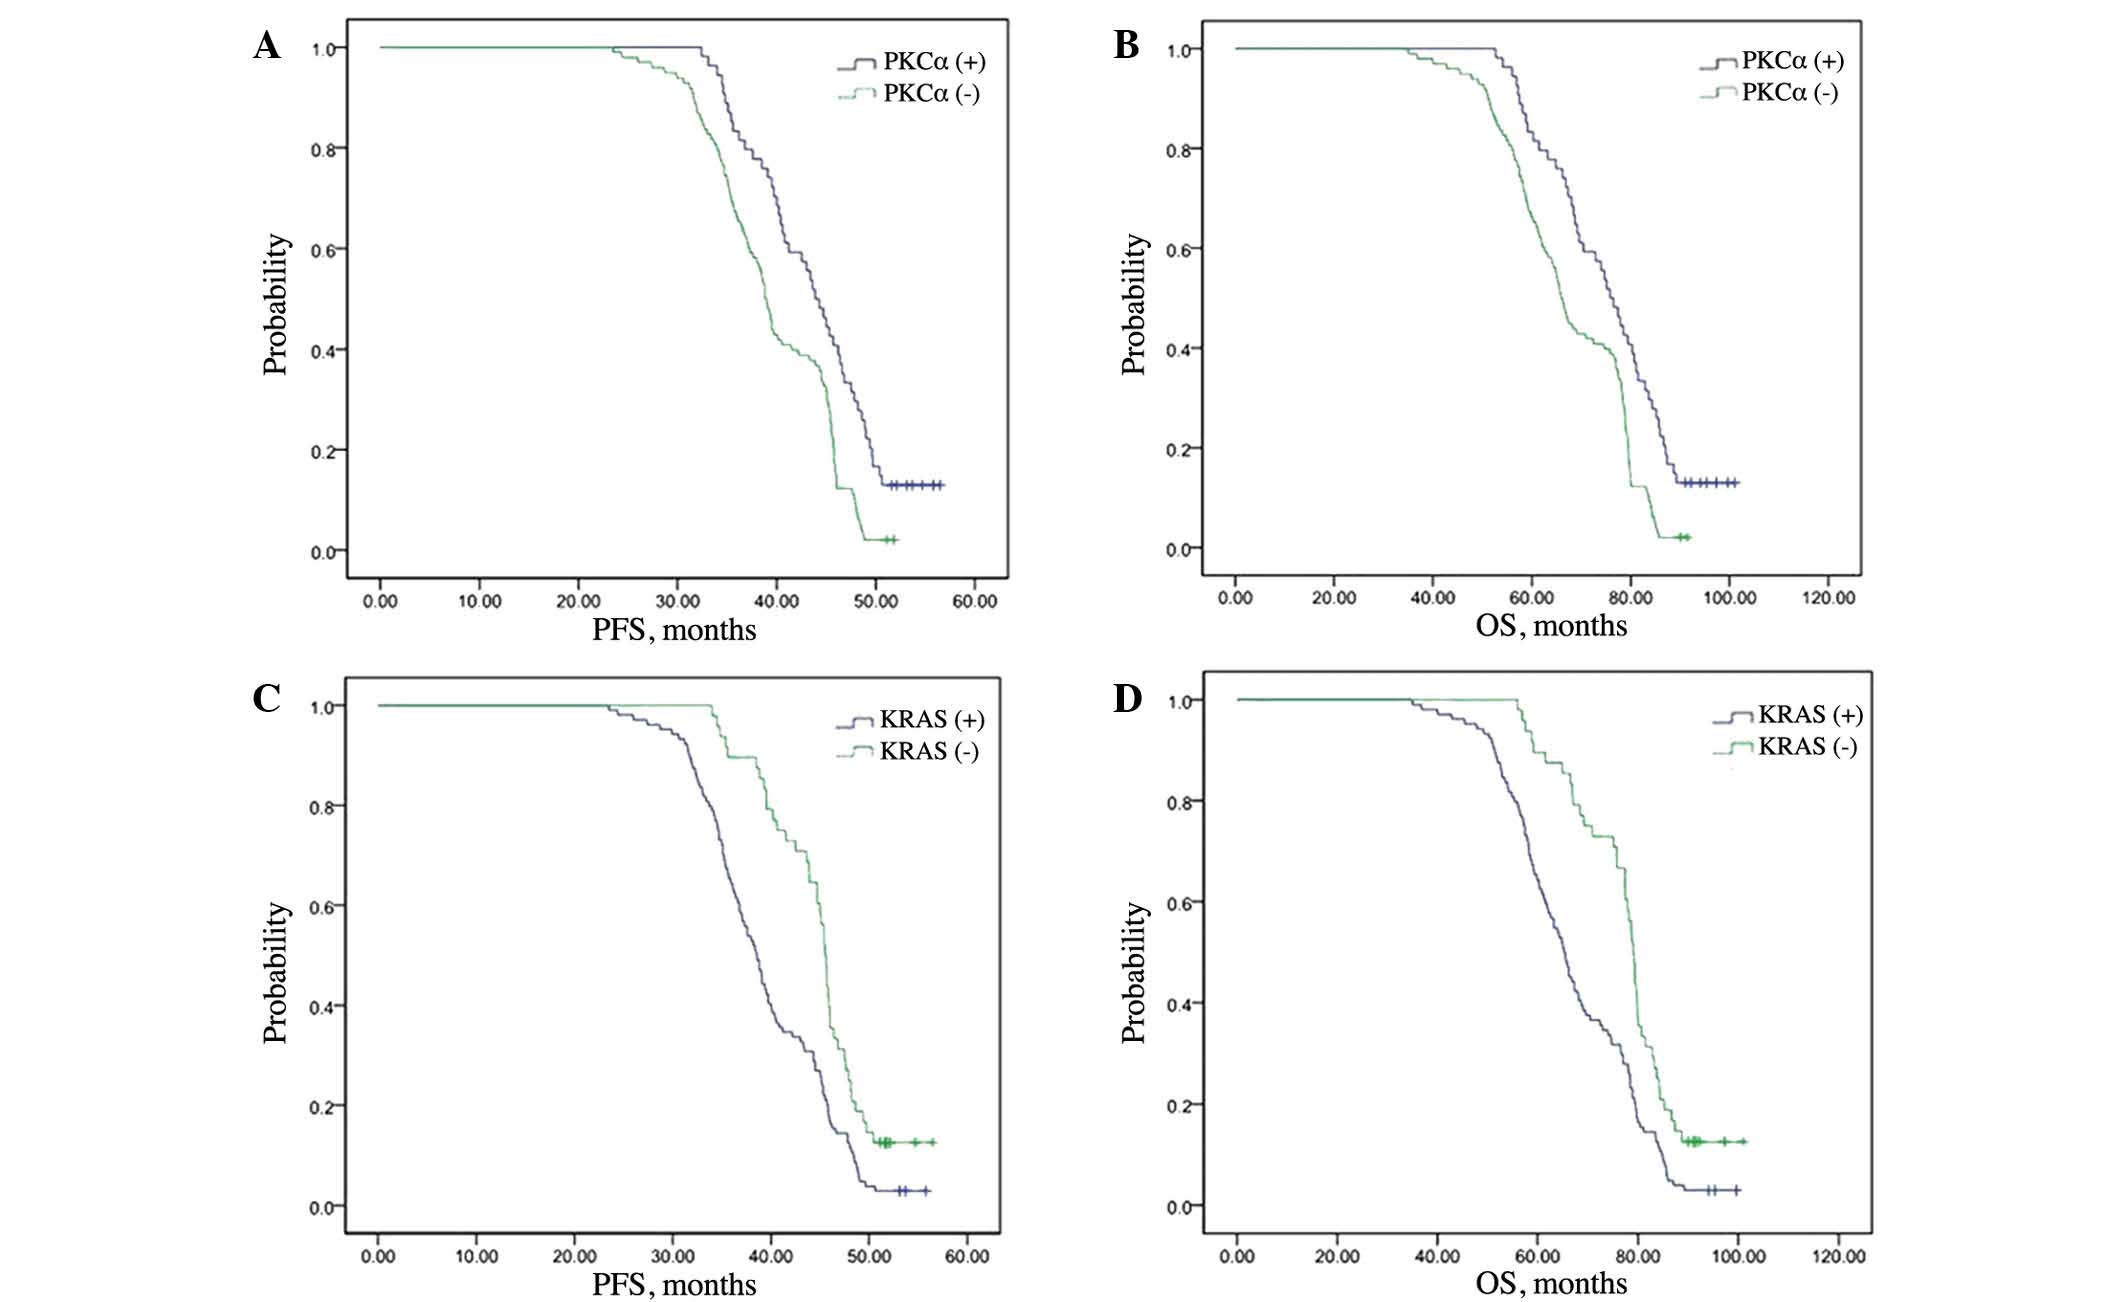
Expression status of PKCα and KRAS
predicts survival in CRC patients
A Cox multivariate survival analysis indicated that
PKCα expression (P=0.003), KRAS expression (P=0.001) and Dukes'
stage (P=0.011) were independent factors for predicting the
prognosis of CRC patients (Table
III). Kaplan-Meier curves and the log-rank test were used to
analyze survival of patients. The mean durations of PFS were 43.9
and 38.8 months in the PKCα high-expression group and
low-expression groups, respectively (P<0.001; Fig. 2A). The mean OS times were 76.0 and
65.9 months in the PKCα high- and low-expression groups,
respectively (P<0.001; Fig. 2B).
The mean durations of PFS were 38.5 and 45.5 months in the KRAS
high- and low-expression groups, respectively (P=0.001; Fig. 2C). The mean durations of OS were 65.2
and 79.0 months in the KRAS high- and low-expression groups,
respectively (P<0.001; Fig.
2D).
| Table III.Cox multivariate survival
analysis. |
Table III.
Cox multivariate survival
analysis.
| Variable | B | SE | Wald | df | Sig. | Exp(B) |
|---|
| Age |
0.377 |
0.226 |
2.786 | 1 |
0.095 | 1.459 |
| Gender (male vs.
female) |
0.187 |
0.171 |
1.196 | 1 |
0.274 | 1.205 |
| Tumor
differentiation (well vs. moderate vs. poor) |
0.412 |
0.220 |
3.511 | 1 |
0.061 | 1.510 |
| Lymph node
metastasis (positive vs. negative) | −0.032 |
0.470 |
0.005 | 1 |
0.946 |
0.969 |
| Dukes' stage (A vs.
B vs. C+D) |
0.741 |
0.293 |
6.397 | 1 |
0.011 | 2.099 |
| PKCα (+) |
0.601 |
0.205 |
8.564 | 1 |
0.003 | 1.824 |
| KRAS (−) | −0.672 |
0.199 | 11.428 | 1 |
0.001 |
0.511 |
Discussion
Although surgery remains the most common treatment
for CRC, 40–50% of patients undergoing only surgery ultimately
relapse and succumb to metastatic disease (26). Adjuvant chemotherapy has an
established role in the treatment of stage III CRC (27). The FOLFOX regimen has been widely used
as an adjuvant treatment for CRC (28); however, response to the FOLFOX regimen
varies between patients. To date, no clear molecular marker has
been established to predict the response of patients to this
regimen. Furthermore, the molecular mechanism that mediates
chemoresistance to FOLFOX is largely unknown. In the present study,
the expression of PKCα was found to be negatively correlated with
KRAS expression. More importantly, the low expression of PKCα and
high expression of KRAS independently indicated poor outcome in CRC
patients treated with FOLFOX, which may have clinical
implications.
PKC is widely expressed in tissues, and abnormal
expression levels have been detected in numerous types of
transformed cell lines and tumors (29). The role of PKCα in CRC is not fully
understood. The mRNA (30) and
protein expression (31,32) of PKCα are decreased in CRC patients.
However, several reports suggest that PKCα is upregulated in CRC
patients, and that inhibiting its expression protects against
multidrug resistance in human CRC cells (11,16). PKCα
also suppresses intestinal tumor formation in mice (15). In the present study, PKCα protein
expression was significantly reduced in CRC patients, and the low
expression of PKCα predicted poor prognosis. Our results support
the notion of PKCα as a tumor suppressor in CRC and suggest that
its expression may be used to predict response to chem therapy.
The Ras gene family, including HRAS,
KRAS and NRAS, has essential functions in normal
tissues, including cell growth and differentiation, whereas mutated
Ras proteins contribute to cancer development (33). Ras proteins function as molecular
switches; once turned on, they activate growth factors and
receptors, such as c-Raf and phosphoinositide 3-kinase, to promote
cell proliferation and transformation. The majority of RAS
mutations lead to continuously activated Ras protein (11). Mutations in the Ras family of
proto-oncogenes are extremely common and have been identified in
20–30% of all human tumors (34). The
KRAS oncogene is mutated in 35–45% of CRC patients (35,36). The
oncogenic role of KRAS in CRC is widely recognized and KRAS
mutation is a negative predictor of response to anti-epidermal
growth factor receptor antibodies (37). However, the role of KRAS in the
response to chemotherapy, particularly the FOLFOX regimen, is less
clear. In the present study, KRAS expression in cancer tissues from
CRC patients was found to be significantly higher than that in
colorectal adenoma and normal colorectal mucosa, and the high
expression of KRAS predicted poor treatment outcomes in
patients.
In summary, the current study provides clinical
evidence indicating a negative correlation between PKCα and KRAS
expression. Examining the expression of PKCα and KRAS in CRC
patients may be of use to guide chemotherapy in the clinical
setting. Further clinical study is required to confirm the current
findings.
Acknowledgements
The authors would like to thank Medjaden Bioscience
Limited (Hong Kong, China) for assisting in the preparation of this
manuscript.
References
|
1
|
Siegel R, Naishadham D and Jemal A: Cancer
statistics. 2012. CA Cancer J Clin. 62:10–29. 2012. View Article : Google Scholar : PubMed/NCBI
|
|
2
|
Fang YJ, Wu XJ, Zhao Q, Li LR, Lu ZH, Ding
PR, Zhang RX, Kong LH, Wang FL, Lin JZ, et al: Hospital-based
colorectal cancer survival trend of different tumor locations from
1960 s to 2000s. PLoS One. 8:e735282013. View Article : Google Scholar : PubMed/NCBI
|
|
3
|
Wong RK, Tandan V, De Silva S and
Figueredo A: Pre-operative radiotherapy and curative surgery for
the management of localized rectal carcinoma. Cochrane Database
Syst Rev: CD002102. 2007. View Article : Google Scholar
|
|
4
|
André T, Boni C, Navarro M, Tabernero J,
Hickish T, Topham C, Bonetti A, Clingan P, Bridgewater J, Rivera F
and de Gramont A: Improved overall survival with oxaliplatin,
fluorouracil, and leucovorin as adjuvant treatment in stage II or
III colon cancer in the MOSAIC trial. J Clin Oncol. 27:3109–3116.
2009. View Article : Google Scholar : PubMed/NCBI
|
|
5
|
de Gramont A, Figer A, Seymour M, Homerin
M, Hmissi A, Cassidy J, Boni C, Cortes-Funes H, Cervantes A, Freyer
G, et al: Leucovorin and fluorouracil with or without oxaliplatin
as first-line treatment in advanced colorectal cancer. J Clin
Oncol. 18:2938–2947. 2000.PubMed/NCBI
|
|
6
|
Kline CL, Sheikh HS, Scicchitano A,
Gingrich R, Beachler C, Finnberg NK, Liao J, Sivik J and El-Deiry
WS: Preliminary observations indicate variable patterns of plasma
5-fluorouracil (5-FU) levels during dose optimization of infusional
5-FU in colorectal cancer patients. Cancer Biol Ther. 12:557–568.
2011. View Article : Google Scholar : PubMed/NCBI
|
|
7
|
Micol V, Sánchez-Piñera P, Villalain J, de
Godos A and Gómez-Fernández JC: Correlation between protein kinase
C alpha activity and membrane phase behavior. Biophys J.
76:916–927. 1999. View Article : Google Scholar : PubMed/NCBI
|
|
8
|
Frazer GS: Uterine torsion followed by
jejunal incarceration in a partially everted urinary bladder of a
cow. Aust Vet J. 65:24–25. 1988. View Article : Google Scholar : PubMed/NCBI
|
|
9
|
Haughian JM and Bradford AP: Protein
kinase C alpha (PKCalpha) regulates growth and invasion of
endometrial cancer cells. J Cell Physiol. 220:112–118. 2009.
View Article : Google Scholar : PubMed/NCBI
|
|
10
|
Nakashima S: Protein kinase C alpha (PKC
alpha): Regulation and biological function. J Biochem. 132:669–675.
2002. View Article : Google Scholar : PubMed/NCBI
|
|
11
|
Masur K, Lang K, Niggemann B, Zanker KS
and Entschladen F: High PKC alpha and low E-cadherin expression
contribute to high migratory activity of colon carcinoma cells. Mol
Biol Cell. 12:1973–1982. 2001. View Article : Google Scholar : PubMed/NCBI
|
|
12
|
Fournier DB, Chisamore M, Lurain JR,
Rademaker AW, Jordan VC and Tonetti DA: Protein kinase C alpha
expression is inversely related to ER status in endometrial
carcinoma: Possible role in AP-1-mediated proliferation of
ER-negative endometrial cancer. Gynecol Oncol. 81:366–372. 2001.
View Article : Google Scholar : PubMed/NCBI
|
|
13
|
Koren R, Ben Meir D, Langzam L, Dekel Y,
Konichezky M, Baniel J, Livne PM, Gal R and Sampson SR: Expression
of protein kinase C isoenzymes in benign hyperplasia and carcinoma
of prostate. Oncol Rep. 11:321–326. 2004.PubMed/NCBI
|
|
14
|
Neill GW, Ghali LR, Green JL, Ikram MS,
Philpott MP and Quinn AG: Loss of protein kinase Calpha expression
may enhance the tumorigenic potential of Gli1 in basal cell
carcinoma. Cancer Res. 63:4692–4697. 2003.PubMed/NCBI
|
|
15
|
Oster H and Leitges M: Protein kinase C
alpha but not PKCzeta suppresses intestinal tumor formation in
ApcMin/+ mice. Cancer Res. 66:6955–6963. 2006. View Article : Google Scholar : PubMed/NCBI
|
|
16
|
Lee SK, Shehzad A, Jung JC, Sonn JK, Lee
JT, Park JW and Lee YS: Protein kinase Cα protects against
multidrug resistance in human colon cancer cells. Mol Cells.
34:61–69. 2012. View Article : Google Scholar : PubMed/NCBI
|
|
17
|
Kranenburg O: The KRAS oncogene: Past,
present, and future. Biochim Biophys Acta. 1756:81–82.
2005.PubMed/NCBI
|
|
18
|
McGrath JP, Capon DJ, Smith DH, Chen EY,
Seeburg PH, Goeddel DV and Levinson AD: Structure and organization
of the human Ki-ras proto-oncogene and a related processed
pseudogene. Nature. 304:501–506. 1983. View
Article : Google Scholar : PubMed/NCBI
|
|
19
|
Vogelstein B and Kinzler KW: Cancer genes
and the pathways they control. Nat Med. 10:789–799. 2004.
View Article : Google Scholar : PubMed/NCBI
|
|
20
|
Lièvre A, Bachet JB, Le Corre D, Boige V,
Landi B, Emile JF, Côté JF, Tomasic G, Penna C, Ducreux M, et al:
KRAS mutation status is predictive of response to cetuximab therapy
in colorectal cancer. Cancer Res. 66:3992–3995. 2006. View Article : Google Scholar : PubMed/NCBI
|
|
21
|
Hill KS, Erdogan E, Khoor A, Walsh MP,
Leitges M, Murray NR and Fields AP: Protein kinase Cα suppresses
Kras-mediated lung tumor formation through activation of a p38
MAPK-TGFβ signaling axis. Oncogene. 33:2134–2144. 2014. View Article : Google Scholar : PubMed/NCBI
|
|
22
|
Wen-Sheng W: Protein kinase C alpha
trigger Ras and Raf-independent MEK/ERK activation for TPA-induced
growth inhibition of human hepatoma cell HepG2. Cancer Lett.
239:27–35. 2006. View Article : Google Scholar : PubMed/NCBI
|
|
23
|
Nitzsche L: Results of radical operation
of rectal carcinoma in relation to the tumor size (Dukes' stages A
to D). Zentralbl Chir. 94:994–997. 1969.(In German). PubMed/NCBI
|
|
24
|
Mor V, Laliberte L, Morris JN and Wiemann
M: The Karnofsky Performance Status Scale. An examination of its
reliability and validity in a research setting. Cancer.
53:2002–2007. 1984. View Article : Google Scholar : PubMed/NCBI
|
|
25
|
Eisenhauer EA, Therasse P, Bogaerts J,
Schwartz LH, Sargent D, Ford R, Dancey J, Arbuck S, Gwyther S,
Mooney M, et al: New response evaluation criteria in solid tumours:
revised RECIST guideline (version 1.1). Eur J Cancer. 45:228–247.
2009. View Article : Google Scholar : PubMed/NCBI
|
|
26
|
Randall JK and Gilbert JM: Innovations and
developments in surgical coloproctology. J R Soc Med. 106:178–183.
2013. View Article : Google Scholar : PubMed/NCBI
|
|
27
|
Lin YL and Liang JT: FOLFOX4 in the
adjuvant treatment of colon cancer in Asian patients.
Hepatogastroenterology. 59:400–404. 2012.PubMed/NCBI
|
|
28
|
André T, Iveson T, Labianca R, Meyerhardt
JA, Souglakos I, Yoshino T, Paul J, Sobrero A, Taieb J, Shields AF,
et al: The IDEA (International Duration Evaluation of Adjuvant
Chemotherapy) Collaboration: Prospective Combined Analysis of Phase
III Trials Investigating Duration of Adjuvant Therapy with the
FOLFOX (FOLFOX4 or Modified FOLFOX6) or XELOX (3 versus 6 months)
Regimen for Patients with Stage III Colon Cancer: Trial Design and
Current Status. Curr Colorectal Cancer Rep. 9:261–269. 2013.
View Article : Google Scholar : PubMed/NCBI
|
|
29
|
Basu A: The potential of protein kinase C
as a target for anticancer treatment. Pharmacol Ther. 59:257–280.
1993. View Article : Google Scholar : PubMed/NCBI
|
|
30
|
Kuranami M, Powell CT, Hug H, Zeng Z,
Cohen AM and Guillem JG: Differential expression of protein kinase
C isoforms in human colorectal cancers. J Surg Res. 58:233–239.
1995. View Article : Google Scholar : PubMed/NCBI
|
|
31
|
Suga K, Sugimoto I, Ito H and Hashimoto E:
Down-regulation of protein kinase C-alpha detected in human
colorectal cancer. Biochem Mol Biol Int. 44:523–528.
1998.PubMed/NCBI
|
|
32
|
Gwak J, Jung SJ, Kang DI, Kim EY, Kim DE,
Chung YH, Shin JG and Oh S: Stimulation of protein kinase C-alpha
suppresses colon cancer cell proliferation by down-regulation of
beta-catenin. J Cell Mol Med. 13:2171–2180. 2009. View Article : Google Scholar : PubMed/NCBI
|
|
33
|
Shimizu K, Goldfarb M, Perucho M and
Wigler M: Isolation and preliminary characterization of the
transforming gene of a human neuroblastoma cell line. Proc Natl
Acad Sci USA. 80:383–387. 1983. View Article : Google Scholar : PubMed/NCBI
|
|
34
|
Bos JL: Ras oncogenes in human cancer: A
review. Cancer Res. 49:4682–4689. 1989.PubMed/NCBI
|
|
35
|
Karapetis CS, Khambata-Ford S, Jonker DJ,
O'Callaghan CJ, Tu D, Tebbutt NC, Simes RJ, Chalchal H, Shapiro JD,
Robitaille S, et al: K-ras mutations and benefit from cetuximab in
advanced colorectal cancer. N Engl J Med. 359:1757–1765. 2008.
View Article : Google Scholar : PubMed/NCBI
|
|
36
|
Amado RG, Wolf M, Peeters M, Van Cutsem E,
Siena S, Freeman DJ, Juan T, Sikorski R, Suggs S, Radinsky R, et
al: Wild-type KRAS is required for panitumumab efficacy in patients
with metastatic colorectal cancer. J Clin Oncol. 26:1626–1634.
2008. View Article : Google Scholar : PubMed/NCBI
|
|
37
|
Dempke WC and Heinemann V: Ras mutational
status is a biomarker for resistance to EGFR inhibitors in
colorectal carcinoma. Anticancer Res. 30:4673–4677. 2010.PubMed/NCBI
|