Introduction
Globally, esophageal cancer is a highly common
malignancy associated with significant mortality, with ~6.5 billion
new cases and 400,200 mortalities in 2012 (1). In China, it has been ranked as the fifth
and fourth highest tumor type for incidence and mortality,
respectively (2). Esophageal squamous
cell carcinoma (ESCC) remains the major histological subtype in
China, accounting for 90% of newly diagnosed patients (3). When accompanied by low socioeconomic
status, active tobacco and alcohol abuse, malnutrition, pulmonary
comorbidities and secondary malignancies, the long-term survival
rate is poor and requires improvement (4). Despite the improvements in therapeutic
strategies, including surgical techniques and induction therapy,
prior to or following surgery, biomarkers for tailored multimodal
treatment with increased efficacy are required.
Protein tyrosine phosphatase non-receptor type 9
(PTPN9), also termed PTP-MEG2, is highly expressed in the brain,
leukocytes and endocrine cells and is a cytoplasmic phosphatase
that is hyperactivated in erythroid progenitors (5). PTPN9 is usually present in the cytoplasm
and cell membrane of the majority of cells (5,6). It is
unique among the protein tyrosine phosphatases due to its
N-terminal Sec 14p homology domain, which is able to activate the
enzyme of the phosphatase domain of PTPN9 via binding
phosphoinositides (7,8). PTPN9 is involved in numerous cellular
processes, including cell proliferation, differentiation and
migration through the regulation of signaling pathways (9). For example, it promotes secretory
vesicle fusion (10), mediates
insulin signaling in hepatocytes (11,12),
inhibits breast cancer cell growth (13–15) and
regulates endothelial cell function (16). However, the role of PTPN9 in ESCC
remains to be established.
MicroRNAs (miRNAs) are a class of highly conserved,
non-coding, small single-stranded RNAs of 22–25 nucleotides, which
have been reported to serve important roles in a number of types of
human disease (17,18). Due to their sequences being
complementary to specific sequences in transcripts, miRNAs
negatively regulate gene expression by altering mRNA abundance at
the post-transcriptional level, as well as allowing for
transcription modification. Located at chromosome 9q34.3, an intron
of EGF-like domain-containing protein 7 (EGFL7), miRNA (miR)-126 is
associated with various human tumors (19). Commonly exhibiting tumor suppressive
properties, miR-126 is expressed at a low level in numerous human
malignances, including lung cancer (20), colon cancer (21), breast cancer (22), osteosarcoma (23) and gastric cancer (24). Repression of cancer cell proliferation
(25), migration (26) and invasion (27) mediated by miR-126 can be achieved via
targeting specific oncogenes, including phospoinositide 3-kinase,
V-Ki-ras2 Kirsten rat sarcoma viral oncogene, EGFL7 and vascular
endothelial growth factor (VEGF). In addition, reduced levels of
miR-126 are an effective predictor of poor survival in patients
with cancer (20,28). A previous study indicated that miR-126
was able to negatively regulate erythropoietic development by
targeting PTPN9 (29). However, the
role of PTPN9 and the association between miR-126 and PTPN9 in ESCC
has, to the best of our knowledge, never been investigated.
Therefore, the present study aimed to investigate their potential
roles in the development of ESCC.
Materials and methods
Patients and specimens
In total, 84 patients with ESCC were included in the
present study. The inclusion criteria were as follows: i) Diagnosis
of ESCC with histopathological identification; ii) no treatment
received prior to surgery; iii) 7th edition of Union for
International Cancer Control tumor-node-metastasis (TNM)
classification system (30) was used
for staging the tumor; iv) limited or extended surgical history
including esophagectomy at the Department of Thoracic Surgery,
Henan Tumor Hospital (Zhengzhou, China) between January 2008 and
December 2009; v) detailed clinical records were available with
follow-up duration extending until May 10th, 2014; vi) tumor
specimens were frozen in liquid nitrogen and stored at −80°C
following surgical resection, in order to perform
immunohistochemistry (IHC). Specimens were obtained with the
informed consent of patients. The present study was approved by the
Ethics Committee of Henan Tumor Hospital. Post-surgical follow-up
was conducted every 3 months for the first 2 years, every 6 months
between the 3rd and 6th year, or until patient mortality. The
overall survival rate was calculated as the period between surgery
and the date of mortality or final observation.
Cell line and cell culture
Obtained from the Cell Bank of the Tumor Hospital of
the Chinese Academy of Medical Sciences (Beijing, China), the
Eca109 human ESCC cell line was cultured in RPMI-1640 supplemented
with 10% fetal bovine serum (FBS; both from Thermo Fisher
Scientific, Inc., Waltham, MA, USA) and 100 U/ml
penicillin-streptomycin at 37°C in an atmosphere containing 5%
CO2. Cells at the logarithmic growth phase were used for
subsequent experiments.
RNA oligonucleotides and cell
transfection
For the upregulation of miR-126 expression or the
knockdown of PTPN9, RNA oligonucleotides were synthesized by
Shanghai GenePharma, Ltd. (Shanghai, China). The sequences of the
miR-126 mimics were as follows: Forward,
5′-UCGUACCGUGAGUAAUAAUGCG-3′ and reverse,
5′-CAUUAUUACUCACGGUACGAUU-3′. The sequences of the PTPN9-siRNA were
as follows: Forward, 5′-GUGGACAGUUCAGUACAAUTT-3′ and reverse,
5′-AUUGUACUGAACUGUCCACTT-3′. The mock miRNA control sequences were
forward, 5′-UUCUCCGAACGUGUCACGUTT-3′ and reverse,
5′-ACGUGACACGUUCGGAGAATT-3′. Eca109 cells were treated with miR-126
mimics, mock, PTPN9-siRNA or equal amount of PBS (non-treated
group) using Lipofectamine® 2000 (Invitrogen; Thermo
Fisher Scientific, Inc.) in OptiMEM I Reduced Serum media (Thermo
Fisher Scientific, Inc.) at a final concentration of 100
pmol/106 cells in all experiments. Cells were incubated
with the complexes for 6 h prior to replacement of the medium. A
fluorescence microscope was used to evaluate the transfection
efficiency.
Reverse transcription-quantitative
polymerase chain reaction (RT-qPCR)
Total RNA was extracted using TRIzol®
Reagent (Invitrogen; Thermo Fisher Scientific, Inc.). Reverse
transcription and real-time PCR for miRNAs were conducted using the
SYBR Green Hairpin-it™ miRNAs qPCR quantitation kit (Shanghai
GenePharma, Ltd.) in 20 µl reaction mixtures, and the reaction was
performed on an ABI 7500 real-time PCR system (Applied Biosystems;
Thermo Fisher Scientific, Inc.). The DNA was denatured at 95°C for
3 min, followed by 40 amplification cycles consisting of 95°C for
12 sec and 62°C for 40 sec. The primers for quantitative PCR were
as follows: hsa-miR-126 forward, 5′-ACAGTTCTCTCGTACCGTGAGTAAT-3′;
reverse, 5′-AAAGGTTGATCTGCTCTCTCTCTC-3′; human RNU6 forward,
5′-ATTGGAACGATACAGAGAGATT-3′; reverse, 5′-GGAACGTTCACGAATTTG-3′.
The gene expression threshold cycle values of miRNAs were
calculated by normalizing to the level of human U6 small nuclear
RNA in the reaction.
For the analysis of mRNA, the SYBR Green RT-qPCR kit
(Shanghai GenePharma, Inc.) was used for cDNA synthesis and qPCR
according to the manufacturer's protocol. β-actin was used as an
internal control and oligo (dT) was the common primer for reverse
transcription. The sequences of the primers used for qPCR are as
follows: PTPN9 forward, 5′-ATGTGCTCCGTGCCATAGAATTG-3′; reverse,
5′-GAGGATCTGAGAACGAAGAGGTTCC-3′; β-actin forward,
5′-TCTGGCACCACACCTTCTAC-3′; reverse, 5′-GATAGCACAGCCTGGATAGC-3′.
The thermocycler settings were the same as described previously.
The 2−ΔΔCq method (31)
was used for data analysis.
IHC and western blot analysis
Immunohistochemistry was performed as previously
described (32). Rabbit anti-human
PTPN9 antibody (dilution, 1:50; cat. no., sc-130859; Santa Cruz
Biotechnology, Inc., USA) was used as the primary antibody,
followed by a peroxidase-conjugated goat anti-rabbit secondary
antibody (dilution, 1:200; cat. no., AB10058; Sangon Biotech Co.,
Ltd., Shanghai, China). Any intensity of cell membrane and
cytoplasmic staining was considered a positive stain for PTPN9.
Positive expression of protein was considered if the percentage of
stained cells was ≥10%. IHC results were further evaluated at
high-power magnification (×200) once regions containing positive
immunoreactivity were identified with low-power magnification (×40)
using an optical microscope (BX41; Olympus Corporation, Tokyo,
Japan). The section was examined by two pathologists
individually.
Protein lysates were lysed on ice in cold
radioimmunoprecipitation assay buffer containing a protease
inhibitor cocktail (Pierce; Thermo Fisher Scientific, Inc.),
according to the manufacturer's protocol. The protein concentration
was determined using a bicinchoninic acid assay with a BCA protein
assay kit (Beyotime Institute of Biotechnology, Haimen, China),
equivalent amounts of protein (34 ug) were separated by SDS-PAGE on
a 10% gel and blotted onto polyvinylidene fluoride membrane
(Bio-Rad Laboratories, Inc., Hercules, CA, USA). Following blocking
with 5% non-fat milk in Tris-buffered saline containing 0.1%
Tween-20 for 2 h at room temperature, the membranes were probed
with primary antibodies against PTPN9, as previously described
(dilution, 1:200), and β-actin (dilution, 1:5,000; cat. no.,
ab8227; Abcam, Cambridge, UK) at 4°C overnight. The bands were
visualized using an enhanced chemiluminescence western blotting
substrate (Thermo Fisher Scientific, Inc.), following incubation
with the previously described secondary antibody (dilution,
1:5,000) for 2 h at room temperature. The internal control β-actin
was used for normalization. Protein bands were quantified using
FluorChem FC3 AlphaView software (version 2.0; ProteinSimple, San
Jose, CA, USA).
Prediction of miRNA targets
PicTar (http://pictar.mdc-berlin.de/), Targetscan (http://www.targetscan.org/) and Microcosm Targets
(http://www.ebi.ac.uk/enright-srv/microcosm/htdocs/targets/v5/)
were searched to predict potential targets for miR-126. The
3′-untranslated region of PTPN9 mRNA (RefSeq NM_002833) was
identified as containing a putative miRNA-126 binding site.
Cell proliferation assay
The miR-126 mimic, mock control and PTPN9-siRNA were
transfected into Eca109 cells at a concentration of 100
pmol/106 cells. A total of 24 h later, following
trypsinization, cells were counted and seeded into 96-well plates
(5×10³ cells/well) in quadruplicate. Cell proliferation
was monitored at 5, 24, 48, 72 and 96 h following transfection
using the Cell Counting Kit-8 (Dojindo Molecular Technologies,
Inc., Kumamoto, Japan), according to the manufacturer's protocol.
The number of cells was evaluated through measurement of absorbance
at 450 nm using a Wellscan MK-3 (Labsystems Dragon, Helsinki,
Finland).
Transwell cell invasion assay
Transwell inserts coated with Matrigel (Corning
Incorporated, Corning, NY, USA) were used for a cell invasion
assay. Cells transfected with miR-126 mimics, mock controls and
PTPN9-siRNA for 24 h were detached and resuspended in serum-free
medium. A 200 µl suspension containing 5×10⁴ cells was
added to the upper insert. RPMI-1640 containing 20% FBS was added
to the lower wells in the 6-well cell culture plate as a
chemoattractant. Following a 24-h incubation, cells were fixed in
4% paraformaldehyde for 15 min and stained with 1% crystal violet
for 10 min at room temperature. The cells on the upper surface of
filter were wiped off with a cotton swab and invaded cells on the
lower surface of the membrane were visualized with an optical
microscope in 5 fields of view at ×200 magnification.
Cell apoptosis analysis
At 48 h following transfection, cells were washed
and resuspended in binding buffer at a final concentration of
1×10⁶ cells/ml, and 100 µl cell suspension was incubated
with 10 µl Annexin V-fluorescein isothiocyanate (FITC) and 5 µl
propidium iodide (PI) in the dark for 15 min using the Annexin
V-FITC kit (Miltenyi Biotec GmbH, Bergisch Gladbach, Germany),
according to the manufacturer's protocol. The stained cells were
analyzed using flow cytometry (FACSCalibur™; BD
Biosciences, Franklin Lakes, NJ, USA). Annexin V-FITC-positive and
PI-negative staining was indicative of cells undergoing early
apoptosis, and the percentage of apoptotic cells of each group was
compared.
Statistical analysis
Quantitative data were expressed as the mean ±
standard deviation and were statistically analyzed by t-test.
Pearson's χ2 test was used to analyze the association
between PTPN9 expression levels and the clinicopathological
features of ESCC specimens. Survival curves were calculated using
the Kaplan-Meier method, and compared using the Log-rank test. The
influence of each clinicopathological parameter on survival was
assessed through multivariate regression analysis with the Cox
proportional hazards regression model. A Wald test was used to test
the association of each variable in Table II with overall survival. All data
were analyzed using SPSS software (17.0; SPSS, Inc., Chicago, IL,
USA). P<0.05 was considered to indicate a statistically
significant difference.
 | Table II.Association between PTPN9 Expression
and clinicopathological features in patients with ESCC. |
Table II.
Association between PTPN9 Expression
and clinicopathological features in patients with ESCC.
|
|
| PTPN9
expression |
|
|---|
|
|
|
|
|
|---|
| Features | No of patients | Positive, n=31
(%) | Negative, n=53
(%) |
P-valuea |
|---|
| Age, years |
|
|
|
|
|
≤60 | 49 | 16 (32.7) | 33 (67.3) | 0.339 |
|
>60 | 35 | 15 (42.9) | 20 (57.1) |
|
| Sex |
|
|
|
|
|
Male | 58 | 21 (36.2) | 37 (63.8) | 0.834 |
|
Female | 26 | 10 (38.5) | 16 (61.5) |
|
| Tumor location |
|
|
|
|
|
Upper | 12 | 5 (41.7) | 7 (58.3) | 0.418 |
|
Middle | 58 | 23 (39.7) | 35 (60.3) |
|
|
Lower | 14 | 3 (21.4) | 11 (78.6) |
|
| Maximum tumor
size |
|
|
|
|
| ≤3 | 51 | 22 (43.1) | 29 (56.9) | 0.141 |
|
>3 | 33 | 9 (27.3) | 24 (72.7) |
|
|
Differentiation |
|
|
|
|
|
Poor | 28 | 15 (53.6) | 13 (46.4) | 0.058 |
|
Moderate | 37 | 12 (32.4) | 25 (67.6) |
|
|
Well | 19 | 4 (21.1) | 15 (78.9) |
|
| T
classification |
|
|
|
|
|
T1+T2 | 39 | 9 (23.1) | 30 (76.9) | 0.014 |
|
≥T3 | 45 | 22 (48.9) | 23 (51.1) |
|
| N
classification |
|
|
|
|
|
Yes | 27 | 16 (59.3) | 11 (40.7) | 0.003 |
| No | 57 | 15 (26.3) | 42 (73.7) |
|
| TNM stage |
|
|
|
|
|
I+II | 64 | 17 (26.6) | 47 (73.4) | 0.001 |
|
>III | 20 | 14 (70.0) | 6 (30.0) |
|
| Postoperative
chemotherapy |
|
|
|
|
|
Yes | 34 | 11 (32.4) | 23 (67.6) | 0.476 |
| No | 50 | 20 (40.0) | 30 (60.0) |
|
| Postoperative
recurrence |
|
|
|
|
|
Yes | 9 | 4 (44.4) | 5 (55.6) | 0.896 |
| No | 75 | 27 (36.0) | 48 (64.0) |
|
Results
PTPN9 overexpression in ESCC
specimens
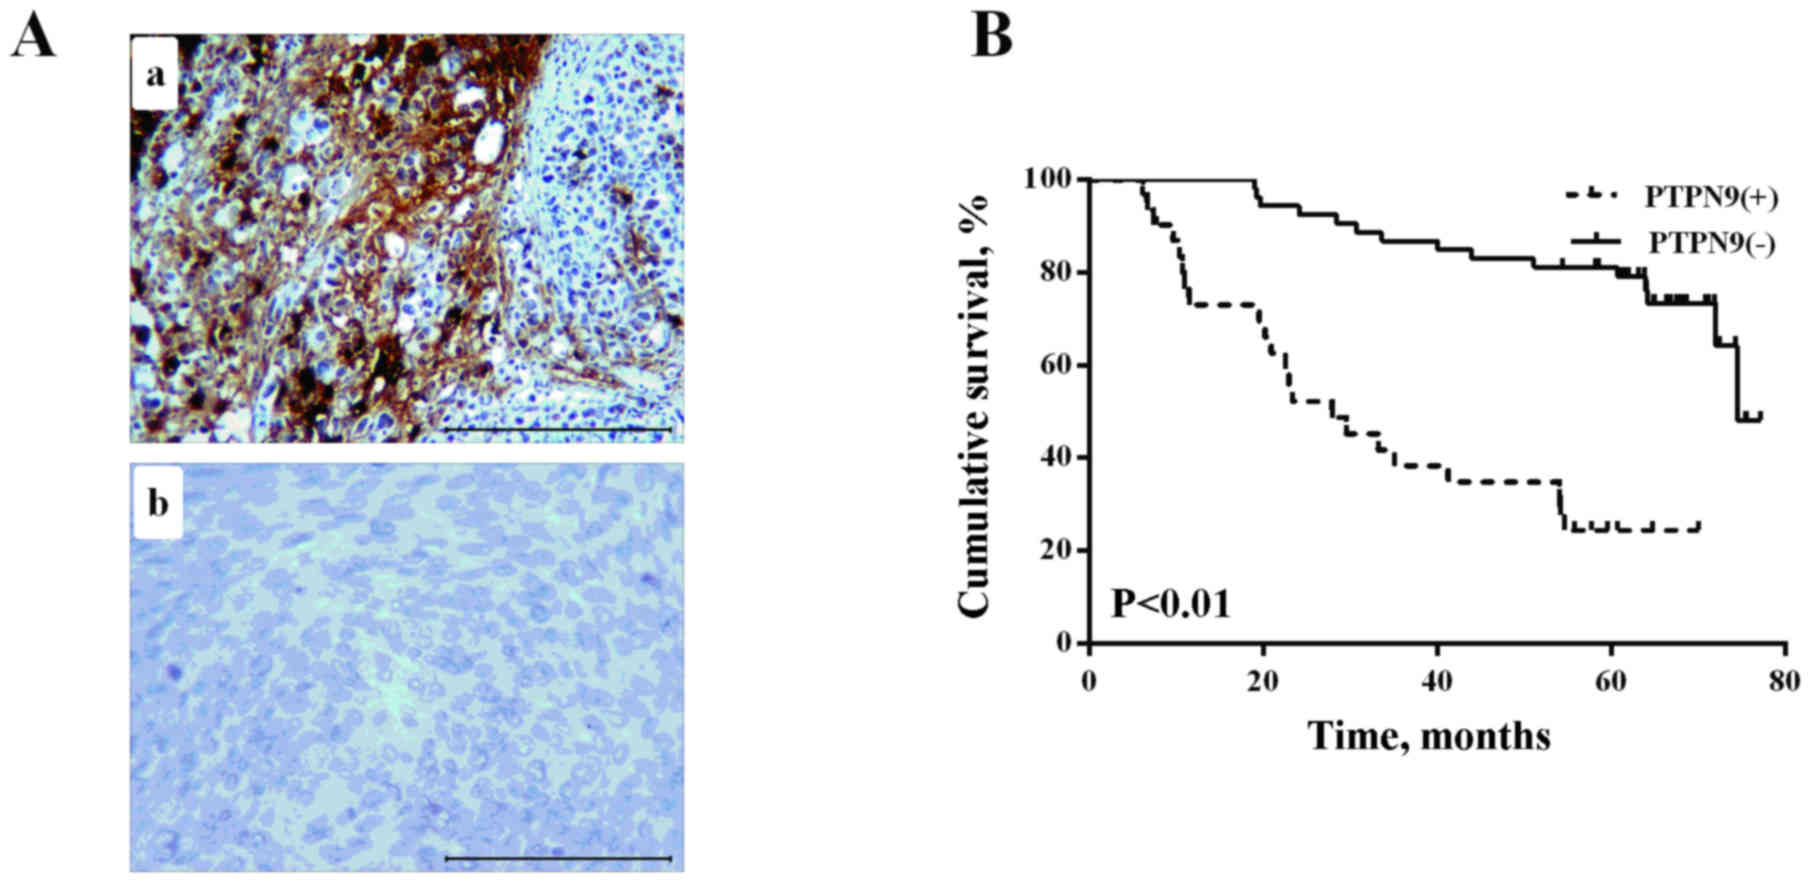
A total of 84 ESCC specimens were obtained for an
IHC assay to analyze the expression of PTPN9 in ESCC. The data
revealed that positive PTPN9 staining was observed in 36.9% (31/84)
of tumor tissues, and in 16.7% of normal specimens (5/30; Table I), suggesting that the positive rate
of PTPN9 in tumor specimens was increased compared with healthy
tissues (Fig. 1A).
| Table I.Expression of PTPN9 protein in
patients with ESCC. |
Table I.
Expression of PTPN9 protein in
patients with ESCC.
|
|
| PTPN9
expression |
|
|---|
|
|
|
|
|
|---|
| Group | No. of
patients | Positive (%) | Negative (%) | P-value |
|---|
| Tumor tissue | 84 | 31 (36.9) | 53 (63.1) | 0.041 |
| Normal tissue | 30 | 5 (16.7) | 25 (83.3) |
|
PTPN9 protein expression and
clinicopathological features of ESCC
The association between PTPN9 expression levels and
patient clinicopathological features is presented in Table II. According to the expression levels
of PTPN9 protein, clinical data were divided into two groups, the
PTPN9-positive and PTPN9-negative staining group. As presented in
Table II, PTPN9 was overexpressed in
patients with increased T classification (P=0.014), N
classification (P=0.003) and TNM stage (P<0.001). No significant
association was detected between PTPN9 expression levels and other
clinicopathological features, including patient age, sex and tumor
location (Table II).
PTPN9 expression is negatively
correlated with the survival time of patients with ESCC
The median follow-up time was 60.7 months (range,
6.1–77.17), Kaplan-Meier analysis survival curves revealed that
patients with PTPN9-negative expression had a longer overall
survival compared with PTPN9-positive group (log-rank test,
P<0.01; Fig. 1B). The results of
multivariate Cox proportional hazards regression analysis
demonstrated that PTPN9 protein expression, differentiation, TNM
stage, postoperative chemotherapy and postoperative recurrence were
independent prognostic markers for patients with ESCC (Table III).
| Table III.Multivariate analysis of PTPN9
expression status with regard to OS in patients with ESCC. |
Table III.
Multivariate analysis of PTPN9
expression status with regard to OS in patients with ESCC.
|
| OS |
|---|
|
|
|
|---|
| Variables | β | SE | Wald | HR (95% CI) | P-value |
|---|
|
Differentiation | −0.734 | 0.285 | 6.610 | 0.480
(0.274–0.840) | 0.010 |
| TNM stage | 1.536 | 0.367 | 17.487 | 4.646
(2.261–9.543) | 0.001 |
| PTPN9, positive vs.
negative | 1.087 | 0.388 | 7.867 | 2.967
(1.388–6.342) | 0.005 |
| Postoperative
chemotherapy | 1.102 | 0.511 | 4.464 | 3.010
(1.105–8.196) | 0.031 |
| Postoperative
recurrence | −1.465 | 0.432 | 11.497 | 0.231
(0.099–0.539) | 0.001 |
PTPN9 protein expression level, and
not mRNA level, is altered with the upregulation of miR-126
expression
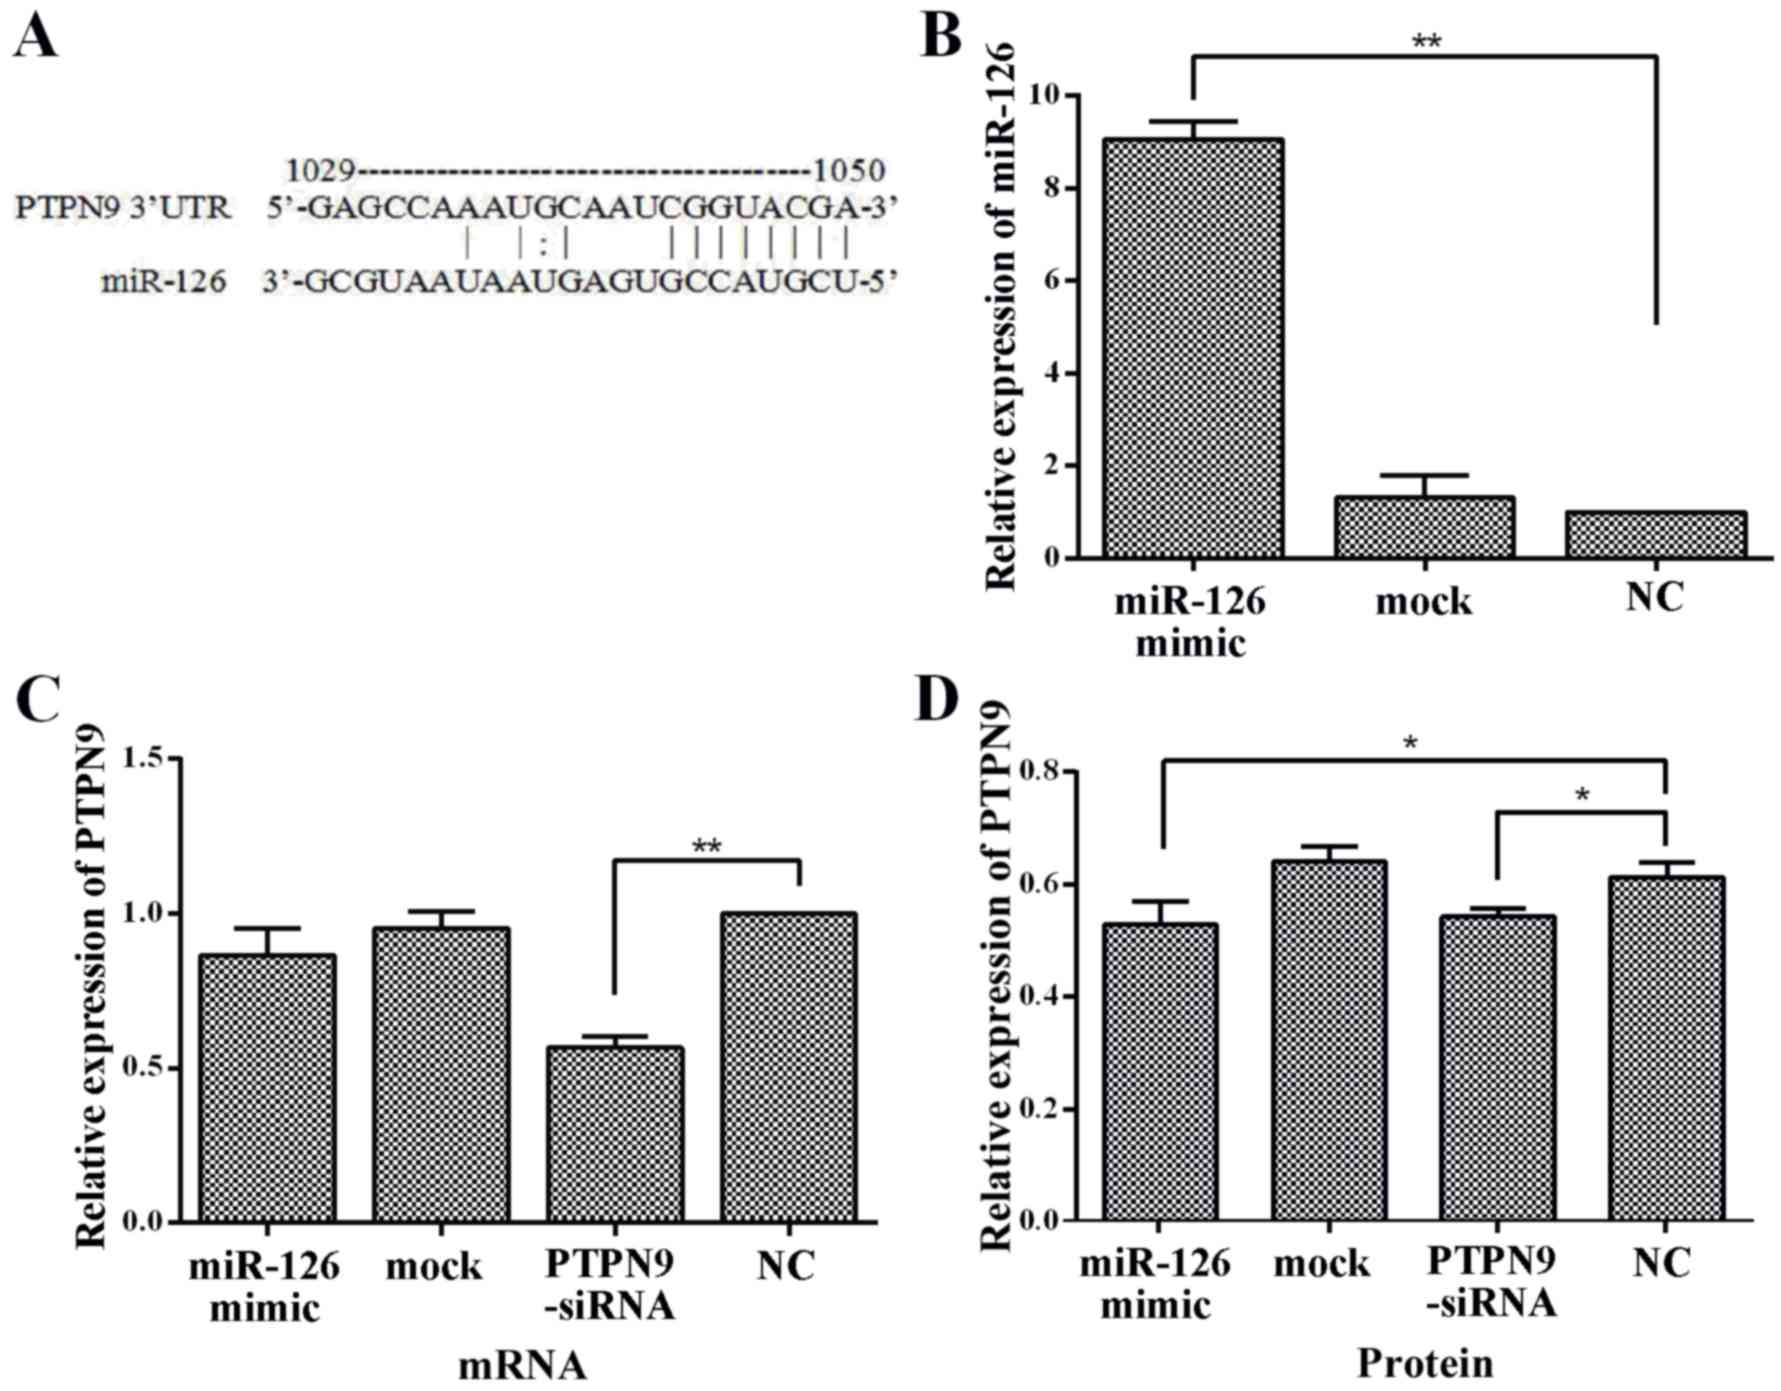
As PTPN9 was identified as a putative target for
miR-126 (Fig. 2A), it was assessed
whether miR-126 regulates endogenous PTPN9 expression by
transfecting an miR-126 mimic into Eca109 cells. miR-126 and PTPN9
mRNA expression levels were assessed with RT-qPCR. Following
transfection, the expression level of miR-126 was ~9-fold higher
compared with the NC group (Fig. 2B).
A decreasing trend in PTPN9 mRNA expression level in cells
transfected with miR-126 mimics was observed; however, it was not
statistically significant (Fig.
2C).
The expression of PTPN9 protein level was also
observed in Eca109 cells transfected with miR-126 mimics. An
increase of miR-126 level was significantly associated with a
decrease in PTPN9 protein expression level as determined by western
blot (P<0.05; Fig. 2D). No
significant differences were observed in the expression of PTPN9
mRNA, miR-126 and PTPN9 protein expression between the mock and NC
groups (Fig. 2B, C and D). Taken
together, these results indicated that PTPN9 was targeted by
miR-126 and the expression of PTPN9 in Eca109 cells was negatively
regulated by miR-126.
PTPN9 depletion inhibits cell
proliferation and invasion in Eca109 cells, but has no effect on
apoptosis
PTPN9-siRNA was used for inhibiting the expression
of PTPN9 to assess its effect on ESCC cells. In the PTPN9-siRNA
group, the expression level of PTPN9 was ~50% lower compared with
the NC group, as detected using RT-qPCR (Fig. 2C). CCK-8 and Transwell assays as well
as flow cytometry were used to examine the impacts of PTPN9 on cell
proliferation, invasion and apoptosis in Eca109 cells. The results
revealed that the knockdown of PTPN9 significantly inhibited cell
proliferation at 48 (P<0.05), 72 (P<0.01) and 96 h
(P<0.01) after transfection (Fig.
3A). A decrease in the number of cells migrating through the
Matrigel was also observed (Fig. 3B and
C). However, no significant difference in apoptotic rate was
identified between any two groups (Fig.
3D and E). These results indicated that PTPN9 may serve an
important role in the cell proliferation and invasion of ESCC.
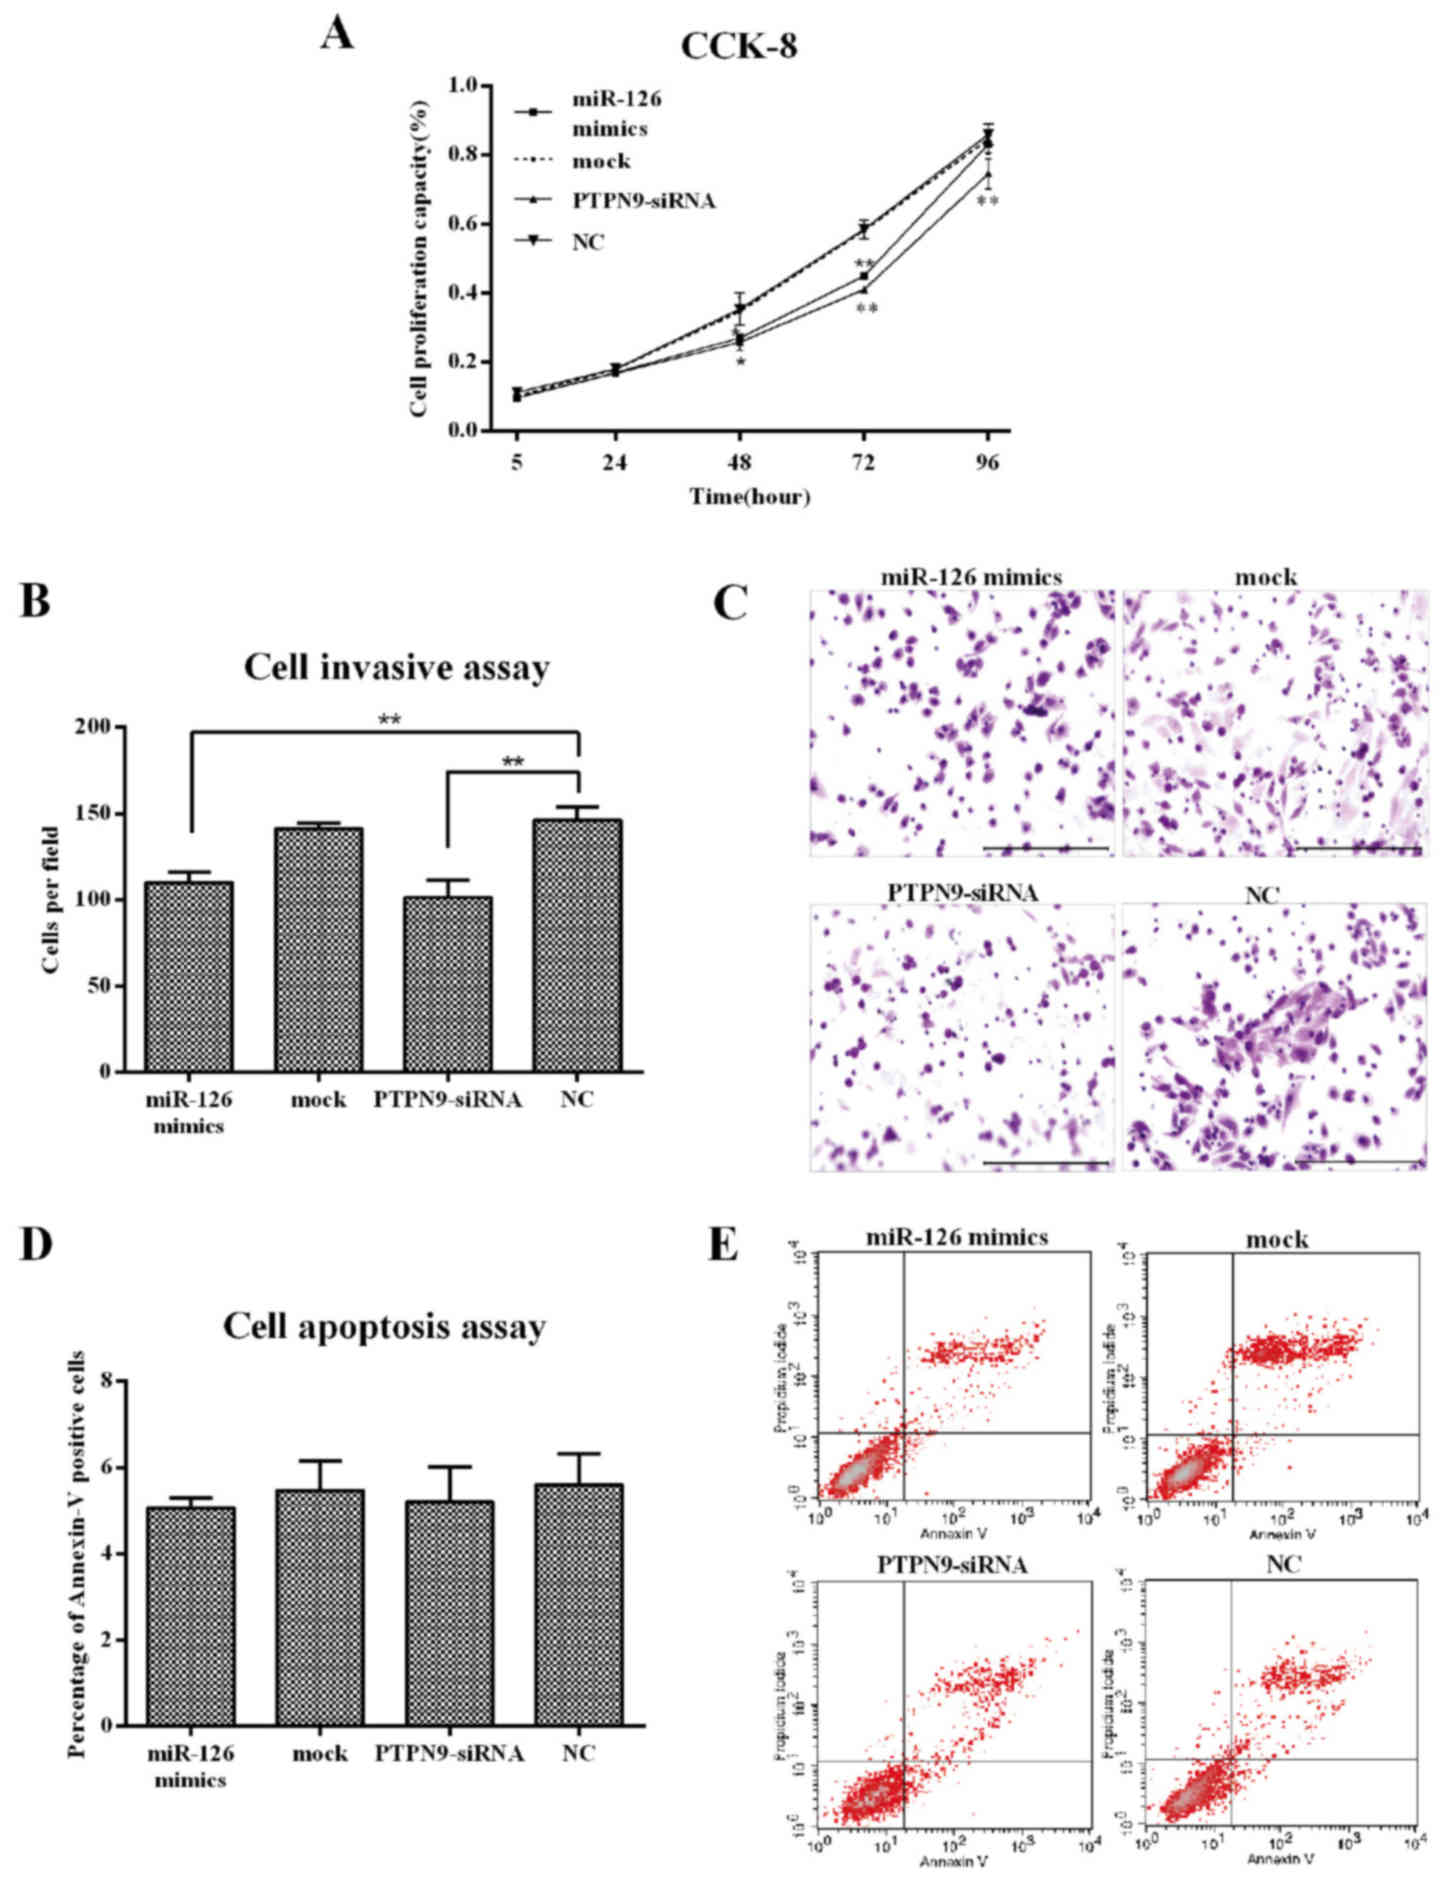 | Figure 3.Knockdown of PTPN9 inhibited ESCC cell
proliferation and invasion, but not apoptosis. (A) CCK-8 analysis
of Eca109 cell growth following transfection with PTPN9-siRNA, mock
control or miR-126 mimics. *P<0.05, **P<0.01 compared with
NC. (B) Quantification of invasion data. **P<0.01. (C) Transwell
analysis of Eca109 cell invasion following transfection with
PTPN9-siRNA, mock control or miR-126 mimics (stained with crystal
violet). Scale bar, 100 µm. (D) Quantification of apoptosis data.
(E) Apoptotic analysis of Eca109 cells using flow cytometry
following transfection with PTPN9-siRNA, mock control and miR-126
mimics. miR-126, microRNA-126; ESCC, esophageal squamous cell
carcinoma; PTPN9, protein tyrosine phosphatase, non-receptor type
9; CCK-8, cell counting kit-8; siRNA, small interfering RNA; NC,
negative control; UTR, untranslated region. |
Discussion
Esophageal cancer is a global health challenge, with
5-year overall survival ranging between 15 and 35% (33). Therefore, novel molecular markers used
to predict the progression and prognosis of ESCC are required. In
the last few years, a number of studies have revealed that a
variety of human diseases are associated with aberrant expression
of PTPN9 (34,35). However, the role of PTPN9 in ESCC
remains to be elucidated. The present study revealed that the
protein expression rate of PTPN9 is increased in ESCC specimens
compared with healthy esophageal tissues using IHC analysis.
Furthermore, the protein levels of PTPN9 were associated with
various clinicopathological parameters, including T classification,
N classification and TNM stage. Multivariate Cox regression
analyses revealed that PTPN9 is an independent prognostic predictor
for patients with ESCC.
A previous study indicated that knockdown of PTPN9
in the liver of diabetic mice was able to lead to insulin
sensitization and normalization of hyperglycemia (12). In addition, it has been demonstrated
that PTPN9 is able to negatively regulate the VEGF-induced cell
signal through inhibition of the phosphorylation of VEGF receptor 2
on Tyr1175 in endothelial cells (16). Furthermore, it has been reported that
PTPN9 is able to inhibit ErbB2 and epidermal growth factor receptor
(EGFR) signaling by dephosphorylating ErbB2/EGFR to impair growth
and invasiveness in breast cancer cells (13), supported by the results of Du et
al (15). In the present study,
PTPN9 was observed to be overexpressed in ESCC specimens, compared
with healthy esophageal tissues, indicating that PTPN9 may be an
oncogene during the development of ESCC. To evaluate this
hypothesis, the PTPN9 depletion cell model was constructed
following transfection of PTPN9-siRNA into the Eca109 ESCC cell
line. As expected, cell proliferation and invasion was
significantly suppressed upon the knockdown of PTPN9.
A number of previous studies have demonstrated that
aberrant expression of miRNAs serves a key role in the tumorigenic
process (26,36). Therefore, an improved understanding of
the underlying mechanisms of these non-coding RNAs may improve
technologies for the diagnosis and treatment of human diseases. A
previous study reported that miR-126 was able to regulate PTPN9 in
the hematopoietic differentiation of human embryonic stem cells at
the post-transcriptional level (29).
Frequently described as a tumor suppressor in a number of studies,
miR-126 was observed to be downregulated in ESCC tissues and cell
lines (32,37–39).
However, the interaction between miR-126 and PTPN9 in the process
of ESCC remains to be established. In the present study, using the
miRNA target prediction program, a putative miR-126 binding site
was identified within the 3′UTR of PTPN9, suggesting that PTPN9 may
be a target of miR-126. The present study also revealed that
ectopic expression of miR-126 reduced the levels of PTPN9, and
inhibited the growth and invasion of Eca109 cells, similar to the
results from the PTPN9-siRNA group. These results indicate that
miR-126 may be an important component of the signal pathway induced
by PTPN9 in ESCC.
However, the present study has certain limitations.
The sample size of patients with ESCC was relatively small;
therefore, studies with a larger sample size may be conducted in
order to further identify the prognostic impact of each
clinicopathological factor on survival time at various clinical
stages. In addition, a dual-luciferase reporter assay may be used
to examine the direct targets of PTPN9.
In conclusion, the present study demonstrated that
PTPN9 expression levels are associated with T classification, N
classification and TNM stage, and may represent a useful prognostic
marker for patients with ESCC. Through being regulated by miR-126,
downregulation of PTPN9 may inhibit growth and decrease the
invasive capacity of ESCC cells, indicating that PTPN9 may be a
promising molecular therapeutic target for ESCC in the future.
Acknowledgements
The present study was supported by the Research Fund
of the National Key Clinical Specialty of China and the Innovation
Foundation of Excellent Intellectuals of Henan Province (grant no.
20070214).
References
|
1
|
Torre LA, Bray F, Siegel RL, Ferlay J,
Lortet-Tieulent J and Jemal A: Global cancer statistics, 2012. CA
Cancer J Clin. 65:87–108. 2015. View Article : Google Scholar : PubMed/NCBI
|
|
2
|
Chen WQ, Zheng RS, Zhang SW, Zeng HM and
Zou XN: The incidences and mortalities of major cancers in China,
2010. Chin J Cancer. 33:402–405. 2014.PubMed/NCBI
|
|
3
|
Lin Y, Totsuka Y, He Y, Kikuchi S, Qiao Y,
Ueda J, Wei W, Inoue M and Tanaka H: Epidemiology of esophageal
cancer in Japan and China. J Epidemiol. 23:233–242. 2013.
View Article : Google Scholar : PubMed/NCBI
|
|
4
|
Matsushima K, Isomoto H, Kohno S and Nakao
K: MicroRNAs and esophageal squamous cell carcinoma. Digestion.
82:138–144. 2010. View Article : Google Scholar : PubMed/NCBI
|
|
5
|
Kruger JM, Fukushima T, Cherepanov V,
Borregaard N, Loeve C, Shek C, Sharma K, Tanswell AK, Chow CW and
Downey GP: Protein-tyrosine phosphatase MEG2 is expressed by human
neutrophils. Localization to the phagosome and activation by
polyphosphoinositides. J Biol Chem. 277:2620–2628. 2002. View Article : Google Scholar : PubMed/NCBI
|
|
6
|
Xu MJ, Sui X, Zhao R, Dai C, Krantz SB and
Zhao ZJ: PTP-MEG2 is activated in polycythemia vera erythroid
progenitor cells and is required for growth and expansion of
erythroid cells. Blood. 102:4354–4360. 2003. View Article : Google Scholar : PubMed/NCBI
|
|
7
|
Huynh H, Wang X, Li W, Bottini N, Williams
S, Nika K, Ishihara H, Godzik A and Mustelin T: Homotypic secretory
vesicle fusion induced by the protein tyrosine phosphatase MEG2
depends on polyphosphoinositides in T cells. J Immunol.
171:6661–6671. 2003. View Article : Google Scholar : PubMed/NCBI
|
|
8
|
Krugmann S, Anderson KE, Ridley SH, Risso
N, McGregor A, Coadwell J, Davidson K, Eguinoa A, Ellson CD, Lipp
P, et al: Identification of ARAP3, a novel PI3K effector regulating
both Arf and Rho GTPases, by selective capture on phosphoinositide
affinity matrices. Mol Cell. 9:95–108. 2002. View Article : Google Scholar : PubMed/NCBI
|
|
9
|
Zhang D, Marlin MC, Liang Z, Ahmad M,
Ashpole NM, Sonntag WE, Zhao ZJ and Li G: The protein tyrosine
phosphatase MEG2 regulates the transport and signal transduction of
tropomyosin receptor kinase A. J Biol Chem. 291:23895–23905. 2016.
View Article : Google Scholar : PubMed/NCBI
|
|
10
|
Huynh H, Bottini N, Williams S, Cherepanov
V, Musumeci L, Saito K, Bruckner S, Vachon E, Wang X, Kruger J, et
al: Control of vesicle fusion by a tyrosine phosphatase. Nat Cell
Biol. 6:831–839. 2004. View
Article : Google Scholar : PubMed/NCBI
|
|
11
|
Cho CY, Koo SH, Wang Y, Callaway S,
Hedrick S, Mak PA, Orth AP, Peters EC, Saez E, Montminy M, et al:
Identification of the tyrosine phosphatase PTP-MEG2 as an
antagonist of hepatic insulin signaling. Cell Metab. 3:367–378.
2006. View Article : Google Scholar : PubMed/NCBI
|
|
12
|
Zhang S, Liu S, Tao R, Wei D, Chen L, Shen
W, Yu ZH, Wang L, Jones DR, Dong XC and Zhang ZY: A highly
selective and potent PTP-MEG2 inhibitor with therapeutic potential
for type 2 diabetes. J Am Chem Soc. 134:18116–18124. 2012.
View Article : Google Scholar : PubMed/NCBI
|
|
13
|
Yuan T, Wang Y, Zhao ZJ and Gu H:
Protein-tyrosine phosphatase PTPN9 negatively regulates ErbB2 and
epidermal growth factor receptor signaling in breast cancer cells.
J Biol Chem. 285:14861–14870. 2010. View Article : Google Scholar : PubMed/NCBI
|
|
14
|
Su F, Ren F, Rong Y, Wang Y, Geng Y, Wang
Y, Feng M, Ju Y, Li Y, Zhao ZJ, et al: Protein tyrosine phosphatase
Meg2 dephosphorylates signal transducer and activator of
transcription 3 and suppresses tumor growth in breast cancer.
Breast Cancer Res. 14:R382012. View
Article : Google Scholar : PubMed/NCBI
|
|
15
|
Du WW, Fang L, Li M, Yang X, Liang Y, Peng
C, Qian W, O'Malley YQ, Askeland RW, Sugg SL, et al: MicroRNA
miR-24 enhances tumor invasion and metastasis by targeting PTPN9
and PTPRF to promote EGF signaling. J Cell Sci. 126:1440–1453.
2013. View Article : Google Scholar : PubMed/NCBI
|
|
16
|
Hao Q, Samten B, Ji HL, Zhao ZJ and Tang
H: Tyrosine phosphatase PTP-MEG2 negatively regulates vascular
endothelial growth factor receptor signaling and function in
endothelial cells. Am J Physiol Cell Physiol. 303:C548–C553. 2012.
View Article : Google Scholar : PubMed/NCBI
|
|
17
|
Hromadnikova I, Kotlabova K, Hympanova L
and Krofta L: Gestational hypertension, preeclampsia and
intrauterine growth restriction induce dysregulation of
cardiovascular and cerebrovascular disease associated microRNAs in
maternal whole peripheral blood. Thromb Res. 137:126–140. 2016.
View Article : Google Scholar : PubMed/NCBI
|
|
18
|
Gu L, Li H, Chen L, Ma X, Gao Y, Li X,
Zhang Y, Fan Y and Zhang X: MicroRNAs as prognostic molecular
signatures in renal cell carcinoma: A systematic review and
meta-analysis. Oncotarget. 6:32545–32560. 2015.PubMed/NCBI
|
|
19
|
Meister J and Schmidt MH: miR-126 and
miR-126*New players in cancer. ScientificWorldJournal.
10:2090–2100. 2010. View Article : Google Scholar : PubMed/NCBI
|
|
20
|
Shang AQ, Xie YN, Wang J, Sun L, Wei J, Lu
WY, Lan JY, Wang WW, Wang L and Wang LL: Predicative values of
serum microRNA-22 and microRNA-126 levels for non-small cell lung
cancer development and metastasis: A case-control study. Neoplasma.
64:2017.(Epub ahead of print). View Article : Google Scholar
|
|
21
|
Yuan W, Guo YQ, Li XY, Deng MZ, Shen ZH,
Bo CB, Dai YF, Huang MY, Yang ZY, Quan YS, et al: MicroRNA-126
inhibits colon cancer cell proliferation and invasion by targeting
the chemokine (C-X-C motif) receptor 4 and Ras homolog gene family,
member A, signaling pathway. Oncotarget. 7:60230–60244.
2016.PubMed/NCBI
|
|
22
|
Wang CZ, Yuan P and Li Y: MiR-126
regulated breast cancer cell invasion by targeting ADAM9. Int J
Clin Exp Pathol. 8:6547–6553. 2015.PubMed/NCBI
|
|
23
|
Jiang R, Zhang C, Liu G, Gu R and Wu H:
MicroRNA-126 inhibits proliferation, migration, invasion and EMT in
osteosarcoma by targeting ZEB1. J Cell Biochem. 2017.(Epub ahead of
print). View Article : Google Scholar
|
|
24
|
Wang J, Zhou Y, Fei X, Chen X, Yan J, Liu
B and Zhu Z: ADAM9 functions as a promoter of gastric cancer growth
which is negatively and post-transcriptionally regulated by
miR-126. Oncol Rep. 37:2033–2040. 2017.PubMed/NCBI
|
|
25
|
Zhu X, Li H, Long L, Hui L, Chen H, Wang
X, Shen H and Xu W: miR-126 enhances the sensitivity of non-small
cell lung cancer cells to anticancer agents by targeting vascular
endothelial growth factor A. Acta Biochim Biophys Sin (Shanghai).
44:519–526. 2012. View Article : Google Scholar : PubMed/NCBI
|
|
26
|
Png KJ, Halberg N, Yoshida M and Tavazoie
SF: A microRNA regulon that mediates endothelial recruitment and
metastasis by cancer cells. Nature. 481:190–194. 2011. View Article : Google Scholar : PubMed/NCBI
|
|
27
|
Li Z, Li N, Wu M, Li X, Luo Z and Wang X:
Expression of miR-126 suppresses migration and invasion of colon
cancer cells by targeting CXCR4. Mol Cell Biochem. 381:233–242.
2013. View Article : Google Scholar : PubMed/NCBI
|
|
28
|
Yue S, Shi H, Han J, Zhang T, Zhu W and
Zhang D: Prognostic value of microRNA-126 and CRK expression in
gastric cancer. Onco Targets Ther. 9:6127–6135. 2016. View Article : Google Scholar : PubMed/NCBI
|
|
29
|
Huang X, Gschweng E, van Handel B, Cheng
D, Mikkola HK and Witte ON: Regulated expression of
microRNAs-126/126* inhibits erythropoiesis from human embryonic
stem cells. Blood. 117:2157–2165. 2011. View Article : Google Scholar : PubMed/NCBI
|
|
30
|
Wittekind C: 2010 TNM system: On the 7th
edition of TNM classification of malignant tumors. Pathologe.
31:331–332. 2010. View Article : Google Scholar : PubMed/NCBI
|
|
31
|
Livak KJ and Schmittgen TD: Analysis of
relative gene expression data using real-time quantitative PCR and
the 2(−Delta Delta C(T)) method. Methods. 25:402–408. 2001.
View Article : Google Scholar : PubMed/NCBI
|
|
32
|
Li H, Meng F, Ma J, Yu Y, Hua X, Qin J and
Li Y: Insulin receptor substrate-1 and Golgi phosphoprotein 3 are
downstream targets of miR126 in esophageal squamous cell carcinoma.
Oncol Rep. 32:1225–1233. 2014.PubMed/NCBI
|
|
33
|
Arnal MJ Domper, Ferrández Arenas Á and
Lanas Arbeloa Á: Esophageal cancer: Risk factors, screening and
endoscopic treatment in Western and Eastern countries. World J
Gastroenterol. 21:7933–7943. 2015. View Article : Google Scholar : PubMed/NCBI
|
|
34
|
Hu B, Yan X, Liu F, Zhu C, Zhou H, Chen Y,
Liu J, Gu X, Ni R and Zhang T: Downregulated expression of PTPN9
contributes to human hepatocellular carcinoma growth and
progression. Pathol Oncol Res. 22:555–565. 2016. View Article : Google Scholar : PubMed/NCBI
|
|
35
|
Hong Y, Liang H, Uzair-Ur-Rehman, Wang Y,
Zhang W, Zhou Y, Chen S, Yu M, Cui S, Liu M, et al: miR-96 promotes
cell proliferation, migration and invasion by targeting PTPN9 in
breast cancer. Sci Rep. 6:374212016. View Article : Google Scholar : PubMed/NCBI
|
|
36
|
Rupaimoole R, Calin GA, Lopez-Berestein G
and Sood AK: miRNA deregulation in cancer cells and the tumor
microenvironment. Cancer Discov. 6:235–246. 2016. View Article : Google Scholar : PubMed/NCBI
|
|
37
|
Nie ZC, Weng WH, Shang YS, Long Y, Li J,
Xu YT and Li Z: MicroRNA-126 is down-regulated in human esophageal
squamous cell carcinoma and inhibits the proliferation and
migration in EC109 cell via PI3K/AKT signaling pathway. Int J Clin
Exp Pathol. 8:4745–4754. 2015.PubMed/NCBI
|
|
38
|
Liu R, Gu J, Jiang P, Zheng Y, Liu X,
Jiang X, Huang E, Xiong S, Xu F, Liu G, et al: DNMT1-microRNA126
epigenetic circuit contributes to esophageal squamous cell
carcinoma growth via ADAM9-EGFR-AKT signaling. Clin Cancer Res.
21:854–863. 2015. View Article : Google Scholar : PubMed/NCBI
|
|
39
|
Liu SG, Qin XG, Zhao BS, Qi B, Yao WJ,
Wang TY, Li HC and Wu XN: Differential expression of miRNAs in
esophageal cancer tissue. Oncol Lett. 5:1639–1642. 2013.PubMed/NCBI
|