Introduction
Prostate cancer (PCa) is a common,
hormone-dependent, type of malignant tumor regularly observed in
men >60 years in the united states and european countries
(1,2).
However, the pathogenesis and mechanisms of progression remain
unclear. Previous studies have suggested that interactions between
the estrogen and androgen receptors and corresponding substrates
may be the pathogenic factors and risk factors in the origin and
progress of pca tumor formation (3–5). Estrogen
receptor beta (ERβ) is highly expressed within the differential
layer cells, and performs a secretory function. Due to high levels
of ERβ expression, the prostate is more likely to be affected by
environmental estrogen (6,7), which appears to explain the correlation
between the low incidence rate of pca and the high dietary
phytoestrogens in asian countries (8).
There is a marked correlation between ERβ expression
levels and the formation of PCa (8).
Results from previous studies have revealed that the expression
levels of ERβ and androgen receptors (AR) exhibited a downward and
upward trend, respectively, in PCa tissues with increasing degrees
of malignancy (3,9–13). It is
hypothesized that ERβ may curb the abnormal differentiation of
prostate epithelial cells via the downregulation of AR expression
levels. During PCa progression, the decreasing expression of ERβ
suggests that ERβ is involved in the inhibition of cell
proliferation. Therefore, the changing expression of ERβ, ERα and
AR may serve an important role in the pathogenesis of PCa (14). Previous studies have revealed that PCa
tissues are often accompanied by a variation in the expression of
ER and AR (9,10,15).
Conversely, Royuela et al (16) demonstrated that ERβ expression is
increased in normal prostate, prostate hyperplasia and PCa tissue.
Therefore, the present study aimed to detect the changes in the
expression levels of AR, ERβ and ERα in the PCa PC-3 cell lines, to
investigate the pathogenesis of PCa.
Materials and methods
Cell culture
The human PCa PC-3 cell line was obtained from the
Pathology department of the West China Hospital of Sichuan
University (Chengdu, China). The. PC-3 cells were grown and
maintained in high glucose Dulbecco's modified Eagle's medium
(DMEM; Thermo Fisher Scientific, Inc., Waltham, MA, USA)
supplemented with 10% fetal bovine serum (FBS; Thermo Fisher
Scientific, Inc.), 100 units/ml penicillin, and 100
µg/ml streptomycin. The cell lines were maintained in
humidified incubators with 5% CO2 at 37°C. Subsequent to
cell adhesion to the base of cell culture dish, cells were
subcultured into three equal dishes.
Cell counting and seeding
The PC-3 cells were seeded in 6-well tissue culture
dishes at a density of 175,000 cells/well in high glucose
DMEM supplemented with 10% FBS, and were maintained in humidified
incubators with 5% CO2 at 37°C for 48 h. Once the cells
covered between 80–90% of the base of the dish, the media were
discarded and the cells were washed twice with phosphate buffered
saline (PBS), A total of 2 ml/well medium, without
antibiotics and without FBS was then added to each well. All the
assays were carried out in triplicate.
Cell grouping and treatment
According to the different reagents added, the cells
were divided into pcDNA3.1-hERβ plasmid, the plasmid,
Lipofectamine® 2000 and PC-3 cells control groups. The
pcDNA3.1-hERβ plasmid, the blank plasmid and
Lipofectamine® 2000 were purchased from the Shanghai
GenePharma Company (Shanghai GenePharma Co. Ltd., Shanghai, China).
A total of 115 µl/well of the configured mixture of
pcDNA3.1-hERβ plasmid-Lipofectamine® 2000 was added into
the treated cell groups to induce transfection, following the
protocol of the manufacturer. Lipofectamine® 2000, blank
plasmids and DMEM were added to the remaining 3 groups. All of the
groups were maintained in humidified incubators with 5%
CO2 at 37°C for 4 h. The media were removed and the
cells were washed twice with PBS, then 2 ml/well high
glucose DMEM supplemented with 10% FBS was added. The cells were
cultured for an additional 48 h and harvested. All cell groups were
prepared in triplicate, and images were captured using an inverted
phase contrast microscope (TS100; Nikon Corporation, Tokyo,
Japan).
RNA isolation
The total RNA from all groups were isolated using
TRIzol reagent and (Invitrogen; Thermo Fisher Scientific, Inc.,
Waltham, MA, USA) according to the protocol of the manufacturer.
RNA samples were treated with DNase I (50 U/µl) (Thermo
Fisher Scientific, Inc.) prior to analysis. The content and purity
of the RNA was assayed with the DU 730 nucleic acid protein
analyzer (Beckman Coulter Inc., Brea, CA, USA), and measured
between 1.6 and 1.9 at A260/A280 nm. The amount of RNA was
estimated from the optical density at 260 nm. The total RNA was
then isolated and was used for qPCR analysis. The total RNA was
isolated from the PC-3 cells treated with the pcDNA3.1-hERβ
plasmid, the plasmid, Lipofectamine® 2000 and medium for
4 h, and reverse-transcribed into complementary (c)DNA. The cDNA
was used for TaqMan analysis according to the protocol of the
manufacturer. The PCR primers and TaqMan probes for AR, ERα and ERβ
were purchased from the Shanghai GenePharma Co., Ltd. GAPDH was
used as the internal control for normalization. The quantification
cycle (Cq) values were evaluated by the relative standard curve
method and normalized using the respective values of the internal
control.
RNA reverse transcribed into cDNA
The total RNA was reverse transcribed into cDNA
using SuperScript III First-Strand Synthesis SuperMix for RT-qPCR
(Invitrogen; Thermo Fisher Scientific, Inc.). Personal protective
equipment was used for all lab experiments to prevent from RNA
enzyme contamination. All cDNA samples were treated with diethyl
pyrocarbonate, and all reactions were prepared in PCR tubes without
the RNase enzyme. Table I lists the
components of the reaction mix used for reverse transcription (10
µl total) to generate cDNA using the Eppendorf Mastercycler nexus
PCR instrument (Eppendorf, Hamburg, Germany). The reaction was
incubated at 42°C for 30 min; the reverse transcriptase was
inactivated at 85°C for 10 min, and cooled to 5°C. When the reverse
transcription was completed, the configured cDNA products were
stored at −20°C for qPCR detection.
 | Table I.Reverse transcription polymerase chain
reaction. |
Table I.
Reverse transcription polymerase chain
reaction.
| Reaction reagent | Application amount
(µl) |
|---|
| Total RNA | 1 |
| 5x reverse
transcription buffer | 2 |
| Random hexamers (50
µm) | 0.5 |
| Oligo dT Primer (100
µm) | 0.5 |
| PrimeScript™ RT
Enzyme Mix I | 0.5 |
| DEPC water | 5.5 |
| Total volume | 10 |
Fluorescence qPCR
The cDNA was quantified by fluorescence qPCR using
the ABI 7300 real-time PCR System (Applied Biosystems; Thermo
Fisher Scientific, Inc.). The PCR primers and fluorescence probes
for AR (Gene ID: 367), ERα and ERβ (assay ID: Hs00174860_ml and
Hs00230957_ml, respectively) were purchased from Shanghai
GenePharma Co., Ltd. All sequences are summarized in Table I. The GAPDH (assay ID: No. 4352934E;
Shanghai GenePharma Co., Ltd.) was used as the internal control for
data normalization. The fluorescence qPCR reaction system was
configured according to the protocol of the manufacturer, as
summarized in Table II. Table III demonstrates the sequence
information of the oligonucleotide primers and probes used. The PCR
reaction was carried out according to the protocol of the
manufacturer. The cycles were as follows: 95°C for 1 min for prior
degeneration; 95°C for 12 sec and 62°C for 40 sec to measure
fluorescence, for 40 cycles. Each incident of mRNA expression of
the target genes was indicated with a standardized ΔΔCq value
(17). The obtained quantification
cycle values of the interest gene were evaluated by the relative
standard curve method and normalized using the respective values of
the internal control GAPDH.
| Table II.Real-time fluorescent quantitative
PCR. |
Table II.
Real-time fluorescent quantitative
PCR.
| Reaction reagent | Application amount
(µl) |
|---|
| Primers | 0.8 |
| 2x quantitative PCR
Master Mix | 10 |
| Fluorescent probe (10
µm) | 0.4 |
| cDNA template | 2 |
| Taq DNA polymerase (5
u/µl) | 0.4 |
| Double distilled
water | 6.4 |
| Total volume | 20 |
| Table III.Sequence information of
oligonucleotides and probes. |
Table III.
Sequence information of
oligonucleotides and probes.
| Gene |
Oligonucleotides | Sequence | Finished product
bp |
|---|
| hERA | F Primer |
GCAATGACTATGCTTCAGGCTAC | 131 |
|
| R Primer |
TTTATCAATGGTGCACTGGTTG |
|
|
| Probe |
ATGGAGTCTGGTCCTGTGAGGGCTG |
|
| hERB | F Primer |
CAAGCTCATCTTTGCTCCAGA | 150 |
|
| R Primer |
GCCTTGACACAGAGATATTCTTTG |
|
|
| Probe |
CTTGTTCTGGACAGGGATGAGGGGA |
|
| hAR | F Primer |
CATGTGGAAGCTGCAAGGTC | 99 |
|
| R Primer |
TTCGGAATTTATCAATAGTGCAATC |
|
|
| Probe |
TCAAAAGAGCCGCTGAAGGGAAACA |
|
| GAPDH | F Primer |
CGACCACTTTGTCAAGCTCA | 203 |
|
| R Primer |
AGGGGAGATTCAGTGTGGTG |
|
|
| Probe |
TCATCAGCAATGCCTCCTGCACCA |
|
Statistical analysis
IBM SPSS 19.0 (Armonk, NY, USA) for Windows was used
to establish the database and to conduct the statistical analysis.
All results are reported as the mean ± standard deviation, using
the independent samples t-test to detect the differences in each
test group and the control group. P<0.05 was considered to
indicate a statistically significant difference.
Results
Cell culture and plasmid
transfection
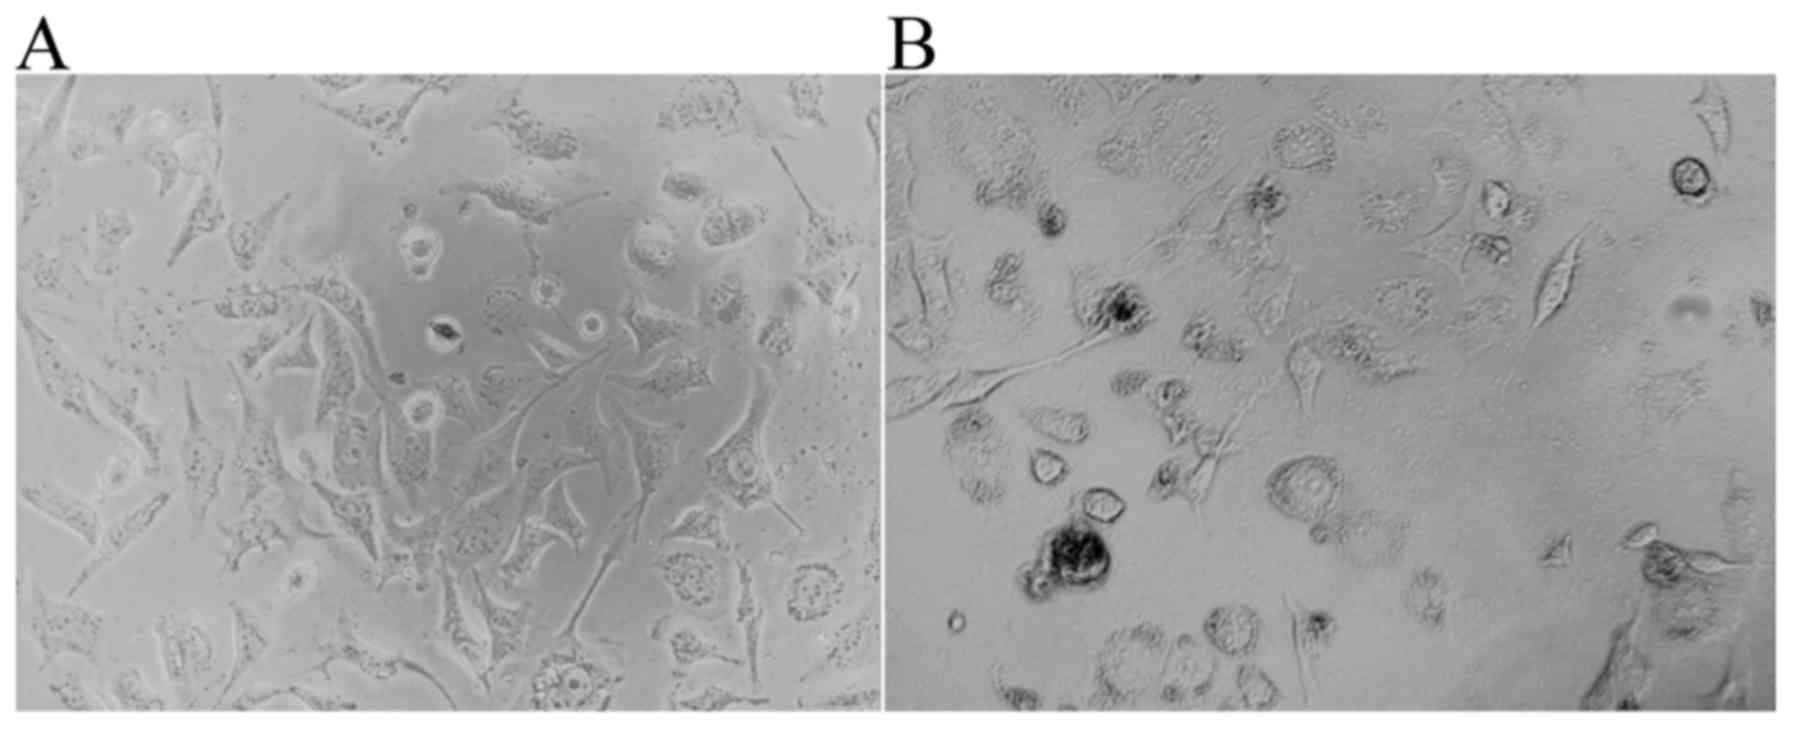
The PC-3 PCa cells cultured in high glucose DMEM
supplemented with 10% FBS are illustrated in Fig. 1A. Once the pcDNA3.1-hERβ-plasmid had
been transfected into the PC-3 cells, the cell-growth exhibited a
very poor status, namely a high level of apoptosis, small nuclei, a
reduced level of cytoplasm and few synapses were all observed
(Fig. 1B).
Expression of AR, ERβ and ERα
Through the fluorescent qPCR, the patterns of
expression levels of the mRNA of ERβ, ERα and AR were assayed in
the recombinant plasmid, the empty plasmid, lipofectamine-2000 and
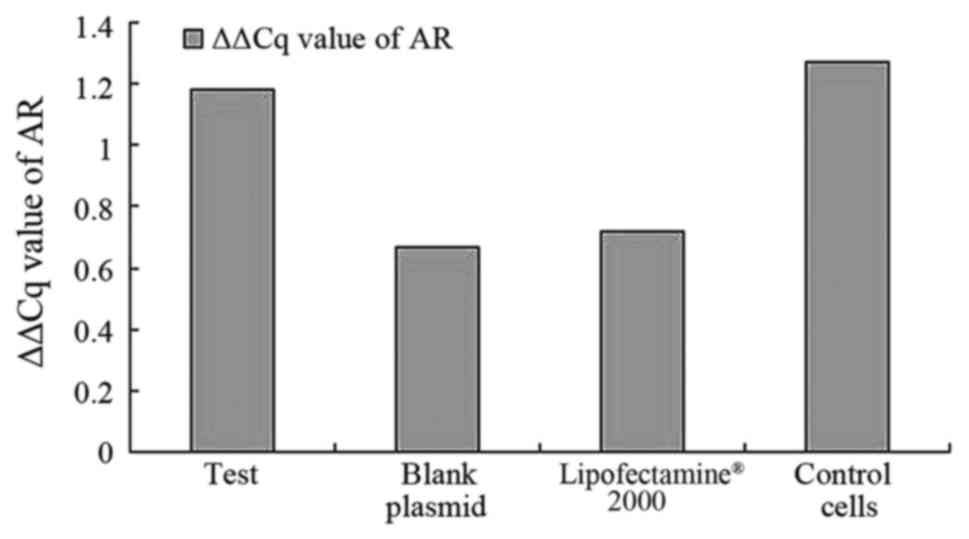
the control groups. As demonstrated in Fig. 2, the results suggest that AR mRNA was
expressed in all cell samples and expression of AR could be
detected in all samples when compared with the blank plasmid group
and blank cells. No difference was observed in the levels of
expression of AR (pcDNA3.1-hERβ-plasmid transfection vs. PC-3 cell
group, P=0.889) between all groups.
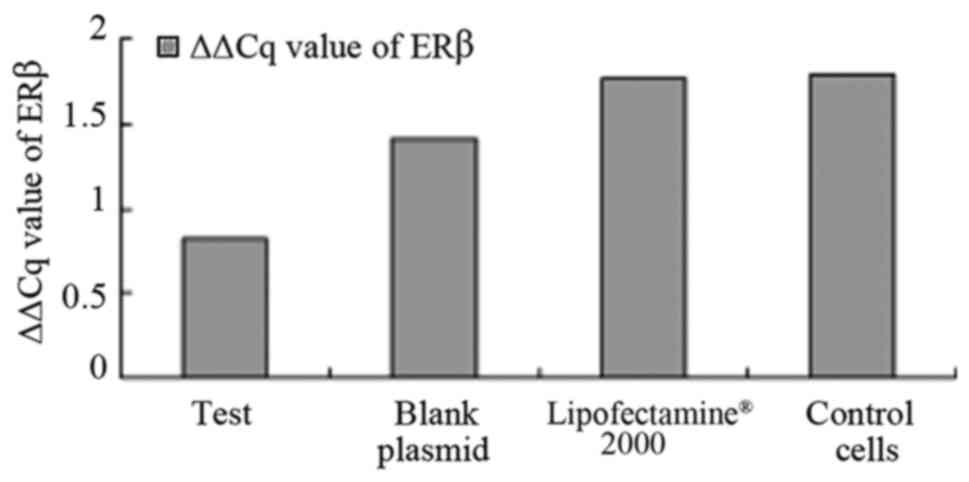
As illustrated in Fig.
3, the results also suggest that ERβ was expressed in all
cells, and the expression of ERβ positive rate was 100%. The
difference in the levels of ERβ expression was statistically
significant in the pcDNA3.1-hERβ-plasmid transfection group
compared with the PC-3 cell group (P<0.0001). A statistically
significant difference was identified between all groups
(P<0.0001), as illustrated in Fig.
3.
A statistically significant difference was observed
between the levels of expression of ERβ, as measured by ΔΔCq value,
in the pcDNA3.1-hERβ + plasmid transfection group compared with the
control blank PC-3 cell group, 0.824±0.186 vs. 1.790±0.032,
(P=0.000, 95% confidence interval (CI), 0.9803–1.6331), as
demonstrated in Table IV. A
statistically significant difference was also observed in the
pcDNA3.1-hERβ + plasmid transfection group compared with the blank
plasmid control group and lipofect2000 control group, (P<0.0001;
95% CI, −1.200–0.7066) and (P<0.0001; 95% CI, −0.8545–0.3093),
respectively, suggesting that the pcDNA3.1-hERβ + plasmid, blank
plasmid and Lipofectamine® 2000 treated PC-3 cell lines
exhibited alterations in the expression levels of ERβ. The most
marked effect was observed in the pcDNA3.1-hERβ + plasmid
transfected cell lines.
| Table IV.ΔΔCq value of AR, ERβ, ERα. |
Table IV.
ΔΔCq value of AR, ERβ, ERα.
|
| AR | ERβ | ERα |
|---|
| Test |
1.179±1.277 |
0.824±0.186 |
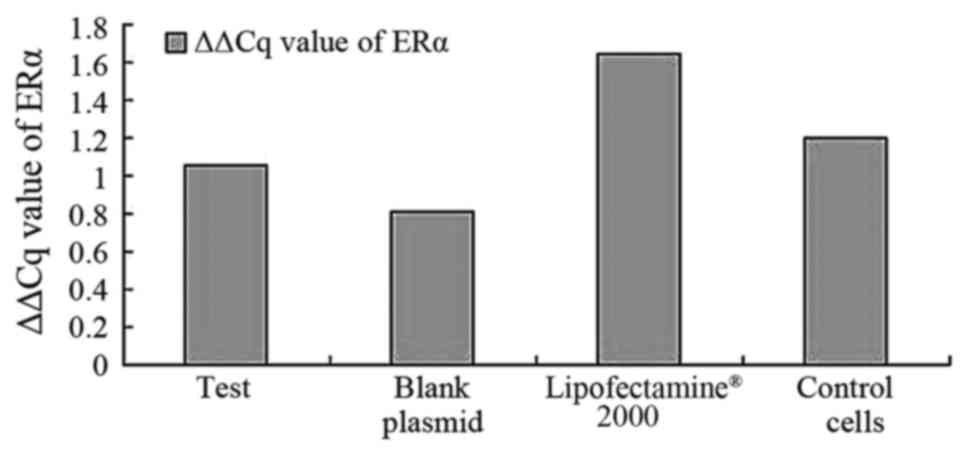
1.055±0.964 |
| Blank plamid |
0.670±0.328 |
1.406±0.218 |
0.807±0.758 |
| Lipofect-2000 |
0.722±0.393 |
1.771±0.071 |
1.643±0.811 |
| Control cell |
1.263±0.209 |
1.790±0.032 |
1.202±1.119 |
When considering ERα, the results suggest that the
expression level of ERα was lower compared with the expression
level of AR and ERβ in the PC-3 cells, and that the positive rate
of ERα expression was only 56%. There was no statistically
significant difference observed in the levels of ERα expression in
the pcDNA3.1-hERβ-plasmid group compared with blank cells group
(P=0.79). When the rates of all groups were compared, there was no
significant difference observed (P>0.05), as demonstrated in
Fig. 4.
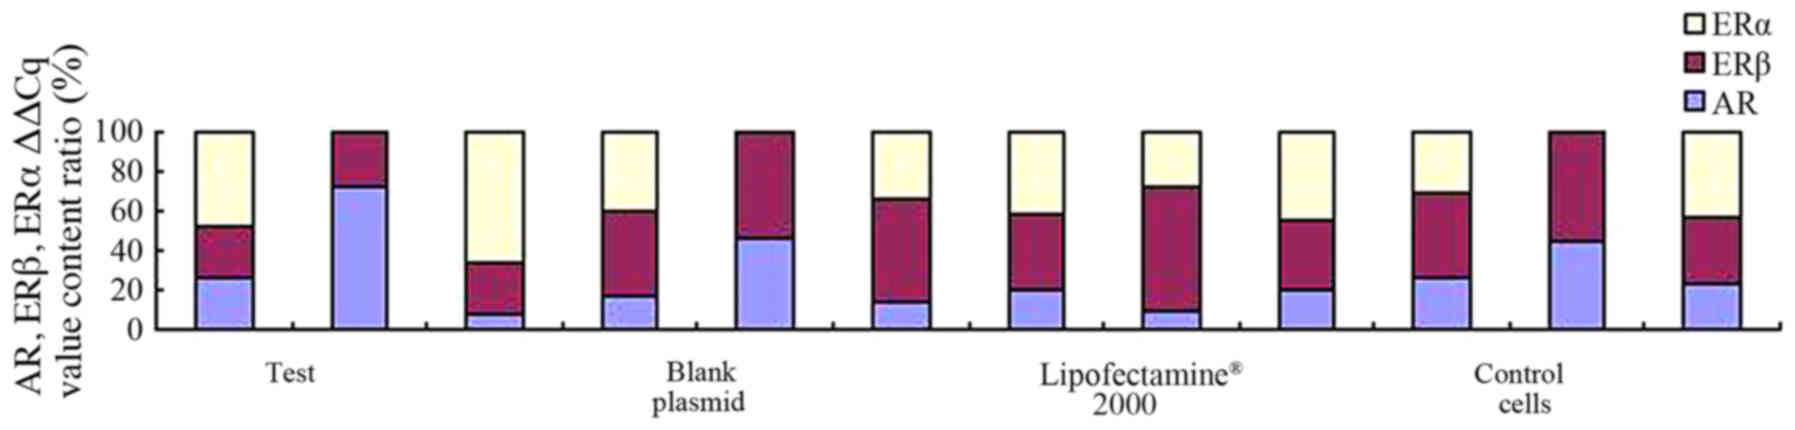
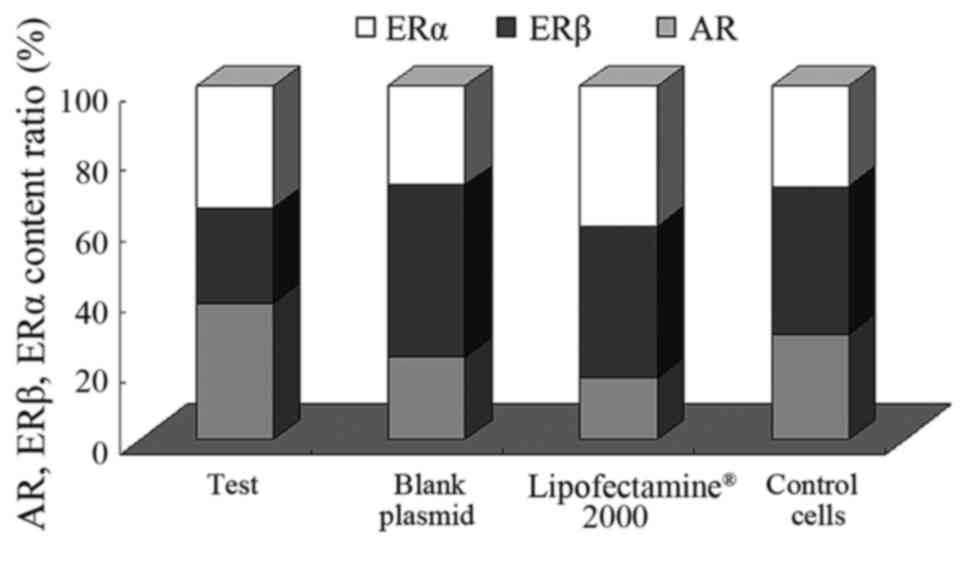
Expression levels of AR, ERα and ERβ
in human PCa PC-3 cell lines transfected with the pcDNA3.1-hERβ
plasmid
In the present study, qPCR detected the patterns of
ERβ, ERα and AR mRNA expression levels in the recombinant plasmid,
the empty plasmid, Lipofectamine® 2000 and normal PC-3
cells groups. As illustrated in Fig.
5, the expression of AR and ERβ was detected in all cells, with
the AR and ER positive expression rates at 100%. However, the
expression of ERα was only observed in 61% of the samples.
Subsequent to the transfection of the PC-3 cells
with the pcDNA3.1-hERβ+plasmids, the expression levels of the 3
receptors were lower compared with the blank/control cell
group: AR1.179±1.277 vs. 1.263±0.209; ERα: 1.055±0.964 vs.
1.202±1.119 and ERβ: 0.824±0.186 vs. 1.790±0.032, as demonstrated
in Table IV and Fig. 6. Of these, the decrease was most
marked in the expression levels of ERβ. There was also a marked
increase in the level of apoptosis in the transfected cells, and
the ratio of ERβ/AR was <1
(0.824±0.186/1.179±1.277 <1) compared with the control
group in which the ERβ/AR ratio was >1
(1.790±0.032/1.263±0.209 >1). This demonstrates that ERβ
exhibited a downward trend in expression levels, and AR expression
levels exhibited an upward trend in the PCa PC-3 cell lines. When
the ΔΔCq value of the expression level of ERα between the
pcDNA3.1-hERβ+plasmid transfection, 1.055±0.964, and the control
blank PC-3 cells groups, 1.202±1.119, was compared, no statistical
significance was observed (P=0.079, 95% CI, 0.079–1.0166). This
suggests that the changing ERβ expression exhibited little effect
on the expression of ERα.
Discussion
PCa is the most type of common hormone-dependent
tumor in incidence after breast cancer, and the effect of the
changes in the levels of sex hormones on the etiology and mechanism
of the disease are significant (11,18).
Current research on PCa pathogenesis demonstrates that ERs or ARs,
particularly ERβ, are associated with the origin and development of
prostatitis and PCa (5). However, the
molecular mechanisms of this association remain unknown. Imbalances
in the levels of circulating estrogen and androgens in males that
occur as they age may cause changes in the levels of expression of
AR in prostatic cells (19). Although
the levels of androgen-dihydrotestosterone (DHT) in the prostate
tissue do not increase, the changes in AR expression may also cause
changes in the expression levels of numerous growth factors
secreted by the gland and basal cells of the prostatic epithelium,
which may stimulate proliferation and suppress the apoptosis of
these cells, eventually leading to PCa (20). However, the mechanism of interaction
between ERs and ARs in the process of PCa development, whether
changes in the ER cause changes in the AR, remains unknown.
In present study, the pcDNA3.1-hERβ-plasmid was
successfully transfected into the PC-3 cell lines using the
eukaryotic cell transfection technique. The levels of expression of
AR, ERβ and ERα were measured using RT-PCR and fluorescence qPCR,
which demonstrated that AR and ERβ are constantly expressed in PC-3
cell lines. However, the ERα were only expressed in ~50% of the
PC-3 cell lines. These results suggest that the PC-3 cell line was
an ideal cell model and may indicate the interaction between sex
hormones and corresponding receptors. Therefore, PC-3 cell lines
may be used to investigate the interaction between the hormone and
its receptors in vitro. DHT serves an important role in the
AR-mediated regulation of the development of the prostate (21). Mutations in the AR receptor may lead
to an attenuated ligand-binding ability, which may cause complete
or partial androgen resistance. Partially mutated AR may be
activated by antagonists, which may lead to the development of
hormone refractory PCa (21).
It has been hypothesized that the expression of AR
is exhibited throughout PCa tissue: In castration-resistant PCa, AR
is still expressed (22). In
contrast, Suryavanshi et al (23) demonstrated that there was a
significant loss in AR expression in certain cases of late hormone
refractory PCa. As the level of expression of ER remains the same,
Kleb et al (24) suggested
that small cell PCa does not express AR or respond to hormonal
therapies, as the expression of AR does not demonstrate the
corresponding decline or deficiency. The current study indicates
that there is an association between expression levels of AR and
the progress of PCa, and demonstrated that the expression level of
AR was constant in all groups, although no significant difference
between the pre- and post-transfection cells was observed. However,
as levels of ERβ expression exhibited a downward trend, the level
AR expression exhibited an upward trend in the PC-3 cell lines.
The prostate gland is not a classical target organ
of estrogen and exhibits low or undetectable expression of ERα.
Simultaneously, the prostate gland demonstrates a significant
expression of ERβ (14). Weihua et
al (25) and McPherson et
al (26) reported the ERα was
mainly expressed in the stromal cells of the prostate, whereas ERβ
expression levels were marked in the luminal epithelial cells.
However, Lau et al (27)
detected the expression of ERβ and ERα in the androgen-independent
PC-3 cell lines, and revealed that estrogen and anti-estrogen
negatively regulate PC-3 cell growth. The present study
demonstrated that unlike the significant levels of expression of AR
and ERβ, ERα exhibited no constant expression levels.
The loss of ERα expression at the mRNA level was
identified in ~50% of the cell groups, comparing the transfection
and control groups. The expression of ERα also exhibited no
significant change, which suggests that ERα may not serve a major
role in PC-3 cell growth, and demonstrates that ERα was not the
predominant ER subtype in the PC-3 cell line. It also suggests that
the prostate gland is not a classical estrogen target organ.
Cell proliferation in early PCa is attributed to the
inhibition of apoptosis of cells (28). Previous studies report that ERβ may
promote apoptosis via the downward regulation of the protein kinase
B signaling pathway (7). This is an
important signaling pathway that may promote the growth of tumor
cells and blood vessels and enhance the metastatic efficacy of the
tumor cells. Concurrently, ERβ may promote the expression levels of
B-cell lymphoma-2-like protein 4 and the apoptosis promoter
protein-caspase-3 (28). A previous
study reported that ERβ may serve an anti-proliferative role via
downregulating the expression levels of androgen receptors
(25). In the present study, it was
demonstrated that PC-3 cells may consistently express ERβ.
Furthermore, when the PC-3 cells were transfected the
pcDNA3.1-hERβ-plasmid, the expression of ERβ exhibited a marked
downward trend, which was evidently different compared with the
control groups. The PC-3 cells illustrated a clear inhibition of
proliferation, which indirectly suggests an association between the
lack of ERβ with the levels of apoptosis of the PC-3 cells, and
also indirectly confirms that the ERβ recombinant plasmid was
successfully transfected into the PC-3 cell lines.
With a marked downward regulation of the expression
levels of ERβ, the expression levels of AR and ERα were compared,
and it was demonstrated that although the expression levels of AR
were also downregulated, the degree was less compared with ERβ.
Concurrently, the respective proportional upward and downward
trends of expression levels of AR and ER-β exhibited when the
transfection and blank control groups were compared provides data
to suggest that ERβ may regulate PCa cell growth via the expression
of AR.
To the best of our knowledge, the present study is
the first to demonstrate the hypothesis that ERβ may regulate the
expression of AR to inhibit the growth of PCa PC-3 cells. It was
difficult to determine the association between ERα and AR, as the
expression levels of ERα were not consistent between the PC-3 cell
lines.
In the present study, subsequent to
pcDNA3.1-hER-plasmid transfection, it was demonstrated that the
expression levels of the three receptors AR, ERβ and ERα were lower
in the transfection group compared with the control group. There
were different degrees of downregulation, in particular the
expression of ERβ was markedly decreased, which suppressed PCa PC-3
cell lines growth in vitro. These data support the
hypothesis that ERβ performs the opposite regulatory action to cell
growth: ERβ may serve a role in the direct suppression of PC-3 cell
proliferation. However, the data do not fully describe and analyze
the interaction between ERs and ARs due to the low number of cell
samples, use of a singular cell line and the lack of confirmation
of results through crosschecking analysis between other cell lines,
such as Dul45 and LNCaP. Therefore, additional studies are required
to investigate the molecular mechanisms underlying the suppression
of the growth of prostate cancer cells by hormone receptors.
In conclusion, in PCa PC-3 tissues, the expression
of AR demonstrated an upward or variant trend, and ERβ expression
was downregulated. Therefore, it is hypothesized that the variation
in expression levels of ER and AR may serve an important role in
the pathogenesis of PCa. At an mRNA level, the PCa PC-3 cell line
constantly expressed AR and ERβ, whereas the level of ERα
expression was inconsistent. These results support the hypothesis
that ERβ is a candidate gene: Increasing the ERβ expression level
in PCa cells may be an effective therapeutic strategy to treat
PCa.
Acknowledgements
This study was funded by the KunMing University of
Science and Technology (grant no. kksy201460021).
References
|
1
|
Benjamins MR, Hunt BR, Raleigh SM,
Hirschtick JL and Hughes MM: Racial disparities in prostate cancer
mortality in the 50 Largest US Cities. Cancer Epidemiol.
44:125–131. 2016. View Article : Google Scholar : PubMed/NCBI
|
|
2
|
James N, Pirrie S, Pope A, Barton D,
Andronis L, Goranitis I, Collins S, McLaren D, O'Sullivan J, Parker
C, et al: TRAPEZE: A randomised controlled trial of the clinical
effectiveness and cost-effectiveness of chemotherapy with
zoledronic acid, strontium-89, or both, in men with bony metastatic
castration-refractory prostate cancer. Health Technol Assess.
20:1–288. 2016. View
Article : Google Scholar : PubMed/NCBI
|
|
3
|
Slusarz A, Jackson GA, Day JK, Shenouda
NS, Bogener JL, Browning JD, Fritsche KL, MacDonald RS,
Besch-Williford CL and Lubahn DB: Aggressive prostate cancer is
prevented in ERαKO mice and stimulated in ERβKO TRAMP mice.
Endocrinology. 153:4160–4170. 2012. View Article : Google Scholar : PubMed/NCBI
|
|
4
|
Levakov AF, Kaćanski MM, Vucković N,
Zivojinov M, Amidzić J and Sabo JI: The expression and localization
of estrogen receptor beta in hyperplastic and neoplastic prostate
lesions. Vojnosanit Pregl. 72:906–913. 2015. View Article : Google Scholar : PubMed/NCBI
|
|
5
|
Wang L, Zhang P, Meng X, Chen X, Xiang Z,
Lin X, Liu Y, Gan W, Han X and Li D: Correlation between the
germline methylation status in ERβ promoter and the risk in
prostate cancer: A prospective study. Fam Cancer. 15:309–315. 2016.
View Article : Google Scholar : PubMed/NCBI
|
|
6
|
Weihua Z, Warner M and Gustafsson JA:
Estrogen receptor beta in the prostate. Mol Cell Endocrinol.
193:1–5. 2002. View Article : Google Scholar : PubMed/NCBI
|
|
7
|
Kumar R, Verma V, Sharma V, Jain A, Singh
V, Sarswat A, Maikhuri JP, Sharma VL and Gupta G: A precisely
substituted benzopyran targets androgen refractory prostate cancer
cells through selective modulation of estrogen receptors. Toxicol
Appl Pharmacol. 283:187–197. 2015. View Article : Google Scholar : PubMed/NCBI
|
|
8
|
Mahmoud AM, Al-Alem U, Ali MM and Bosland
MC: Genistein increases estrogen receptor beta expression in
prostate cancer via reducing its promoter methylation. J Steroid
Biochem Mol Biol. 152:62–75. 2015. View Article : Google Scholar : PubMed/NCBI
|
|
9
|
Asgari M and Morakabati A: Estrogen
receptor beta expression in prostate adenocarcinoma. Diagn Pathol.
6:612011. View Article : Google Scholar : PubMed/NCBI
|
|
10
|
Attia DM and Ederveen AG: Opposing roles
of ERα and ERβ in the genesis and progression of adenocarcinoma in
the rat ventral prostate. Prostate. 72:1013–1022. 2012. View Article : Google Scholar : PubMed/NCBI
|
|
11
|
Medeiros R, Vasconcelos A, Costa S, Pinto
D, Morais A, Oliveira J and Lopees C: Steroid hormone genotypes
ARStuI and ER325 are linked to the progression of human prostate
cancer. Cancer Genet Cytogenet. 141:91–96. 2003. View Article : Google Scholar : PubMed/NCBI
|
|
12
|
Muthusamy S, Andersson S, Kim HJ, Butler
R, Waage L, Bergerheim U and Gustafsson JÅ: Estrogen receptor β and
17β-hydroxysteroiddeh ydrogenase type 6, a growth regulatory
pathway that is lost in prostate cancer. Proc Natl Acad Sci USA.
108:20090–20094. 2011. View Article : Google Scholar : PubMed/NCBI
|
|
13
|
Signoretti S and Loda M: Estrogen receptor
beta in prostate cancer: brake pedal or accelerator? Am J Pathol.
159:13–16. 2001. View Article : Google Scholar : PubMed/NCBI
|
|
14
|
Megas G, Chrisofos M, Anastasiou I,
Tsitlidou A, Choreftaki T and Deliveliotis C: Estrogen receptor (α
and β) but not androgen receptor expression is correlated with
recurrence, progression and survival in post prostatectomy T3N0M0
locally advanced prostate cancer in an urban Greek population.
Asian J Androl. 17:98–105. 2015. View Article : Google Scholar : PubMed/NCBI
|
|
15
|
Lombardi AP, Pisolato R, Vicente CM,
Lazari MF, Lucas TF and Porto CS: Estrogen receptor beta (ERβ)
mediates expression of β-catenin and proliferation in prostate
cancer cell line PC-3. Mol Cell Endocrinol. 430:12–24. 2016.
View Article : Google Scholar : PubMed/NCBI
|
|
16
|
Royuela M, de Miguel MP, Bethencourt FR,
Sánchez-Chapado M, Fraile B, Arenas MI and Paniagua R: Estrogen
receptors alpha and beta in the normal, hyperplastic and
carcinomatous human prostate. J Endocrinol. 163:447–454. 2001.
View Article : Google Scholar
|
|
17
|
Livak KJ and Schmittgen TD: Analysis of
relative gene expression data using real-time quantitative PCR and
the 2(−Delta Delta C(T)) method. Methods. 25:402–408. 2001.
View Article : Google Scholar : PubMed/NCBI
|
|
18
|
Bosland MC: Sex steroids and prostate
carcinogenesis: Integrated, multifactorial working hypothesis. Ann
N Y Acad Sci. 1089:168–176. 2006. View Article : Google Scholar : PubMed/NCBI
|
|
19
|
Thapa D and Ghosh R: Chronic inflammatory
mediators enhance prostate cancer development and progression.
Biochem Pharmacol. 94:53–62. 2015. View Article : Google Scholar : PubMed/NCBI
|
|
20
|
Alcaraz A, Hammerer P, Tubaro A, Schröder
FH and Castro R: Is there evidence of a relationship between benign
prostatic hyperplasia and prostate cancer? Findings of a literature
review. Eur Urol. 55:864–873. 2009. View Article : Google Scholar : PubMed/NCBI
|
|
21
|
Veldscholte J, Ris-Stalpers C, Kuiper GG,
Jenster G, Berrevoets C, Claassen E, van Rooij HC, Trapman J,
Brinkmann AO and Mulder E: A mutation in the ligand binding domain
of the androgen receptor of human LNCaP cells affects steroid
binding characteristics and response to anti-androgens. Biochem
Biophys Res Commun. 173:534–540. 1990. View Article : Google Scholar : PubMed/NCBI
|
|
22
|
Heinlein CA and Chang C: Androgen receptor
in prostate cancer. Endocr Rev. 25:276–308. 2004. View Article : Google Scholar : PubMed/NCBI
|
|
23
|
Suryavanshi M, Mehta A, Jaipuria J, Sharma
AK, Rawal S and Seth N: Weaker ERG expression in patients with
ERG-positive prostate cancer is associated with advanced disease
and weaker androgen receptor expression: An Indian outlook. Urol
Oncol. 33(331): e9–15. 2015.
|
|
24
|
Kleb B, Estécio MR, Zhang J, Tzelepi V,
Chung W, Jelinek J, Navone NM, Tahir S, Marquez VE, Issa JP, et al:
Differentially methylated genes and androgen receptor re-expression
in small cell prostatecarcinomas. Epigenetics. 11:184–193. 2016.
View Article : Google Scholar : PubMed/NCBI
|
|
25
|
Weihua Z, Ekman J, Almkvist A, Saji S,
Wang L, Warner M and Gustafsson JA: Involvement of androgen
receptor in 17beta-estradiol-induced cell proliferation in rat
uterus. Biol Reprod. 67:616–623. 2002. View Article : Google Scholar : PubMed/NCBI
|
|
26
|
McPherson SJ, Ellem SJ, Simpson ER,
Patchev V, Fritzemeier KH and Risbridger GP: Essential role for
estrogen receptor beta in stromal-epithelial regulation of
prostatic hyperplasia. Endocrinology. 148:566–574. 2007. View Article : Google Scholar : PubMed/NCBI
|
|
27
|
Lau KM, LaSpina M, Long J and Ho SM:
Expression of estrogen receptor (ER)-alpha and ER-beta in normal
and malignant prostatic epithelial cells: Regulation by methylation
and involvement in growth regulation. Cancer Res. 60:3175–3182.
2000.PubMed/NCBI
|
|
28
|
Cheng J, Lee EJ, Madison LD and Lazennec
G: Expression of estrogen receptor beta in prostate carcinoma cells
inhibits invasion and proliferation and triggers apoptosis. FEBS
Lett. 566:169–172. 2004. View Article : Google Scholar : PubMed/NCBI
|