Introduction
Epithelial ovarian cancer (EOC) is the sixth largest
cause of cancer-associated mortality in women globally (1). In 2012, ~22,280 and 69,565 cases of EOC
were estimated for the USA and Europe, respectively (2). EOC accounts for 90% of cases of ovarian
cancer and is characterized by metastasis (3). Typically, primary EOC tumors disseminate
within the peritoneal cavity, primarily into the omentum (4). Only once the tumor cells have spread
into the peritoneal cavity may EOC be diagnosed, which often
results in a poor prognosis (5).
Numerous studies have assessed the mechanisms
involved in EOC metastasis. Scotton et al (6) demonstrated that C-X-C motif chemokine
receptor 4 was the only chemokine receptor expressed in ovarian
cancer cells. This restricted expression is proposed to be a major
step in ovarian cancer metastasis. Disrupting cell adhesion
promotes tumor progression. The downregulation of the adhesion
molecules cluster of differentiation (CD)82 and CD9 has been
reported to be associated with the progression of ovarian cancer,
particularly metastasis (7). Another
study reported that the tumorigenicity-associated protein mucin 1
serves a function in EOC metastasis (8).
MicroRNAs (miRNAs/miRs) are small non-coding RNAs
that serve key functions in the development of numerous types of
cancer, including EOC, by regulating gene expression (9). A previous study examined the alteration
of miRNAs during the development of EOC and, as expected,
identified numerous differentially expressed miRNAs, including the
overexpression of miR-200a, 200b, 200c and 141 (1). However, there are few reports of miRNAs
associated with EOC metastasis.
A recent study identified differentially expressed
genes (DEGs) between EOC primary tumors and metastases by
microarray profiling (4). However,
this previous study primarily concerned copy number variations
(CNVs), which refers to variations caused by gene rearrangement,
and the upregulation of the transforming growth factor β signaling
pathway. The results of this previous study suggested that although
the clone (the altered genes corresponding to the CNVs) in
metastasis and primary tumors was different, the tumor cells were
adapting to the omental environment. Despite these results, the
function of numerous other DEGs and their interactions in EOC
remain unclear. Therefore, the present study re-analyzed the
GSE30587 microarray dataset (4) to
identify DEGs between primary tumor and omental metastatic tumor
EOC cells. Furthermore, the present study performed term and
pathway enrichment analyses, and protein-protein interaction (PPI)
network construction. The present study also combined the DEG data
with information on miRNAs in multiple databases to predict
miRNA-target interactions. Through these comprehensive
bioinformatical methods, the present study assessed effective
biomarkers for the prognosis of EOC metastasis.
Materials and methods
Data resources
The GSE30587 microarray dataset (4) was downloaded from the Gene Expression
Omnibus (GEO) database (www.ncbi.nlm.nih.gov/geo). Of the dataset, 9 primary
tissue samples (control samples) and 9 matched omental metastatic
tumor samples (metastatic samples) from patients with serous EOC
were used in the present study. The platform used for the detection
of this microarray data in the study by Brodsky et al
(4) was the GeneChip™
Human Gene 1.0 ST Array (Affymetrix; Thermo Fisher Scientific,
Inc., Waltham, MA, USA).
Pretreatment and differential
analysis
Expression profiles from probe level and annotation
profiles from the dataset were downloaded from the GEO database.
Raw data in the expression profiles were preprocessed via robust
multi-array average (RMA) normalization (10), allowing the expression values from
probe level to correspond with those of the gene level, in
accordance with the annotation profile. The average probe
expression value was considered to be the gene expression value.
The DEGs between control and metastatic samples were identified
using the limma package (version 3.22.7) of R software (11). The cut-off values for DEG selection
were a fold-change in expression of ≥1.5 and P<0.05.
Term and pathway enrichment
analyses
The Cytoscape plugin ClueGO (11), which facilitates pathway enrichment
analysis and classification of enriched terms, was used to perform
the enrichment analysis. Information in the Kyoto Encyclopedia of
Genes and Genomes (http://www.genome.jp/kegg/pathway.html) database was
combined. Based on the results of ClueGO, a κ coefficient that
reflected the association between two pathways or two functional
terms was calculated, with a threshold of 0.4. Similar functional
terms were given the same color. The Pathview package (version
1.4.2) of R software (12), which
reveals the location of DEGs in a pathway, was used to present the
enriched pathway. P<0.05 was considered to indicate a
statistically significant pathway selection.
PPI network analysis of the DEGs
The Search Tool for the Retrieval of Interacting
Genes (STRING) database (13) is a
comprehensive database containing coexpression, co-occurrence,
text-mining, fusion and protein interaction information. STRING
uses a combined score (0–1) to assess reliability; the higher the
score, the more reliable the interaction. In the present study, a
combined score of 0.4 was used to establish the PPI network, which
was visualized using Cytoscape. Each protein in the network served
as a node, and the degree of a node was defined as the number of
interactions with other nodes. Hub genes were nodes with ≥20
degrees.
Construction of the miRNA-target
regulatory network
The multiMiR package (version 3.0.2) (14) of R contains the miRNA-target
interaction information from 14 databases, including three
validated databases (miRecords version 4, miRTarBase version 4.5
and TarBase version 6), eight predicted databases (DIANA-microT-CDS
version 5, E1MMo version 5, MicroCosm version 5, miRanda, miRDB
version 4, PicTar version 2, PITA version 6 and TargetScan version
6.4) and three miRNA-disease/drug association databases
[miR2Disease (version January, 2010), Pharmaco-miR (version 5.2)
and PhenomiR (version 2.0)]. The present study extracted the
miRNA-target interaction that appeared in at least two validated
databases to establish the miRNA-target regulatory network. The
network was subsequently visualized using Cytoscape.
Results
Identification of DEGs in metastatic
EOC
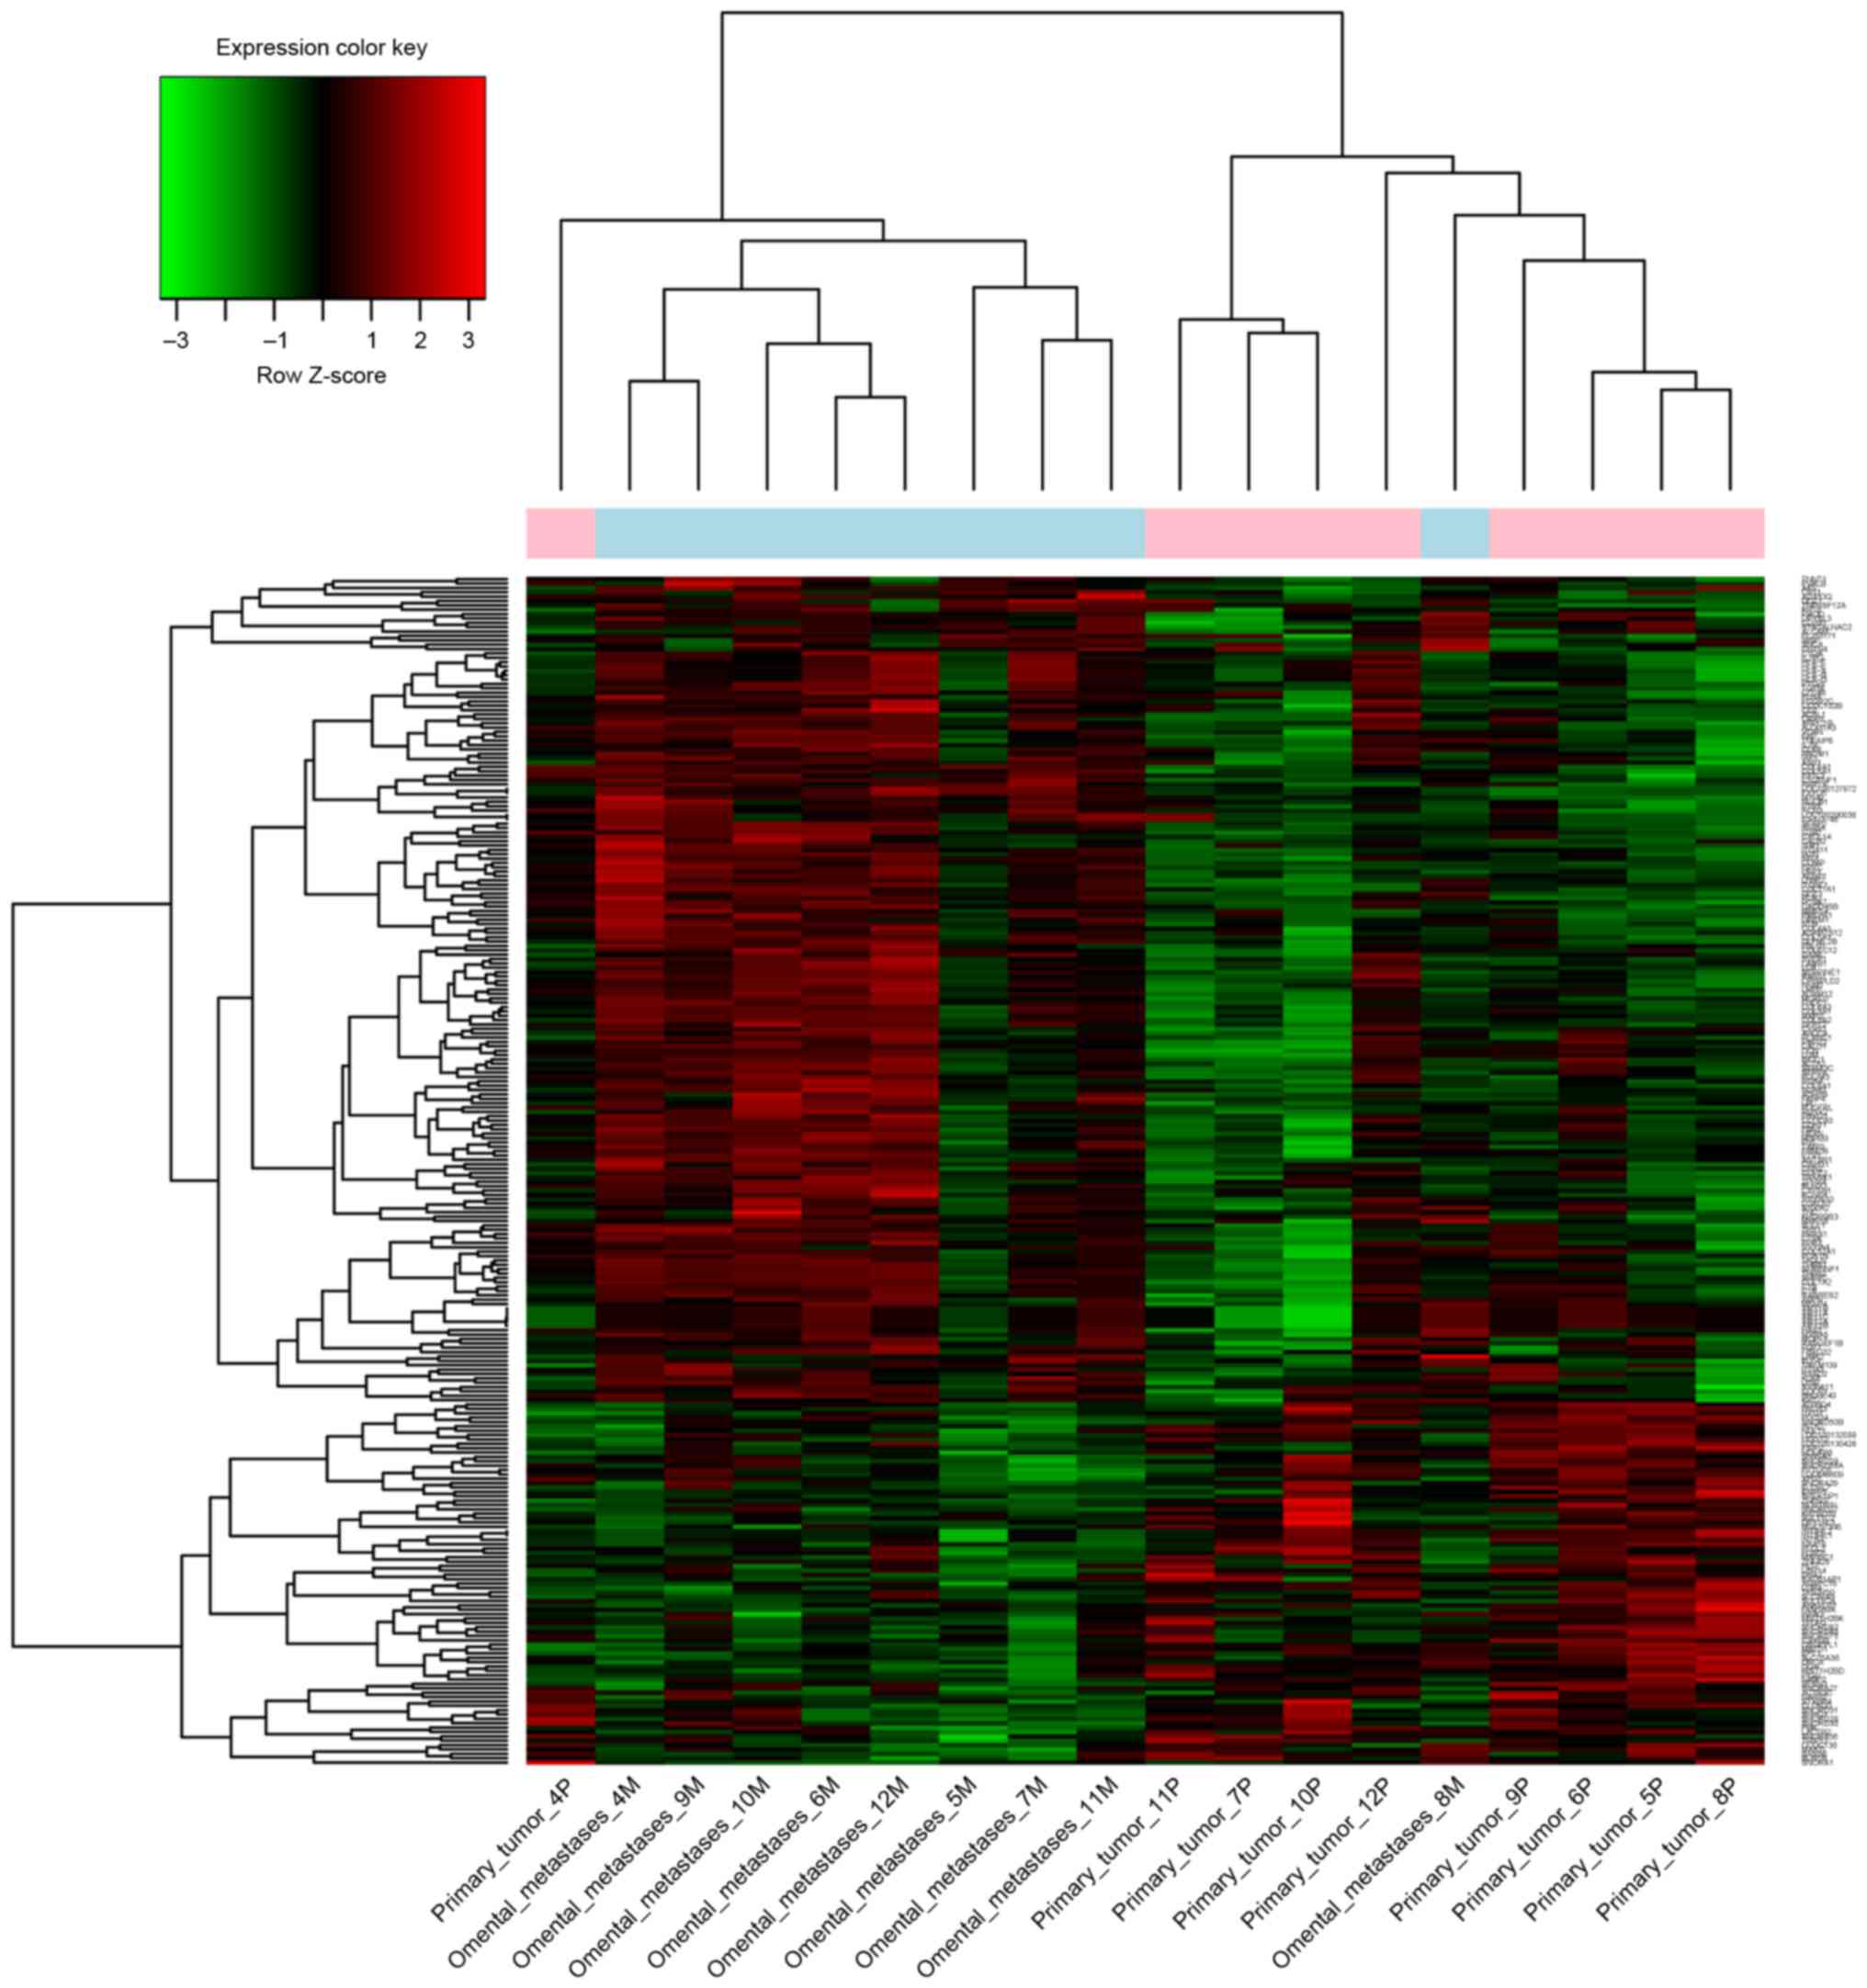
The present study identified a total of 272 DEGs
between the control and metastatic EOC samples, including 189
upregulated genes and 83 downregulated genes (Fig. 1).
Enriched signaling pathways of DEGs in
metastatic EOS
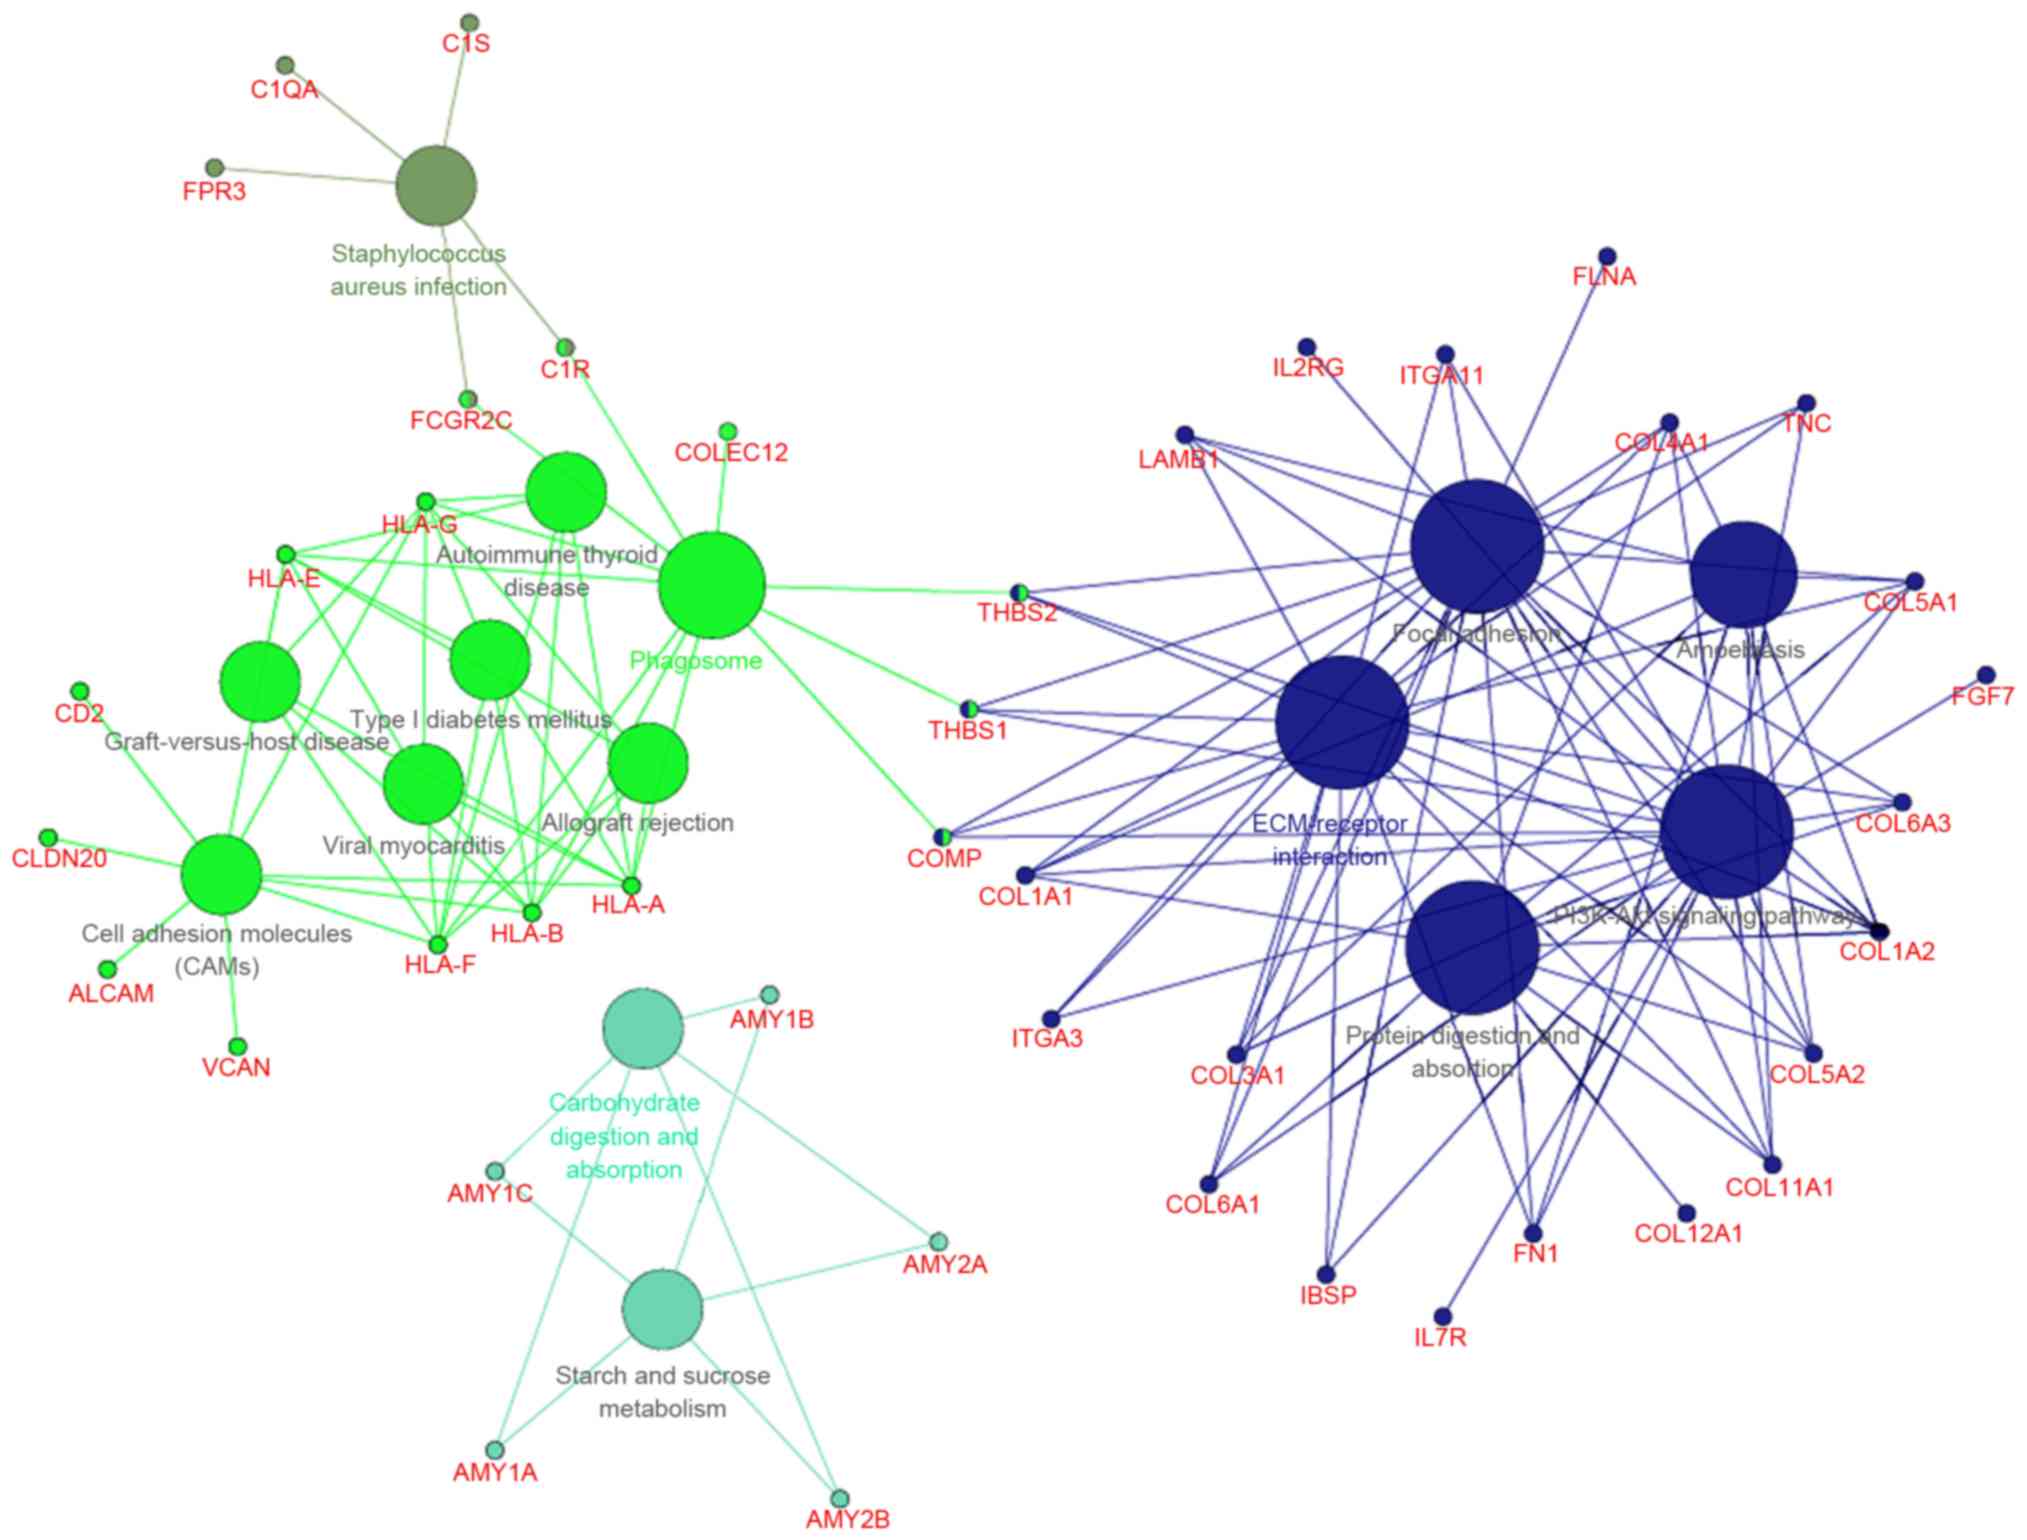
With a predefined threshold of P<0.05, the
present study demonstrated that the DEGs identified in metastatic
EOS were significantly enriched in signaling pathways associated
with cellular signaling transduction and cell adhesion (Fig. 2; Table
I), including the phosphoinositide 3-kinase/protein kinase B
(PI3K/Akt) signaling pathway. This pathway included collagen type I
α 1 chain (COL1A1), COL1A2, collagen type XI α 1
chain (COL11A1) and thrombospondin (THBS)1. The DEGs
were also associated with the focal adhesion signaling pathway,
including COL1A1, COL1A2, COL11A1 and
THBS1, the extracellular matrix (ECM)-receptor interaction
signaling pathway, including COL1A1, COL1A2,
COL11A1 and THBS1, and the cell adhesion signaling
pathway, including activated leukocyte cell adhesion molecule and
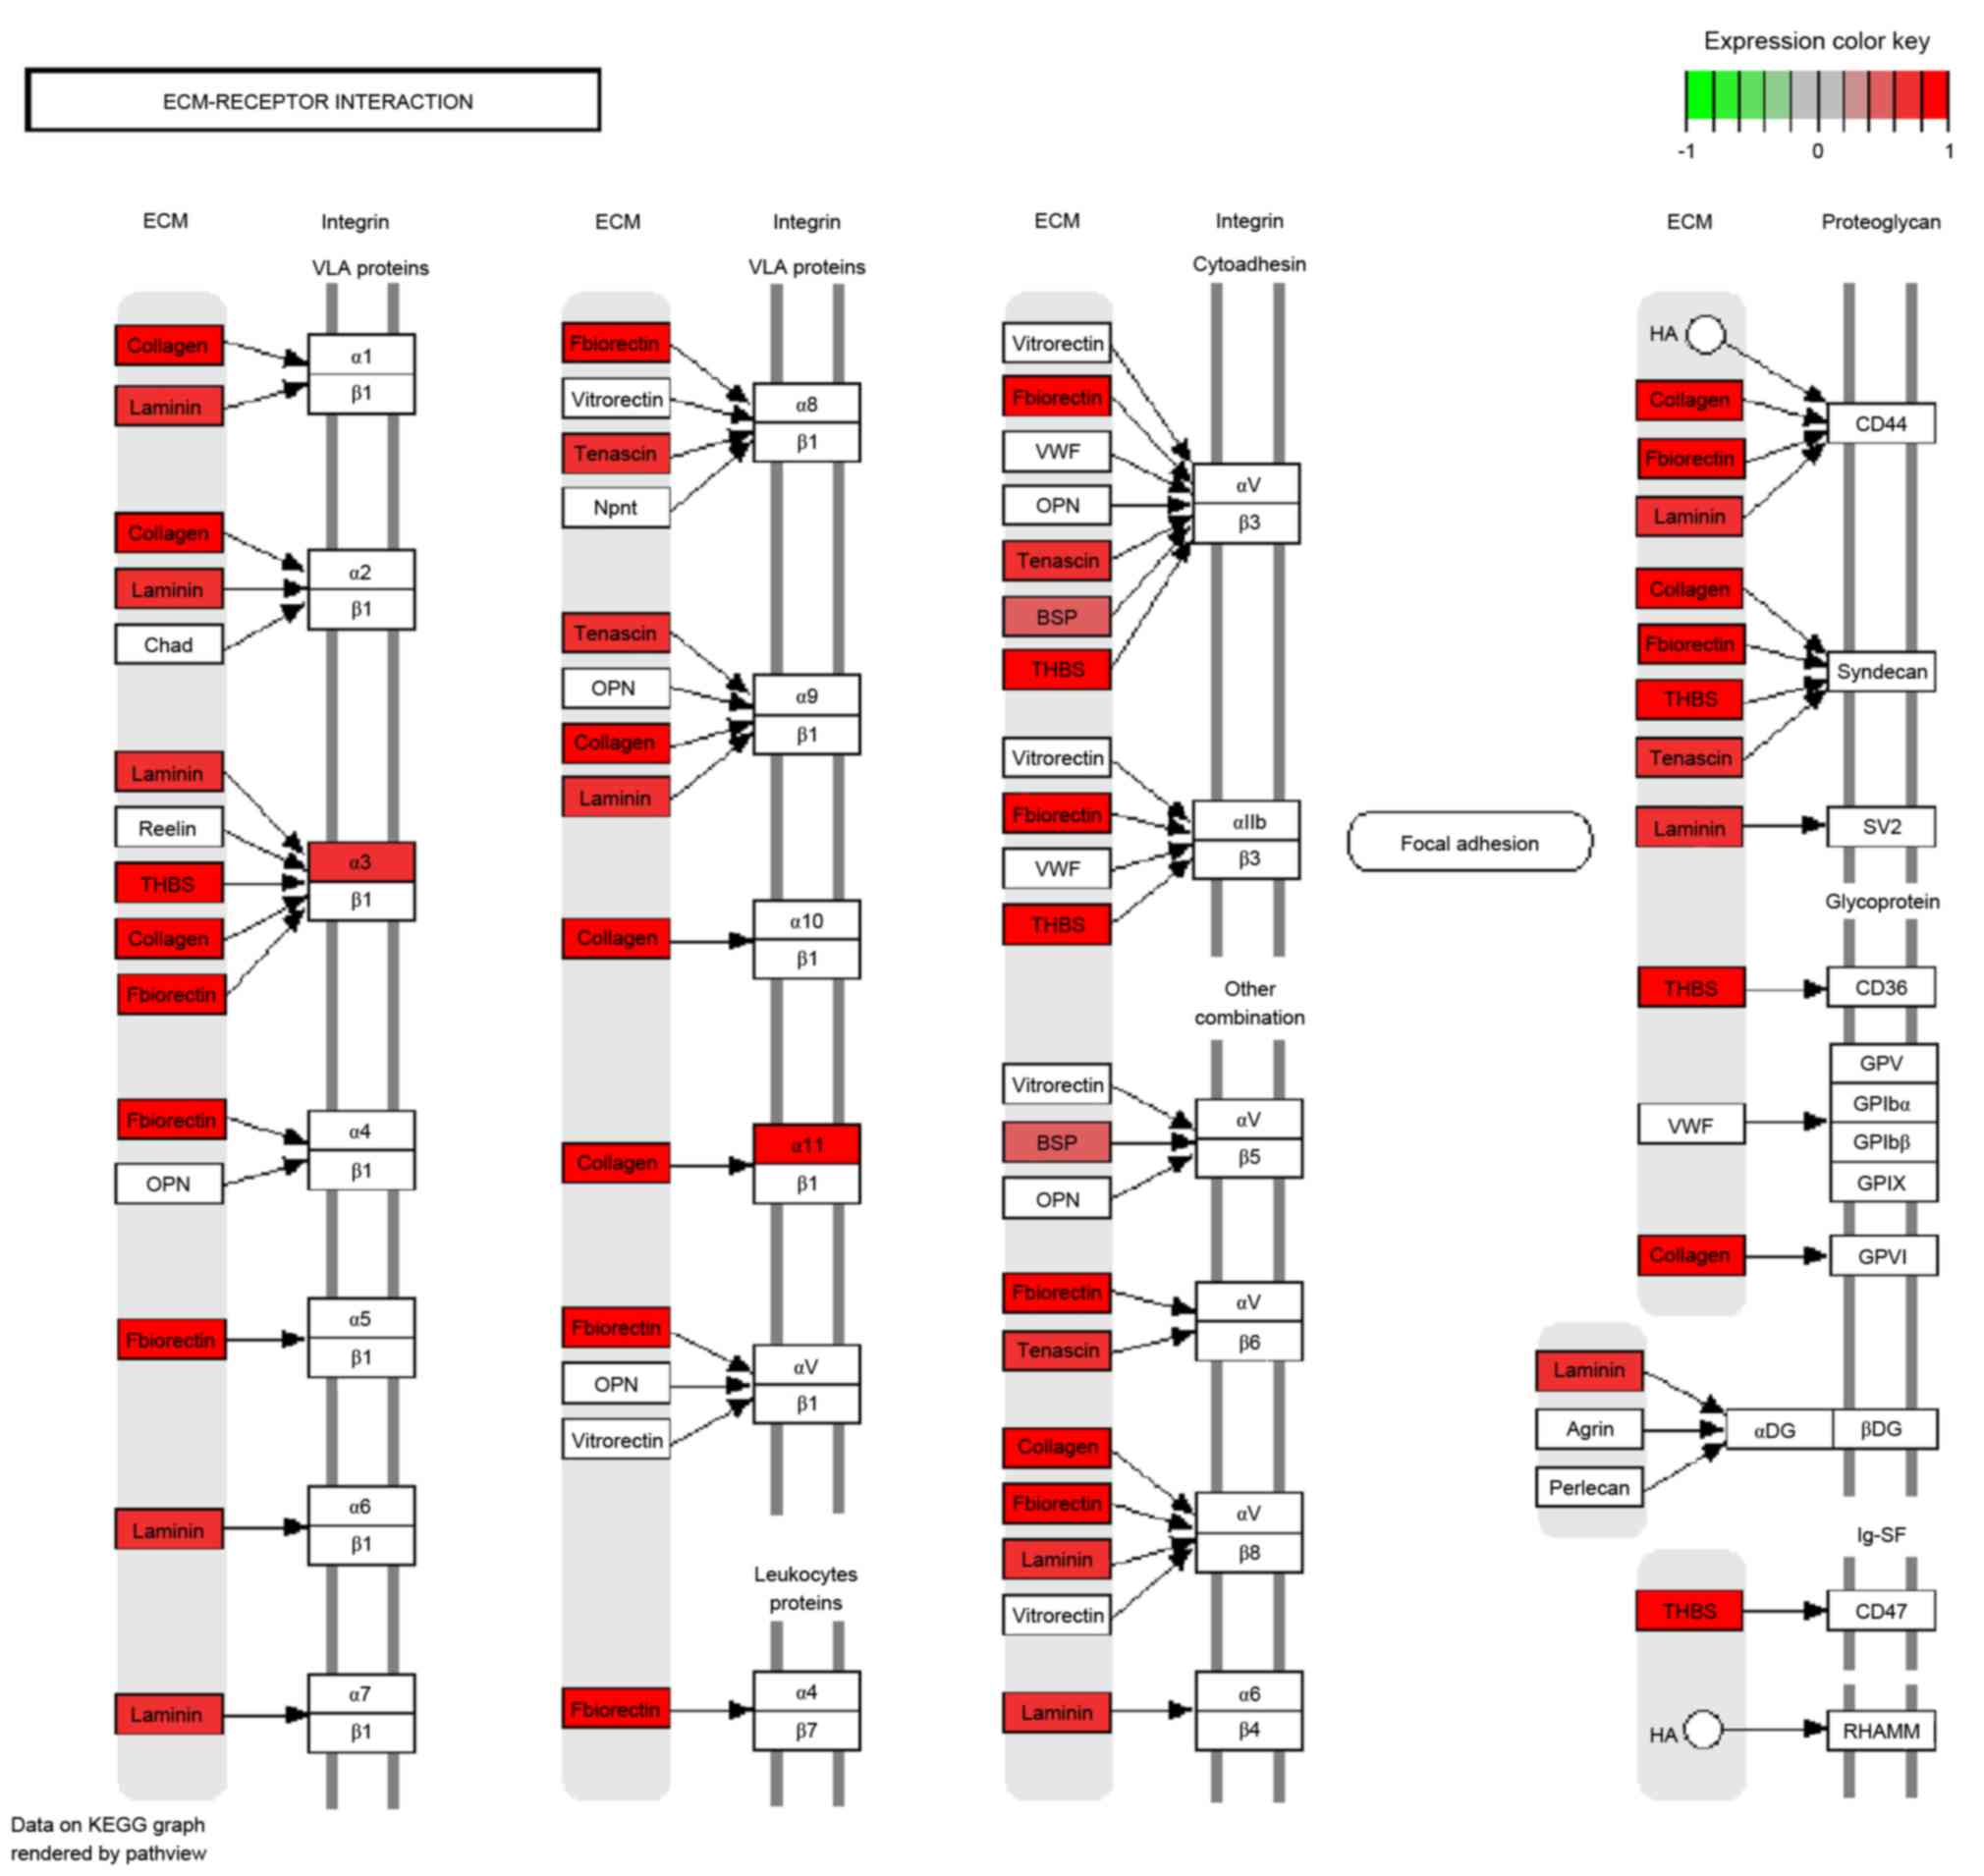
CD2. DEGs enriched in the ECM-receptor interaction signaling
pathway were all upregulated, including certain collagen genes and
THBS (Fig. 3).
 | Table I.Significantly enriched signaling
pathways of the differentially expressed genes. |
Table I.
Significantly enriched signaling
pathways of the differentially expressed genes.
| KEGG pathway
no. | Signaling
pathway | No. of DEGs | DEGs involved | P-value |
|---|
| KEGG:00500 | Starch and sucrose
metabolism | 5 | AMY1A, MY1B, AMY1C,
AMY2A, MY2B |
2.04×10⁻³ |
| KEGG:04145 | Phagosome | 11 | C1R, THBS2, THBS1,
COLEC12, COMP and others |
3.85×10⁻⁵ |
| KEGG:04151 | PI3K/Akt | 21 | COL11A1, COL1A1,
COL1A2, THBS1, THBS2 and others |
1.16×10⁻⁷ |
| KEGG:04510 | Focal adhesion | 19 | COL11A1, COL1A1,
COL1A2, THBS1, THBS2 and others |
6.21×10⁻¹⁰ |
| KEGG:04512 | ECM-receptor
interaction | 18 | COL11A1, COL1A1,
COL1A2, THBS1, THBS2 and others |
1.17×10⁻¹⁵ |
| KEGG:04514 | Cell adhesion
molecules | 9 | ALCAM, CD2, CLDN20,
HLA-A, VCAN |
5.46×10⁻⁴ |
| KEGG:04940 | Type I diabetes
mellitus | 5 | HLA-A, HLA-B,
HLA-E, HLA-F, HLA-G |
7.51×10⁻⁴ |
| KEGG:04973 | Carbohydrate
digestion and absorption | 5 | AMY1A, AMY1B,
AMY1C, AMY2A, AMY2B |
7.51×10⁻⁴ |
| KEGG:04974 | Protein digestion
and absorption | 10 | COL11A1, COL12A1,
COL1A1, COL1A2, COL3A1 and others |
1.64×10⁻⁶ |
| KEGG:05146 | Amoebiasis | 9 | COL11A1, COL1A1,
COL1A2, COL3A1, COL4A1 and others |
5.81×10⁻⁵ |
| KEGG:05150 | Staphylococcus
aureus infection | 5 | C1QA, C1R, C1S,
FCGR2C, FPR3 |
2.21×10⁻³ |
| KEGG:05320 | Autoimmune thyroid
disease | 5 | HLA-A, HLA-B,
HLA-E, HLA-F, HLA-G |
1.73×10⁻³ |
| KEGG:05330 | Allograft
rejection | 5 | HLA-A, HLA-B,
HLA-E, HLA-F, HLA-G |
3.82×10⁻⁴ |
| KEGG:05332 | Graft-versus-host
disease | 5 | HLA-A, HLA-B,
HLA-E, HLA-F, HLA-G |
6.07×10⁻⁴ |
| KEGG:05416 | Viral
myocarditis | 5 | HLA-A, HLA-B,
HLA-E, HLA-F, HLA-G |
2.77×10⁻³ |
PPI network of DEGs in metastatic
EOS
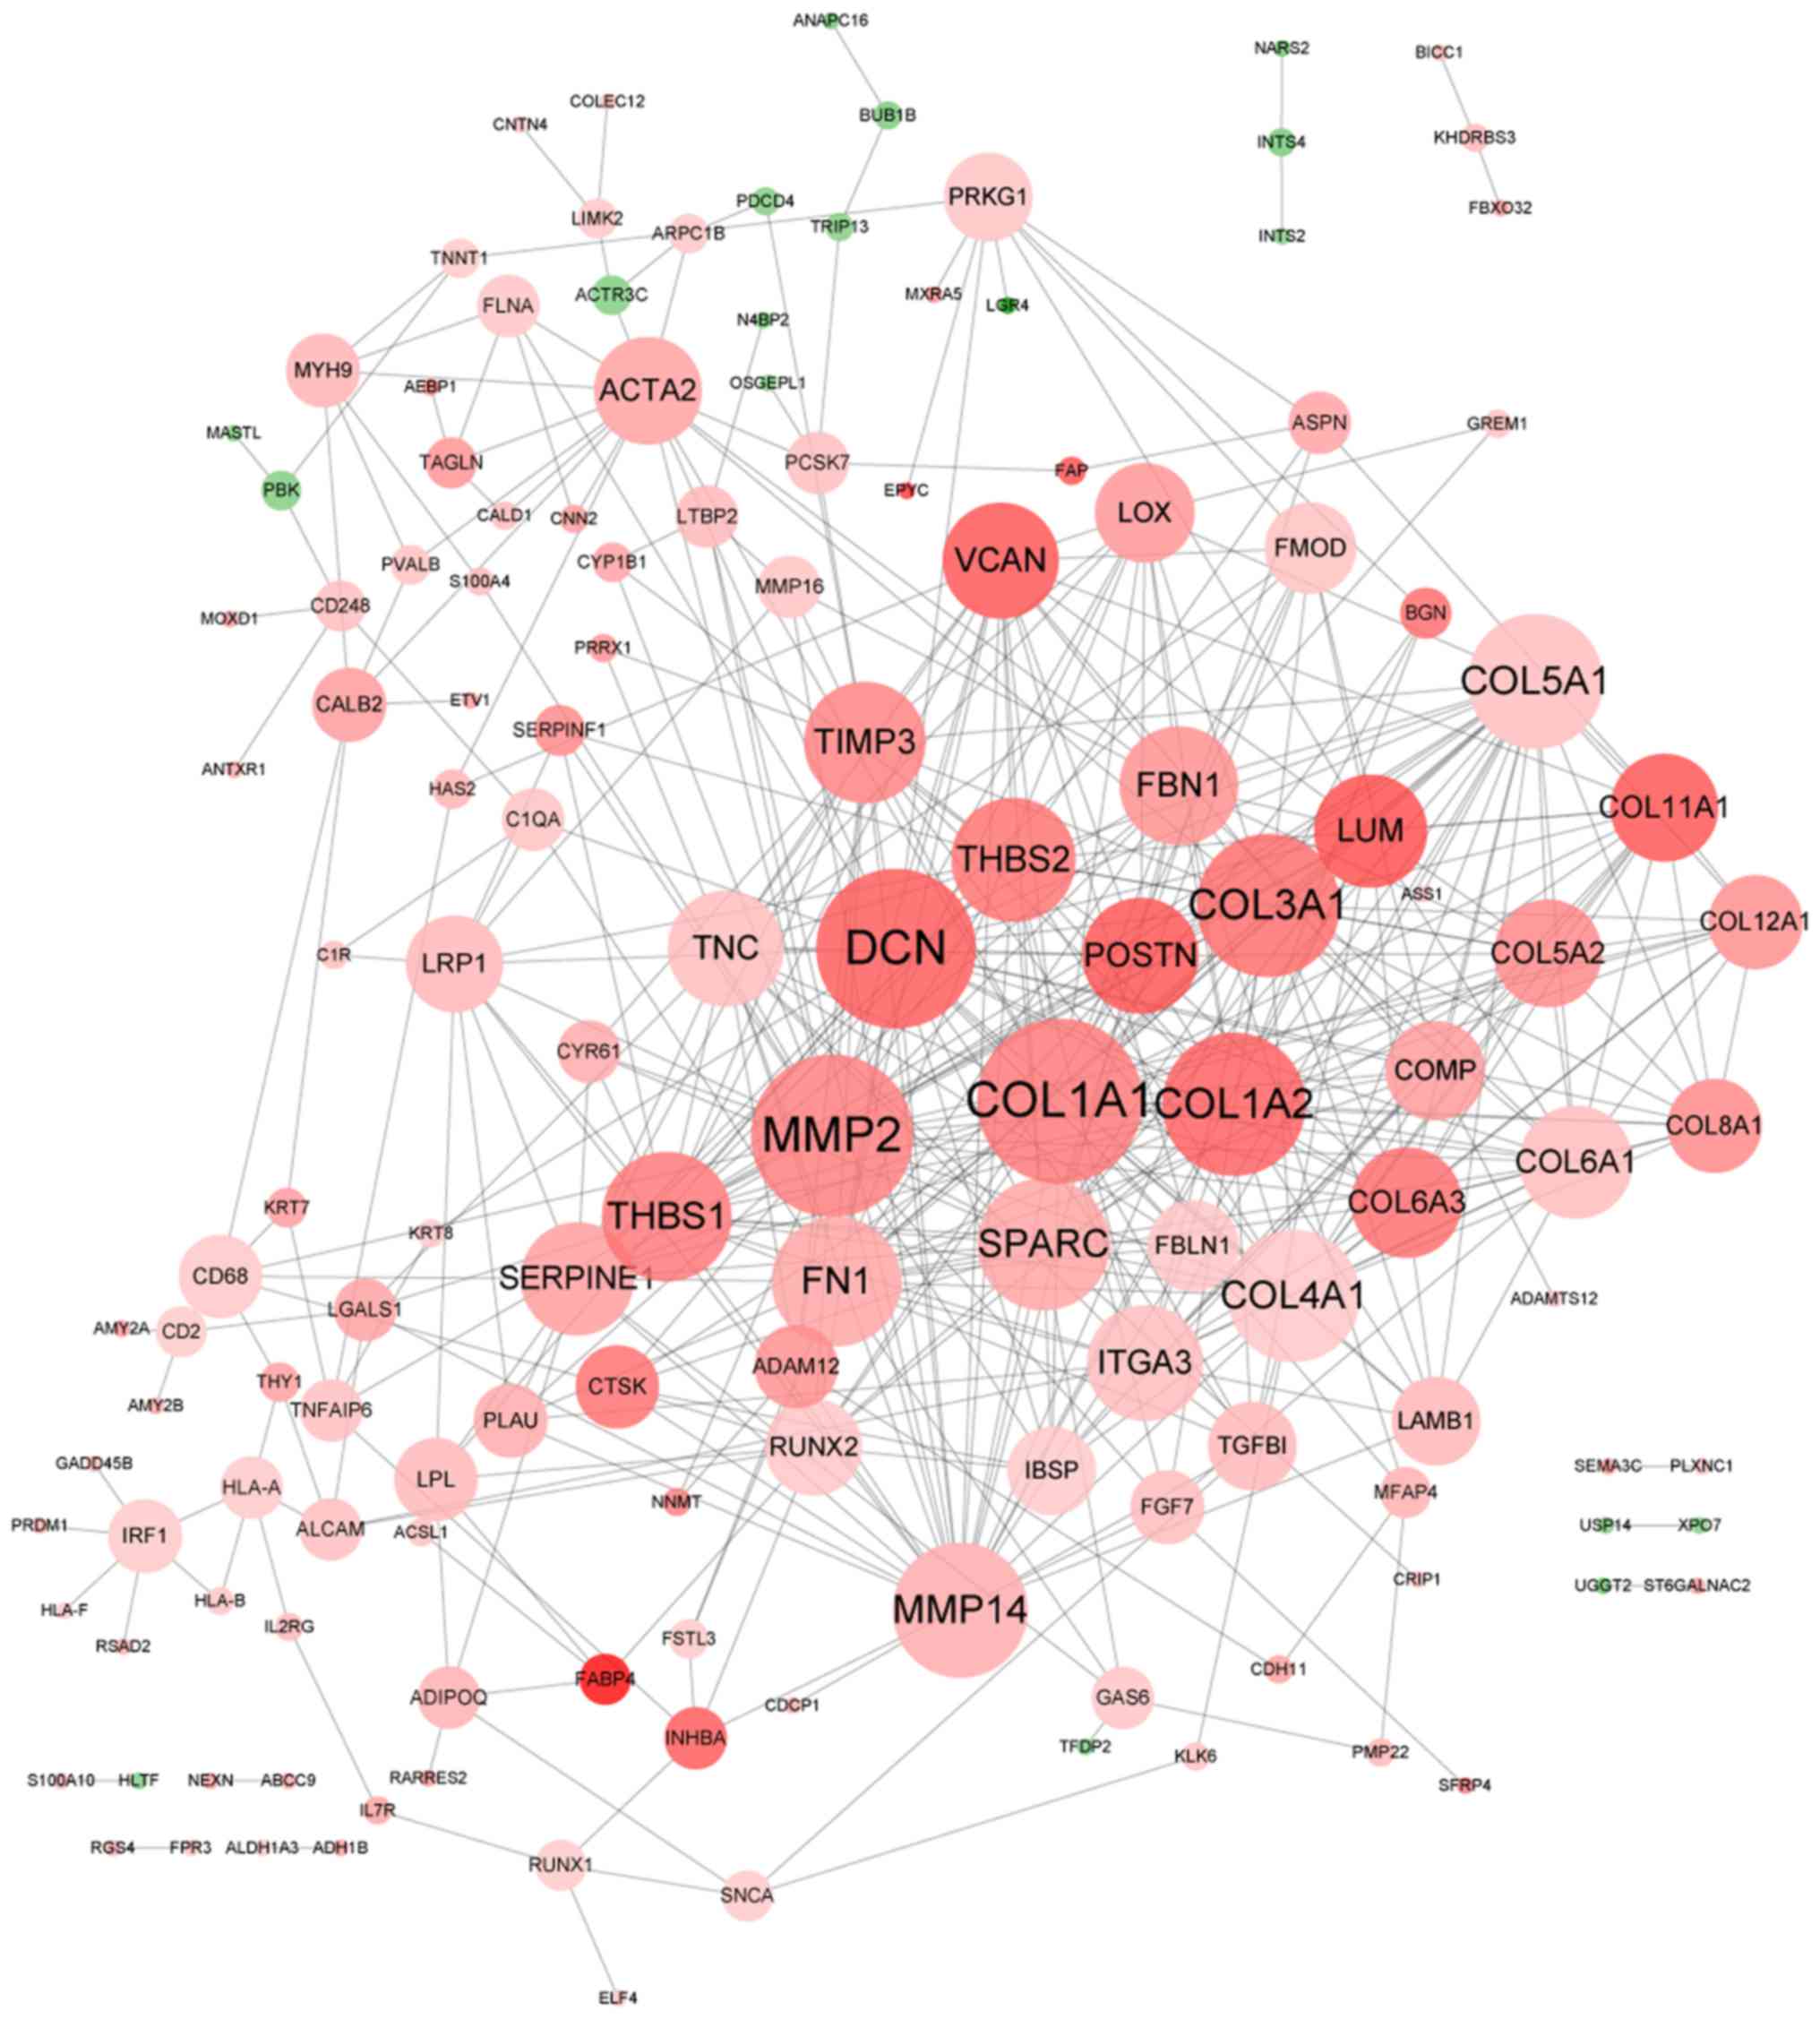
Using the STRING database, a PPI network consisting
of 493 interactions of 146 DEGs was constructed (Fig. 4). The majority of the DEGs were
upregulated, with the exception of 18 downregulated DEGs. A total
of 14 hub genes were identified, including COL1A1
(degree=37), matrix metallopeptidase (MMP)2
(degree=36), decorin (degree=35), COL3A1 (degree=29),
COL1A2 (degree=29), MMP14 (degree=26), COL5A1
(degree=26), secreted protein acidic and cysteine rich (degree=25),
COL4A1 (degree=25), THBS1 (degree=24), fibronectin 1
(degree=24), THBS2 (degree=22), tissue inhibitor of
metalloproteinase (TIMP)3 (degree=21) and fibrillin 1
(degree=20).
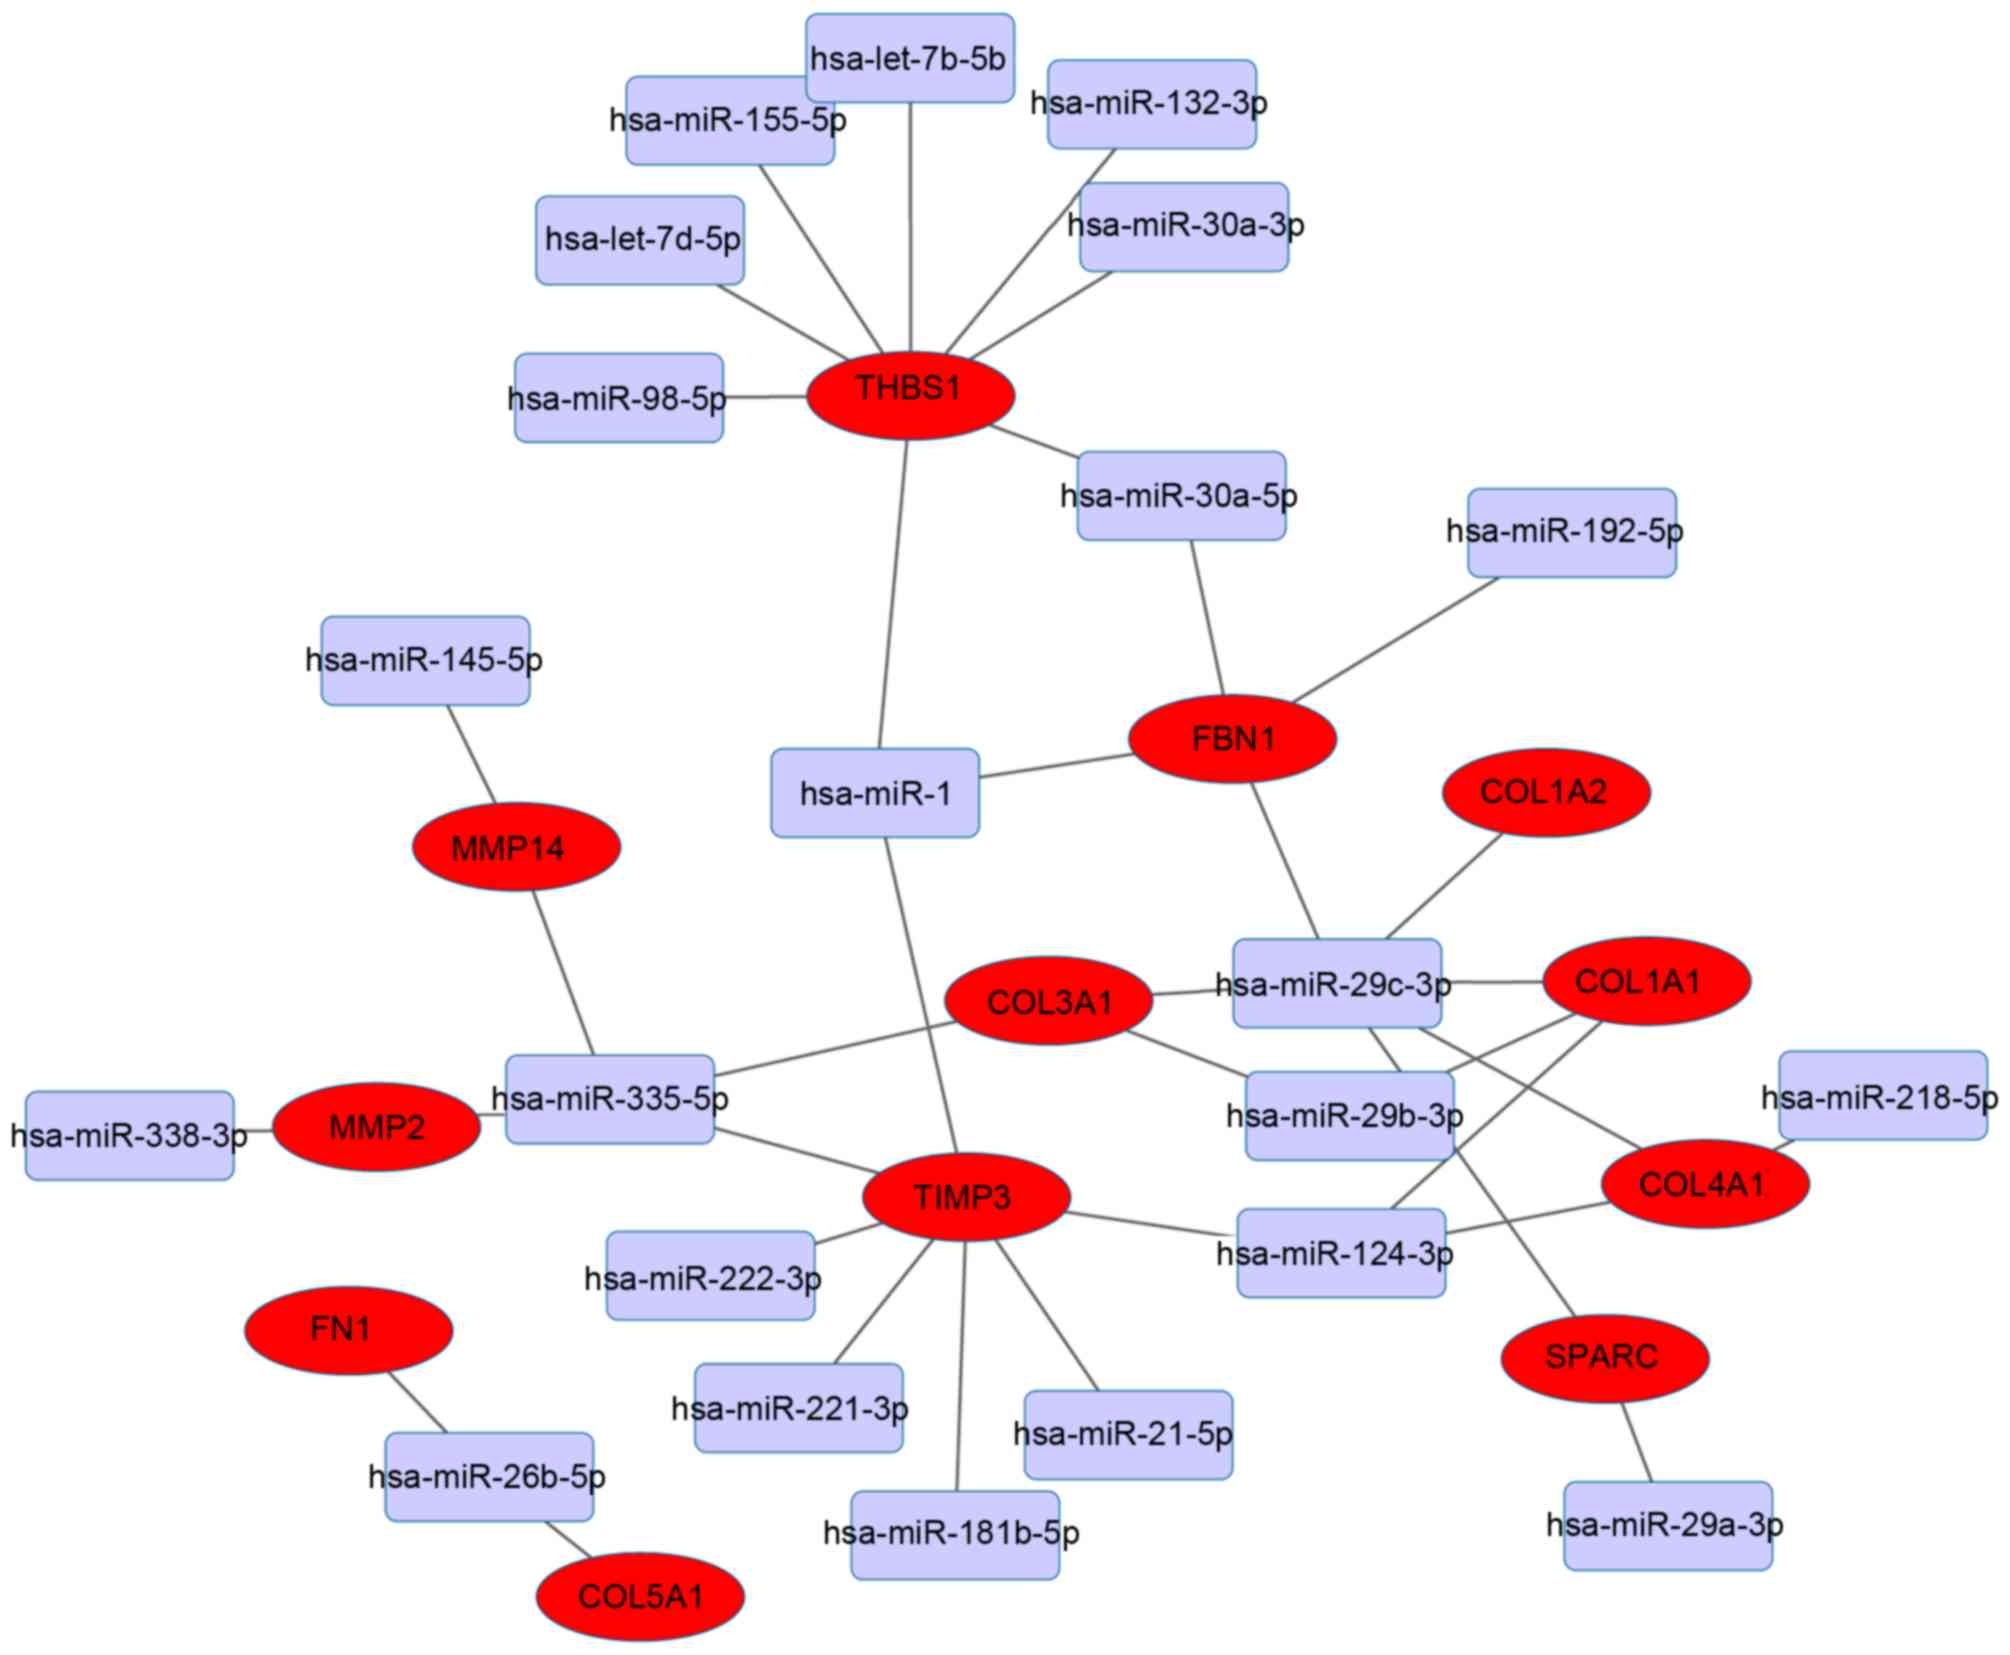
Integrated miRNA-target gene
regulatory network
The present study focused on the 14 hub genes, and
assessed their miRNA-target associations further. The miRNA-target
regulatory network was based on interactions in the aforementioned
validated databases. THBS1 and TIMP3 were the
dominant targets identified and interacted with multiple miRNAs
(Fig. 5). THBS1 was predicted
to be the target of the following eight miRNAs: hsa-miR-98-5p,
hsa-let-7d-5p, hsa-miR-155-5p, hsa-let-7b-5p, hsa-miR-132-3p,
hsa-miR-30a-3p, hsa-miR-30a-5p and hsa-miR-1. TIMP3 was
predicted to be the target of seven miRNAs as follows:
hsa-miR-124-3p, hsa-miR-21-5p, hsa-miR-181b-5p, hsa-miR-221-3p,
hsa-miR-222-3p, hsa-miR-335-5p and hsa-miR-1.
Discussion
The present study identified several DEGs in
metastatic EOS. Of these DEGs, certain collagen (COL11A1,
COL1A1 and COL1A2) and THBS (THBS1 and
THBS2) genes were associated with the PI3K/Akt, ECM-receptor
interaction and cell adhesion signaling pathways. These DEGs were
also hub genes in the PPI network constructed. THBS1 and
TIMP3 dominated the miRNA-target network and were targeted
by hsa-miR-1.
Hepatocyte growth factor (HGF) aids in the
regulation of cell growth and motility. A previous study reported
that HGF serves a crucial function in tumor metastasis by enhancing
cell motility and increasing proteolytic activity in
metalloproteases (15). The PI3K/Akt
signaling pathway is a crucial kinase cascade involving HGF-induced
metastasis and invasion (16). In
uveal melanoma cells, activating the PI3K/Akt signaling pathway
decreases cell adhesion, and thus promotes motility and migration
(17). In glioma cells, the PI3K/Akt
signaling pathway may regulate tumor cell proliferation and
migration (18). Expression of
collagen genes is often regulated via the PI3K/Akt signaling
pathway. In hepatic stellate cells, collagen genes may be regulated
by fascin, a component of actin bundles, through the focal adhesion
kinase/PI3K/Akt signaling pathway (19). In normal human dermal fibroblasts, the
transcription of collagen genes may be stimulated by interleukin-13
via the PI3K/Akt signaling pathway (20). In the present study, certain collagen
genes, including COL11A1, COL1A1 and COL1A2,
were identified as DEGs in metastatic EOC and were enriched in the
PI3K/Akt signaling pathway, suggesting that these collagen genes
may also serve functions in EOC through this signaling pathway,
particularly in metastasis.
ECM proteolysis allows cancer cells to invade and is
thus associated with migration in multiple types of cancer
(21). A previous study demonstrated
that COL11A1 promoted tumor progression in EOC via
ECM-receptor interactions (22), a
similar result to that which the present study revealed using
enrichment analysis. In ovarian cancer cells, the ECM-receptor
interaction signaling pathway is affected by COL1A1
(23). COL1A2 is primarily
associated with the cell adhesion signaling pathway in ovarian
cancer cells (24). These results
suggest that certain collagen genes, including COL11A1,
COL1A1 and COL1A2, may also influence the metastasis
of EOC through the ECM-receptor interaction and cell adhesion
signaling pathways.
THBS1 is an adhesive glycoprotein that
regulates cell-cell and cell-ECM interactions. A previous study
demonstrated that THBS1 expression is associated with, and
may function as a biomarker for the prognosis of, ovarian cancer
(25). Another study demonstrated
that downregulating THBS1 in ovarian cancer promotes tumor
migration (26). According to
comparative proteomic analysis, THBS1 is associated with
cell adhesion, and differentially expressed between low malignant
potential and highly proliferative EOC cell lines (27). THBS2 serves a function in
cell-ECM adhesion (28). Furthermore,
THBS2 is one of ten signature genes associated with cell
adhesion, and is associated with metastasis and poor overall
survival time in patients with serous ovarian cancer (29). Downregulated by the inhibition of the
Hedgehog signaling pathway, THBS1 is associated with
ECM-ovarian cancer cell receptor interaction (30). The enrichment analysis performed in
the present study demonstrated that THBS1 and THBS2
are associated with the cell adhesion and ECM-receptor interaction
signaling pathways, suggesting they may serve key functions in EOC
metastasis via regulating these two pathways.
TIMP3 inhibits MMPs, which are associated
with ECM degradation. In osteosarcoma, lack of TIMP3
expression increases tumor cell proliferation and promotes
migration (31). Arpino et al
(32) demonstrated that TIMP3
serves a key function in the regulation of uterine ECM degradation
during embryo implantation. Furthermore, TIMP3 was a key DEG
identified in metastatic EOC in the present study. Although
TIMP3 was not enriched in ECM-associated signaling pathways
in the present study, TIMP3 was associated with THBS1
in the PPI network, suggesting that TIMP3 may serve a
function in the ECM-receptor interaction signaling pathway during
EOC metastasis.
Since hsa-miR-1 may decrease tumor cell
proliferation in numerous types of cancer and is therefore
considered a tumor suppressor. However, a previous study
demonstrated that the upregulation of hsa-miR-1 was associated with
increased tumor cell growth in relapsed ovarian tumors compared
with ovarian primary tumors (33). In
cardiac tissues, hsa-miR-1 may target TIMP3 (34) and is predicted to target THBS1
in heart failure (35). However,
targeting of TIMP3 and THBS1 by hsa-miR-1 has not yet
been reported in EOC. In the present study, THBS1 and
TIMP3 were predicted as targets of hsa-miR-1, suggesting
that hsa-miR-1 may target the two genes during EOC metastasis.
In conclusion, multiple DEGs and miRNAs were
identified as potential biomarkers for the prognosis of EOC
metastasis in the present study. These DEGs were associated with
the PI3K/Akt, ECM-receptor interaction and cell adhesion signaling
pathways. In addition, THBS1 and TIMP3 were predicted
to be targets of hsa-miR-1. However, these predictive results
require validation by further study.
Acknowledgements
The present study was supported by the Surface
Project of Shandong Provincial Foundation (grant no.
ZR2013HM097).
References
|
1
|
Iorio MV, Visone R, Di Leva G, Donati V,
Petrocca F, Casalini P, Taccioli C, Volinia S, Liu CG, Alder H, et
al: MicroRNA signatures in human ovarian cancer. Cancer Res.
67:8699–8707. 2007. View Article : Google Scholar : PubMed/NCBI
|
|
2
|
Aghajanian C, Blank SV, Goff BA, Judson
PL, Teneriello MG, Husain A, Sovak MA, Yi J and Nycum LR: OCEANS: A
randomized, double-blind, placebo-controlled phase III trial of
chemotherapy with or without bevacizumab in patients with
platinum-sensitive recurrent epithelial ovarian, primary
peritoneal, or fallopian tube cancer. J Clin Oncol. 30:2039–2045.
2012. View Article : Google Scholar : PubMed/NCBI
|
|
3
|
Naora H and Montell DJ: Ovarian cancer
metastasis: Integrating insights from disparate model organisms.
Nat Rev Cancer. 5:355–366. 2005. View
Article : Google Scholar : PubMed/NCBI
|
|
4
|
Brodsky AS, Fischer A, Miller DH, Vang S,
MacLaughlan S, Wu HT, Yu J, Steinhoff M, Collins C, Smith PJ, et
al: Expression profiling of primary and metastatic ovarian tumors
reveals differences indicative of aggressive disease. PLoS One.
9:e944762014. View Article : Google Scholar : PubMed/NCBI
|
|
5
|
Lengyel E: Ovarian cancer development and
metastasis. Am J Pathol. 177:1053–1064. 2010. View Article : Google Scholar : PubMed/NCBI
|
|
6
|
Scotton CJ, Wilson JL, Scott K, Stamp G,
Wilbanks GD, Fricker S, Bridger G and Balkwill FR: Multiple actions
of the chemokine CXCL12 on epithelial tumor cells in human ovarian
cancer. Cancer Res. 62:5930–5938. 2002.PubMed/NCBI
|
|
7
|
Houle CD, Ding XY, Foley JF, Afshari CA,
Barrett JC and Davis BJ: Loss of expression and altered
localization of KAI1 and CD9 protein are associated with epithelial
ovarian cancer progression. Gynecol Oncol. 86:69–78. 2002.
View Article : Google Scholar : PubMed/NCBI
|
|
8
|
Deng J, Wang L, Chen H, Li L, Ma Y, Ni J
and Li Y: The role of tumour-associated MUC1 in epithelial ovarian
cancer metastasis and progression. Cancer Metastasis Rev.
32:535–551. 2013. View Article : Google Scholar : PubMed/NCBI
|
|
9
|
Zhang L, Volinia S, Bonome T, Calin GA,
Greshock J, Yang N, Liu CG, Giannakakis A, Alexiou P, Hasegawa K,
et al: Genomic and epigenetic alterations deregulate microRNA
expression in human epithelial ovarian cancer. Proc Natl Acad Sci
USA. 105:7004–7009. 2008. View Article : Google Scholar : PubMed/NCBI
|
|
10
|
Rich JN, Hans C, Jones B, Iversen ES,
McLendon RE, Rasheed BK, Dobra A, Dressman HK, Bigner DD, Nevins JR
and West M: Gene expression profiling and genetic markers in
glioblastoma survival. Cancer Res. 65:4051–4058. 2005. View Article : Google Scholar : PubMed/NCBI
|
|
11
|
Bindea G, Mlecnik B, Hackl H, Charoentong
P, Tosolini M, Kirilovsky A, Fridman WH, Pagès F, Trajanoski Z and
Galon J: ClueGO: A Cytoscape plug-in to decipher functionally
grouped gene ontology and pathway annotation networks.
Bioinformatics. 25:1091–1093. 2009. View Article : Google Scholar : PubMed/NCBI
|
|
12
|
Luo W and Brouwer C: Pathview: An
R/Bioconductor package for pathway-based data integration and
visualization. Bioinformatics. 29:1830–1831. 2013. View Article : Google Scholar : PubMed/NCBI
|
|
13
|
Szklarczyk D, Franceschini A, Kuhn M,
Simonovic M, Roth A, Minguez P, Doerks T, Stark M, Muller J, Bork
P, et al: The STRING database in 2011: Functional interaction
networks of proteins, globally integrated and scored. Nucleic Acids
Res. 39:(Database issue). D561–D568. 2011. View Article : Google Scholar : PubMed/NCBI
|
|
14
|
Ru Y, Kechris KJ, Tabakoff B, Hoffman P,
Radcliffe RA, Bowler R, Mahaffey S, Rossi S, Calin GA, Bemis L and
Theodorescu D: The multiMiR R package and database: Integration of
microRNA-target interactions along with their disease and drug
associations. Nucleic Acids Res. 42:e1332014. View Article : Google Scholar : PubMed/NCBI
|
|
15
|
Qian F, Engst S, Yamaguchi K, Yu P, Won
KA, Mock L, Lou T, Tan J, Li C, Tam D, et al: Inhibition of tumor
cell growth, invasion, and metastasis by EXEL-2880 (XL880,
GSK1363089), a novel inhibitor of HGF and VEGF receptor tyrosine
kinases. Cancer Res. 69:8009–8016. 2009. View Article : Google Scholar : PubMed/NCBI
|
|
16
|
Shi MD, Liao YC, Shih YW and Tsai LY:
Nobiletin attenuates metastasis via both ERK and PI3K/Akt pathways
in HGF-treated liver cancer HepG2 cells. Phytomedicine. 20:743–752.
2013. View Article : Google Scholar : PubMed/NCBI
|
|
17
|
Ye M, Hu D, Tu L, Zhou X, Lu F, Wen B, Wu
W, Lin Y, Zhou Z and Qu J: Involvement of PI3K/Akt signaling
pathway in hepatocyte growth factor-induced migration of uveal
melanoma cells. Invest Ophthalmol Vis Sci. 49:497–504. 2008.
View Article : Google Scholar : PubMed/NCBI
|
|
18
|
Chan KHB: Effect of CAL-101 on gene
regulation of phosphoinositol 3-kinase isoform p110δ in the
pathogenesis of glioblastoma multiforme. 2013.
|
|
19
|
Uyama N, Iimuro Y, Kawada N, Reynaert H,
Suzumura K, Hirano T, Kuroda N and Fujimoto J: Fascin, a novel
marker of human hepatic stellate cells, may regulate their
proliferation, migration, and collagen gene expression through the
FAK-PI3K-Akt pathway. Lab Invest. 92:57–71. 2012. View Article : Google Scholar : PubMed/NCBI
|
|
20
|
Moriya C, Jinnin M, Yamane K, Maruo K,
Muchemwa FC, Igata T, Makino T, Fukushima S and Ihn H: Expression
of matrix metalloproteinase-13 is controlled by IL-13 via PI3K/Akt3
and PKC-δ in normal human dermal fibroblasts. J Invest Dermatol.
131:655–661. 2011. View Article : Google Scholar : PubMed/NCBI
|
|
21
|
Wolf K and Friedl P: Mapping proteolytic
cancer cell-extracellular matrix interfaces. Clin Exp Metastasis.
26:289–298. 2009. View Article : Google Scholar : PubMed/NCBI
|
|
22
|
Wu YH, Chang TH, Huang YF, Huang HD and
Chou CY: COL11A1 promotes tumor progression and predicts poor
clinical outcome in ovarian cancer. Oncogene. 33:3432–3440. 2014.
View Article : Google Scholar : PubMed/NCBI
|
|
23
|
Kumar S, Kumar A, Shah PP, Rai SN,
Panguluri SK and Kakar SS: MicroRNA signature of cis-platin
resistant vs. cis-platin sensitive ovarian cancer cell lines. J
Ovarian Res. 4:172011. View Article : Google Scholar : PubMed/NCBI
|
|
24
|
Cui J, Miner BM, Eldredge JB, Warrenfeltz
SW, Dam P, Xu Y and Puett D: Regulation of gene expression in
ovarian cancer cells by luteinizing hormone receptor expression and
activation. BMC Cancer. 11:2802011. View Article : Google Scholar : PubMed/NCBI
|
|
25
|
Abbott KL, Lim JM, Wells L, Benigno BB,
McDonald JF and Pierce M: Identification of candidate biomarkers
with cancer-specific glycosylation in the tissue and serum of
endometrioid ovarian cancer patients by glycoproteomic analysis.
Proteomics. 10:470–481. 2010. View Article : Google Scholar : PubMed/NCBI
|
|
26
|
Park K, Chung YJ, So H, Kim K, Park J, Oh
M, Jo M, Choi K, Lee EJ, Choi YL, et al: AGR2, a mucinous ovarian
cancer marker, promotes cell proliferation and migration. Exp Mol
Med. 43:91–100. 2011. View Article : Google Scholar : PubMed/NCBI
|
|
27
|
Gagné JP, Éthier C, Gagné P, Mercier G,
Bonicalzi ME, Mes-Masson AM, Droit A, Winstall E, Isabelle M and
Poirier GG: Comparative proteome analysis of human epithelial
ovarian cancer. Proteome Sci. 5:162007. View Article : Google Scholar : PubMed/NCBI
|
|
28
|
Ahmed AA, Mills AD, Ibrahim AE, Temple J,
Blenkiron C, Vias M, Massie CE, Iyer NG, McGeoch A, Crawford R, et
al: The extracellular matrix protein TGFBI induces microtubule
stabilization and sensitizes ovarian cancers to paclitaxel. Cancer
Cell. 12:514–527. 2007. View Article : Google Scholar : PubMed/NCBI
|
|
29
|
Cheon DJ, Tong Y, Sim MS, Dering J, Berel
D, Cui X, Lester J, Beach JA, Tighiouart M, Walts AE, et al: A
collagen-remodeling gene signature regulated by TGF-β signaling is
associated with metastasis and poor survival in serous ovarian
cancer. Clin Cancer Res. 20:711–723. 2014. View Article : Google Scholar : PubMed/NCBI
|
|
30
|
Chen Q, Xu R, Zeng C, Lu Q, Huang D, Shi
C, Zhang W, Deng L, Yan R, Rao H, et al: Down-regulation of Gli
transcription factor leads to the inhibition of migration and
invasion of ovarian cancer cells via integrin β4-mediated FAK
signaling. PLoS One. 9:e883862014. View Article : Google Scholar : PubMed/NCBI
|
|
31
|
Han XG, Li Y, Mo HM, Li K, Lin D, Zhao CQ,
Zhao J and Tang TT: TIMP3 regulates osteosarcoma cell migration,
invasion, and chemotherapeutic resistances. Tumor Biol.
37:8857–8867. 2016. View Article : Google Scholar
|
|
32
|
Arpino V, Brock M and Gill SE: The role of
TIMPs in regulation of extracellular matrix proteolysis. Matrix
Biol. 44–46:247–254. 2015. View Article : Google Scholar
|
|
33
|
Stope MB, Delogu S, Diesing K, Klinkmann
G, Evert M, Koensgen D, Zygmunt M, Burchardt M and Mustea A:
Expression pattern of the microRNA miR-1 in ovarian cancer cell
lines and tumor tissue samples implies a loss of miR-1's tumor
suppressor properties. Rna Disease. 1:e3842014.
|
|
34
|
Vacchi-Suzzi C, Hahne F, Scheubel P,
Marcellin M, Dubost V, Westphal M, Boeglen C, Büchmann-Møller S,
Cheung MS, Cordier A, et al: Heart structure-specific
transcriptomic atlas reveals conserved microRNA-mRNA interactions.
PLoS One. 8:e524422013. View Article : Google Scholar : PubMed/NCBI
|
|
35
|
Tsoutsman T, Wang X, Garchow K, Riser B,
Twigg S and Semsarian C: CCN2 plays a key role in extracellular
matrix gene expression in severe hypertrophic cardiomyopathy and
heart failure. J Mol Cell Cardiol. 62:164–178. 2013. View Article : Google Scholar : PubMed/NCBI
|