Introduction
Ovarian cancer is a common malignant tumor of female
genitalia. The incidence of ovarian cancer is ranked third among
all the malignant tumors which is lower only to that of cervical
cancer and uterine cancer (1,2). However, the mortality rate of ovarian
epithelial cancer is the highest among all the gynecological tumors
(2). With the increase use of
chemotherapeutic agents, drug resistance of cancer cells poses a
challenge and has attracted attention. At present, the most common
type of drug resistance in ovarian cancer is the resistance to
VP16. VP-16 is a cell cycle-specific antineoplastic drug that acts
on the late stage or G2 phase of cell division. VP-16 can bind
topoisomerase II to form a drug-enzyme-DNA stable but fragile
complex, which in turn affects the function of DNA topoisomerase
II. However, drug resistance is easy to develope during VP-16
treatment (3,4).
Leucine-rich repeat and immunoglobulin-like domain
(LRIG)-1, 2 and 3 are a class of novel tumor suppressor molecules.
There is evidence to prove that LRIG-1, 2 and 3 have good
prognostic value in evaluation of breast cancer (5), cervical cancer (6), head and neck cancer (7), glioma (8),
prostate cancer (9), skin squamous
cell carcinoma (10) and other
malignant tumors.
Based on previous studies, our study aimed to
further explore the roles of LRIG-1 ovarian cancer cells and
drug-resistant cells.
Materials and methods
Experimental materials and
grouping
Experimental materials: SKOV3 and SKOV3/VP16 cell
lines were purchased from the cell bank of the Chinese Academy of
Medical Sciences.
Experiment grouping: i) VP16 treatment SKOV3 group;
ii) NC + VP16 treatment SKOV3 group; and iii) siRNA LRIG1 + VP16
treatment SKOV3 group.
Cell culture
Human ovarian cancer cell line SKOV3 and VP16
drug-resistant cell line SKOV3/VP16 cells were used for the
experiments. The drug-resistant cells were treated with VP16 at a
persistent concentration of 1 mg/l.
Experimental reagents and
instruments
The following were purchased: Fetal bovine serum
(Gibco, Carlsbad, CA, USA); DMEM-high glucose medium (Hyclone, CA,
USA); streptomycin, phosphate-buffered saline (PBS) and Cell
Counting kit (CCK)-8, (Dojindo, Kumamoto, Japan), Lipofectamine™
2000 (Invitrogen, Carlsbad, CA, USA); Annexin V/PI apoptosis kit
(Liankebio, Hangzhou, China); crystal violet dyeing solution
(home-prepared); RNA extraction reagents: TRIzol (Takara, Dalian,
China); Best Mas® SYBR-Green qPCR Master Mix and diethyl
pyrocarbonate (DEPC) water, both from (Sigma-Aldrich, St. Louis,
MO, USA); RNasin (Promega, Madison, WI, USA); Bestar qPCR RT kit
(Sigma); clean bench (Suzhƒou Purification Equipment Company,
Suzou, China); UV spectrophotometer (UV-1206) (Shimodzu, Kyoto,
Japan); refrigerated centrifuge (SCR20B) (Hitachi, Tokyo, Japan);
desktop low temperature high-speed centrifuge (Eppendorf, Berlin,
Germany); horizontal electrophoresis tank (Beijing Oriental
Instrument Factory, Beijing, China); gel imaging system (Bio-Rad,
Richmond, CA, USA); ABI9700 PCR machine (Applied Biosystems; Thermo
Fisher Scientific, Inc., Waltham, MA, USA); Stratagene Mx3000P Real
Time PCR machine (Agilent, Santa Clara, CA, USA); inverted
microscope (Leica, Berlin, Germany); CO2 cell incubator
(Thermo, Santa Rosa, CA, USA). All the primers used in this study
were designed and synthesized by Shanghai Sangon Biological
Engineering Technology & Services Co., Ltd. (Shanghai,
China).
mRNA expression
RNA extraction
For RNA extraction the appropriate number of cells
were collected, 1 ml TRIzol reagent was added and the mixture was
agitated at room temperature for 5 min. Chloroform (0.2 ml) was
added, mixed for 15 sec, and left to stand for 3 min.
Centrifugation was the performed at 10,500 × g for 10 min at 4°C.
The supernatant was removed and transferred to a new tube. An equal
volume of isopropyl alcohol was added, mixed, and left to stand for
20 min. Centrifugation was conducted at 10,500 × g for 10 min at
4°C. The liquid was then discarded. The cells were washed with 1 ml
75% alcohol followed by centrifugation at 10,500 × g for 5 min at
4°C, after which the liquid was discarded. RNA was air dried at
room temperature, and 30 µl of DEPC water was added to dissolve the
RNA. The mixture was stored at −80°C.
Reverse transcription
Total RNA (1 µl) was used as a template to prepare a
20 µl volume reverse transcription reaction system to synthesize
the first strand according to the instruction of the Bestar RT-qPCR
kit. The reaction solution was prepared according to the following
system: 1.0 µl RNA; 1.0 µl primer mix; X µl DEPC H2O;
total, 11 µl. Then, at 65°C for 5 min, and placed on ice. The
reaction solution was prepared as follows: 11 µl mixture from the
former step; 4.0 µl of 5X RT buffer; 1.0 µl of RT enzyme mix; 4.0
µl of DEPC water; at a total volume of 20 µl; and 37°C for 60 min,
98°C for 10 min.
PCR assay
The primer sequences used were: GAPDH forward,
5′-TGTTCGTCATGGGTGTGAA-3′ and reverse, 5′-ATGGCATGGACTGTGGTCAT-3′;
LRIG1 forward, 5′-GACCCTTTCTGACCGACAA-3′ and reverse,
5′-CGCTTTCCACGGCTCTTT-3′. The reaction system was 20 µl (DBI
Bestar® SYBR-Green qPCR Master Mix). The reaction system
was prepared according to the following system: Bestar®
SYBR-Green qPCR Master Mix 10 µl; PCR forward primer (10 µM) 0.5
µl; PCR reverse primer (10 µM); CDNA template 1 µl;
ddH2O 8 µl; total 20 µl. The PCR reaction conditions
were 94°C for 2 min, followed by 40 cycles of 94°C, 58°C and 72°C
for 20 sec. For the melting curve analysis, the temperature was
62–95°C. Each sample was repeated 3 times. Fluorescence
quantitative PCR was performed with Agilent Stratagene Fluorescence
Quantitative PCR Mx3000P.
siRNA sequence
The primer sequences for siRNA were: siRNA sense,
5′-GGCCUACCUUUCCUUAGAATT-3′ and antisense,
5′-UUCUAAGGAAAGGUAGGCCTT-3′; NC sense, 5′-UUCUCCGAACGUGUCACGUTT-3′
and antisense, 5′-ACGUGACACGUUCGGAGAATT-3′.
Data processing
Data were processed using the 2−ΔΔCt
method, as follows: Ct = (Ct of target gene - Ct of endogenous
control); Ct = the mean value of (Ct of target gene in experimental
sample - Ct of target gene in reference sample) ± standard
deviation (if no reference sample was included, the sample with the
highest Ct value was used as a reference). The initial amount of
template was calculated as the mean value of (2−ΔΔCt) ±
standard deviation.
CCK-8 method to detect cell proliferation
Plasmids used in this study were purchased from
Addgene Corporation (Cambridge, MA, USA) for the vector
construction.
Experimental grouping: i) VP16 treatment SKOV3
group; ii) NC + VP16 treatment SKOV3 group; and iii) siRNA LRIG1 +
VP16 treatment SKOV3 group.
Experimental method
One day before transfection, 1×10⁴ cells
were inoculated into a 96-well plate containing 100 µl of complete
medium and the cell density at the time of transfection was 50–70%.
NC and siRNA LRIG1/sh LRIG1 were added to 25 µl of serum-free and
antibiotic-free DMEM and mixed. Lipofectamine was added to 25 µl of
serum-free and antibiotic-free DMEM and gently mixed and left to
stand for 5 min at room temperature. The diluted siRNA LRIG1 and
Lipofectamine reagents were mixed and left to stand at room
temperature for 20 min, and 50 µl mixture was then added to each
well containing cells and 50 µl medium, and the plates were then
gently agitated back and forth. The cell culture plate was then
transferred to a CO2 incubator for 4 h, and the medium
was replaced. The culture medium was removed, and 100 µl CCK-8
solution was diluted with 1 ml complete medium at a ratio of 1:10
and added at 0, 24, 48 and 72 h after transfection, respectively,
avoiding air bubbles. The culture plate was kept in the incubator
for 1 h and the microplate reader was then used to detect the OD
value at 450 nm.
Flow cytometry to detect cell apoptosis
One day before transfection, 1×10⁵ cells
were inoculated into a 6-well plate containing 2 ml complete medium
and the cell density at the time of transfection was 50–70%.
Plasmid or siRNA was added to 250 µl of serum-free and
antibiotic-free DMEM and mixed. Lipofectamine was added to 250 µl
of serum-free and antibiotic-free DMEM and gently mixed and left to
stand for 5 min at room temperature. The diluted siRNA LRIG1 and
Lipofectamine reagents were mixed and left to stand at room
temperature for 20 min, then 500 µl mixture was added to each well
containing cells and medium, and the plates were then gently
agitated back and forth. The cell culture plate was transferred to
a CO2 incubator for 4 h and the medium was then replaced
with complete medium. The cells were collected at 5 h after
transfection for subsequent detection. We diluted the 5X to 1X
binding buffer with ddH2O and 5 µl Annexin V and 10 µl
PI, and 0.5 ml 1X binding buffer were mixed to prepare Annexin V/PI
staining solution. The medium in the culture plate was aspirated
and the cells were rinsed with 2 ml PBS per well. PBS was then
removed and 0.5 ml 0.25% trypsin was added into each well, the
digestion was monitored under a microscope, the trypsin was removed
when cytoplasm was retracted and the cells were no longer attached
to each other. Then, 2 ml PBS was added to produce a single cell
suspension and the cell suspension was transferred to a flow tube,
followed by centrifugation for 5 min at 850 × g, discarding the
supernatant. Annexin V/PI staining solution (200 µl) was added to
resuspend the cells. The cells were incubated in the dark for 15
min and then detected.
Colony formation assay
To determine colony formation the cells were divided
as follows: i) VP16 treatment SKOV3 group ii) NC + VP16 treatment
SKOV3 group and iii) siRNA LRIG1 + VP16-treated SKOV3 cells were
divided into groups.
Experimental method
The cells were initially collected during the
exponential growth period using conventional digestion and
subculture methods to prepare cell suspension. Cell suspension was
mixed by pipetting to separate the cells from each other. The
single cell percentage was >95%. According to the cell
proliferation ability, the cell suspension was diluted. Generally,
5 ml of cell suspension containing 200 cells was inoculated into a
culture dish (diameter 60 mm) and the dishes were gently shaken in
a cross direction to disperse the cells uniformly. The culture dish
was incubated for 2 to 3 weeks (37°C, 5% CO2) and fresh
culture medium was used to replace the old medium according to the
changes of pH value. When the visible clones appeared in the
culture dish, the culture was terminated and the culture medium was
discarded. The PBS solution was used to carefully wash the cells
twice and the cells were then air-dried. The cells were fixed with
methanol for 15 min, and air-dried after discarding the methanol.
Then the cells were stained with crystal violet for 10 min,
followed by washing with water. Finally, the cells were
air-dried.
Results
Detection of LRIG1 expression in
ovarian cancer cell lines and VP16 drug-resistant cell lines
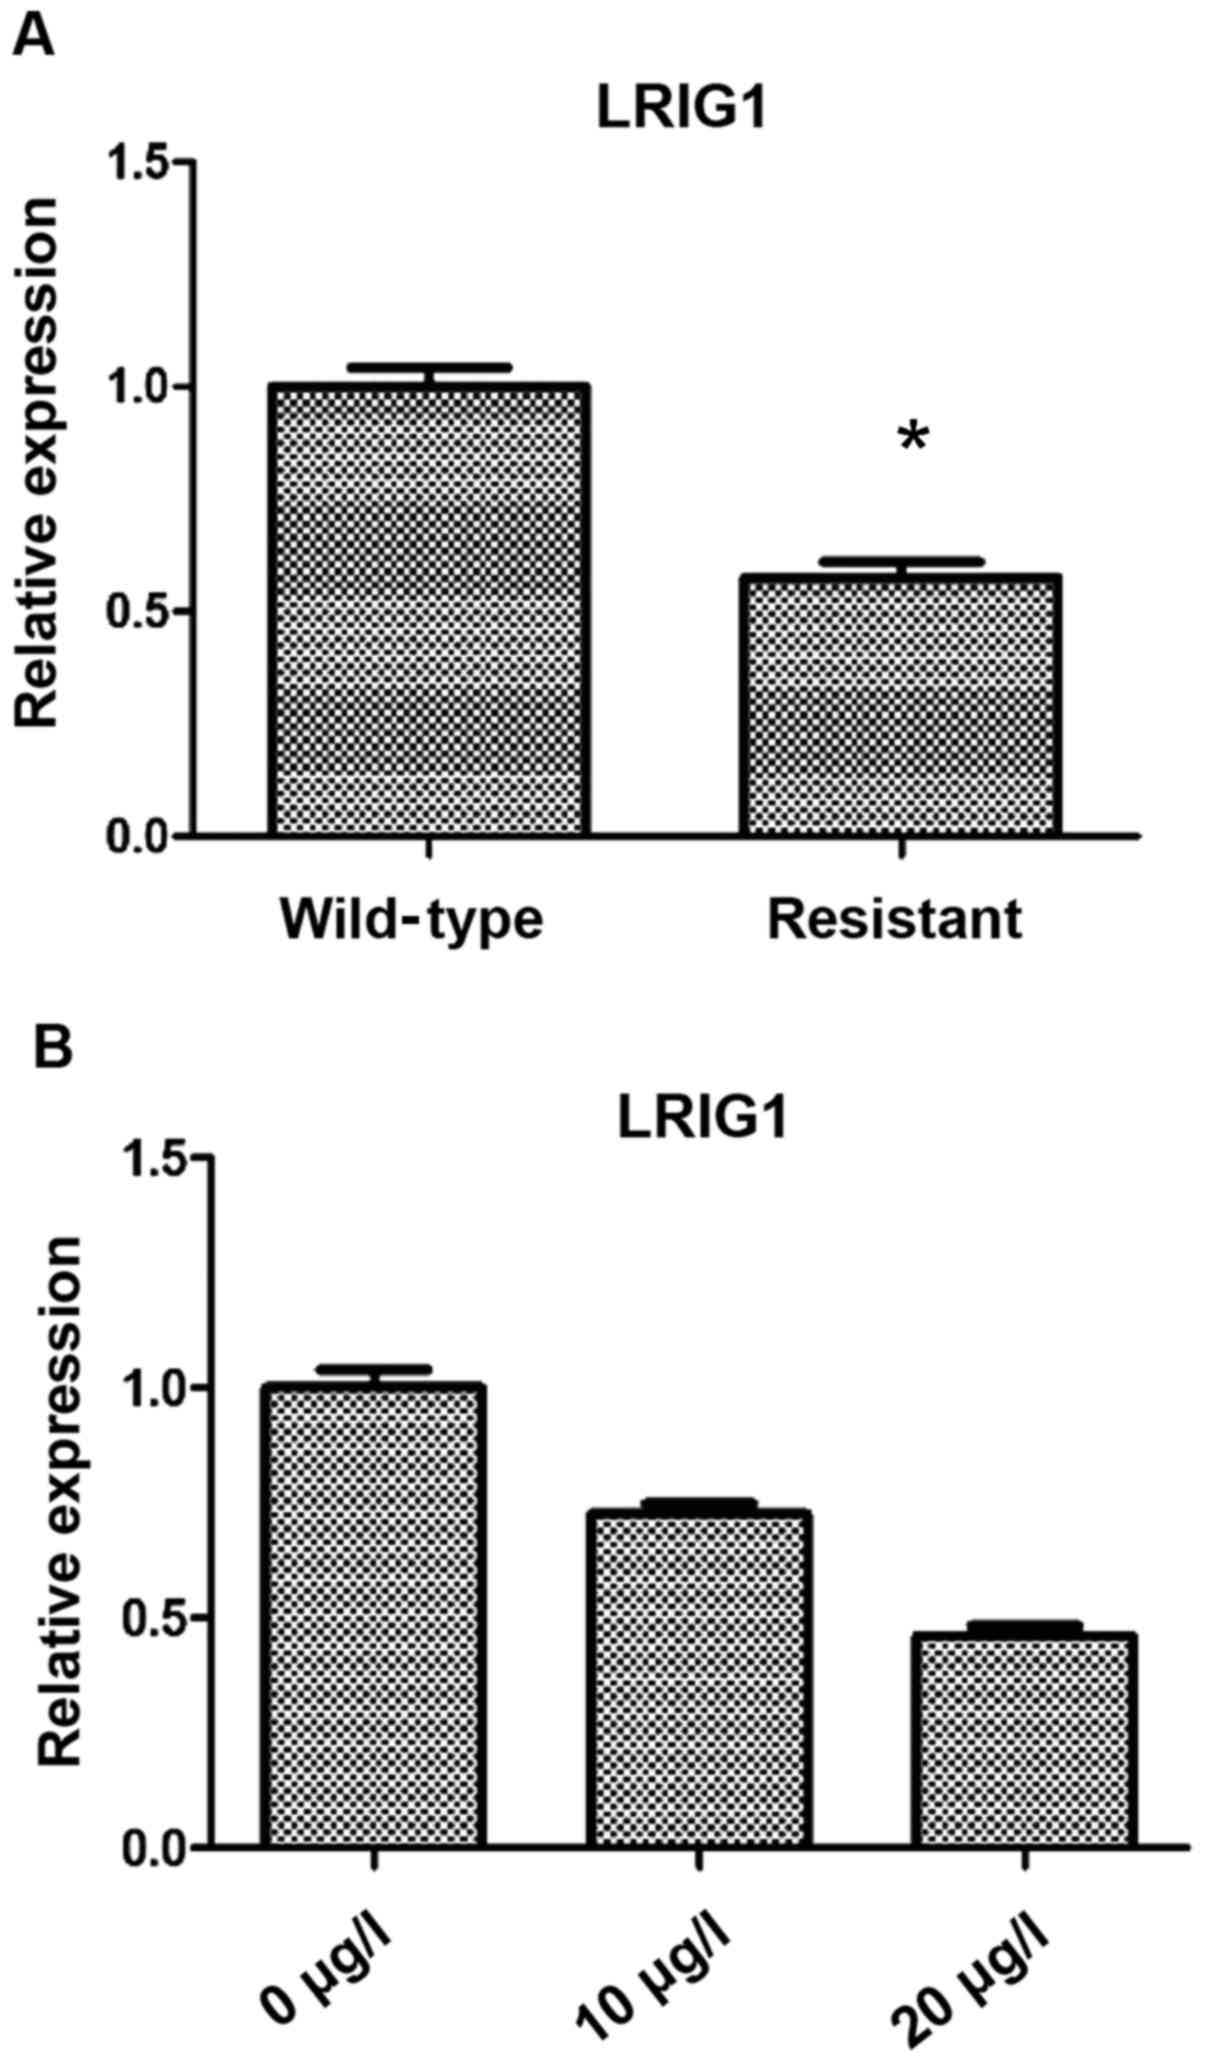
The differences in LRIG1 expression between
resistant and wild-type cells were as follows: Compared with the
wild-type cells, the expression level of LRIG1 in drug resistant
cells was significantly decreased (P<0.05) (Fig. 1A). Based on this result, three VP16
concentrations were used to treat SKOV3 cells for 48 h, and RT-qPCR
was then used to detect the expression of LRIG1. We found that the
expression of LRIG1 was significantly decreased with the increase
of VP16 concentration (P<0.05) (Fig.
1B).
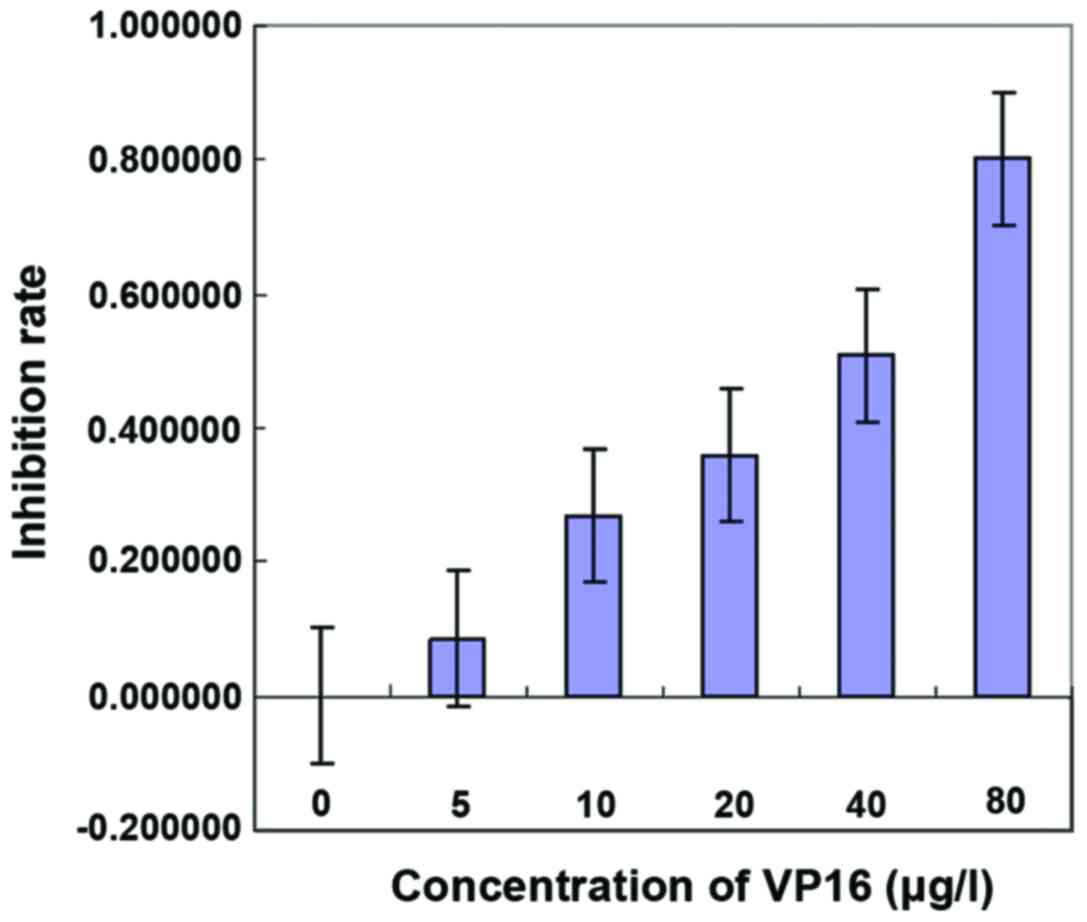
Effect of VP16 on the IC50
of SKOV3
CCK-8 was used to detect the effect of VP16 on the
IC50 of SKOV3. Different concentrations of VP16 (0, 5,
10, 20, 40 and 80 µg/l) were used to treat the cells. The results
showed that the inhibition rate of tumor cell growth was related to
the concentration of VP16. The higher VP16 concentration was
followed by the stronger ability of VP16 to inhibit the growth of
tumor cells, in a dose-dependent manner. The results showed that
IC50 = 30,623 µg/l (Fig.
2, Table I).
 | Table I.Inhibition rates of cell growth under
different concentrations of VP16. |
Table I.
Inhibition rates of cell growth under
different concentrations of VP16.
| Concentrations | Mean OD value | Mean apoptosis
rate | Inhibition rate |
|---|
| 0 | 0.586667 | 0.467 | 0.000000 |
| 5 | 0.546333 | 0.426667 | 0.086367 |
| 10 | 0.460333 | 0.340667 | 0.270521 |
| 20 | 0.418333 | 0.298667 | 0.360457 |
| 40 | 0.348667 | 0.229 | 0.509636 |
| 80 | 0.212667 | 0.093 | 0.800857 |
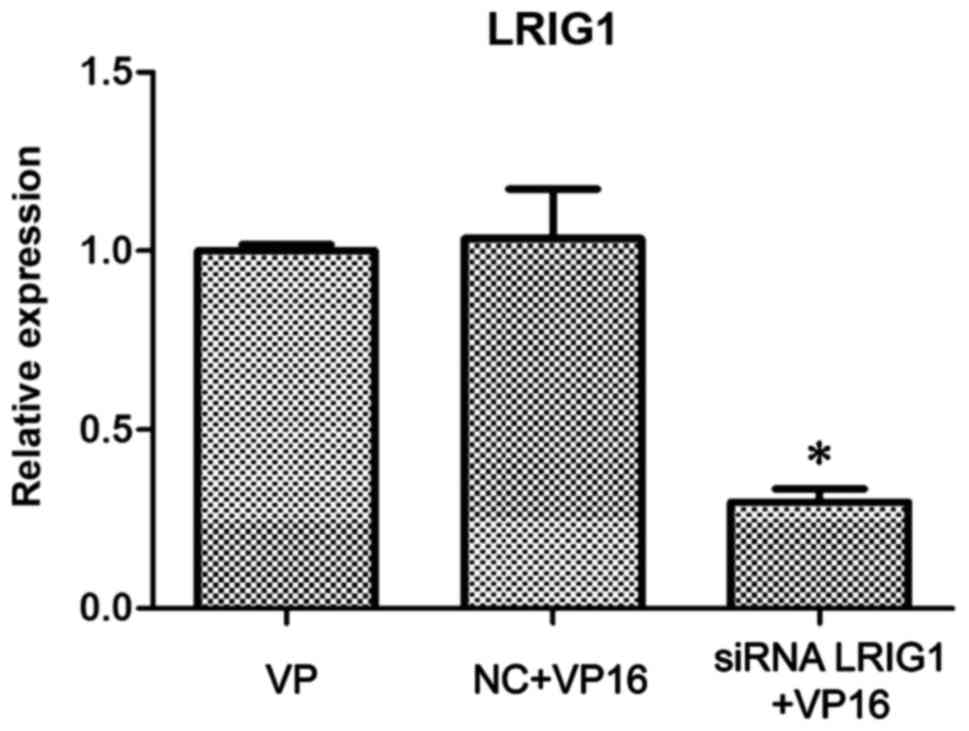
Silencing of LRIG1 in SKOV3 cells
The siRNA LRIG1 was designed and used to transfect
wild-type SKOV3. After 24 h, VP16 (IC50) was added.
After 48-h treatment, the cells were divided into the VP16, NC +
VP16 and siRNA LRIG1 + VP16 treatment group. The western blot
analysis showed that the expression of LRIG1 protein in the siRNA
LRIG1 + VP16 treated group was significantly lower than that in the
VP16 and the NC + VP16-treated group (P<0.05) (Fig. 3).
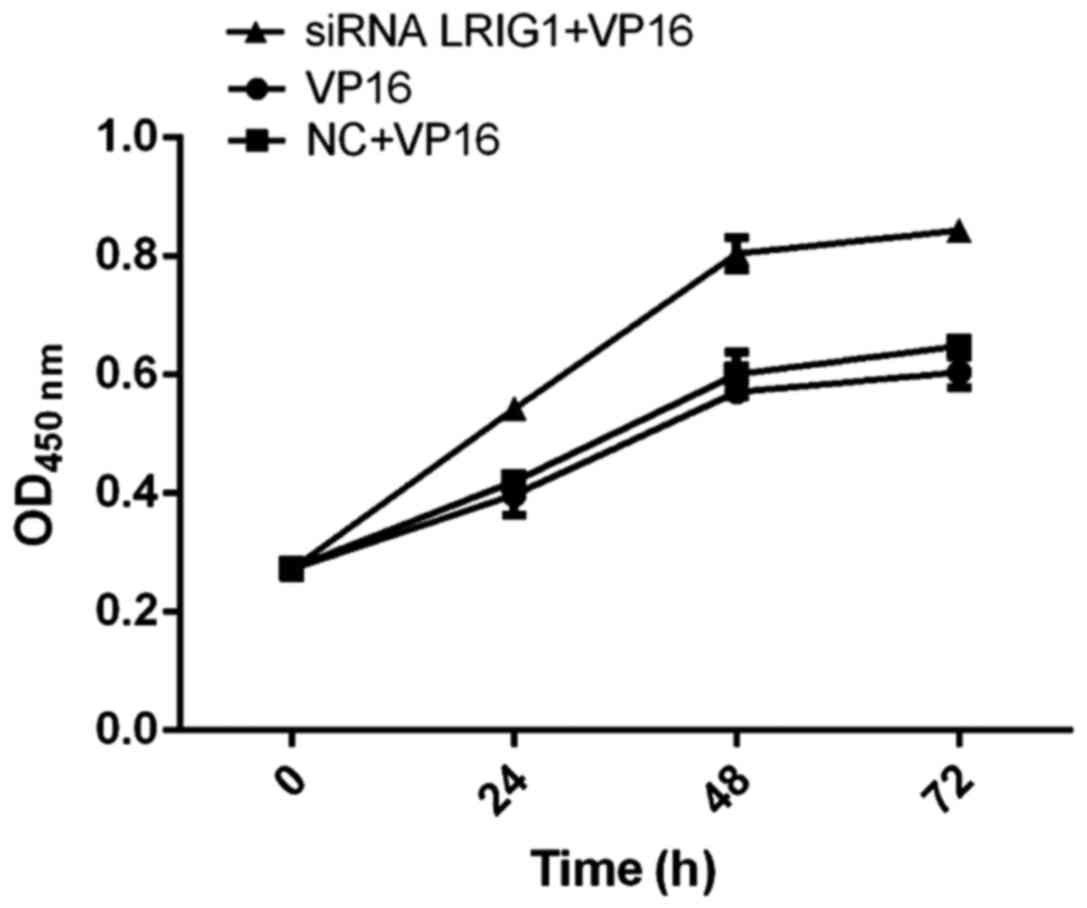
Cell viability detected by CCK-8
method
The cell viability of siRNA LRIG1 + VP16 treatment
group was significantly higher than that of VP16 and NC + VP16
treatment group, suggesting that silencing LRIG1 can promote cell
viability (Fig. 4).
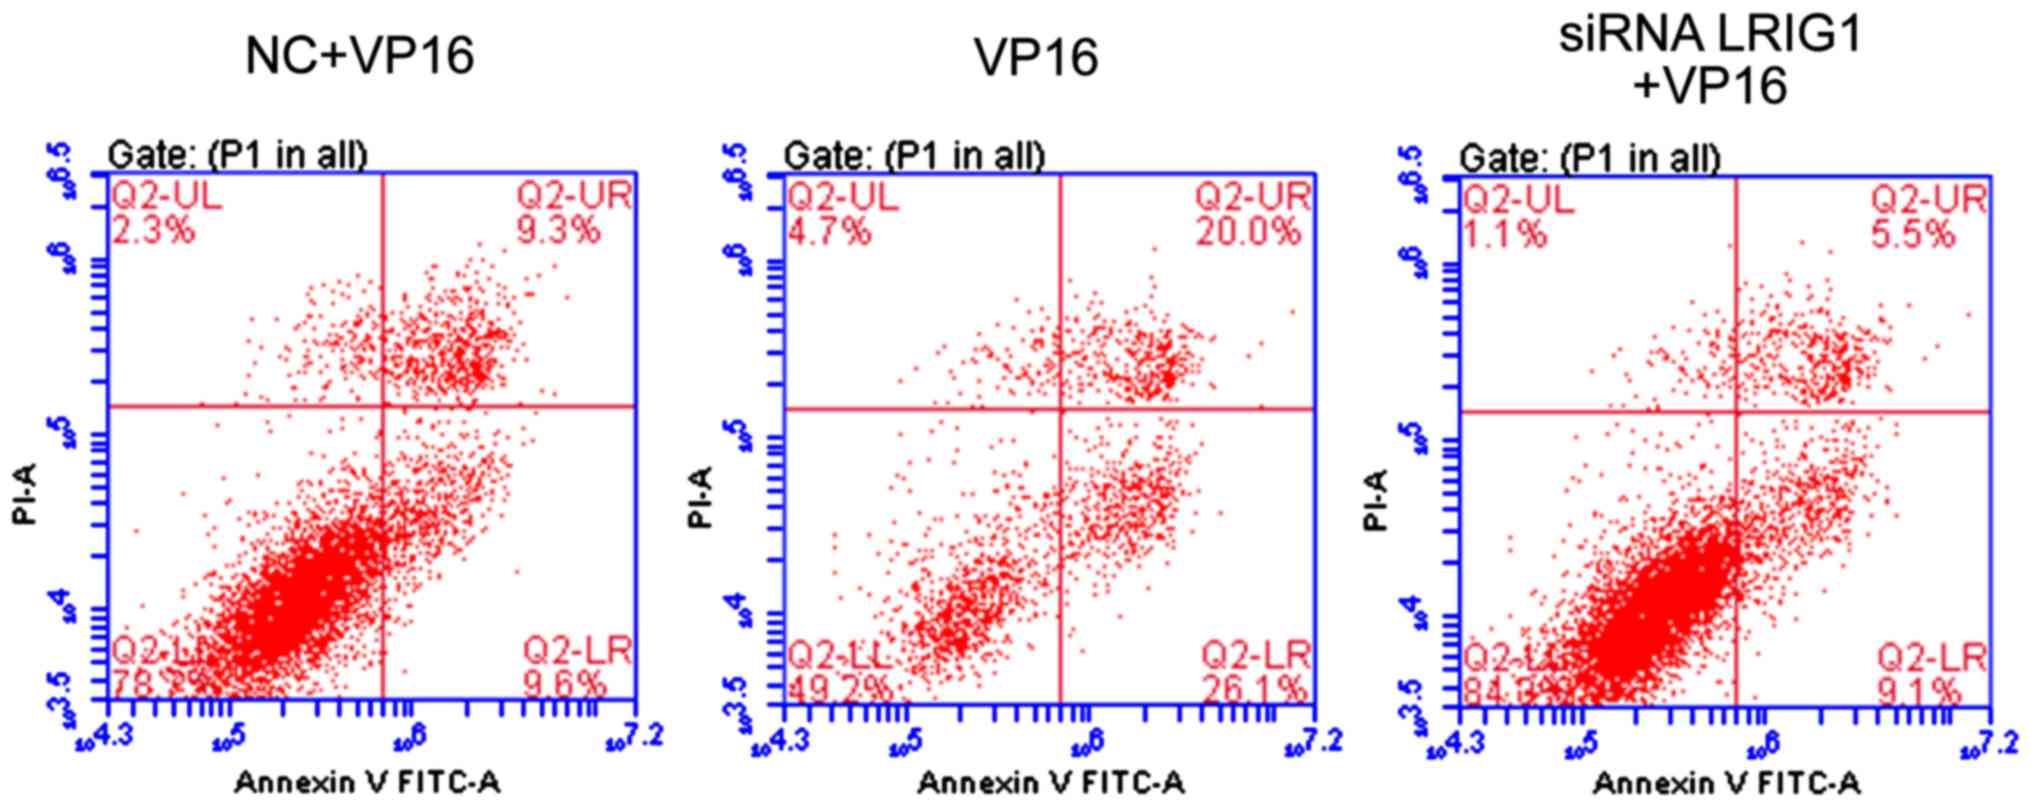
Cell apoptosis detection
Compared with VP16 and NC + VP16 treatment group,
the apoptotic rate was significantly increased in siLRIG1 + VP16
treatment group (P<0.05), indicating that silencing LRIG1 can
promote cell apoptosis (Fig. 5).
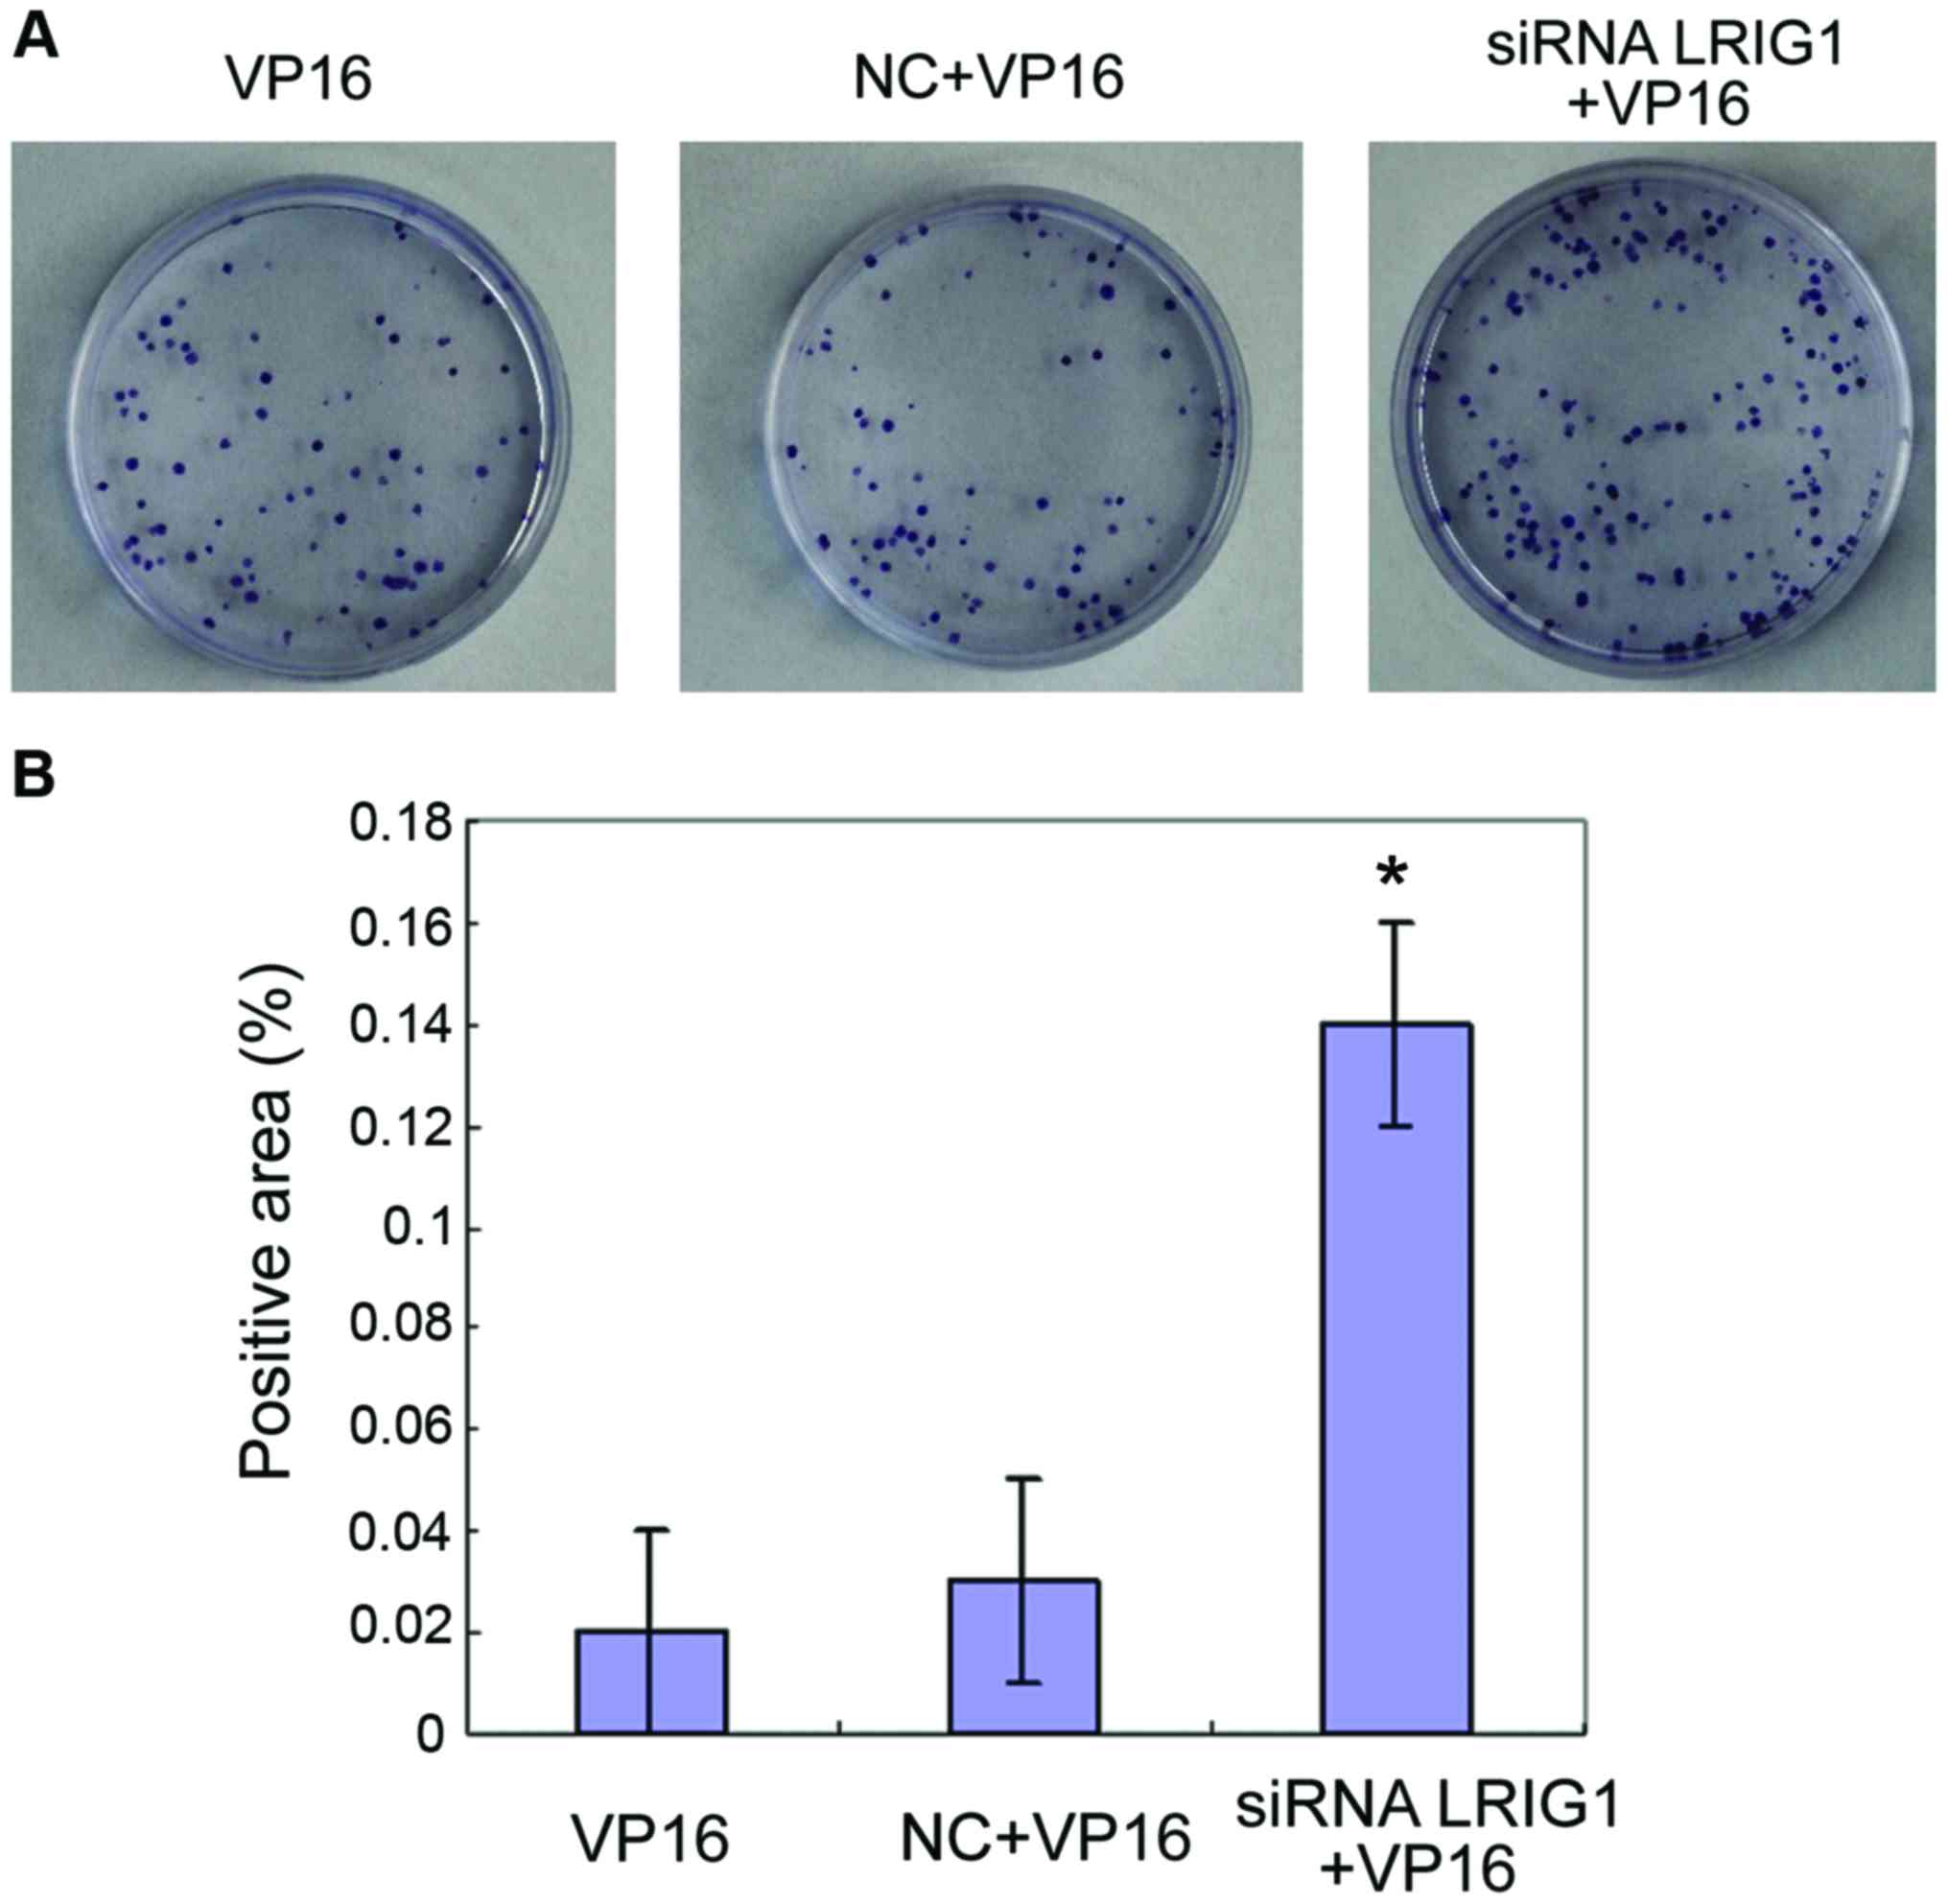
Cell proliferation detected by colony
formation assay
The cells in VP16, NC+VP16 and siRNA LRIG1 + VP16
treatment group were subjected to a colony formation assay.
Compared with VP16 and NC+VP16 treatment group, the number of
colonies formed by cells in siRNA LRIG1 + VP16 treatment group was
increased significantly (P<0.05) (Fig.
6).
Discussion
Since its discovery 10 years ago, LRIG1 was assumed
to be a tumor suppressor gene (11–13). A
series of experimental and clinical data have supported this
hypothesis. Studies have found that LRIG1 can inhibit the normal
proliferation and differentiation of cells. LRIG1 plays an
important regulatory role in prostate cancer cells, mouse
fibroblast keratinocytes, bladder cancer cells, breast cancer
cells, astrocytomas, glioblastoma cells (14–20) and
other cell lines.
The mechanism of action of VP16, a chemotherapeutic
agent, exerts a cell cycle-specific antitumor effect by interfering
with DNA topoisomerase II. However, drug resistance develops after
long-term use of VP16, especially in lung adenocarcinoma, ovarian
cancer and endometrial cancer and other malignant tumors. The
specific mechanism of this drugresistance remains unkown. For their
drug-resistant property, VP16 cells are widely used in basic
research. Our study found that LRIG1 expression in drug-resistant
cells was lower than that in wild-type cells and the expression of
LRIG1 was significantly decreased with the increase of VP16
concentration (P<0.05). After LRIG1 silencing by siRNA
interference, less apoptotic cells and more colonies were found in
siLRIG1 + VP16 treatment group compared with VP16 and NC + VP16
treatment group (P<0.05). This result indicates that LRIG1 can
promote the proliferation of ovarian cancer cells and after
silencing, the cell proliferation ability is weakened and the
apoptosis is increased. This conclusion is consistent with previous
studies (21,22), suggesting that we can promote
apoptosis of tumor cells by reducing the expression of LRIG1
protein in the treatment of ovarian cancer, to improve the
sensitivity of cancer cells to radiotherapy and chemotherapy.
At the molecular level, LRIG1 negatively regulates
the growth factor signaling mediated by the oncogenic receptor
tyrosine kinase. LRIG1 can induce the ubiquitination of epidermal
growth factor receptor (EGFR) family members including EGFR, ErbB2
(also known as HER2), ErbB3 and 4 (14,15),
thereby destroying the MET receptor (18), thereby acting on the RET receptor and
inhibiting the phosphorylation of RET and downstream factors
(23,24). In general, LRIG1 can inhibit cell
proliferation through a variety of regulatory pathways. Previous
findings have shown that LRIG1 expression is associated with sex
hormone expression (18). The
LRIG1 gene can be expressed in most normal human tissues and
cells (20–23). In addition to the above-metioned
regulatory pathway, LRIG2 can induce transcription of the
LRIG1 gene though the growth factor (23) or steroids (1–11). In
ErbB2-positive tumor cell lines, overexpression of ErbB2
downregulates the expression of estrogen receptors, thereby
inhibiting estrogen-induced LRIG1 transcription (1–19). The
natural compound, gambogic acid, can upregulate the expression of
LRIG1 in glioma cells by activating AMP kinase, thereby inhibiting
the proliferation of these cells (24). Therefore, from results of this study,
it can be concluded that LRIG1 gene affects the sensitivity
of SKOV3 cells to drugs in a dose-dependent manner, indicating that
LRIG1 silencing can inhibit cell apoptosis. Increasing the
expression level of LRIG1 in ovarian cancer cells can improve the
chemoradiotherapy sensitivity of ovarian cancer cells.
In conclusion, LRIG1 gene affects the
sensitivity of SKOV3 cells to chemotherapeutic drugs in a
dose-dependent manner, indicating that LRIG1 silencing can inhibit
cell apoptosis.
References
|
1
|
Krig SR, Frietze S, Simion C, Miller JK,
Fry WH, Rafidi H, Kotelawala L, Qi L, Griffith OL, Gray JW, et al:
Lrig1 is an estrogen-regulated growth suppressor and correlates
with longer relapse-free survival in ERα-positive breast cancer.
Mol Cancer Res. 9:1406–1417. 2011. View Article : Google Scholar : PubMed/NCBI
|
|
2
|
Thompson PA, Ljuslinder I, Tsavachidis S,
Brewster A, Sahin A, Hedman H, Henriksson R, Bondy ML and Melin BS:
Loss of LRIG1 locus increases risk of early and late relapse of
stage I/II breast cancer. Cancer Res. 74:2928–2935. 2014.
View Article : Google Scholar : PubMed/NCBI
|
|
3
|
Lindström AK, Ekman K, Stendahl U, Tot T,
Henriksson R, Hedman H and Hellberg D: LRIG1 and squamous
epithelial uterine cervical cancer: Correlation to prognosis, other
tumor markers, sex steroid hormones and smoking. Int J Gynecol
Cancer. 18:312–317. 2008. View Article : Google Scholar : PubMed/NCBI
|
|
4
|
Hedman H, Lindström AK, Tot T, Stendahl U,
Henriksson R and Hellberg D: LRIG2 in contrast to LRIG1 predicts
poor survival in early-stage squamous cell carcinoma of the uterine
cervix. Acta Oncol. 49:812–815. 2010. View Article : Google Scholar : PubMed/NCBI
|
|
5
|
Muller S, Lindquist D, Kanter L,
Flores-Staino C, Henriksson R, Hedman H and Andersson S: Expression
of LRIG1 and LRIG3 correlates with human papillomavirus status and
patient survival in cervical adenocarcinoma. Int J Oncol.
42:247–252. 2013. View Article : Google Scholar : PubMed/NCBI
|
|
6
|
Sheu JJ, Lee CH, Ko JY, Tsao GS, Wu CC,
Fang CY, Tsai FJ, Hua CH, Chen CL and Chen JY: Chromosome
3p12.3-p14.2 and 3q26.2-q26.32 are genomic markers for prognosis of
advanced nasopharyngeal carcinoma. Cancer Epidemiol Biomarkers
Prev. 18:2709–2716. 2009. View Article : Google Scholar : PubMed/NCBI
|
|
7
|
Sheu JJ, Lee CC, Hua CH, Li CI, Lai MT,
Lee SC, Cheng J, Chen CM, Chan C, Chao SC, et al: LRIG1 modulates
aggressiveness of head and neck cancers by regulating
EGFR-MAPK-SPHK1 signaling and extracellular matrix remodeling.
Oncogene. 33:1375–1384. 2014. View Article : Google Scholar : PubMed/NCBI
|
|
8
|
Lindquist D, Näsman A, Tarján M,
Henriksson R, Tot T, Dalianis T and Hedman H: Expression of LRIG1
is associated with good prognosis and human papillomavirus status
in oropharyngeal cancer. Br J Cancer. 110:1793–1800. 2014.
View Article : Google Scholar : PubMed/NCBI
|
|
9
|
Guo D, Nilsson J, Haapasalo H, Raheem O,
Bergenheim T, Hedman H and Henriksson R: Perinuclear leucine-rich
repeats and immunoglobulin-like domain proteins (LRIG1-3) as
prognostic indicators in astrocytic tumors. Acta Neuropathol.
111:238–246. 2006. View Article : Google Scholar : PubMed/NCBI
|
|
10
|
Holmlund C, Haapasalo H, Yi W, Raheem O,
Brännström T, Bragge H, Henriksson R and Hedman H: Cytoplasmic
LRIG2 expression is associated with poor oligodendroglioma patient
survival. Neuropathology. 29:242–247. 2009. View Article : Google Scholar : PubMed/NCBI
|
|
11
|
Thomasson M, Wang B, Hammarsten P, Dahlman
A, Persson JL, Josefsson A, Stattin P, Granfors T, Egevad L,
Henriksson R, et al: LRIG1 and the liar paradox in prostate cancer:
A study of the expression and clinical significance of LRIG1 in
prostate cancer. Int J Cancer. 128:2843–2852. 2011. View Article : Google Scholar : PubMed/NCBI
|
|
12
|
Tanemura A, Nagasawa T, Inui S and Itami
S: LRIG-1 provides a novel prognostic predictor in squamous cell
carcinoma of the skin: Immunohistochemical analysis for 38 cases.
Dermatol Surg. 31:423–430. 2005. View Article : Google Scholar : PubMed/NCBI
|
|
13
|
Hedman H, Nilsson J, Guo D and Henriksson
R: Is LRIG1 a tumour suppressor gene at chromosome 3p14.3? Acta
Oncol. 41:352–354. 2002. View Article : Google Scholar : PubMed/NCBI
|
|
14
|
Gur G, Rubin C, Katz M, Amit I, Citri A,
Nilsson J, Amariglio N, Henriksson R, Rechavi G, Hedman H, et al:
LRIG1 restricts growth factor signaling by enhancing receptor
ubiquitylation and degradation. EMBO J. 23:3270–3281. 2004.
View Article : Google Scholar : PubMed/NCBI
|
|
15
|
Laederich MB, Funes-Duran M, Yen L,
Ingalla E, Wu X, Carraway KL III and Sweeney C: The leucine-rich
repeat protein LRIG1 is a negative regulator of ErbB family
receptor tyrosine kinases. J Biol Chem. 279:47050–47056. 2004.
View Article : Google Scholar : PubMed/NCBI
|
|
16
|
Jensen KB and Watt FM: Single-cell
expression profiling of human epidermal stem and transit-amplifying
cells: Lrig1 is a regulator of stem cell quiescence. Proc Natl Acad
Sci USA. 103:11958–11963. 2006. View Article : Google Scholar : PubMed/NCBI
|
|
17
|
Yang WM, Yan ZJ, Ye ZQ and Guo DS: LRIG1,
a candidate tumour-suppressor gene in human bladder cancer cell
line BIU87. BJU Int. 98:898–902. 2006. View Article : Google Scholar : PubMed/NCBI
|
|
18
|
Shattuck DL, Miller JK, Laederich M, Funes
M, Petersen H, Carraway KL III and Sweeney C: LRIG1 is a novel
negative regulator of the Met receptor and opposes Met and Her2
synergy. Mol Cell Biol. 27:1934–1946. 2007. View Article : Google Scholar : PubMed/NCBI
|
|
19
|
Miller JK, Shattuck DL, Ingalla EQ, Yen L,
Borowsky AD, Young LJ, Cardiff RD, Carraway KL III and Sweeney C:
Suppression of the negative regulator LRIG1 contributes to ErbB2
overexpression in breast cancer. Cancer Res. 68:8286–8294. 2008.
View Article : Google Scholar : PubMed/NCBI
|
|
20
|
Nilsson J, Vallbo C, Guo D, Golovleva I,
Hallberg B, Henriksson R and Hedman H: Cloning, characterization,
and expression of human LIG1. Biochem Biophys Res Commun.
284:1155–1161. 2001. View Article : Google Scholar : PubMed/NCBI
|
|
21
|
Holmlund C, Nilsson J, Guo D, Starefeldt
A, Golovleva I, Henriksson R and Hedman H: Characterization and
tissue-specific expression of human LRIG2. Gene. 332:35–43. 2004.
View Article : Google Scholar : PubMed/NCBI
|
|
22
|
Guo D, Holmlund C, Henriksson R and Hedman
H: The LRIG gene family has three vertebrate paralogs widely
expressed in human and mouse tissues and a homolog in Ascidiacea.
Genomics. 84:157–165. 2004. View Article : Google Scholar : PubMed/NCBI
|
|
23
|
Nilsson J, Starefeldt A, Henriksson R and
Hedman H: LRIG1 protein in human cells and tissues. Cell Tissue
Res. 312:65–71. 2003.PubMed/NCBI
|
|
24
|
Ledda F, Bieraugel O, Fard SS, Vilar M and
Paratcha G: Lrig1 is an endogenous inhibitor of Ret receptor
tyrosine kinase activation, downstream signaling, and biological
responses to GDNF. J Neurosci. 28:39–49. 2008. View Article : Google Scholar : PubMed/NCBI
|