Introduction
Esophageal carcinoma (EC) is one of the most fatal
cancers of the digestive system worldwide (1). Although great improvements have been
made in the diagnosis and surgical treatment of EC, the overall
survival rate remains poor (2).
Therefore, it is necessary to study the molecular mechanisms of the
development of EC. In particular, studying the role of the new
tumor-associated genes in EC may help to elucidate the mechanisms
of EC initiation and progression, and provide effective targets for
treatment of EC. Tetraspanin 1 (TSPAN1; GenBank accession no.,
AF065388; also termed NET-1), which encodes a 241 amino acid
protein and is located at chromosome 1p34.1, belongs to the
tetraspanin superfamily (TM4SF) and was identified by Serru et
al (3) from the EST database in
2000. TM4SF, a specific family member of cell membrane
glycoproteins, is widely expressed in numerous tissues and cells
and mediates extracellular signal transduction and performs an
important role in cell development, growth and movement through the
role of the four hydrophobic regions in determining the boundaries
of extracellular transmembrane regions of cysteine residues
(4).
Previous studies revealed that TSPAN1 was highly
expressed in a number of cancers (5,6), but the
role of TSPAN1 in EC was unclear. In addition, it was also
uncertain whether TSPAN1 affects the proliferation and apoptosis of
EC cells. Therefore, the present study detected TSPAN1 protein in
EC tissues and evaluated its association with clinicopathological
factors and progression of EC. The effects of target inhibiting
TSPAN1 with siRNA on the EC cells were examined, and the effects on
proliferation and apoptosis of EC cells were observed.
Materials and methods
Patients
A total of 60 samples of EC tissue from resected
specimens and adjacent normal tissues were obtained from the
Affiliated Tumor Hospital of Nantong University (Nantong, China)
between April 2013 and April 2015. The study was approved by the
local medical ethics committee of Nantong University, and written
prior informed consent and approval were signed by the
patients.
Immunohistochemical staining
Histological tumor typing was performed on the basis
of resected specimens in the Department of Pathology of the
Affiliated Tumor Hospital of Nantong University. The tissues were
routinely fixed in 10% natural-buffered formalin for 24 h at 20°C
and embedded in paraffin. The 4 µm tissue sections were dewaxed
using xylene and rehydrated in graded alcohols. To reduce
non-specific background staining, endogenous peroxidase activity
was blocked by 3% hydrogen peroxide for 15 min at room temperature.
The sections were incubated with the following primary antibodies:
Rabbit anti-human polyclonal TSPAN1 antibody (cat. no. ab221740;
Abcam, Cambridge, UK; dilution, 1:200) and mouse anti-human
monoclonal Ki-67 antibody (cat. no. ab8191; Abcam; dilution, 1:200)
at 4°C overnight. Sections were then washed three times with PBS,
followed by incubation with goat anti-rabbit horseradish peroxidase
(HRP)-conjugated IgG (cat. no. ab6721; Abcam; dilution, 1:100) and
goat anti-mouse HRP-conjugated IgG (cat no. ab6789; Abcam;
dilution, 1:100) secondary antibodies for 1 h at room temperature.
Subsequent to washing with PBS three times for 10 min each, the
sections were incubated with 3,3′-diaminobenzidine dilute, lightly
counterstained with hematoxylin for 1 min at room temperature, and
observed under a light microscope (magnification, ×200).
Intensity and extent of TSPAN1 and Ki-67 expression
levels were thoroughly evaluated by two experienced pathologists
who were blinded to the clinical results and the staining results
were divided into three categories: (−), <10% positive
parenchyma cells and/or weakly stained; (+), ≥10% positive
parenchyma cells and/or strongly stained (7).
Cell culture
The ECEca-109 cells were provided by Biomics
Biotechnologies Co., Ltd. (Nantong, China) and cultured in
RPMI-1640 medium (Invitrogen; Thermo Fisher Scientific, Inc.,
Waltham, MA, USA) supplemented with 10% fetal bovine serum (Gibco;
Thermo Fisher Scientific, Inc.), 100 U/ml penicillin and 100 µg/ml
streptomycin at 37°C in a humidified incubator (5%
CO2).
Small interfering RNA (siRNA)
construction and cell transfection
The experiment was divided into three groups: TSPAN1
siRNA group (siRNA group), negative control group (NC group) and
untreated group (Un group). According to an optimization principle
of siRNA, a 19 nt sequence-specific siRNA targeting TSPAN1 was
designed (TSPAN1 siRNA; Biomics Biotechnologies Co., Ltd.) for
studying TSPAN1 in vitro. The TSPAN1 siRNA group sequences
were 5′-CCACAAUGGCUGAGCACUUdTdT-3′ (sense) and
5′-AAGUGCUCAGCCAUUGUGGdTdT-3′ (antisense). The negative control
group sequences were 5′-UUCUCCGAACGUGUCACGUdTdT-3′ (sense) and
5′-ACGUGACACGUUCGGAGAAdTdT-3′ (antisense). According to the
manufacturer's protocol, TSPAN1 siRNA or NC siRNA were transfected
using Lipofectamine® 2000 (Invitrogen; Thermo Fisher
Scientific, Inc.) at a final concentration of 25 nmol/l when the
cells reached 70% confluence. All results were repeated three
times.
Immunofluorescence microscopy
Eca-109 cells were cultured on 24-well plates
(1×10⁵ cells/well), transfected within 48 h, washed
twice with PBS and fixed with 4% paraformaldehyde for 15 min at
room temperature. The cells were permeabilized with 0.1% Triton
X-100 for 15 min, followed by blocking with 1% bovine serum albumin
(Sigma-Aldrich; Merck KGaA) in PBS for 30 min at room temperature.
Cells were incubated at 4°C overnight with anti-TSPAN1 polyclonal
antibody (cat. no. ab221740; Abcam; dilution, 1:200), then washed
extensively with PBS, followed by labeling with a secondary
tetramethylrhodamine-labeled antibody (cat. no. T6778;
Sigma-Aldrich; Merck KGaA, dilution, 1:100) for 2 h at room
temperature. The nuclei were stained by Hoechst 33258 (5 µg/ml;
Invitrogen; Thermo Fisher Scientific, Inc.) for 15 min at room
temperature, and the stained cells in five different fields of view
were observed by fluorescence microscopy (magnification, ×400;
Nikon Corporation, Tokyo, Japan).
Reverse transcription-quantitative
polymerase chain reaction (RT-qPCR) analysis of TSPAN1 mRNA
levels
Subsequent to being transfected with siRNA for 48 h,
total RNA was extracted from cells using TRIzol reagent
(Invitrogen; Thermo Fisher Scientific, Inc.) according to the
manufacturer's protocol. According to the One-step Quantace kit
(Quantace, Alexandria, Australia), RT-qPCR was performed in a
volume of 25 µl, containing 1 µl of each primer mix (10 µM/ml), 12
µl of 2X Master Mix, 0.5 µl of 50X SYBR-Green I, 6.5 µl
ddH2O and 5 µl RNA. The mixtures were first subjected to
30 min at 42°C for reverse transcription and initially denatured
for 10 min at 94°C, followed by 40 cycles of amplification with the
following cycling parameters: 20 sec at 95°C, 30 sec at 55°C and 30
sec at 72°C. The primer pairs for TSPAN1 gene were designed with
Primer Premier 5.0 software (Premier Biosoft International, Palo
Alto, CA, USA). GAPDH served as an internal control for RT-qPCR.
The primer sequences were as follows: TSPAN1 forward,
5′-GTGGCTTCACCAACTATACG-3′ and reverse, 5′-GACTGCATTAGTTCGGATGT-3′;
GAPDH forward, 5′-GAAGGTGAAGGTCGGAGTC-3′ and reverse,
5′-GAAGATGGTGATGGGATTC-3′. The expression levels of each gene were
determined using the 2−ΔΔCq method (8).
Western blot analysis
Total protein was extracted from all groups of cells
following transfection for 48 h with a radioimmunoprecipitation
assay buffer (Beyotime Institute of Biotechnology, Haimen, China),
and the protein concentration was determined using the
Bicinchoninic Acid Protein Assay kit (Beyotime Institute of
Biotechnology). A total of 25 µg of protein were loaded into each
lane, separated by 10% SDS-PAGE, transferred to a polyvinylidene
fluoride membrane and blocked for 2 h at room temperature with 5%
non-fat milk in TBS containing 0.1% Tween-20 (TBST) to exclude
non-specific binding. The membranes were incubated with anti-TSPAN1
(cat. no. ab221740; Abcam; dilution, 1:1,000), anti-Ki-67 (cat. no.
ab8191; Abcam; dilution, 1:1,000), mouse anti-caspase-3 (cat. no.
C5737; Sigma-Aldrich; Merck KGaA; dilution, 1:1,000), and mouse
anti-β-actin (cat. no. BM0626; Boster Biological Technology,
Pleasanton, CA, USA; dilution, 1:2,000) primary antibodies
overnight at 4°C. The membranes were washed three times in TBST for
5 min and then incubated with goat anti-rabbit (cat. no. ab6721;
Abcam; dilution, 1:5,000) and goat anti-mouse (cat. no. ab6789;
Abcam; dilution, 1:5,000) secondary antibodies for 2 h at room
temperature, followed by washing three times in TBST for 5 min. The
enhanced chemiluminescence system (Pierce; Thermo Fisher
Scientific, Inc.) was added to the target proteins and the film was
visualized. The density of the bands was semi-quantitatively
analyzed by Image J densitometry (v.2.1.4.7; National Institutes of
Health, Bethesda, MA, USA). The detected protein was normalized by
β-actin.
Detection of cell proliferation using
the MTT assay
Cells on coverslips were cultured in 96-well plates
for 0, 24, 48 and 72 h, at a density of 2×10³ cells/well
at 37°C. At the time cells were transfected with siRNA and NC for
0, 24, 48 and 72 h, MTT solution (0.2 mg/ml; Sigma-Aldrich; Merck
KGaA) was added to each well for incubating cells at 37°C for 4 h
away from light. The supernatant was then removed, and 150 µl
dimethylsulfoxide (Sigma-Aldrich; Merck KGaA) was added to dissolve
the purple crystals in each well. The optical density was
determined using a Microplate Reader (Bio-Rad 680; Bio-Rad
Laboratories, Inc., Hercules, CA, USA) at a wavelength of 490 nm,
and cell growth curves were constructed.
Cell apoptosis analysis using
fluorescein Αnnexin V-fluorescein isothiocyanate (FITC)/propidium
iodide (PI) double labeling
Cellular apoptosis was determined by the Annexin
V-FITC Apoptosis Detection kit (Beyotime Institute of
Biotechnology) according to the manufacturer's protocol. Cells were
cultured on 6-well plates and trypsinized at 37°C. At 48 h
post-transfection, cells were collected and resuspended in 400 µl
1X binding buffer, at 800 × g for 10 min at 4°C and supernatant was
removed. Cells were then resuspended in 200 µl 1X binding buffer
and transferred to a sterile flow cytometry (FCM) glass tube.
Subsequently, 3 µl Αnnexin V-FITC and 3 µl propidium iodide were
added and then incubated at 37°C for 15 min in the dark. Cells were
then analyzed by CyFlow space FCM (BD Biosciences, Franklin Lakes,
NJ, USA). The distribution of cells was analyzed using Cell-Quest
software (v. FCS2.0; BD Biosciences) within 1 h of staining. Data
from 10,000 cells was collected for each data file. Apoptotic cells
were identified as Αnnexin V-FITC-positive and PI-negative
cells.
Statistical analysis
The rates of TSPAN1 expression and
clinicopathological factors were compared using one-way analysis of
variance with post hoc contrasts by Student-Newman-Keuls test and
χ2 test analyses. The cell apoptosis analysis
experiments were performed independently at least three times and
comparisons between the experimental groups are expressed as the
mean ± standard deviation. Statistical analysis was performed using
SPSS v.20.0 statistical software (IBM SPSS, Armonk, NY, USA) and
image processing was performed with GraphPad Prism 5.0 software
(GraphPad Software, Inc., La Jolla, CA, USA). P<0.05 was
considered to indicate a statistically significance difference.
Results
Clinical cases and tumor
characteristics
Of the 60 EC cases, 11 (18.33%) of lesions occurred
in the upper esophagus, 28 (46.67%) occurred in the median
esophagus and 21 (35.00%) occurred in the lower esophagus. Among
them, 50 cases were male and 10 cases were female, with a median
age of 63.30 years (range, 32–75 years). None of the patients
received radiotherapy or chemotherapy prior to diagnosis. According
to the states of cell differentiation and dysplasia appearances,
cases were divided histologically into high (30.00%, 18 cases),
moderate (30.00%, 18 cases) and low differentiation (40.00%, 24
cases). Depending on the depth of tumor invasion, the cases were
divided into three groups: T1 in 13 cases (21.67%), T2 in 17 cases
(28.33%) and T3 in 30 cases (50.00%). There were 36 cases (60.00%)
with lymph node metastasis. Immunohistochemistry results also
revealed that Ki-67 was expressed in EC tissue of all 60 cases,
with high expression in 53 cases (88.33%) and low expression in 7
cases (11.67%).
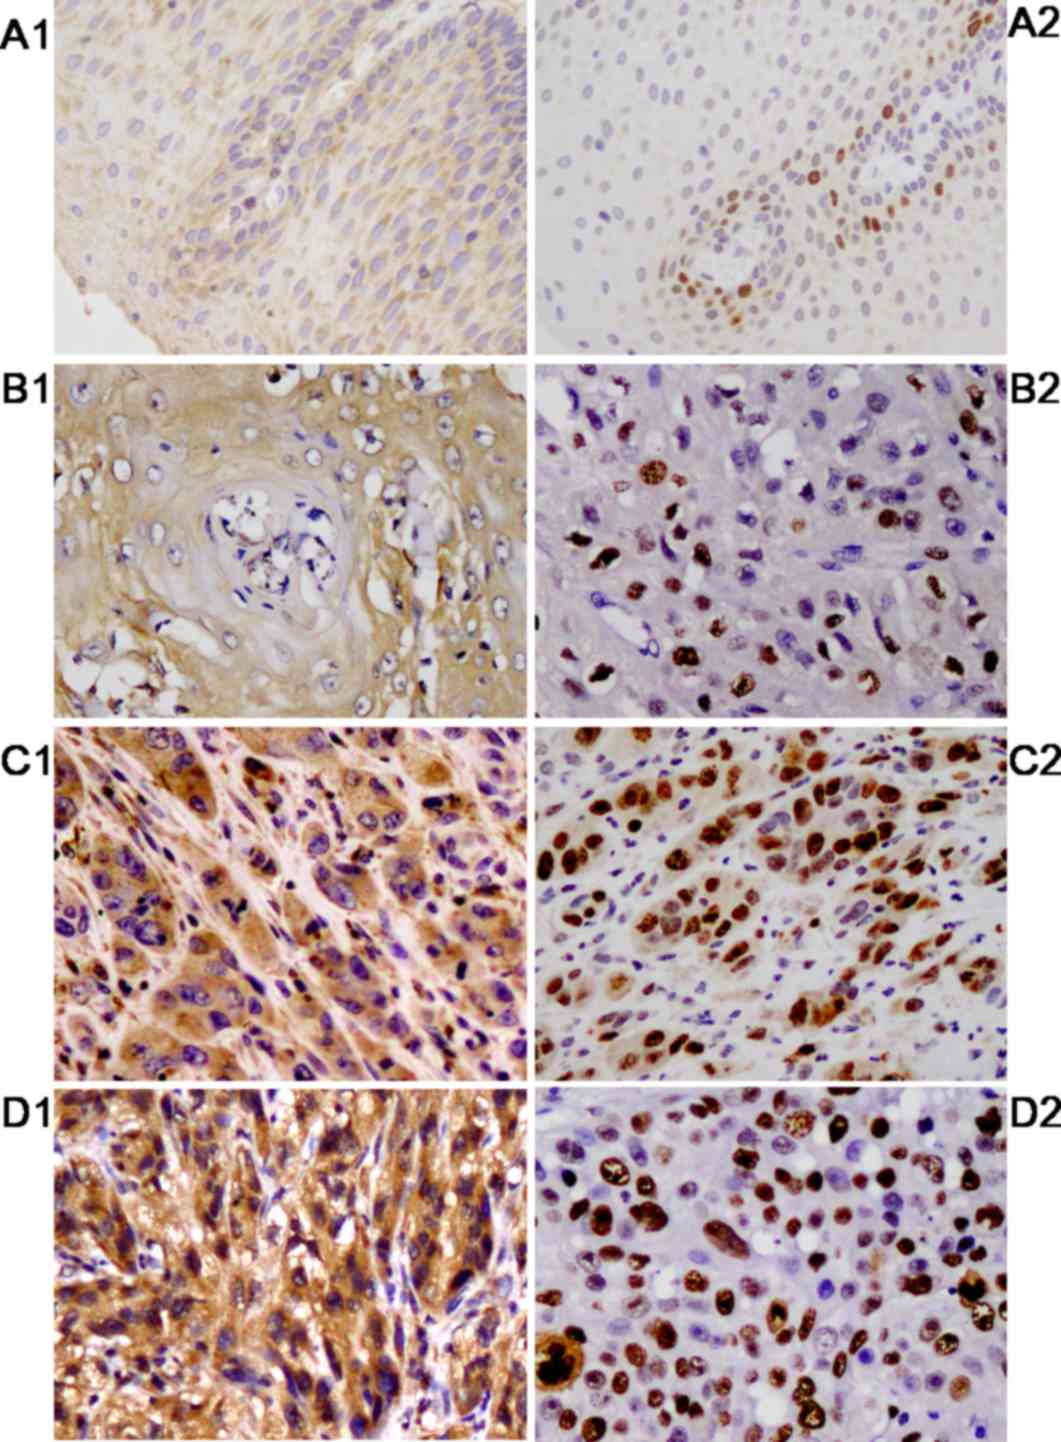
TSPAN1 expression is increased in EC
tissues compared with normal tissues
Immunohistochemical staining was used to examine the
expression of TSPAN1 protein in 60 cases of EC tissue and adjacent
normal tissue. Positive granules stained yellow were mainly
distributed in the cytoplasm of tumor cells, and the expression of
TSPAN1 protein in EC tissue (51 cases, 85.00%) was significantly
higher compared with that in adjacent normal tissue (23 cases,
38.33%), with statistical significance (χ2=27.638;
P<0.001). In 85.00% of EC cases, TSPAN1 was stained brown, and
there was an association between increased TSPAN1 expression and
lower differentiation. Furthermore, there was an association
between TSPAN1 and Ki-67 expression (χ2=11.039, P=0.001;
Fig. 1). The association between
TSPAN1 expression and the clinicopathological parameters in EC was
analyzed using the χ2 test (Table I). A statistically significant
association was observed between TSPAN1 expression and histological
differentiation (χ2=9.020; P=0.011), depth of tumor
invasion (χ2=8.908; P=0.012) and lymph vessel invasion
(χ2=6.296; P=0.012).
 | Table I.Clinicopathological characteristics of
high TSPAN1 expression in 60 patients with esophageal
carcinoma. |
Table I.
Clinicopathological characteristics of
high TSPAN1 expression in 60 patients with esophageal
carcinoma.
| Groups | Patients, n (%) | TSPAN1 high
expression, n (%) | χ2 | P-value |
|---|
| Gender |
|
|
|
|
| Male | 50 (83.33) | 43 (86.00) | 0.235 | 0.628 |
|
Female | 10 (16.67) | 8 (80.00) |
|
|
| Age, years |
|
|
|
|
| ≤60 | 23 (38.33) | 18 (78.26) | 1.329 | 0.249 |
|
>60 | 37 (61.67) | 33 (89.18) |
|
|
| Location |
|
|
|
|
| Upper
esophagus | 11 (18.33) | 8 (72.72) | 1.711 | 0.425 |
| Median
esophagus | 28 (46.67) | 25 (89.28) |
|
|
| Lower
esophagus | 21 (35.00) | 18 (85.71) |
|
|
| Histological
differentiation |
|
|
|
|
| High | 18 (30.00) | 12 (66.67) | 9.020 | 0.011 |
|
Moderate | 18 (30.00) | 15 (83.33) |
|
|
| Low | 24 (40.00) | 24 (100.00) |
|
|
| Depth of
invasion |
|
|
|
|
|
T1a | 13 (21.67) | 8 (61.53) | 8.908 | 0.012 |
|
T2b | 17 (28.33) | 14 (82.35) |
|
|
|
T3c | 30 (50.00) | 29 (96.67) |
|
|
| Lymph node
metastasis |
|
|
|
|
|
Positive | 36 (60.00) | 34 (94.44) | 6.296 | 0.012 |
|
Negative | 24 (40.00) | 17 (70.83) |
|
|
| Ki-67
expression |
|
|
|
|
|
High | 53 (88.33) | 48 (90.57) | 11.039 | 0.001 |
|
Low | 7 (11.67) | 3 (42.85) |
|
|
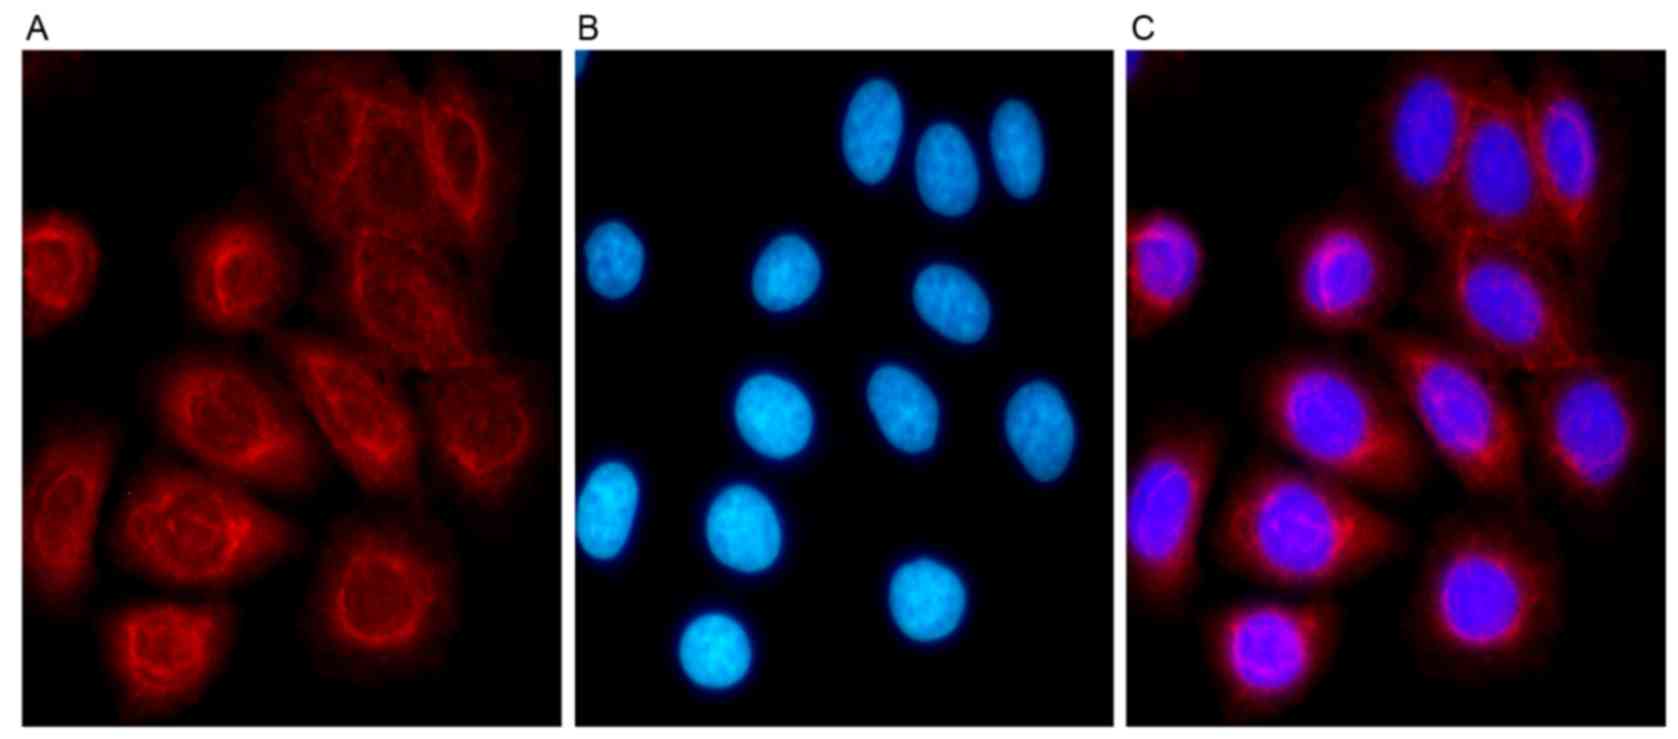
Immunofluorescence analysis of
TSPAN1
Immunofluorescence analysis was used to detect the
location of TSPAN1 protein in Eca-109 cells, and a confocal
microscope was used to observe fluorescence. The results indicated
that TSPAN1 protein was distributed evenly in the cytoplasm around
the nucleus of Eca-109 cells (Fig.
2).
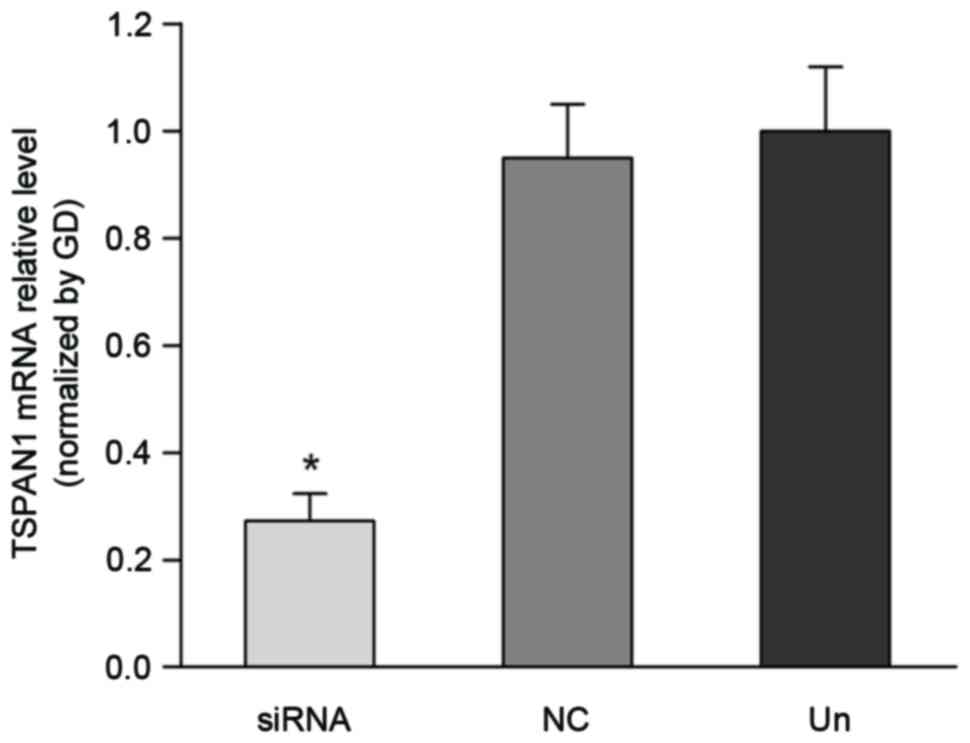
TSPAN1 mRNA and protein levels
RT-qPCR and western blot analysis revealed a
significant decrease in the mRNA and protein levels of the TSPAN1
siRNA group compared with the negative control group. As
demonstrated in Fig. 3, TSPAN1 siRNA
inhibited TSPAN1 expression at the mRNA level up to 67.7% (Fig. 3) in comparison with that of the
negative control group (0.27±0.05 vs. 0.95±0.10; P<0.05). As
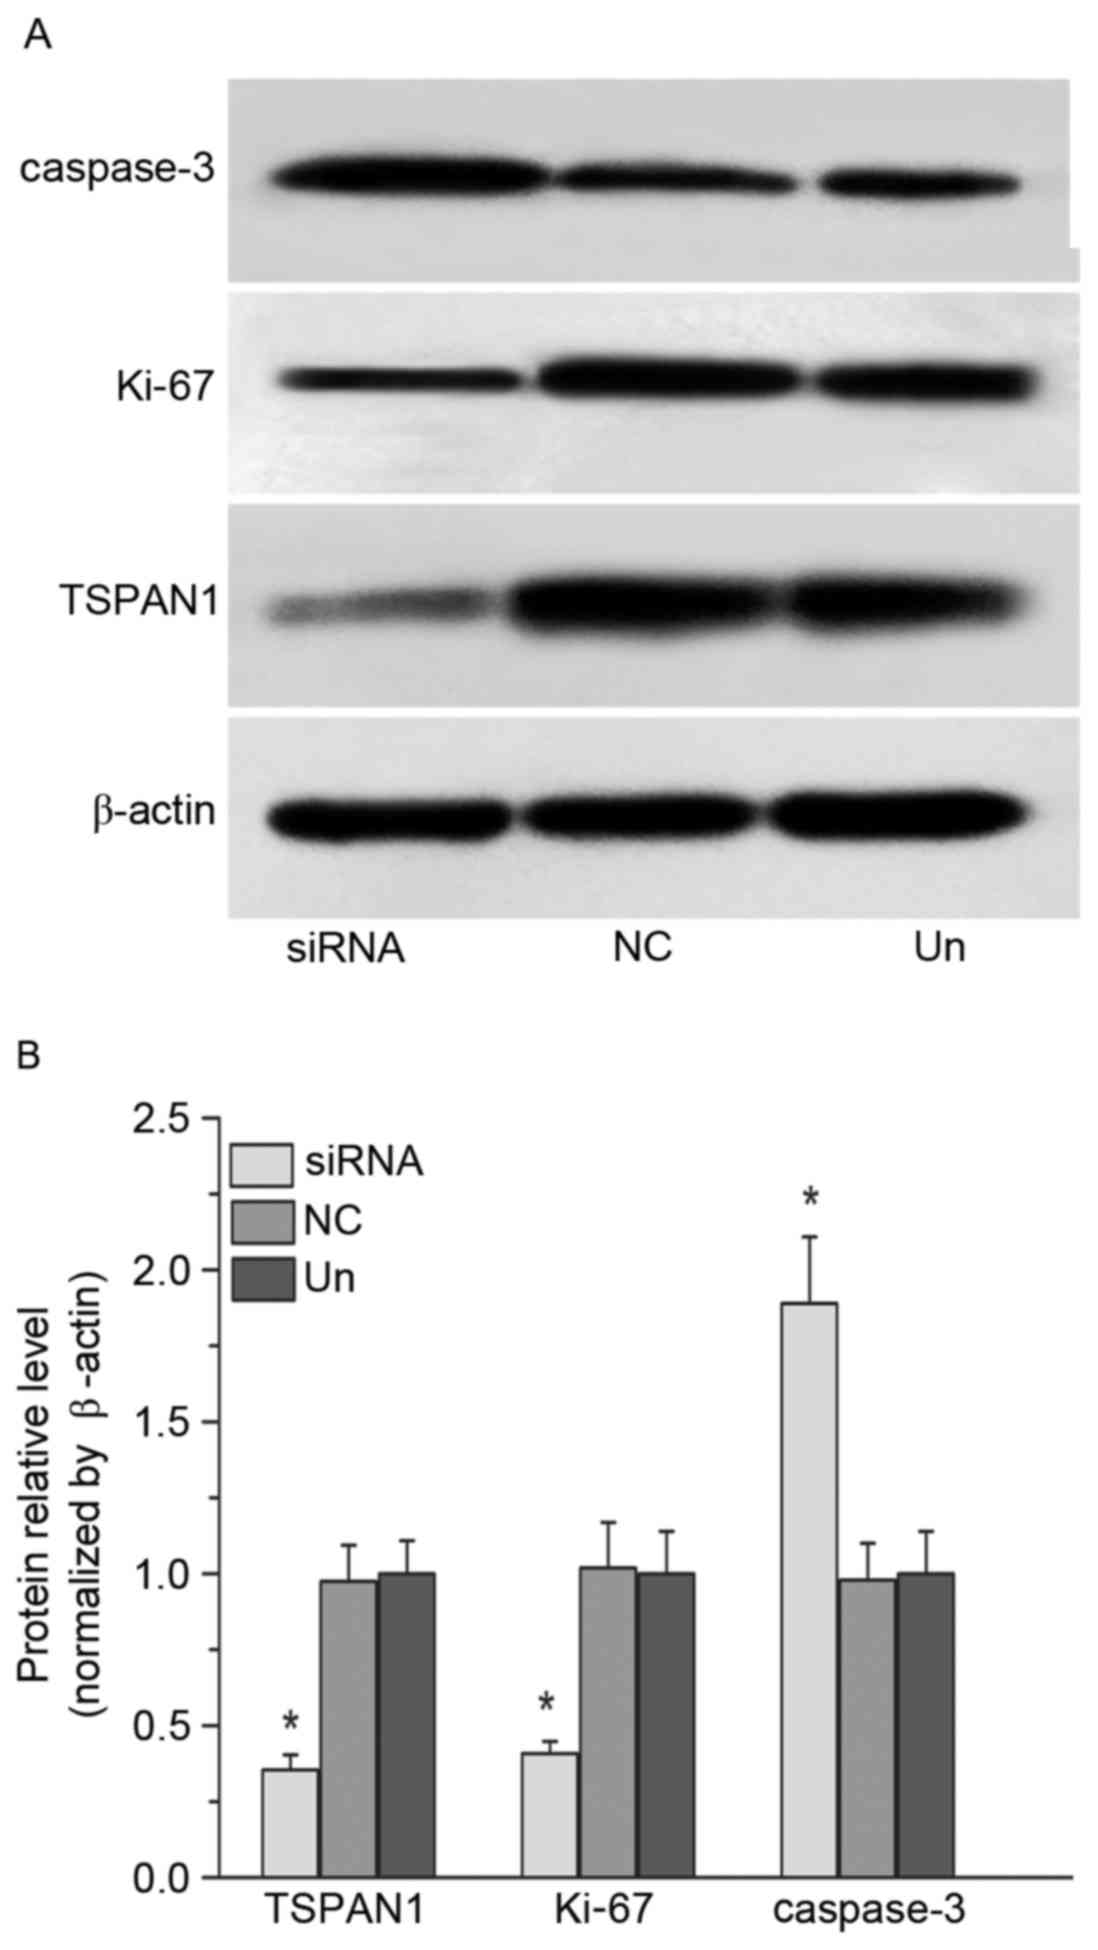
demonstrated in Fig. 4, a silencing
effect of TSPAN1 siRNA was observed at the protein level up to
62.0% compared with the negative control group (0.35±0.05 vs.
0.97±0.12; P<0.05), indicating effective silencing at the mRNA
and protein levels.
TSPAN1 silencing inhibits the
expression of Ki-67 and promotes the expression of caspase-3
The optical density value for the bands for each of
the three groups was compared with β-actin. The expression of the
cell proliferation-associated protein Ki-67 in the TSPAN1 siRNA
group was significantly decreased (up to 61.0%) compared with the
negative control group (0.41±0.04 vs. 1.02±0.15; P<0.05;
Fig. 4). The expression of the
apoptosis-associated protein caspase-3 was significantly increased
(up to 91.0%) in the TSPAN1 siRNA group compared with the negative
control group (1.89±0.22 vs. 0.98±0.12; P<0.05; Fig. 4). These results demonstrated that
silencing the TSPAN1 gene could inhibit the expression of Ki-67 and
promote the expression of caspase-3.
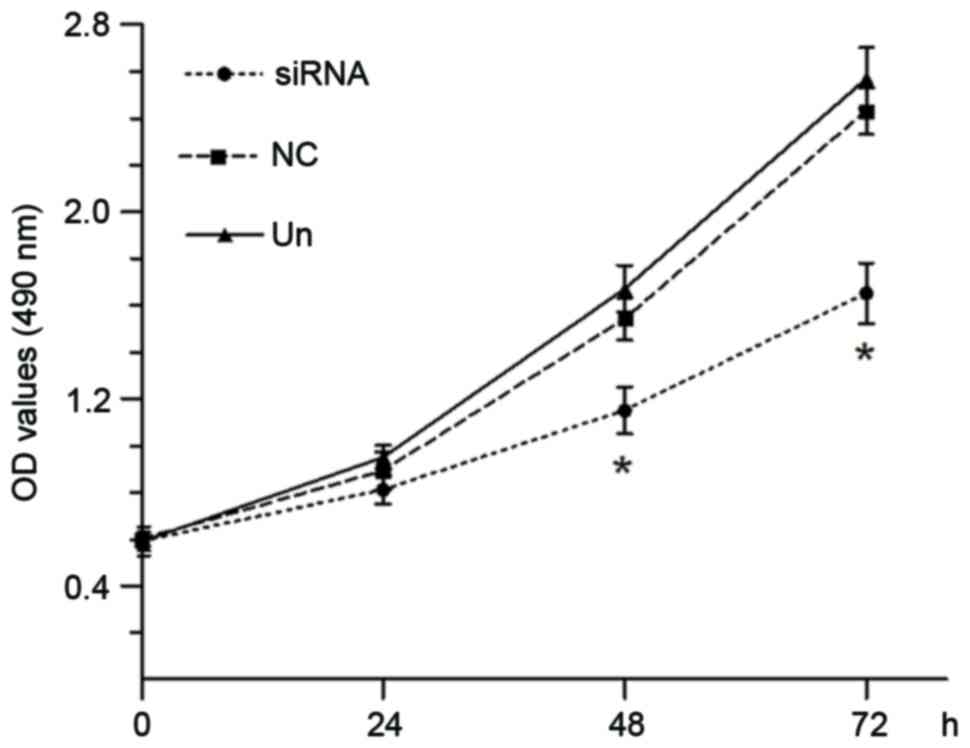
Knockdown of the TSPAN1 gene inhibits
cell proliferation
The effect of silencing of TSPAN1 on proliferation
of Eca-109 cells was examined. The absorbance values of Eca-109
cells at 48 and 72 h after transfection with TSPAN1 siRNA were
significantly decreased compared with the negative control group
(1.15±0.10 vs. 1.54±0.09 at 48 h; 1.65±0.13 vs. 2.43±0.11 at 72 h;
P<0.05; Fig. 5).
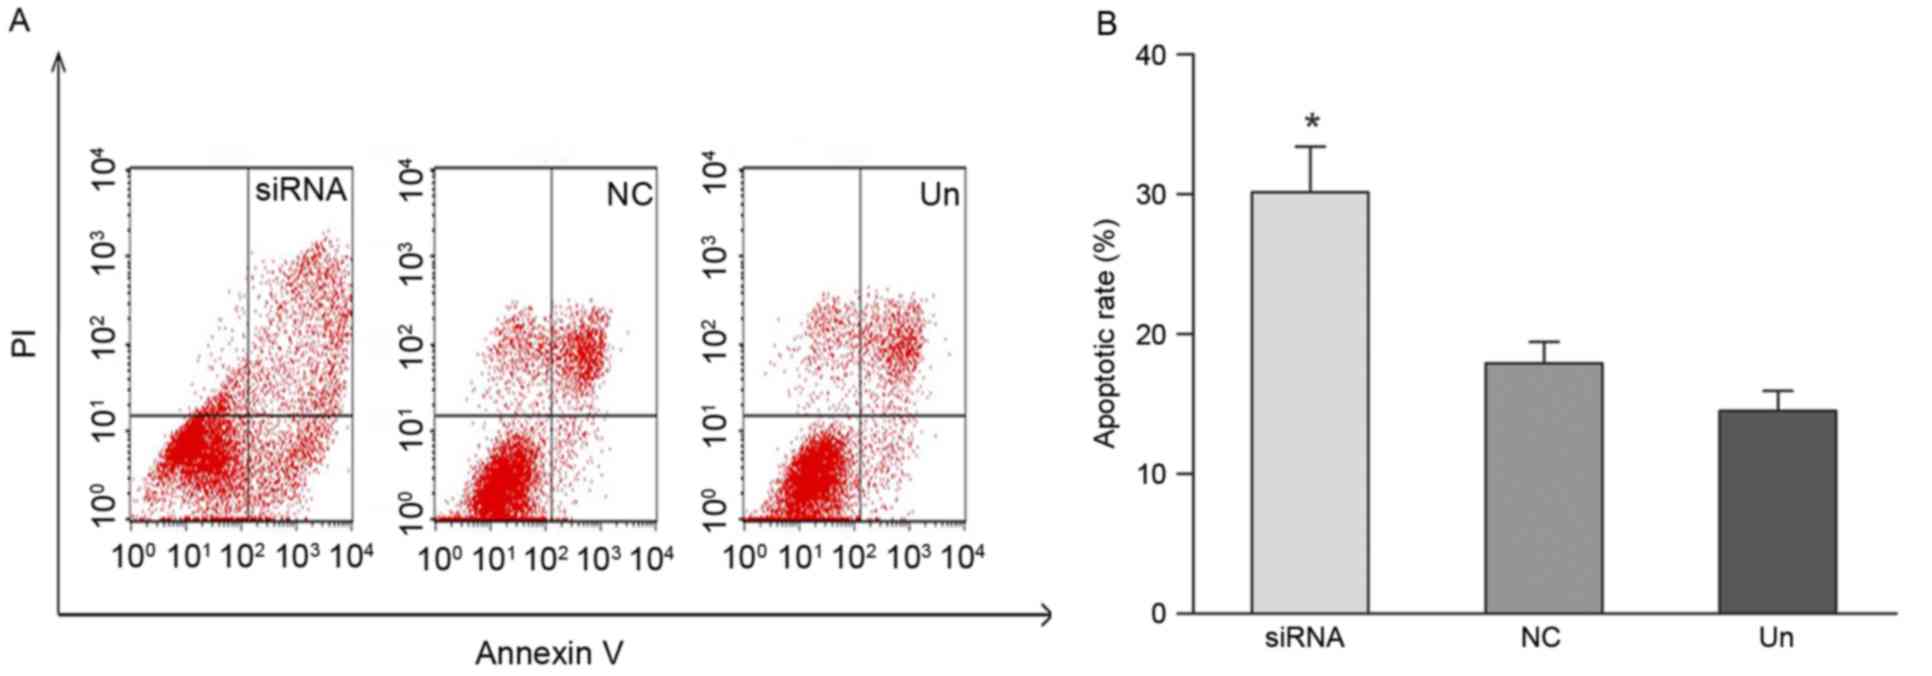
TSPAN1 gene silencing induces cell
apoptosis
Apoptosis induced by silencing the TSPAN1 gene was
evaluated using the Annexin V-FITC/PI staining assay and flow
cytometry analysis. As demonstrated in Fig. 6, apoptotic cells were significantly
increased by TSPAN1 siRNA treatment as compared with the negative
control group (30.16±3.24 vs. 17.92±1.52%; P<0.05).
Discussion
As a new member of the tetraspanin group, TSPAN1 is
a recently discovered tumor-associated gene (7,9–13). Previous studies have demonstrated that
TSPAN1 is associated with the occurrence and development of
numerous cancers, including hepatocellular carcinoma (7), gastric carcinoma (9), colorectal carcinoma (10), lung cancer (11), skin cancer (12) and pancreatic cancer (13). RNA interference (RNAi) technology is
an effective approach to silence tumor gene expression for studies
of gene function, and has the potential for gene therapy (14–17).
Synthetic siRNA can trigger RNAi responses in mammalian cells and
induce inhibition of gene expression (14). The specific siRNA used in the current
study has been used in a previous study and confirmed to be
effective (15). He et al
(16) reported that silencing TSPAN1
using siRNA in liver carcinoma MHCC97H cells suppressed cell
proliferation and induced apoptosis. Chen et al (17) reported that silencing TSPAN1 depressed
the proliferation and growth of skin carcinoma A431 cells. These
previous studies are in agreement with the present study, in which
TSPAN1 siRNA was designed to investigate the effects of TSPAN1 in
the proliferation and apoptosis of EC cells, and to disclose the
role of TSPAN1 in EC.
Esophageal carcinogenesis is a complex process,
which involves a variety of molecular events associated with
fundamental alterations in cell physiological processes (18). Elucidation of the underlying molecular
mechanisms of esophageal carcinogenesis is required to develop
novel treatments. In the present study, 60 EC and matched adjacent
normal tissue cases were initially studied to identify the
association between TSPAN1 and clinicopathological parameters of
patients with EC. In adjacent normal tissues, TSPAN1 was weakly
stained. In EC tissues, TSPAN1 expressed strongly and was
particularly enhanced in metastatic emboli in blood vessels,
filtrating depth muscle and in poorly differentiated cells. The
positive ratio of TSPAN1 expression was significantly increased in
EC compared with adjacent normal tissue. The results supported the
hypothesis that TSPAN1 over expression may be an important
molecular event in the progression of EC. The present study
demonstrated that lower differentiation EC tissue exhibited higher
expression of TSPAN1, which indicated that TSPAN1 may be a marker
for cell differentiation phenotype. In addition, TSPAN1 over
expression was associated with histological differentiation, depth
of tumor infiltration and lymph node metastasis, which indicated
that the accumulation of TSPAN1 in cancer cells is associated with
the malignant progression of EC. These results are similar to the
studies by Zhang et al (12)
and Wollscheid et al (19).
TSPAN1 has been demonstrated to accumulate at the cell surface in
EC, and may transduce signals of cell proliferation,
synergistically promoting EC development (3). Evaluate cancer cell proliferation and
detecting the expression level of Ki-67 in tumors demonstrated that
TSPAN1 may function with Ki-67 to increase tumor cell
proliferation. Similarly, several studies have reported that the
development of cancers is associated with the activity and
expression of TSPAN1 in a variety of cancers, including
hepatocellular carcinoma, skin squamous carcinoma and
osteoclastogenesis (4,7,17).
With the development of RNAi technology, a siRNA
technique was used to down regulate TSPAN1 in the Eca-109 cell
line. Compared with the negative group and the untreated group,
RT-qPCR and western blot analysis results revealed that the mRNA
expression level of the TSPAN1 decreased (up to 67.7%) and the
protein expression level of the TSPAN1 (up to 62.0%) decreased
within 48 h post-transfection of TSPAN1 siRNA in Eca-109 cells. MTT
assay revealed that cell proliferation was inhibited (up to 39% at
48 h; 78% at 72 h) and flow cytometry showed that apoptosis was
induced (30.16±3.24 vs. 17.92±1.52%). The present study
demonstrated that TSPAN1 siRNA effectively knocked down the
expression of TSPAN1 in Eca-109 cells and reduced the cell growth
and proliferation. By contrast, to elucidate the molecular function
of TSPAN1 on promoting proliferation and inhibiting apoptosis, the
expression of the key regulators Ki-67 and caspase-3 was examined.
To the best of our knowledge, this is the first study to
demonstrate that the expression level of Ki-67 is significantly
decreased (up to 61.0%) and caspase-3 is significantly increased
(up to 91.0%) in Eca-109 cells transfected with TSPAN1 siRNA. Ki-67
was known to be over expressed in EC and in the early events of
esophageal carcinogenesis, and is also a useful biomarker for early
detection (20). By contrast,
caspase-3 is a member of the caspase family of enzymes, which are
the major inducers of apoptosis (21). This apoptotic protein is identified as
one of the mechanisms by which cancer cells accelerate apoptosis,
and is activated in the apoptotic cell by extrinsic (death ligand)
and intrinsic (mitochondrial) pathways (22). The present study revealed that
silencing the TSPAN1 gene by siRNA resulted in an increase in
caspase-3 expression, consequently promoting the apoptosis of
EC.
In summary, the results of the present study
demonstrated that TSPAN1 is highly expressed in EC cases, which may
be regarded as one of the independent favorable indicators for the
initiation and development of EC. The results in Eca-109 cells
demonstrated that the main function of the TSPAN1 gene may be to
promote cell proliferation by increasing levels of Ki-67, and to
decrease apoptosis by down regulating caspase-3 expression.
Therefore, TSPAN1 maybe a candidate gene for diagnosis and a target
gene for therapy of EC.
Acknowledgements
The present study was supported by the foundation of
the production-study-research prospective joint research programs
of Jiangsu Province, China (grant no. BY 2013042-06), a project
funded by the Priority Academic Program Development of Jiangsu
Higher Education Institutions, and from the Science Foundation of
Nantong City, Jiangsu, China (grant no. BK2014001).
References
|
1
|
Ferlay J, Soerjomataram I, Dikshit R, Eser
S, Mathers C, Rebelo M, Parkin DM, Forman D and Bray F: Cancer
incidence and mortality worldwide: Sources, methods and major
patterns in GLOBOCAN 2012. Int J Cancer. 136:E359–E386. 2015.
View Article : Google Scholar : PubMed/NCBI
|
|
2
|
Chen SB, Weng HR, Wang G, Yang JS, Yang
WP, Liu DT, Chen YP and Zhang H: Surgical treatment for early
esophageal squamous cell carcinoma. Asian Pac J Cancer Prev.
14:3825–3830. 2013. View Article : Google Scholar : PubMed/NCBI
|
|
3
|
Serru V, Dessen P, Boucheix C and
Rubinstein E: Sequence and expression of seven new tetraspans.
Biochim Biophys Acta. 1478:159–163. 2000. View Article : Google Scholar : PubMed/NCBI
|
|
4
|
Iwai K, Ishii M, Ohshima S, Miyatake K and
Saeki Y: Expression and function of transmembrane-4 superfamily
(tetraspanin) proteins in osteoclasts: Reciprocal roles of Tspan-5
and NET-6 during osteoclastogenesis. Allergol Int. 56:457–463.
2007. View Article : Google Scholar : PubMed/NCBI
|
|
5
|
Maecker HT, Todd SC and Levy S: The
tetraspanin superfamily: Molecular facilitators. FASEB J.
11:428–442. 1997.PubMed/NCBI
|
|
6
|
Claas C, Wahl J, Orlicky DJ, Karaduman H,
Schnölzer M, Kempf T and Zöller M: The tetraspanin D6.1A and its
molecular partners on rat carcinoma cells. Biochem J. 389:99–110.
2005. View Article : Google Scholar : PubMed/NCBI
|
|
7
|
Chen L, Yuan D, Wang GL, Wang Y, Wu YY and
Zhu J: Clinicopathological significance of expression of Tspan-1,
Jab1 and p27 in human hepatocellular carcinoma. J Korean Med Sci.
25:1438–1442. 2010. View Article : Google Scholar : PubMed/NCBI
|
|
8
|
Livak KJ and Schmittgen TD: Analysis of
relative gene expression data using real-time quantitative PCR and
the 2(-Delta Delta C(T)) method. Methods. 25:402–408. 2001.
View Article : Google Scholar : PubMed/NCBI
|
|
9
|
Lu Z, Luo T, Nie M, Pang T, Zhang X, Shen
X, Ma L, Bi J, Wei G, Fang G and Xue X: TSPAN1 functions as an
oncogene in gastric cancer and is downregulated by miR-573. FEBS
Lett. 589:1988–1994. 2015. View Article : Google Scholar : PubMed/NCBI
|
|
10
|
Zhang J, Fei B, Wang Q, Song M, Yin Y,
Zhang B, Ni S, Guo W, Bian Z, Quan C, et al: MicroRNA-638 inhibits
cell proliferation, invasion and regulates cell cycle by targeting
tetraspanin 1 in human colorectal carcinoma. Oncotarget.
5:12083–12096. 2014. View Article : Google Scholar : PubMed/NCBI
|
|
11
|
Chen Y, Peng W, Lu Y, Chen J, Zhu YY and
Xi T: MiR-200a enhances the migrations of A549 and SK-MES-1 cells
by regulating the expression of TSPAN1. J Biosci. 38:523–532. 2013.
View Article : Google Scholar : PubMed/NCBI
|
|
12
|
Zhang J, Wang J, Chen L, Wang G, Qin J, Xu
Y and Li X: Expression and function of NET-1 in human skin squamous
cell carcinoma. Arch Dermatol Res. 306:385–397. 2014. View Article : Google Scholar : PubMed/NCBI
|
|
13
|
Hou FQ, Lei XF, Yao JL, Wang YJ and Zhang
W: Tetraspanin 1 is involved in survival, proliferation and
carcinogenesis of pancreatic cancer. Oncol Rep. 34:3068–3076. 2015.
View Article : Google Scholar : PubMed/NCBI
|
|
14
|
Li T, Zhu YY, Chen L, Sun Y, Yuan J,
Graham M and French P: Size unbiased representative enzymatically
generated RNAi (SURER) library and application for RNAi therapeutic
screens. Nucleic Acid Ther. 25:35–46. 2015. View Article : Google Scholar : PubMed/NCBI
|
|
15
|
Wang GL, Chen L, Wei YZ, Zhou JM, Wu YY,
Zhang YX, Qin J and Zhu YY: The effect of NET-1 on the
proliferation, migration and endocytosis of the SMMC-7721 HCC cell
line. Oncol Rep. 27:1944–1952. 2012.PubMed/NCBI
|
|
16
|
He S, Wei YZ, Wang GL, Xu YY, Zhou JM,
Zhang YX and Chen L: Study of RNA interference targeting NET-1
combination with sorafenib for hepatocellular carcinoma therapy in
vitro and in vivo. Gastroenterol Res Pract. 2013:6851502013.
View Article : Google Scholar : PubMed/NCBI
|
|
17
|
Chen L, Zhu Y, Li H, Wang GL, Wu YY, Lu
YX, Qin J, Tuo J, Wang JL and Zhu J: Knockdown of TSPAN1 by RNA
silencing and antisense technique inhibits proliferation and
infiltration of human skin squamous carcinoma cells. Tumori.
96:289–295. 2010.PubMed/NCBI
|
|
18
|
Song Y, Li L, Ou Y, Gao Z, Li E, Li X,
Zhang W, Wang J, Xu L, Zhou Y, et al: Identification of genomic
alterations in oesophageal squamous cell cancer. Nature. 509:91–95.
2014. View Article : Google Scholar : PubMed/NCBI
|
|
19
|
Wollscheid V, Kühne-Heid R, Stein I,
Jansen L, Köllner S, Schneider A and Dürst M: Identification of a
new proliferation-associated protein NET-1/C4.8 characteristic for
a subset of high-grading cervical intraepithelial neoplasia and
cervical carcinoma. Int J Cancer. 99:771–775. 2002. View Article : Google Scholar : PubMed/NCBI
|
|
20
|
Jin Y, Zhang W and Liu B: Abnormal
expression of p53, Ki67 and iNOS in human esophageal carcinoma in
situ and pre-malignant lesions. Zhonghua Zhong Liu Za Zhi.
23:129–131. 2001.(In Chinese). PubMed/NCBI
|
|
21
|
Cohen GM: Caspases: The executioners of
apoptosis. Biochem J. 326:1–16. 1997. View Article : Google Scholar : PubMed/NCBI
|
|
22
|
Huang W, Yang X, Yao S, LwinOo T, He H,
Wang A, Li C and He L: Reactive oxygen species burst induced by
aluminum stress triggers mitochondria-dependent programmed cell
death in peanut root tip cells. Plant Physiol Biochem. 82:76–84.
2014. View Article : Google Scholar : PubMed/NCBI
|