Introduction
Pancreatic cancer (PC) is a deadly malignant
disease, with an overall 5-year survival rate of <5% (1). It is the 7th leading cause of
cancer-associated mortalities worldwide (2) and poses a great threat to the health of
individuals. Annually, the mortality rate of PC patients is almost
identical to its incidence rate (3).
Currently, pancreatectomy remains the most effective therapy
modality for PC patients, which offers the only potential for
successful treatment. However, the patients undergoing resection
treatment have a median survival of only 12–22 months (4). Therefore, it is urgent to understand the
molecular pathophysiology of PC to promote the development of
effective therapeutic strategies.
In recent decades, considerable efforts have been
made to investigate the pathogenesis and therapeutic strategies for
the treatment of PC. It is well known that cell growth is
controlled by a coordinated response to nutrients and growth
factors. Alterations in nutrient sensing and growth factors may
lead to cancer incidence (5).
Glutamine, as the necessary nutrient in nucleic acid synthesis and
cell proliferation, plays an important role in the process of tumor
anabolic processes (6,7). Pancreatic ductal adenocarcinoma cells
have been found profoundly sensitive to glutamine deprivation,
indicating that glutamine is critical for pancreatic ductal
adenocarcinoma growth (8). In
particular, one study has found that oncogenes could regulate
nutrient metabolism in the development of malignancy. MYC,
for example, can drive glutamine uptake and catabolism by
activating the expression of genes, including glutaminase and
solute carrier family 1 (neutral amino acid transporter), member 5
(9). Although several genes
associated with glutamine metabolism in PC have been studied, it is
far from sufficient to fully understand the molecular mechanisms of
PC.
Therefore, in the present study, the expression
profile data GSE17632 (5) was
assessed to identify the differentially-expressed genes (DEGs)
between PC cells treated with glutamine and without glutamine. With
these selected DEGs, Gene Ontology (GO) functional and pathway
enrichment analyses were performed, and the protein-protein
interaction (PPI) network was constructed. Additionally, network
module and literature mining analyses were also performed to
further study the functions of DEGs. The present study explored the
critical genes and molecular mechanisms in PC cells with glutamine
by bioinformatics methods.
Materials and methods
Microarray data source
The mRNA expression profile data of GSE17632 were
downloaded from the Gene Expression Omnibus (http://www.ncbi.nlm.nih.gov/geo/) database of National
Center for Biotechnology Information. In the dataset, 4 samples
(GSM440132, GSM440133, GSM440134 and GSM440135) of PC cells treated
with glutamine (glutamine group) compared with PC cells without
glutamine treatment (control group) were selected for analysis. The
PC cells were BxPC-3 pancreatic cancer cells. The platform was
GPL4133 Agilent-014850 Whole Human Genome Microarray 4×44K G4112F
(Feature Number version).
Data preprocessing
The dataset were dual-channel chips, including the
Cy3 channel and Cy5 channel. The Cy3 channel consisted of control
samples, and the growth condition of the PC cells was glucose and
glutamine depleted. The Cy5 channel consisted of experimental
samples, of which the growth condition was glutamine. The original
data was pre-processed using locally weighted scatterplot smoothing
(LOWESS) (10) and the pre-processed
data were used to analyze the DEGs.
DEG analysis
The DEGs between the glutamine and control groups
were analyzed using the Bioconductor limma package (11). The unpaired t-test was used to
calculate the P-value and false discovery rate (FDR). Additionally,
the fold-change (FC) among the sample groups was also calculated.
Only genes with FDR<0.01 and |log2FC|>1 were
selected as the DEGs.
GO functional and pathway enrichment
analyses
In the present study, the function enrichment
analysis of the DEGs were analyzed using GO (http://www.geneontology.org) (12) database, which provided the function
annotations of DEGs in biological process (BP), molecular function
(MF) and cellular component (CC), respectively. In addition, the
pathway enrichment analysis was performed through Kyoto
Encyclopedia of Genes and Genomes (KEGG) (http://www.genome.ad.jp/kegg/) (13) database. During the process of
enrichment analyses, the significant threshold of the
hypergeometric test was set as 0.05.
PPI network construction and network
module analysis
The Search Tool for the Retrieval of Interacting
Genes (STRING; http://string-db.org/) database
(14) is a precomputed global
resource for evaluating PPI information. In the present study, the
STRING database was used to predict the PPI for the DEGs. With a
PPI score of 0.7, the PPI network was constructed and was
visualized using Cytoscape (15)
which was a general bioinformatics package used for visualizing
biological network and integrating data.
Additionally, in the present study, the Cluster One
(16) plugin in Cytoscape was used
for mining modules in the PPI network. The network modules with
P<0.001 were selected.
Literature mining of key genes in the
network module
Subsequent to analysis of the modules, the DEGs in
the modules were analyzed using literature mining to explore their
relevance in previous studies. The Gene Cluster with Literature
Profiles 2.0 (GenCLiP 2.0; http://ci.smu.edu.cn/) (17) online tool was used for literature
mining of human genes and network. The input gene set was the key
gene set in the PPI network. The Literature Mining Gene Networks
module of GenCLiP was used to construct gene co-occurrence networks
of the input genes and to analyze the hotspot-associated genes in
the literature. The biological function of hotspot genes were then
analyzed by the Gene Cluster with Literature Profiles module, with
the parameters of P≤1×10⁻¹⁰ and Hit≥4 (Hit represents
the number of articles mentioning the corresponding gene that also
contain the search term used).
Results
DEGs analysis
In the present study, a total of 495 genes were
selected as DEGs in the glutamine group, including 329 upregulated
DEGs and 166 downregulated DEGs.
GO functional and KEGG enrichment
analyses of DEGs
The significant enrichment result of DEGs in BP, CC
and MF was shown in Table I. The most
significant terms of BP, CC and MF enriched by upregulated DEGs
were, respectively, GO:0010033 response to organic substance,
GO:0044421 extracellular region, and GO:0051787 misfolded protein
binding. The downregulated DEGs were mainly enriched in BP terms
associated with anatomical structure development, CC terms
associated with cell junction and MF terms associated with region
sequence-specific DNA binding transcription factor activity.
 | Table I.The most significant enrichment
results of differentially expressed genes in GO terms. |
Table I.
The most significant enrichment
results of differentially expressed genes in GO terms.
| A, Upregulated |
|---|
|
|---|
| Go ID | Term | Count | P-value |
|---|
| BP |
|
|
|
|
GO:0010033 | Response to organic
substance | 80 |
2.97×10⁻¹¹ |
|
GO:0006950 | Response to
stress | 99 |
2.02×10⁻¹⁰ |
|
GO:0035966 | Response to
topologically incorrect protein | 17 |
6.35×10⁻¹⁰ |
|
GO:0006986 | Response to unfolded
protein | 16 |
1.96×10⁻⁹ |
|
GO:0033993 | Response to
lipid | 34 |
7.07×10⁻⁹ |
| CC |
|
|
|
|
GO:0044421 | Extracellular
region part | 101 |
6.71×10⁻¹¹ |
|
GO:0005615 | Extracellular
space | 50 |
1.31×10⁻¹⁰ |
|
GO:0005576 | Extracellular
region | 107 |
2.72×10⁻⁸ |
|
GO:0070062 | Extracellular
vesicular exosome | 73 |
3.71×10⁻⁷ |
|
GO:1903561 | Extracellular
vesicle | 73 |
3.71×10⁻⁷ |
| MF |
|
|
|
|
GO:0051787 | Misfolded protein
binding | 4 |
1.64×10⁻⁵ |
|
GO:0005509 | Calcium ion
binding | 25 |
3.86×10⁻⁵ |
|
GO:0045236 | CXCR chemokine
receptor binding | 4 |
1.103×10⁻⁴ |
|
GO:0051087 | Chaperone
binding | 7 |
1.165×10⁻⁴ |
|
GO:0051082 | Unfolded protein
binding | 8 |
1.522×10⁻⁴ |
|
| B,
Downregulated |
|
| Go ID | Term | Count | P-value |
|
| BP |
|
|
|
|
GO:0007259 | JAK-STAT
cascade | 7 |
3.34×10⁻⁵ |
|
GO:0002573 | Myeloid leukocyte
differentiation | 8 |
9.61×10⁻⁵ |
|
GO:0046427 | Positive regulation
of JAK-STAT cascade | 5 |
1.33×10⁻⁴ |
|
GO:0046425 | Regulation of
JAK-STAT cascade | 6 |
1.68×10⁻⁴ |
|
GO:0048856 | Anatomical
structure development | 56 |
1.78×10⁻⁴ |
| CC |
|
|
|
|
GO:0036056 | Filtration
diaphragm | 2 |
1.51×10⁻³ |
|
GO:0036057 | Slit diaphragm | 2 |
1.51×10⁻³ |
|
GO:0030054 | Cell junction | 18 |
1.55×10⁻³ |
|
GO:0032809 | Neuronal cell body
membrane | 2 |
3.48×10⁻³ |
|
GO:0044298 | Cell body
membrane | 2 |
3.49×10⁻³ |
| MF |
|
|
|
|
GO:0034046 | Poly(G)
binding | 2 |
3.50×10⁻⁴ |
|
GO:0004402 | Histone
acetyltransferase activity | 4 |
8.47×10⁻⁴ |
|
GO:0090595 | Acetyl-CoA:L-lysine
N6-acetyltransferase | 4 |
8.47×10⁻⁴ |
|
GO:0000982 | RNA polymerase II
core promoter proximal region sequence-specific DNA binding
transcription factor activity | 8 |
1.14×10⁻³ |
|
GO:0000983 | RNA polymerase II
core promoter sequence-specific DNA binding transcription factor
activity | 2 |
3.10×10⁻³ |
In addition, the result of KEGG pathway enrichment
analysis was shown in Table II. The
upregulated DEGs were mainly enriched in 15 pathways, including
protein processing in endoplasmic reticulum, metabolic pathways and
cytokine-cytokine receptor interaction. By contrast, the
downregulated DEGs were mainly enriched in 9 pathways, including
the Janus kinase-signal transducer and activator of transcription
(JAK-STAT) signaling pathway and mitogen-activated protein kinase
(MAPK) signaling pathway.
| Table II.KEGG pathway enrichment analysis
results of differentially expressed genes. |
Table II.
KEGG pathway enrichment analysis
results of differentially expressed genes.
| A, Upregulated |
|---|
|
|---|
| KEGG ID | Term | Count | P-value |
|---|
| 04141 | Protein processing
in endoplasmic reticulum | 14 |
4.13×10⁻⁶ |
| 00250 | Alanine, aspartate
and glutamate metabolism | 5 |
3.78×10⁻⁴ |
| 01100 | Metabolic
pathways | 37 |
8.71×10⁻⁴ |
| 00520 | Amino sugar and
nucleotide sugar metabolism | 5 |
2.50×10⁻³ |
| 00900 | Terpenoid backbone
biosynthesis | 3 |
2.95×10⁻³ |
| 00670 | One carbon pool by
folate | 3 |
5.06×10⁻³ |
| 03430 | Mismatch
repair | 3 |
1.02×10⁻² |
| 04610 | Complement and
coagulation cascades | 5 |
1.18×10⁻² |
| 00072 | Synthesis and
degradation of ketone bodies | 2 |
1.29×10⁻² |
| 04060 | Cytokine-cytokine
receptor interaction | 11 |
1.61×10⁻² |
| 00790 | Folate
biosynthesis | 2 |
1.93×10⁻² |
| 05150 | Staphylococcus
aureus infection | 4 |
2.34×10⁻² |
| 05020 | Prion diseases | 3 |
3.18×10⁻² |
| 00051 | Fructose and
mannose metabolism | 3 |
3.42×10⁻² |
| 03030 | DNA
replication | 3 |
3.42×10⁻² |
|
| B,
Downregulated |
|
| KEGG ID | Term | Count | P-value |
|
| 04630 | JAK-STAT signaling
pathway | 6 |
4.88×10⁻⁴ |
| 04010 | MAPK signaling
pathway | 6 |
7.85×10⁻³ |
| 04920 | Adipocytokine
signaling pathway | 3 |
1.01×10⁻² |
| 04512 | ECM-receptor
interaction | 3 |
1.84×10⁻² |
| 05219 | Bladder cancer | 2 |
3.13×10⁻² |
| 04930 | Type II diabetes
mellitus | 2 |
4.01×10⁻² |
| 04670 | Leukocyte
transendothelial migration | 3 |
4.11×10⁻² |
| 04510 | Focal adhesion | 4 |
4.25×10⁻² |
| 05213 | Endometrial
cancer | 2 |
4.63×10⁻² |
PPI network and network module
analyses
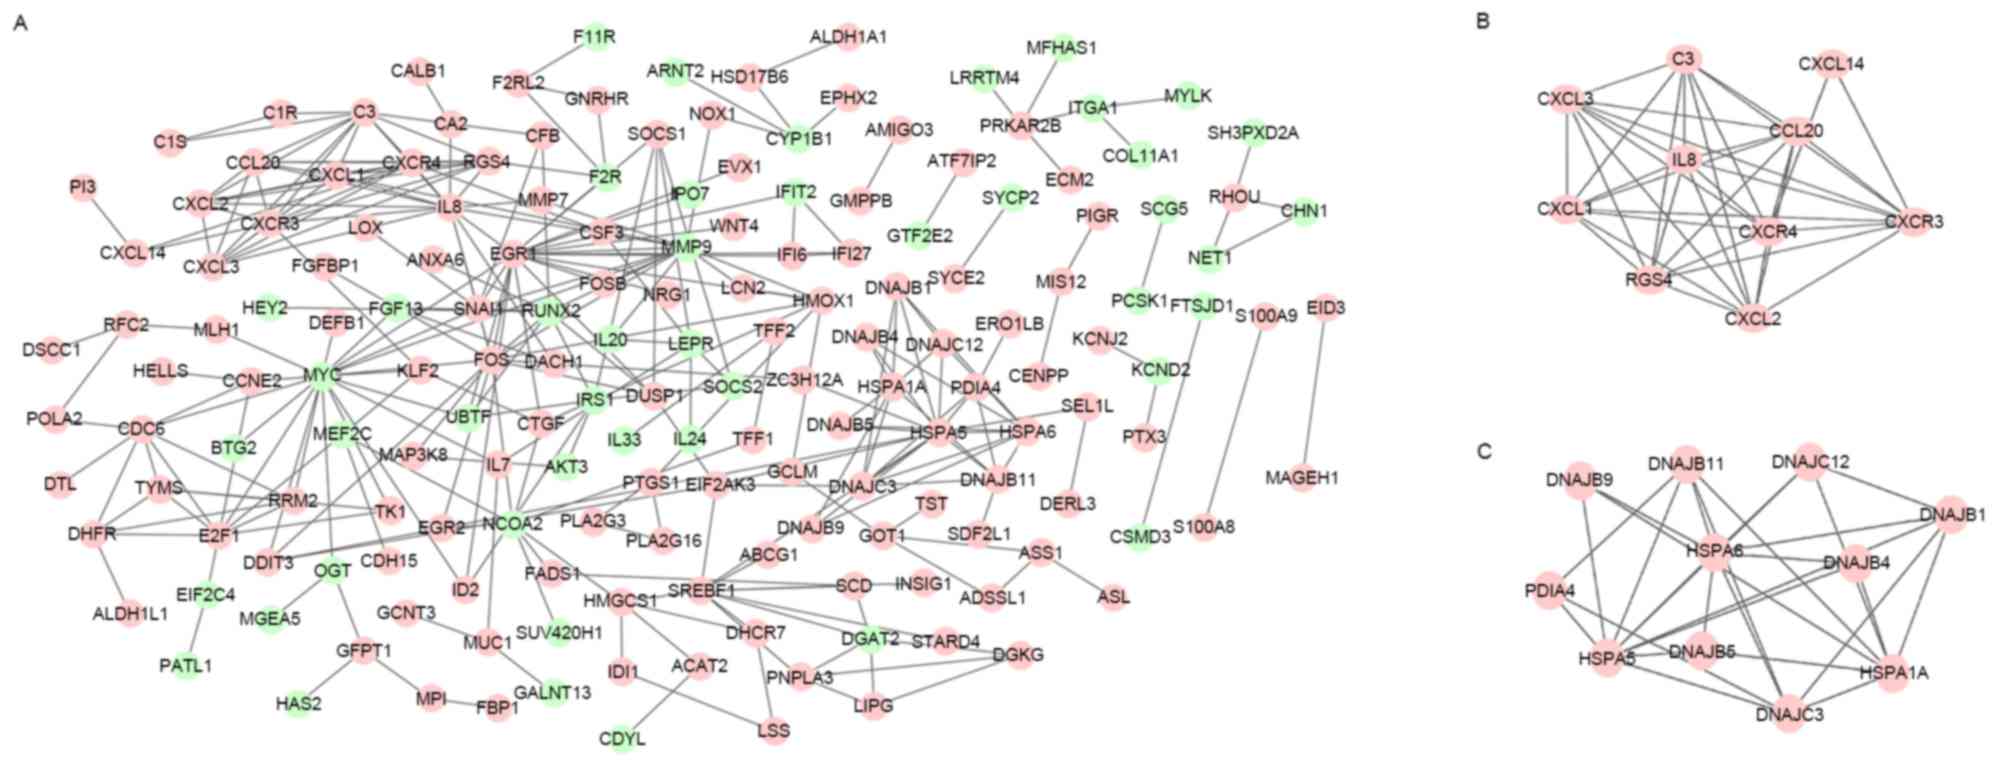
The constructed PPI network of DEGs is shown in
Fig. 1A. In total, 173 nodes and 290
interacting protein pairs were contained in the PPI network. There
were 12 DEGs with degree ≥10, such as early growth response 1
(EGR1; degree, 20), MYC (degree, 19), heat shock
70kDa protein 5 (HSPA5; degree, 16), interleukin 8
(IL8; degree, 15), and chemokine (C-X-C motif) receptor 4
(CXCR4; degree, 10).
From the constructed PPI network, two sub-network
modules were obtained. The genes in the two modules were all
upregulated DEGs. In total, 10 DEGs and 38 interacting pairs were
contained in module 1 (Fig. 1B),
including IL8, CXCR4 and CXCR3. Additionally,
11 DEGs and 28 interacting pairs were contained in module 2
(Fig. 1C), including HSPA6 and
HSPA5.
Literature mining of the network
module
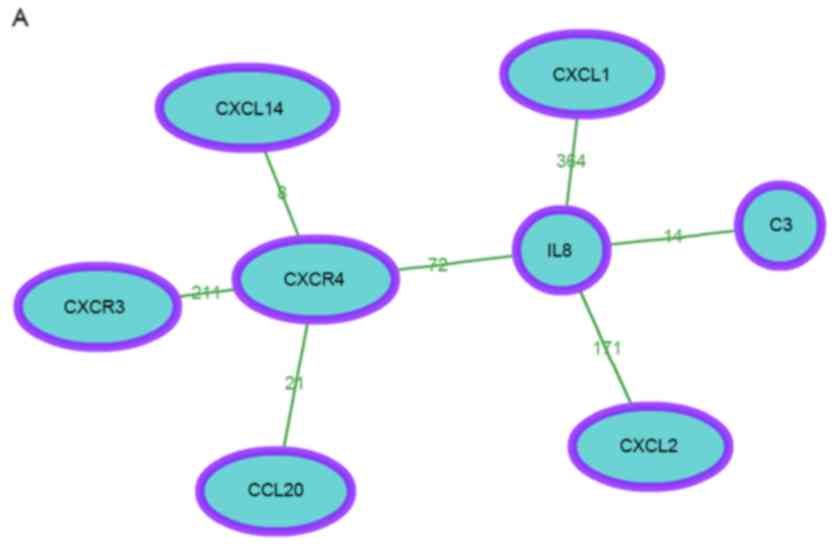
The co-occurrence network of module 1 is shown in
Fig. 2A. In total, 8 genes were
contained in the network. In addition, according to the enrichment
score, the DEGs of module 1 were significantly enriched in 5
clusters and 1 single function (Table
III). A heat map based on the genes and functions in Table IV was constructed (Fig. 2B).
| Table III.Functional enrichment results of
differentially expressed genes in module 1. |
Table III.
Functional enrichment results of
differentially expressed genes in module 1.
| A, Cluster1
(enrichment score, 13.92) |
|---|
|
|---|
| Keywords | P-value | Gene list |
|---|
| Chemokine
receptor |
7.36×10⁻¹⁵ | C3; CCL20; CXCL1;
CXCL14; CXCL2; CXCL3; CXCR3; CXCR4; IL8 |
| Quantitative real
time |
5.29×10⁻¹⁴ | C3; CCL20; CXCL1;
CXCL14; CXCL2; CXCL3; CXCR3; CXCR4; IL8 |
| Extracellular
matrix |
8.83×10⁻¹⁵ | C3; CCL20; CXCL1;
CXCL14; CXCL2; CXCL3; CXCR3; CXCR4; IL8 |
| Cell migration |
6.27×10⁻¹⁵ | C3; CCL20; CXCL1;
CXCL14; CXCL2; CXCL3; CXCR3; CXCR4; IL8 |
|
| B, Cluster2
(enrichment score, 13.49) |
|
|
Keywords | P-value | Gene
list |
|
| Monocyte
chemotactic protein |
5.60×10⁻¹³ | CCL20; CXCL1;
CXCL2; CXCL3; CXCR3; CXCR4; IL8 |
| Macrophage
inflammatory protein |
2.70×10⁻¹² | CCL20; CXCL1;
CXCL2; CXCL3; CXCR3; CXCR4; IL8 |
| Chemokine |
2.26×10⁻¹⁷ | CCL20; CXCL1;
CXCL14; CXCL2; CXCL3; CXCR3; CXCR4; IL8 |
|
| C, Cluster3
(enrichment score, 11.32) |
|
|
Keywords | P-value | Gene
list |
|
| Tumor necrosis
factor |
2.98×10⁻¹¹ | C3; CCL20; CXCL1;
CXCL2; CXCL3; CXCR3; CXCR4; IL8 |
| Monocyte
chemoattractant protein |
1.61×10⁻¹³ | C3; CCL20; CXCL1;
CXCL2; CXCL3; CXCR3; CXCR4; IL8 |
| Innate immune
response |
2.35×10⁻¹¹ | C3; CCL20; CXCL1;
CXCL2; CXCL3; CXCR3; CXCR4; IL8 |
|
| D, Cluster4
(enrichment score, 10.42) |
|
|
Keywords | P-value | Gene
list |
|
| Innate immune
system |
2.34×10⁻¹¹ | C3; CCL20; CXCL1;
CXCL2; CXCR3; CXCR4; IL8 |
| Adaptive immune
response |
6.24×10⁻¹¹ | C3; CCL20; CXCL1;
CXCL2; CXCR3; CXCR4; IL8 |
|
| E, Single1
(enrichment score, 10.20) |
|
|
Keywords | P-value | Gene
list |
|
| Central nervous
system |
6.25×10⁻¹¹ | C3; CCL20; CXCL1;
CXCL14; CXCL2; CXCR3; CXCR4; IL8; RGS4 |
|
| F, Cluster5
(enrichment score, 10.11) |
|
|
Keywords | P-value | Gene
list |
|
| CC chemokine
ligand |
9.19×10⁻¹¹ | CCL20; CXCL2;
CXCR3; CXCR4; IL8 |
| Draining lymph
node |
6.59×10⁻¹¹ | CCL20; CXCL1;
CXCL2; CXCR3; CXCR4; IL8 |
| Table IV.Functional enrichment results of
differentially expressed genes in module 2. |
Table IV.
Functional enrichment results of
differentially expressed genes in module 2.
| A, Single1
(enrichment score, 12.14) |
|---|
|
|---|
| Keywords | P-value | Gene list |
|---|
| Heat shock
protein |
7.17×10⁻¹³ | DNAJB1; DNAJB11;
DNAJB4; DNAJB5; DNAJC12; DNAJC3; HSPA1A; HSPA5; HSPA6; PDIA4 |
|
| B, Cluster1
(enrichment score, 11.25) |
|
|
Keywords | P-value | Gene
list |
|
| Unfolded protein
response |
1.47×10⁻⁹ | DNAJB11; DNAJB9;
DNAJC3; HSPA1A; HSPA5; PDIA4 |
| Glucose regulated
protein |
2.18×10⁻¹⁴ | DNAJB11; DNAJB9;
DNAJC12; DNAJC3; HSPA1A; HSPA5; PDIA4 |
| C, Cluster2
(enrichment score, 10.23) |
|
| Keywords | P-value | Gene list |
| Chaperones |
1.20×10⁻⁹ | DNAJB1; DNAJB11;
HSPA5; HSPA6; PDIA4 |
| Folding |
2.34×10⁻⁹ | DNAJB1; DNAJB11;
DNAJC3; HSPA5; PDIA4 |
| Endoplasmic
reticulum stress |
1.98×10⁻¹¹ | DNAJB1; DNAJB11;
DNAJB9; DNAJC12; DNAJC3; HSPA5; PDIA4 |
| Protein
folding |
2.18×10⁻¹³ | DNAJB1; DNAJB11;
DNAJB9; DNAJC12; DNAJC3; HSPA1A; HSPA5; PDIA4 |
| Endoplasmic
reticulum |
6.08×10⁻¹¹ | DNAJB1; DNAJB11;
DNAJB4; DNAJB9; DNAJC12; DNAJC3; HSPA1A; HSPA5; PDIA4 |
| D, Single2
(enrichment score, 8.64) |
|
|
Keywords | P-value | Gene
list |
|
| ATPase
activity |
2.30×10⁻⁹ | DNAJB1; DNAJB11;
DNAJB5; DNAJC12; HSPA1A; HSPA5; HSPA6 |
Additionally, the co-occurrence network of module 2
was revealed in Fig. 2C. In total, 9
genes were included in the network. The DEGs of module 2 were
significantly enriched in 2 clusters and 2 single functions
(Table IV). The constructed heat map
based on the genes and functions in Table IV was shown in Fig. 2D.
Discussion
In the present study, a total of 495 genes were
identified as DEGs between the glutamine and control groups. These
DEGs were mainly enriched in functions associated with response to
organic substance, and metabolic pathway and JAK-STAT signaling
pathway. Additionally, in the PPI network, MYC,
HSPA5, IL18 and CXCR4 had high
connectivitydegree. The majority of the DEGs were found to be
hotspot genes based on literature mining.
In the PPI network, MYC had a high
connectivity degree and was considered as a hub gene. MYC
encodes a multifunctional, nuclear phosphoprotein that plays an
important role in cell cycle progression, apoptosis and cellular
transformation. The overexpression of MYC can promote cell
transformation between G1 and S phase and lead to cell
proliferation and formation of cancer (18). Studies have shown that knockdown of
MYC results in inhibited growth of PC cells (19,20).
Notably, MYC has been documented to induce the expression of
mitochondrial glutaminase to stimulate glutamine catabolism, which
plays an important role in cancer cell metabolism (21).
MYC can be regulated by the JAK-STAT
signaling pathway, which was a significant pathway in the present
study (22). The JAK-STAT signaling
pathway participates in immune function and cell growth and
differentiation (23). Additionally,
components of the pathway, such as STAT3, have been shown to
promote uncontrolled cell growth through dysregulation of gene
expression involved in apoptosis, and cell-cycle regulation
(24). As a result, it was
hypothesized that glutaminase may have important roles in PC cell
metabolism by regulating the JAK-STAT signaling pathway.
In particular, module analysis of the PPI network
showed that two modules were obtained in the present study. By
combining with literature mining, CXCR4 and IL8 were
found to be key DEGs in module1. CXCR4 encodes the 7
trans-membrane G-protein-coupled receptor and a chemokine receptor
specific for stromal cell-derived factor 1 (SDF1) (25). In cancer, CXCR4 is associated with
metastasis to tissues that have a high concentration of SDF1
(26). The expression of CXCR4
has been suggested to play an important role in tumor cell invasion
and metastasis in PC (27). In
addition, IL8 encodes a chemokine that has pro-inflammatory
effects (28). The association
between inflammation and cancer has been well established. IL8 can
also promote cancer stem-like cell invasion and metastasis, as well
as treatment resistance (29).
Therefore, glutaminase may increase the expression of CXCR4
and IL8 to promote the invasion and metastasis of PC
cells.
In addition, in module 2, HSPA5 was a key
DEG. HSPA5 is a regulator of endoplasmic reticulum (ER) function
(30). The expression of HSPA5
is induced by ER stress and its overexpression has been reported in
numerous types of cancer cells (31).
Studies have shown that HSPA5 can inhibit the etoposide-mediated
apoptosis by inhibiting activation of caspase-7 in cancer cells
(32). Additionally, HSPA5
contributes to the growth of tumor and can induce drug resistance
of cancer cells (31). Therefore, the
expression of HSPA5 plays an important role in the
progression of PC cells.
In conclusion, analysis of the gene expression
profiles, significant differences in gene expression were found
between glutamine and control group. Through analysis of DEGs, it
was found that MYC, IL18, CXCR4 and
HSPA5 may exert important roles in molecular mechanisms of
PC cells with glutamine. However, additional experiments with
larger samples are required to verify the present results.
Acknowledgements
The present study was supported by Shanghai Science
and Technology Commission Project (grant no. 12DZ1930502).
References
|
1
|
Biankin AV, Waddell N, Kassahn KS, Gingras
MC, Muthuswamy LB, Johns AL, Miller DK, Wilson PJ, Patch AM, Wu J,
et al: Pancreatic cancer genomes reveal aberrations in axon
guidance pathway genes. Nature. 491:399–405. 2012. View Article : Google Scholar : PubMed/NCBI
|
|
2
|
Cancer IAfRo: World cancer report 2014.
Geneva: WHO; 2014
|
|
3
|
Jemal A, Siegel R, Ward E, Hao Y, Xu J and
Thun MJ: Cancer statistics, 2009. CA Cancer J Clin. 59:225–249.
2009. View Article : Google Scholar : PubMed/NCBI
|
|
4
|
Butturini G, Stocken DD, Wente MN, Jeekel
H, Klinkenbijl JH, Bakkevold KE, Takada T, Amano H, Dervenis C,
Bassi C, et al: Influence of resection margins and treatment on
survival in patients with pancreatic cancer: Meta-analysis of
randomized controlled trials. Arch Surg. 143:75–83. 2008.
View Article : Google Scholar : PubMed/NCBI
|
|
5
|
Kaadige MR, Looper RE, Kamalanaadhan S and
Ayer DE: Glutamine-dependent anapleurosis dictates glucose uptake
and cell growth by regulating MondoA transcriptional activity. Proc
Natl Acad Sci USA. 106:pp. 14878–14883. 2009, View Article : Google Scholar : PubMed/NCBI
|
|
6
|
Medina MA: Glutamine and cancer. J Nutr.
131 9 Suppl:2539S–2542S, 2550S–2551S. 2001.PubMed/NCBI
|
|
7
|
Wise DR and Thompson CB: Glutamine
addiction: A new therapeutic target in cancer. Trends Biochem Sci.
35:427–433. 2010. View Article : Google Scholar : PubMed/NCBI
|
|
8
|
Son J, Lyssiotis CA, Ying H, Wang X, Hua
S, Ligorio M, Perera RM, Ferrone CR, Mullarky E, Shyh-Chang N, et
al: Glutamine supports pancreatic cancer growth through a
KRAS-regulated metabolic pathway. Nature. 496:101–105. 2013.
View Article : Google Scholar : PubMed/NCBI
|
|
9
|
Gao P, Tchernyshyov I, Chang TC, Lee YS,
Kita K, Ochi T, Zeller KI, De Marzo AM, Van Eyk JE, Mendell JT and
Dang CV: c-Myc suppression of miR-23a/b enhances mitochondrial
glutaminase expression and glutamine metabolism. Nature.
458:762–765. 2009. View Article : Google Scholar : PubMed/NCBI
|
|
10
|
Cleveland WS: Robust locally weighted
regression and smoothing scatterplots. J Am Statist Assoc.
74:829–836. 1979. View Article : Google Scholar
|
|
11
|
Ritchie ME, Phipson B, Wu D, Hu Y, Law CW,
Shi W and Smyth GK: limma powers differential expression analyses
for RNA-sequencing and microarray studies. Nucleic Acids Res.
43:e472015. View Article : Google Scholar : PubMed/NCBI
|
|
12
|
Ashburner M, Ball CA, Blake JA, Botstein
D, Butler H, Cherry JM, Davis AP, Dolinski K, Dwight SS, Eppig JT,
et al: Gene ontology: Tool for the unification of biology. The Gene
Ontology Consortium. Nat Genet. 25:25–29. 2000. View Article : Google Scholar : PubMed/NCBI
|
|
13
|
Kanehisa M and Goto S: KEGG: Kyoto
encyclopedia of genes and genomes. Nucleic Acids Res. 28:27–30.
2000. View Article : Google Scholar : PubMed/NCBI
|
|
14
|
Szklarczyk D, Franceschini A, Wyder S,
Forslund K, Heller D, Huerta-Cepas J, Simonovic M, Roth A, Santos
A, Tsafou KP, et al: STRING v10: Protein-protein interaction
networks, integrated over the tree of life. Nucleic Acids Res.
43:(Database Issue). D447–D452. 2015. View Article : Google Scholar : PubMed/NCBI
|
|
15
|
Shannon P, Markiel A, Ozier O, Baliga NS,
Wang JT, Ramage D, Amin N, Schwikowski B and Ideker T: Cytoscape: A
software environment for integrated models of biomolecular
interaction networks. Genome Res. 13:2498–2504. 2003. View Article : Google Scholar : PubMed/NCBI
|
|
16
|
Bader GD and Hogue CW: An automated method
for finding molecular complexes in large protein interaction
networks. BMC Bioinformatics. 4:22003. View Article : Google Scholar : PubMed/NCBI
|
|
17
|
Wang JH, Zhao LF, Lin P, Su XR, Chen SJ,
Huang LQ, Wang HF, Zhang H, Hu ZF, Yao KT and Huang ZX: GenCLiP
2.0: A web server for functional clustering of genes and
construction of molecular networks based on free terms.
Bioinformatics. 30:2534–2536. 2014. View Article : Google Scholar : PubMed/NCBI
|
|
18
|
Santoni-Rugiu E, Falck J, Mailand N,
Bartek J and Lukas J: Involvement of Myc activity in a
G(1)/S-promoting mechanism parallel to the pRb/E2F pathway. Mol
Cell Biol. 20:3497–3509. 2000. View Article : Google Scholar : PubMed/NCBI
|
|
19
|
Köenig A, Linhart T, Schlengemann K,
Reutlinger K, Wegele J, Adler G, Singh G, Hofmann L, Kunsch S, Büch
T, et al: NFAT-induced histone acetylation relay switch promotes
c-Myc-dependent growth in pancreatic cancer cells.
Gastroenterology. 138(1189–1199): e1–e2. 2010.
|
|
20
|
Asano T, Yao Y, Zhu J, Li D, Abbruzzese JL
and Reddy SA: The PI 3-kinase/Akt signaling pathway is activated
due to aberrant Pten expression and targets transcription factors
NF-kappaB and c-Myc in pancreatic cancer cells. Oncogene.
23:8571–8580. 2004. View Article : Google Scholar : PubMed/NCBI
|
|
21
|
Wise DR, DeBerardinis RJ, Mancuso A, Sayed
N, Zhang XY, Pfeiffer HK, Nissim I, Daikhin E, Yudkoff M, McMahon
SB and Thompson CB: Myc regulates a transcriptional program that
stimulates mitochondrial glutaminolysis and leads to glutamine
addiction. Proc Natl Acad Sci USA. 105:pp. 18782–18787. 2008,
View Article : Google Scholar : PubMed/NCBI
|
|
22
|
Aaronson DS and Horvath CM: A road map for
those who don't know JAK-STAT. Science. 296:1653–1655. 2002.
View Article : Google Scholar : PubMed/NCBI
|
|
23
|
Lu Y, Zhou J, Xu C, Lin H, Xiao J, Wang Z
and Yang B: JAK/STAT and PI3K/AKT pathways form a mutual
transactivation loop and afford resistance to oxidative
stress-induced apoptosis in cardiomyocytes. Cell Physiol Biochem.
21:305–314. 2008. View Article : Google Scholar : PubMed/NCBI
|
|
24
|
Hsieh FC, Cheng G and Lin J: Evaluation of
potential Stat3-regulated genes in human breast cancer. Biochem
Biophys Res Commun. 335:292–299. 2005. View Article : Google Scholar : PubMed/NCBI
|
|
25
|
Bleul CC, Fuhlbrigge RC, Casasnovas JM,
Aiuti A and Springer TA: A highly efficacious lymphocyte
chemoattractant, stromal cell-derived factor 1 (SDF-1). J Exp Med.
184:1101–1109. 1996. View Article : Google Scholar : PubMed/NCBI
|
|
26
|
Sun X, Cheng G, Hao M, Zheng J, Zhou X,
Zhang J, Taichman RS, Pienta KJ and Wang J: CXCL12/CXCR4/CXCR7
chemokine axis and cancer progression. Cancer Metastasis Rev.
29:709–722. 2010. View Article : Google Scholar : PubMed/NCBI
|
|
27
|
Mori T, Doi R, Koizumi M, Toyoda E, Ito D,
Kami K, Masui T, Fujimoto K, Tamamura H, Hiramatsu K, et al: CXCR4
antagonist inhibits stromal cell-derived factor 1-induced migration
and invasion of human pancreatic cancer. Mol Cancer Ther. 3:29–37.
2004. View Article : Google Scholar : PubMed/NCBI
|
|
28
|
Becker C, Fantini MC, Schramm C, Lehr HA,
Wirtz S, Nikolaev A, Burg J, Strand S, Kiesslich R, Huber S, et al:
TGF-beta suppresses tumor progression in colon cancer by inhibition
of IL-6 trans-signaling. Immunity. 21:491–501. 2004. View Article : Google Scholar : PubMed/NCBI
|
|
29
|
Singh JK, Simões BM, Howell SJ, Farnie G
and Clarke RB: Recent advances reveal IL-8 signaling as a potential
key to targeting breast cancer stem cells. Breast Cancer Res.
15:2102013. View
Article : Google Scholar : PubMed/NCBI
|
|
30
|
Hendershot LM, Valentine VA, Lee AS,
Morris SW and Shapiro DN: Localization of the gene encoding human
BiP/GRP78, the endoplasmic reticulum cognate of the HSP70 family,
to chromosome 9q34. Genomics. 20:281–284. 1994. View Article : Google Scholar : PubMed/NCBI
|
|
31
|
Li J and Lee AS: Stress induction of
GRP78/BiP and its role in cancer. Curr Mol Med. 6:45–54. 2006.
View Article : Google Scholar : PubMed/NCBI
|
|
32
|
Reddy RK, Mao C, Baumeister P, Austin RC,
Kaufman RJ and Lee AS: Endoplasmic reticulum chaperone protein
GRP78 protects cells from apoptosis induced by topoisomerase
inhibitors: Role of ATP binding site in suppression of caspase-7
activation. J Biol Chem. 278:20915–20924. 2003. View Article : Google Scholar : PubMed/NCBI
|