Introduction
Pituitary adenomas (PAs) are typically benign and
slow-growing tumors that arise in and consist of adenohypophysial
cells (1). PAs are the third most
common type of neoplasm in the central nervous system, the most
common type of lesion in the sellar region, and represent between
10 and 15% of intracranial tumors (1). Depending on the hormonal secretion of
PAs, they are classified as functioning or non-functioning (silent)
(2). Silent PAs (SPAs) can either
lack secretion of a sufficient level of hormonal product to
increase the serum concentration (totally silent), or can secrete
hormonal products that do not cause clinical symptoms or signs that
are usual for that hormone (clinically silent) (2). In a cross-sectional study of the
inhabitants of Banbury (UK), the prevalence of SPA was 77.6 cases
per 100,000 individuals and of these, 28% exhibited totally silent
adenomas (3). In a retrospective
study of a Finnish population covering 16 years, 37% of 164 new
cases of PA were classified as SPA, which is equivalent to an
incidence rate of ~3 novel clinical SPAs per 100,000 individuals
over 2 years (4). Therapeutic
strategies for SPAs vary according to the neurological symptoms and
the clinical manifestations caused by excessive adenohypophysial
hormone (5). Observation without
treatment may be an option for patients without neurological
symptoms. Transsphenoidal surgery is the only treatment with a high
likelihood of rapidly alleviating symptoms. Radiation therapy may
be used to prevent regrowth of residual adenomas following
resection (5). Finally,
pharmacological treatment is available for a number of subtypes of
SPA, including dopamine agonists for lactotroph adenomas and
somatostatin analogs for somatotroph adenomas (5).
The totally silent subgroup of PAs exhibits
biological behaviors that are different from the clinically silent
subgroup (6). Null cell adenomas and
oncocytomas are assumed to be slow-growing tumors, whereas a number
of clinical SPAs, particularly silent corticotroph adenomas and
somatotroph adenomas, grow more rapidly, are more prone to be
associated with apoplexy or invasiveness and exhibit a higher
recurrence rate (7–11). Thus, the application of a reasonably
established therapeutic strategy may occur if the surgical
specimens are predictive of recurrence. Due to this fact, previous
studies have investigated the histological indices of proliferative
potential in resected tumors, including bromodeoxyuridine,
proliferating cell nuclear antigen and Ki-67 cell cycle-specific
nuclear antigen, to determine the association between histological
invasiveness and PA recurrence (12–15).
According to a previous analysis of human PAs, there are two major
molecular alterations to cell cycle regulation during pituitary
tumorigenesis; one is the disruption of cyclin-dependent kinase
(CDK) regulation and CDK inhibition suppression (16), another is derived from damage to the
retinoblastoma protein (pRb) signaling pathway (17). In spite of the effect of cell-cycle
deregulation during pituitary tumorigenesis, the prognostic
significance of alterations in the expression of cell-cycle
regulators remains unknown in SPAs.
In the present study, the immunohistochemical
expression of cell-cycle regulators (CDK4, CDK6, p16, p15, p21 and
cyclin D1) and the pRb signaling pathway was investigated in SPA
samples to determine the prognostic value for SPA progression
following surgical resection. In addition, factors associated with
progression-free survival in patients with SPA were
characterized.
Patients and methods
Patients
The present study protocol was approved by the
Institutional Review Board of Samsung Changwon Hospital (Changwon,
South Korea), and all patients or families provided written
informed consent. A retrospective case study and clinical review
was conducted of 312 PAs treated surgically between January 2000
and December 2013. All patients underwent surgery and a tumor
sample was obtained for diagnosis. Inclusion criteria were: i) No
clinical manifestation of excessive pituitary hormone; and ii)
serum pituitary hormone <1.5 times the upper normal limit [8
ng/ml for growth hormone (GH); 23.0 ng/ml for prolactin (PRL), 21
mIU/ml for follicle-stimulating hormone (FSH), 95 mIU/ml for
luteinizing hormone (LH), 4.2 µIU/ml in thyroid-stimulating hormone
(TSH) and 60 pg/ml for adrenocorticotropic hormone (ACTH)].
Patients undergoing or with a history of medical treatment for
functioning PA, including dopamine agonist or somatostatin
treatment, were excluded from the present study. Surgical
indications were as follows: i) Presence of focal neurological
symptoms, including visual field defect and extraocular muscle
palsy; ii) altered mentation due to pituitary apoplexy; iii) tumor
expansion causing headache and/or hydrocephalus; and iv) patient's
requirement to relieve a fear of possessing a growing tumor, even
one with a small size.
Biochemical analysis was performed for serum
adenohypophysial hormones and pituitary function assessed by basal
and dynamic testing. According to the protocol of our institute
(18), preoperative serum
concentrations of ACTH, TSH, LH, FSH, GH, PRL, cortisol, free T4,
estradiol and testosterone were measured. Due to the lack of
clinical markers associated with hormonal hypersecretion of ACTH or
GH (e.g., hypercortisolism and acromegalic features), screening and
dynamic diagnostic tests for Cushing's syndrome or acromegaly were
not performed. Preoperative evaluations of adrenal function,
including insulin tolerance tests (ITT) and rapid ACTH stimulation
test, were not routinely performed as perioperative
glucocorticosteroid replacement was routinely conducted during
transsphenoidal surgery of pituitary adenomas at Samsung Changwon
Hospital. Postoperative evaluations of pituitary function, such as
thyroid function tests, and determinations of LH, FSH, estradiol
and testosterone concentrations were conducted in all patients.
Tests for the evaluation of postoperative adrenal insufficiency
(e.g., ITT or rapid ACTH stimulation tests) were performed for all
the patients who exhibited decreased levels of ACTH or cortisol
compared to the preoperative results.
Central hypothyroidism was defined as a low free T4
level in the presence of an inappropriate TSH level. Central
hypogonadism was diagnosed in the presence of a low estradiol or
testosterone level and an inappropriately normal or low
gonadotrophin level. Concomitant hyperprolactinemia was defined as
a PRL level above the normal range and not consistent with the
diagnosis of PRL-secreting adenoma. Hormone values were interpreted
according to the normal ranges observed in our laboratory.
Postoperative serum pituitary hormone level was regularly checked
at every 6 month at least 2 years.
Neuroradiological results of SPAs
SPAs were categorized using the Knosp
classification, which determines parasellar growth of SPAs on the
basis of coronal sections of pre- and gadolinium-enhanced magnetic
resonance imaging (MRI) (19). Knosp
grade 0-I lesions were enclosed adenomas and Knosp grade II–IV
lesions were invasive adenoma (19).
All patients underwent preoperative dynamic sellar
MRI. Postoperative sellar MRI was performed immediately after
surgery to evaluate any residual mass, and the again at 3-month or
6-month intervals within the first 2 years. If tumor-related
symptoms were suspected or hormonal alterations developed, sellar
MRI was performed immediately. Surgical extent [gross total
resection (GTR) and subtotal resection (STR)] was estimated using
intraoperative results and by the immediate postoperative MRI,
typically within 72 h after surgery.
Tumor progression was defined as the development of
a new tumor in patients with a completely resected tumor or
evidence of a new growth of an incompletely resected tumor on
serial postoperative MRI. Radiological reviews were conducted by
two independent neuroradiologists who were blinded to patient
information to classify the SPAs according to the radiological
scheme and to determine the tumor progression.
Immunohistochemistry
All SPA specimens were immunohistochemically
examined for adenohypophysial hormones [GH (cat. no. NB500-364;
dilution 1:1,000; Novus Biologicals, LLC, Littleton, CO, USA), PRL
(cat. no. LS-C50522-0.25; dilution 1:500; LifeSpan BioSciences,
Inc., Seattle, WA, USA) FSH (cat. no. GTX41060; dilution 1:500;
GeneTex, Inc., Irvine, CA, USA), LH (cat. no. LH-101AP; dilution
1:2,000; FabGennix International, Inc., Frisco, TX, USA), TSH (cat.
no. LS-C194634-500; dilution 1:200; LifeSpan BioSciences, Inc.) and
ACTH (cat. no. GTX89560; dilution 1:50; GeneTex, Inc.)], cell-cycle
regulatory proteins (p16, p15, p21, CDK4, CDK6, pRb and cyclin D1)
and proliferative markers [E3 ubiquitin-protein ligase mib1 (MIB-1)
antigen, mitosis and p53].
Immunohistochemical analysis with a labeled
streptavidin-biotin method was performed as described previously by
Shim et al (20). Monoclonal
or polyclonal primary antibodies against cell cycle regulators and
proliferative markers were p16 (cat. no. abx018127; dilution 1:100;
Abbexa Ltd., Cambridge, MA, USA), p15 (cat. no. ab53034, dilution
1:100; Abcam, Cambridge, MA, USA), p21 (cat. no. LS-C136937-100;
dilution 1:100; LifeSpan BioSciences, Inc.), CDK4 (cat. no.
LS-C330939-50; dilution 1:100; LifeSpan BioSciences, Inc.), CDK6
(cat. no. LS-C26471-100; dilution 1:100; LifeSpan BioSciences,
Inc.), pRb (cat. no. LS-C51764-50; dilution 1:75; LifeSpan
BioSciences, Inc.), cyclin D1 (cat. no. GTX54957; dilution 1:100;
GeneTex, Inc.), MIB-1 antigen (cat. no. 43095; dilution 1:100;
Signalway Antibody LLC, College Park, MD, USA) and p53 (cat. no.
2526S; dilution 1:100; Cell Signaling Technology, Inc., Danvers,
MA, USA). Negative controls omitted the primary antibody and normal
pituitary gland sections from autopsy specimens from 3 cadavers
were used as positive controls for ACTH, GH, PRL, TSH, LH, FSH,
p16, p15, p21, CDK4, CDK6, pRb and cyclin D1. Under high-power
magnification (×400), 10 fields were selected in regions with the
greatest concentrations of immunopositive nuclei. Each field had
between 700 and 1,000 cells, similar to the tumor specimen. Areas
of necrosis, normal adenohypophysial cells and endothelial cells
were excluded from evaluation. Immunoreactivity of proteins and
markers was determined as a proportion of immunopositive cells from
1,000 cells, determined by manual counting. Mitosis was counted
after hematoxylin and eosin staining, and the mitotic index defined
as the number of mitotic cells/10 high-power fields. All slides
were separately reviewed by two neuropathologists who were blinded
to the clinical and radiological information. SPAs were divided
into 6 categories according to immunohistochemical staining for
adenohypophysial cells: Null cell adenoma, gonadotrophic SPA,
somatotrophic SPA, corticotrophic SPA, lactotrophic SPA and
pluripotent SPA. This was determined using the protocol of a
previous study (5).
Immunoreactivity of cell-cycle regulators and
proliferative markers was used to determine whether the markers
affected SPA progression. Receiver operating characteristic (ROC)
curve analysis was performed using SPSS software version 12.0 (SPSS
Inc., Chicago, IL, USA) for immunoreactivity of the cell-cycle
regulatory proteins and proliferative markers to predict the
likelihood of progression (21). The
area under the ROC curve was used to determine the optimal
threshold of the mean proportion of immunopositive cells from 1,000
cells. Sensitivity was calculated as the true positive rate (number
of true positives divided by the sum of the number of true
positives and number of false negatives), specificity as the true
negative rate (number of true negatives divided by the sum of the
number of true negatives and number of false positives) and
accuracy as the sum of the number of true positives and true
negatives, divided by the total number of positives and negatives.
True positives mean that the immunoreactivity proportion above the
threshold value has an influence on the long time to progression
(TTP), and true negatives mean that the immunoreactivity proportion
below the threshold value has an influence on the short TTP. The
threshold of immunoreactivity with the greatest sensitivity and
specificity was determined, and using sensitivity-specificity
analysis, a threshold point at which sensitivity and specificity
crossed that associated with recurrence was determined for each
marker (Table I). On the basis of the
threshold value for immunoreactivity for each protein and marker,
sequential association analysis for SPA progression was
performed.
 | Table I.Results of ROC curve analysis of
cell-cycle regulatory proteins and proliferative markers, and
determination of the threshold values. |
Table I.
Results of ROC curve analysis of
cell-cycle regulatory proteins and proliferative markers, and
determination of the threshold values.
| A, Cell cycle
regulatory proteins |
|---|
|
|---|
| Protein | Proportion of IHC
staining nucleia | AUC in ROC curve | Threshold value,
% | Sensitivity, % | Specificity, % |
|---|
| p16 | 6.43±3.51 | 0.62 | 7 | 58.2 | 80.2 |
| p15 | 9.39±5.28 | 0.64 | 10 | 53.1 | 78.3 |
| p21 | 10.20±7.28 | 0.72 | 12 | 62.4 | 70.6 |
| CDK4 | 18.35±12.29 | 0.70 | 20 | 66.7 | 79.3 |
| CDK6 | 33.21±18.08 | 0.77 | 35 | 73.2 | 75.6 |
| pRb | 22.43±13.58 | 0.72 | 25 | 61.4 | 76.8 |
| Cyclin D1 | 4.52±3.18 | 0.78 | 5 | 69.1 | 76.4 |
|
| B, Proliferative
markers |
|
| Marker | Proportion of IHC
staining nucleia | AUC in ROC
curve | Threshold value,
% | Sensitivity,
% | Specificity,
% |
|
| MIB-1 | 1.76±0.91 | 0.70 | 2 | 62.1 | 77.0 |
| Mitotic index | 1.67±0.81 | 0.75 | 2 | 68.8 | 70.7 |
| p53 | 2.56±1.32 | 0.67 | 3 | 64.4 | 67.3 |
Statistical analysis
Differences between subgroups were analyzed using
Student's t-test for normally distributed, continuous values and
the Mann-Whitney test for abnormally distributed, continuous
values. χ2-tests were used to analyze categorical
variables. Variables significantly associated with SPA progression
by univariate analyses were used in multivariate analyses. In
addition, several variables of interest that were associated with
tumor progression in the literature were used in multivariate
analysis. The impact of variables on progression was evaluated by
comparing progression-free survival curves using a log-rank test.
In multivariate analysis, the Cox proportional hazard regression
model was used to assess the independent effects of specific
factors on the progression rate of SPAs and to define hazard ratios
(HRs) for significant covariates. P<0.05 was considered to
indicate a statistically significant difference. SPSS software
version 12.0 (SPSS Inc.) was used for statistical analysis.
Results
Clinical characteristics of patients
with SPAs
According to the review of medical records, during
the study period, 312 patients underwent surgical resection for
newly diagnosed PAs and 127 (40.7%) were diagnosed with SPA. All
patients were treated by an endoscopic endonasal trans-sphenoidal
approach. The mean patient age was 48.9 years (range, 24.2–85.6
years), with 71 males and 56 females. The most common presenting
symptom was headache (35.4%) (Table
II).
| Table II.Clinical characteristics of patients
with silent pituitary adenoma. |
Table II.
Clinical characteristics of patients
with silent pituitary adenoma.
| Variable | Value |
|---|
| Total patients,
n | 127 |
| Mean age (range),
years | 48.9
(24.2–85.6) |
| Male:female
ratio | 71:56 |
| Presenting symptom,
n (%) |
|
|
Headache | 45 (35.4) |
| Visual
field defect | 43 (33.9) |
|
Extraocular muscle palsy | 13 (10.2) |
| Altered
mentation | 7 (5.5) |
| None
(incidental detection) | 19 (15.0) |
| Cell type, n
(%) |
|
| Null
cell | 29 (22.8) |
|
Gonadotroph | 41 (32.3) |
|
Somatotroph | 19 (15.0) |
|
Corticotroph | 16 (12.6) |
|
Lactotroph | 15 (11.8) |
|
Pluripotent | 7 (5.5) |
| Knosp
classification, n (%) |
|
| 0-I
(enclosed adenoma) | 76 (59.8) |
| II–IV
(invasive adenoma) | 51 (40.2) |
| Mean
maximum diameter (range), mm | 31.5
(8.0–6.5) |
| Extent of surgical
resection, n (%) |
|
| Gross
total resection | 82 (64.6) |
|
Subtotal resection | 45 (35.4) |
Radiographically, the mean maximal diameter of SPAs
was 31.5 mm (range, 8.0–65.5 mm); 33.7 mm (range 10.0–65.5 mm) in
patients with focal neurological symptoms, including visual field
defect or extraocular muscle palsy, and 29.8 mm (8.0–52.3 mm) in
those without focal neurological symptoms (P=0.458, Student's
t-test). GTR was performed for 82 SPAs (64.5%); 35 SPAs (62.5%) in
patients with focal neurological symptoms and 47 SPAs (66.2%) in
those without focal neurological symptoms (P=0.525,
χ2-test). Therefore, among patients with focal
neurological symptoms, 35 patients underwent GTR, and among those
without focal neurological symptoms, 24 patients underwent STR
(P=0.172, χ2-test). The size of SPA and major clinical
features were not significantly influenced by the immunoreactivity
of cell cycle regulators (Table
III).
| Table III.Size of silent pituitary adenomas and
the presence of focal neurological symptoms, including visual field
defects and extraocular muscle palsy, according to the results of
immunohistochemical staining for cell-cycle regulators. |
Table III.
Size of silent pituitary adenomas and
the presence of focal neurological symptoms, including visual field
defects and extraocular muscle palsy, according to the results of
immunohistochemical staining for cell-cycle regulators.
| Protein | IHC staining | Mean maximal
diameter (±SD), mm |
P-valuea | Patients with focal
neurological symptoms, n (%) |
P-valueb |
|---|
| p16 | Overexpression | 28.9 (±10.2) | 0.162 | 25 (41.0) | 0.118 |
|
| Decreased
expression | 33.9 (±11.0) |
| 31 (47.0) |
|
| p15 | Overexpression | 30.7 (±9.8) | 0.758 | 16 (42.1) | 0.843 |
|
| Decreased
expression | 31.8 (±10.5) |
| 40 (44.9) |
|
| p21 | Overexpression | 28.4 (±8.7) | 0.097 | 9 (47.4) | 0.251 |
|
| Decreased
expression | 32.0 (±10.3) |
| 47 (43.5) |
|
| CDK4 | Overexpression | 33.8 (±11.5) | 0.254 | 22 (44.9) | 0.913 |
|
| Decreased
expression | 30.1 (±8.8) |
| 34 (43.6) |
|
| CDK6 | Overexpression | 32.6 (±9.6) | 0.682 | 7 (41.2) | 0.681 |
|
| Decreased
expression | 31.3 (±7.9) |
| 49 (44.5) |
|
| pRb | Overexpression | 33.4 (±10.4) | 0.206 | 27 (47.4) | 0.104 |
|
| Decreased
expression | 30.0 (±11.2) |
| 29 (41.4) |
|
| Cyclin D1 | Overexpression | 32.2 (±12.1) | 0.341 | 30 (46.2) | 0.237 |
|
| Decreased
expression | 30.8 (±9.6) |
| 26 (41.9) |
|
No patients underwent adjuvant radiotherapy without
evidence of recurrence or regrowth during follow-up. In 45 patients
who had residual tumors following subtotal resection, marked
improvement of clinical symptoms was observed. During follow-up
with regular examination of serum pituitary hormone and clinical
symptoms, patients did not experience worsening symptoms or
increased serum pituitary hormone.
Immunohistochemical staining
Adenohypophysial cells were immunohistochemically
stained, which revealed gonadotrophic cells in 41 samples (32.2%),
somatotrophic cells in 19 samples (15.0%), corticotrophic cells in
16 samples (12.6%), lactotrophic cells in 15 samples and ≥2
adenohypophysial cells in 7 samples (5.5%) (Table II).
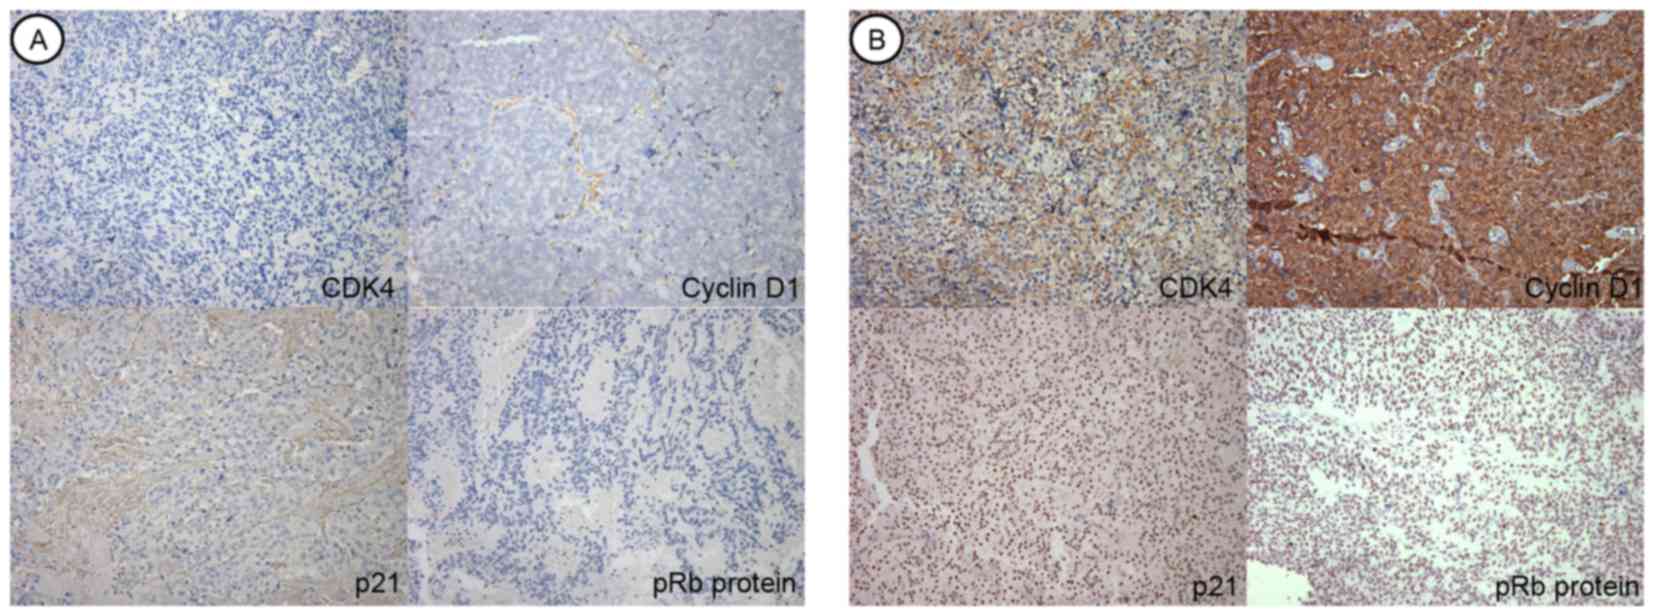
According to the ROC curve analysis,
immunohistochemical overexpression above the threshold value was
determined as follows: 7% in p16, 10% in p15, 12% in p21, 20% in
CDK4, 35% in CDK6, 25% in pRb, 5% in cyclin D1, 2% in MIB-1 and 3%
in p53. Cell-cycle regulatory protein analysis demonstrated that
p16 was immunohistochemically overexpressed above the threshold
value in 61 samples (48.0%), p15 in 38 samples (29.9%), p21 in 19
samples (15.0%), CDK4 in 49 samples (38.6%), CDK6 in 17 samples
(13.4%), pRb in 57 samples (44.9%) and cyclin D1 in 65 samples
(51.2%) (Fig. 1). Immunohistochemical
overexpression of the proliferative marker MIB-1 was identified in
54 samples (42.5%), mitotic index increased in 51 samples (40.2%)
and immunohistochemical overexpression of p53 was observed in 39
samples (30.7%). Additionally, there was no statistical difference
in the immunoreactivity for cell cycle regulators and proliferative
markers according to the cell types (Table IV).
| Table IV.Distribution of immunohistochemically
overexpressed cell cycle regulators and proliferative markers in
silent pituitary adenomas according to the cell types (n=127). |
Table IV.
Distribution of immunohistochemically
overexpressed cell cycle regulators and proliferative markers in
silent pituitary adenomas according to the cell types (n=127).
| A, Cell cycle
regulators |
|---|
|
|---|
| Protein | Null cell adenoma
(n=29) | Gonadotroph adenoma
(n=41) | Somatotroph adenoma
(n=19) | Corticotroph
adenoma (n=16) | Lactotroph adenoma
(n=15) | Pluripotent adenoma
(n=7) |
P-valuea |
|---|
| p16 | 15 (51.7) | 20 (48.8) | 9
(47.4) | 7 (43.8) | 7 (46.7) | 3 (42.9) | 0.816 |
| p15 | 10 (34.5) | 12 (29.3) | 5
(26.3) | 4 (25.0) | 5 (33.3) | 2 (28.6) | 0.774 |
| p21 | 5
(17.2) | 6
(14.6) | 2
(10.5) | 2 (12.5) | 3 (20.0) | 1 (14.3) | 0.635 |
| CDK4 | 11 (37.9) | 16 (39.0) | 8
(42.1) | 6 (37.5) | 5 (33.3) | 3 (42.9) | 0.592 |
| CDK6 | 4
(13.8) | 5
(12.3) | 3
(15.8) | 2 (12.5) | 2 (13.3) | 1 (14.3) | 0.872 |
| pRb | 12 (41.4) | 18 (43.9) | 9
(47.4) | 8 (50.0) | 7 (46.7) | 3 (42.9) | 0.526 |
| Cyclin D1 | 15 (51.7) | 21 (51.2) | 10 (52.6) | 9 (56.3) | 7 (46.7) | 3 (42.9) | 0.603 |
|
| B, Proliferative
markers |
|
| Protein | Null cell
adenoma (n=29) | Gonadotroph
adenoma (n=41) | Somatotroph
adenoma (n=19) | Corticotroph
adenoma (n=16) | Lactotroph
adenoma (n=15) | Pluripotent
adenoma (n=7) |
P-valuea |
| MIB-1 | 11 (37.9) | 16 (39.0) | 10 (52.6) | 9 (56.3) | 5 (33.3) | 3 (42.9) | 0.087 |
| Mitotic index | 10 (34.5) | 15 (36.6) | 10 (52.6) | 8 (50.0) | 6 (40.0) | 2 (28.6) | 0.069 |
| p53 | 7
(24.1) | 12 (29.3) | 7
(36.8) | 6 (37.5) | 5 (33.3) | 2 (28.6) | 0.381 |
Progression of SPAs following
surgery
All patients were followed for ≥24 months and the
mean follow-up duration was 60.9 months (range, 25.3–137.4 months).
During follow-up, 44 patients (34.6%) experienced progression
following surgical resection and the mean TTP following surgery was
36.6 months (range, 5.6–89.4 months). By cell type, progression
occurred for 6/29 (20.7%) null cell adenomas, 10/41 (24.4%)
gonadotropic SPAs, 9/19 (47.4%) somatotrophic SPAs, 8/16 (50.0%)
corticotrophic SPAs, 6/15 (40.0%) lactotrophic SPAs and 5/7 (71.4%)
pluripotent SPAs.
Immunohistochemical overexpression and
decreased staining are associated with mean TPP
In the cell-cycle regulatory proteins, the mean TTP
was increased in patients with immunohistochemical overexpression
compared with that in patients with decreased expression (P=0.002).
The mean TTP was also shorter in patients with immunohistochemical
overexpression, compared with those with decreased expression, for
pRb (P=0.009) and cyclin D1 (P=0.028) (Table V). In the proliferative markers, the
mean TTP was decreased in patients with immunohistochemical
overexpression, compared with those with immunohistochemically
decreased expression, for MIB-1 antigen (P=0.014), mitotic index
(P=0.031) and p53 (P=0.047; Table
V).
| Table V.Time to progression and progression
rate according to the result of immunohistochemical staining for
the cell-cycle regulators and proliferative markers, and cell
types. |
Table V.
Time to progression and progression
rate according to the result of immunohistochemical staining for
the cell-cycle regulators and proliferative markers, and cell
types.
| A, Cell cycle
regulators |
|---|
|
|---|
|
|
| Sample with
immunohistochemical overexpression | Sample with
immunohistochemically decreased expression |
|
|---|
|
|
|
|
|
|
|---|
| Protein | Threshold value,
% | Progression, n
(%) | TTP,
monthsa | Progression, n
(%) | TTP,
monthsa | P-value |
|---|
| p16 | 7 | 11/61 (18.0) |
43.7±17.2 | 33/66
(50.0) | 31.3±14.0 | 0.002b |
| p15 | 10 | 11/38 (28.9) | 38.2±6.8 | 33/89
(37.1) | 32.8±15.3 | 0.337 |
| p21 | 12 | 7/19
(36.8) |
37.9±14.5 | 37/108 (34.3) | 33.4±15.8 | 0.795 |
| CDK4 | 20 | 19/49 (38.8) | 35.2±3.8 | 25/78
(32.1) | 37.3±15.0 | 0.718 |
| CDK6 | 35 | 6/17
(35.3) |
35.5±14.7 | 38/110 (34.5) | 37.0±13.8 | 0.854 |
| pRb | 25 | 29/57 (50.9) |
31.3±12.6 | 15/70
(21.4) | 43.1±15.9 | 0.009b |
| Cyclin D1 | 5 | 28/65 (43.1) |
32.4±13.5 | 16/62
(25.8) | 41.2±16.2 | 0.028b |
|
| B, Proliferative
markers |
|---|
|
|
|
| Sample with
immunohistochemical overexpression | Sample with
immunohistochemically decreased expression |
|
|
|
|
|
|
|
| Protein | Threshold value,
% | Progression, n
(%) | TTP,
monthsa | Progression, n
(%) | TTP,
monthsa | P-value |
|
| MIB-1 | 2 | 25/54 (46.3) |
32.2±12.1 | 19/73
(26.0) | 41.9±15.5 | 0.014b |
| Mitotic index | 2 | 22/51 (43.1) |
33.0±14.6 | 22/76
(28.9) | 39.1±14.3 | 0.031b |
| p53 | 3 | 16/39 (41.0) |
33.7±10.2 | 28/88
(31.8) | 38.8±15.2 | 0.047b |
Univariate analysis of predisposing
factors for SPA progression
Univariate analysis revealed that progression
occurred significantly more often with somatotrophic SPAs
(P=0.040), corticotrophic SPAs (P=0.013) and pluripotent SPAs
(P<0.001) compared with null cell adenomas (Table VI). In terms of cell-cycle regulatory
proteins, patients with SPA samples that were immunohistochemically
overexpressed for p16 exhibited significantly decreased progression
rates compared with patients with decreased expression
(P<0.001). In addition, patients with SPA samples that were
immunohistochemically overexpressed for pRb (P=0.008) and cyclin D1
(P=0.038) exhibited significantly increased progression rates
compared with that for patients with immunohistochemically
decreased expression. Patients with SPA samples that were
immunohistochemically overexpressed for proliferative markers
exhibited significantly increased progression rates compared with
those for patients with immunohistochemically decreased expression;
MIB-1 (P=0.010), mitotic index (P=0.026) and p53 (P=0.037; Table VI).
| Table VI.Univariate analysis of factors
predicting progression of silent pituitary adenomas (n=127). |
Table VI.
Univariate analysis of factors
predicting progression of silent pituitary adenomas (n=127).
| Factor | Progression rate,
% | HR | 95% CI | P-value |
|---|
| Age | – | 1.318 | 0.898–1.738 | 0.714 |
| Cell type |
|
|
|
|
| Null
cell | 20.7 | 1.000 |
|
|
|
Gonadotroph adenoma | 24.4 | 1.155 | 0.564–1.647 | 0.853 |
|
Somatotroph adenoma | 47.4 | 4.372 | 2.325–6.419 | 0.040b/ |
|
Corticotroph adenoma | 50.0 | 4.876 | 2.517–7.235 | 0.013b/ |
|
Lactotroph adenoma | 40.0 | 2.174 | 0.958–3.336 | 0.052 |
|
Pluripotent adenoma | 71.4 | 8.676 | 5.083–12.269 |
<0.001b |
| Immunohistochemical
overexpression of cell-cycle regulator |
|
|
|
|
|
p16 | 18.0 | 0.314 | 0.109–0.519 |
<0.001b |
|
p15 | 28.9 | 0.793 | 0.569–1.017 | 0.124 |
|
p21 | 36.8 | 1.503 | 0.759–2.247 | 0.526 |
|
CDK4 | 38.8 | 1.732 | 0.785–2.679 | 0.433 |
|
CDK6 | 35.3 | 1.386 | 0.661–2.011 | 0.802 |
|
pRb | 50.9 | 6.285 | 3.088–9.482 | 0.008b/ |
| Cyclin
D1 | 43.1 | 4.394 | 1.364–7.424 | 0.038b/ |
| Immunohistochemical
overexpression of proliferative marker |
|
|
|
|
|
MIB-1 | 46.3 | 4.249 | 2.518–5.979 | 0.010b/ |
| Mitotic
index | 43.1 | 3.782 | 1.843–5.721 | 0.026b/ |
|
p53 | 41.0 | 3.558 | 1.447–5.669 | 0.037b/ |
| Knosp
classification |
|
|
|
|
|
0-I | 21.1 | 1.000 |
|
|
|
II–IV | 54.9 | 8.840 | 4.882–12.798 |
<0.001b |
| Maximal
diameter of Tumor | – | 2.857 | 1.421–4.293 | 0.042b/ |
| Extent of surgical
resection |
|
|
|
|
| Gross
total resection | 32.9 | 1.000 |
|
|
|
Subtotal resection | 37.8 | 1.358 | 0.790–1.926 | 0.683 |
Regarding radiological factors, patients with
invasive SPAs exhibited an increased progression rate compared with
that of patients with enclosed SPAs (P<0.001). Furthermore,
patients with SPAs ≥25 mm exhibited an increased progression rate
compared with that of patients with SPAs <25 mm (P=0.042). The
extent of surgical resection for SPA was not associated with
progression rate (P=0.683).
Multivariate analysis of predisposing
factors for SPA progression
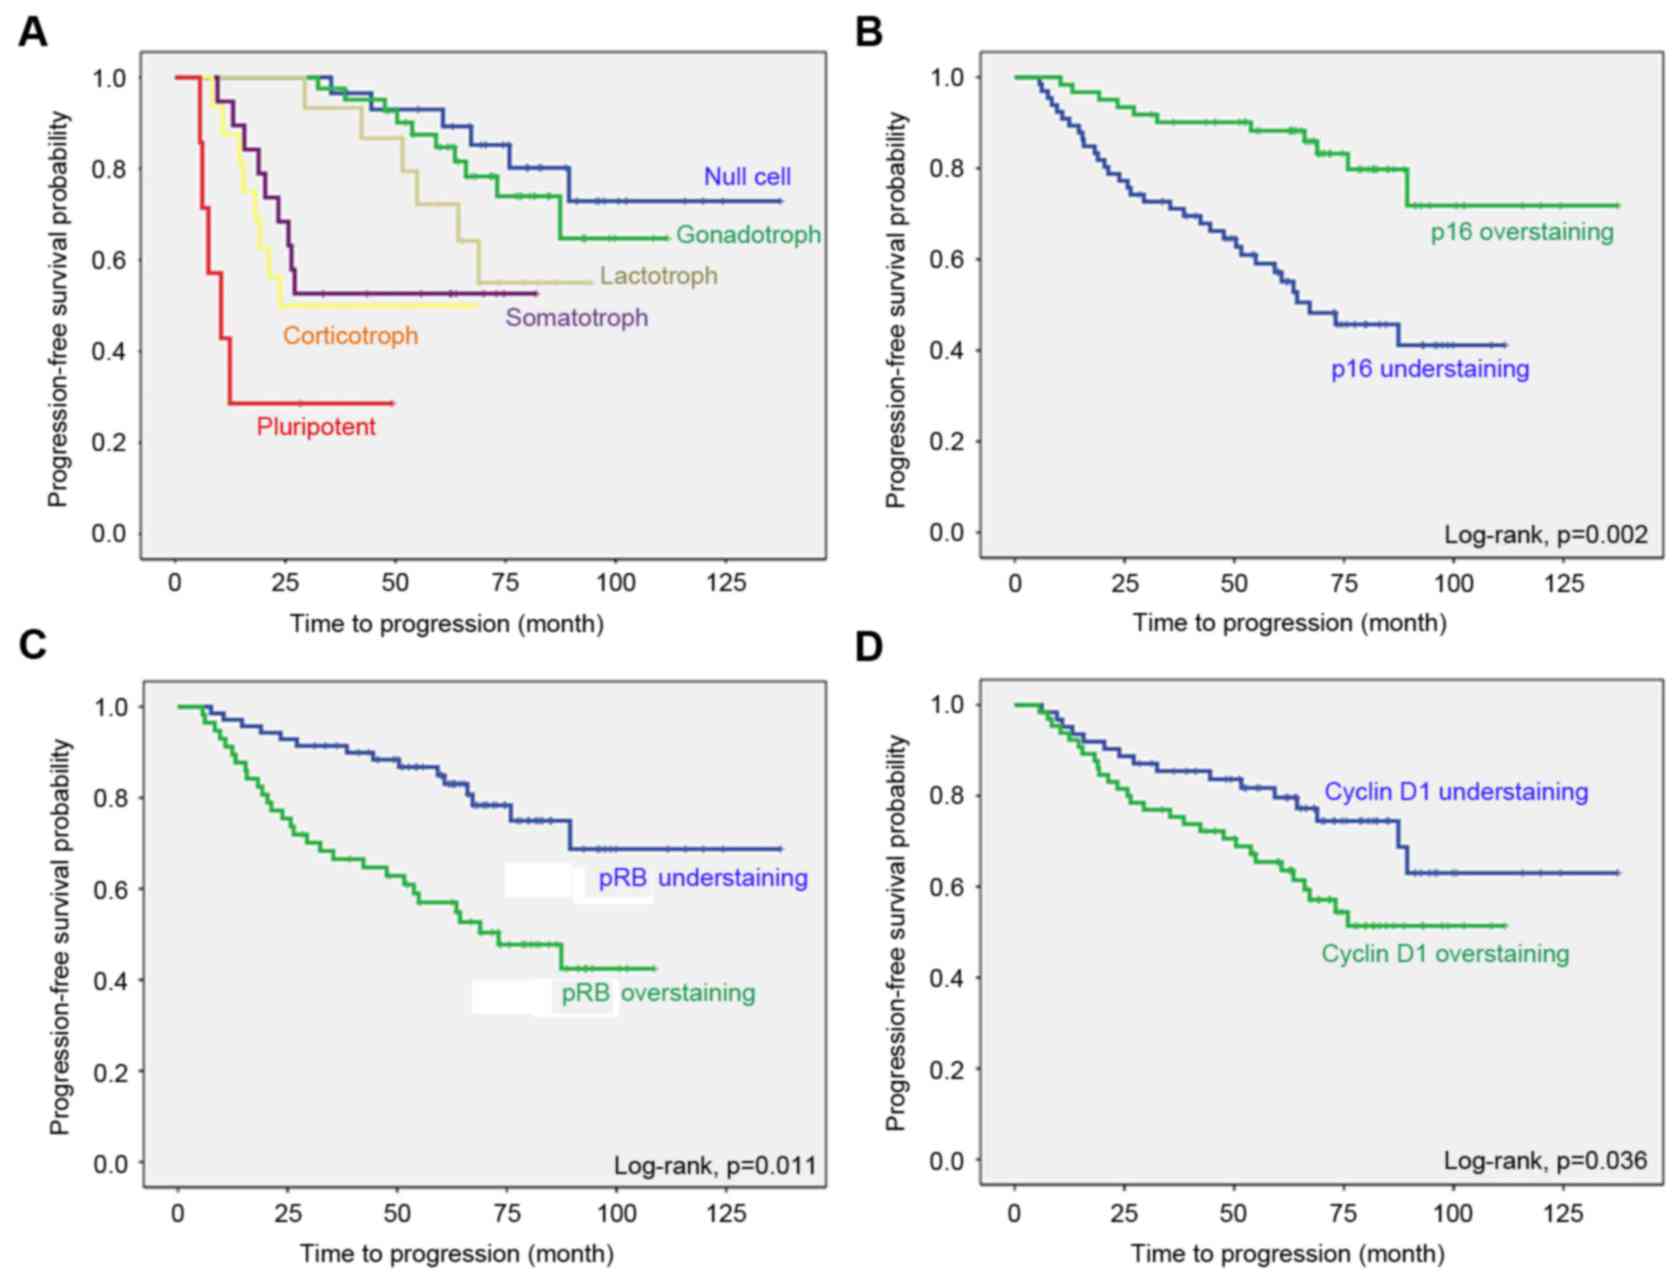
Multivariate analysis using the Cox proportional
hazard regression model for SPA progression following surgical
resection demonstrated that factors independently associated with
progression were null cell adenoma [hazard ratio (HR), 0.553; 95%
confidence interval (CI), 0.266–0.841], somatotrophic SPAs (HR,
2.197; 95% CI, 1.298–3.096), corticotrophic SPAs (HR, 2.951; 95%
CI, 1.820–4.082), pluripotent SPAs (HR, 3.694; 95% CI,
2.227–5.161), SPA samples with immunohistochemically decreased
expression for p16 (HR, 4.170; 95% CI, 2.812–5.522), SPA samples
overexpressing pRb (HR, 3.918; 95% CI, 2.532–5.304), SPA samples
overexpressing cyclin D1 (HR, 3.022; 95% CI, 1.898–4.146), SPA
samples overexpressing MIB-1 (HR, 2.835; 95% CI, 1.549–4.121), SPA
samples overexpressing p53 (HR, 2.484; 95% CI, 1.267–3.701),
increased mitotic index (HR, 2.673; 95% CI, 1.235–4.111) and Knosp
grades II–IV (HR, 5.677; 95% CI, 3.840–7.514) (Table VII). The Kaplan-Meier survival curve
analysis and log-rank test revealed the same results (Fig. 2).
| Table VII.Multivariate analysis of factors
predicting progression of silent pituitary adenomas (n=127). |
Table VII.
Multivariate analysis of factors
predicting progression of silent pituitary adenomas (n=127).
| Factor | HR | 95% CI | P-value |
|---|
| Agea | 1.524 | 0.882–2.166 | 0.294 |
| Null cell vs. other
cell type | 0.553 | 0.266–0.841 | 0.002b |
| Gonadotroph adenoma
vs. other cell type | 0.851 | 0.682–1.021 | 0.068 |
| Somatotroph adenoma
vs. other cell type | 2.197 | 1.298–3.096 | 0.046b |
| Corticotroph
adenoma vs. other cell type | 2.951 | 1.820–4.082 | 0.023b |
| Lactotroph adenoma
vs. other cell type | 1.342 | 0.876–1.808 | 0.381 |
| Pluripotent adenoma
vs. other cell type | 3.694 | 2.227–5.161 | 0.011b |
| IHC staining for
p16 (<7 vs. ≥7%) | 4.170 | 2.812–5.522 | 0.001b |
| IHC staining for
p15 (<10 vs. ≥10%) | 2.071 | 0.938–3.204 | 0.062 |
| IHC staining for
pRb (≥25 vs. <25%) | 3.918 | 2.532–5.304 | 0.004b |
| IHC staining for
Cyclin D1 (≥5 vs. <5%) | 3.022 | 1.898–4.146 | 0.013b |
| MIB-1 (≥2 vs.
<2%) | 2.835 | 1.549–4.121 | 0.031b |
| Mitotic index (≥2
vs. <2%) | 2.673 | 1.235–4.111 | 0.020b |
| IHC staining for
p53 (≥3 vs. <3%) | 2.484 | 1.267–3.701 | 0.029b |
| Knosp
classification (II–IV vs. 0-I) | 5.677 | 3.840–7.514 |
<0.001c |
| Maximal diameter of
tumorsa | 2.016 | 0.913–3.119 | 0.118 |
| Surgical extent
(gross total resection vs. subtotal resection) | 1.253 | 0.704–1.802 | 0.586 |
Discussion
The present study had a similar proportion of SPAs
to PAs and surgical outcome as previous studies (2,5). The
composition of SPA subtypes (null cell adenoma, and gonadotroph,
lactotroph, somatotroph, corticotroph and pluripotent SPAs) was
similar to other studies (2,5). Categorizing SPAs into clinical and true
SPAs is controversial; in the present study, SPAs were defined
according to the description by Mayson and Snyder (2,5). In the
systemic review and meta-analysis in 2012 by Chen et al
(22), the rate of STR was between
21.4 and 79.4% following transsphenoidal surgery of SPA, and
between 12 and 46% of patients with SPA exhibited tumor regrowth
between 42 and 112 months after surgery. The surgical outcomes
demonstrated by Chen et al (22) were similar compared with the results
of the present study.
According to a previous study, the primary treatment
of SPA is surgical resection focused on relieving the mass effect,
restoring pituitary function and validating a tissue diagnosis
(23). As the majority of the SPAs
are macroadenoma at diagnosis, the traditional indication of
surgery for SPA is the tumor expansion associated with focal
neurological symptoms. Although patients with SPA in the present
study underwent surgical resection following the aforementioned
indications, the results of surgery for endocrine-inactive adenomas
are not as clearly defined as those of surgery for functioning
adenomas, as there is no clear criterion for a cure (5).
Expression levels for p16 and pRb in pituitary
adenomas were similar to those identified in the study by Kirsch
et al (23), which observed
positive staining >25% for p16 in 57% of samples and for pRb in
48% of pituitary adenomas by immunohistochemical analysis. However,
in the present study, the rate of positive immunoreactivity >25%
was relatively low; for p16 in 13.2% of SPAs and for pRb in 28.7%
of SPAs. This discrepancy may be due to the following reasons: i)
Kirsch's analysis included all types of pituitary adenomas,
including functioning and non-functioning pituitary adenomas; ii)
there are the variations in the immunohistochemical analysis due to
concentration and dilution of antibodies used; and iii) there is
inter-observer variation in the subjective interpretations for
immunohistochemical analysis.
The present study demonstrated that the cell-cycle
regulatory proteins p16, pRb and cyclin D1, estimated using
immunohistochemical staining, were associated with SPA progression
following surgical resection. It was identified that pRb is
involved in SPA progression. The prognostic ability of cell-cycle
regulatory proteins and proliferative markers has been identified
in renal cell carcinoma (24),
gallbladder malignancies (17),
gastric adenocarcinoma (25) and
breast cancer (26). Therefore, if
these cell cycle regulators influence the tumor size and the onset
of neurological symptoms, the clinical outcome of SPA may be
altered. However, the principal clinical features of SPA were not
different, according to the status of immunoreactivity of cell
cycle regulators, which may explain why there is no effect on tumor
progression from the association between cell cycle regulators and
clinical features.
In the cell cycle, mitotic stimulation leads cyclin
D1 to activate CDK4 and CDK6 during early G1 phase,
which partially phosphorylates pRb. Cyclin D1 typically binds to
CDK during G1 and is required to bypass the cell cycle
restriction point into S phase (27),
which leads to cell cycle progression and tumor cell proliferation.
In addition, pRb is active and hypophosphorylated in quiescent
cells, and inactive and hyperphosphorylated at the G1-S
transition. Therefore, the level of phosphorylated pRb indicates
cell cycle progression into the S phase (27). Attenuated cyclin D1 and pRb expression
in SPA may explain the increased SPA progression observed in the
present study. CDK inhibitors, including p16, oppose CDK
activation. During early G1 phase, p16 binds to CDK4 and
6, and prevents cyclin D activation (27). Thus, increased expression of p16 may
prevent proliferation and SPA, which would explain the results of
the present study. Although null cell adenomas are assumed to be
slow-growing tumors, a number of types of silent adenoma, in
particular silent corticotroph adenomas and somatotroph adenomas,
grow more rapidly and are more likely to be associated with
apoplexy or invasiveness, and to exhibit increased rates of
progression (9,11). The results of the present study
demonstrated that SPAs that were somatotroph, corticotroph or
pluripotent were associated with progression. Cavernous sinus
invasion, which is more frequent for SPAs that are somatotroph,
corticotroph or pluripotent, makes total resection difficult and
may influence progression rates.
The present study had a number of limitations.
First, immunohistochemical study is well-known to have different
outcomes depending on the different professionals performing the
analysis; therefore, this subjective interpretation should be
complemented by other objective analyses, including molecular
functional study, using several quantitative methods. Secondly, the
SPA classification presents limitations. Although SPAs may be
separated into true and clinical SPAs, using immunohistochemical
and electron-microscope appearance (28), electron microscopic studies were not
performed in the present study. Therefore, it cannot be guaranteed
that the present study identified definitive classifications of SPA
subtypes. Thirdly, not all cell-cycle regulatory proteins were
examined. In the present study, a portion of the cell-cycle control
system, specifically the G1 to S transition, was focused
on, which may have biased the interpretation of the results and
neglected a number of interactions between regulatory proteins. The
fourth concern is that the present study does not reflect modern
molecular and biological interpretations of SPAs that are
increasing our understanding of the pathobiology of SPAs.
The results of the present study suggested that
expression of a number of cell-cycle regulators, including p16, pRb
and cyclin D1, were associated with SPA progression. The results
were validated using known proliferative markers of MIB-1, mitotic
index and p53, which were also significantly associated with SPA
progression. Additional studies using systemically developed
molecular biology techniques are required to characterize the
pathobiological process of SPA progression.
Acknowledgements
The abstract was presented in the 21st Annual
Scientific Meeting and Education Day of the Society for
Neuro-Oncology, Scottsdale, Arizona, November 17–20, 2016, and
published as abstract MPTH-07 in Nero Oncol 18 (suppl 6), 2016. The
present study was financially supported by a Samsung Biomedical
Research Institute (grant no. SMR-112061). The authors would like
to thank Dr Young Min Kim and Dr Mi Ok Sunwoo (Department of
Radiology, Samsung Changwon Hospital) for reviewing the
neuroradiological images, Ms. Mi-Hyeon Jin (Department of
Biostatistics, Samsung Changwon Hospital) for assistance with
statistical analysis and Dr Ji Cheol Bae (Department of
Endocrinology, Samsung Changwon Hospital) for the endocrine
evaluation.
References
|
1
|
Kovacs K, Horvath E and Vidal S:
Classification of pituitary adenomas. J Neurooncol. 54:121–127.
2001. View Article : Google Scholar : PubMed/NCBI
|
|
2
|
Mayson SE and Snyder PJ: Silent pituitary
adenomas. Endocrinol Metab Clin North Am. 44:79–87. 2015.
View Article : Google Scholar : PubMed/NCBI
|
|
3
|
Fernandez A, Karavitaki N and Wass JA:
Prevalence of pituitary adenomas: A community-based,
cross-sectional study in Banbury (Oxfordshire, UK). Clin Endocrinol
(Oxf). 72:377–382. 2010. View Article : Google Scholar : PubMed/NCBI
|
|
4
|
Raappana A, Koivukangas J, Ebeling T and
Pirilä T: Incidence of pituitary adenomas in Northern Finland in
1992–2007. J Clin Endocrinol Metab. 95:4268–4275. 2010. View Article : Google Scholar : PubMed/NCBI
|
|
5
|
Mayson SE and Snyder PJ: Silent
(clinically nonfunctioning) pituitary adenomas. J Neurooncol.
117:429–436. 2014. View Article : Google Scholar : PubMed/NCBI
|
|
6
|
Syro LV, Rotondo F, Ramirez A, Di Ieva A,
Sav MA, Restrepo LM, Serna CA and Kovacs K: Progress in the
diagnosis and classification of pituitary adenomas. Front
Endocrinol (Lausanne). 6:972015.PubMed/NCBI
|
|
7
|
Horvath E, Kovacs K, Killinger DW, Smyth
HS, Platts ME and Singer W: Silent corticotropic adenomas of the
human pituitary gland: A histologic, immunocytologic, and
ultrastructural study. Am J Pathol. 98:617–638. 1980.PubMed/NCBI
|
|
8
|
Horvath E, Kovacs K, Smyth HS, Killinger
DW, Scheithauer BW, Randall R, Laws ER Jr and Singer W: A novel
type of pituitary adenoma: Morphological features and clinical
correlations. J Clin Endocrinol Metab. 66:1111–1118. 1988.
View Article : Google Scholar : PubMed/NCBI
|
|
9
|
Klibanski A: Nonsecreting pituitary
tumors. Endocrinol Metab Clinic North Am. 16:793–804. 1987.
|
|
10
|
Randall RV, Scheithauer W and Laws ER Jr:
Hormone-containing, non-secreting pituitary tumors: Clinically
silent monohormonal pituitary adenomas. Trans Am Clin Climatol
Assoc. 96:98–103. 1985.PubMed/NCBI
|
|
11
|
Scheithauer BW, Kovacs KT, Laws ER Jr and
Randall RV: Pathology of invasive pituitary tumors with special
reference to functional classification. J Neurosurg. 65:733–744.
1986. View Article : Google Scholar : PubMed/NCBI
|
|
12
|
Landolt AM, Shibata T and Kleihues P:
Growth rate of human pituitary adenomas. J Neurosurg. 67:803–806.
1987. View Article : Google Scholar : PubMed/NCBI
|
|
13
|
Knosp E, Kits K and Perneczky A:
Proliferation activity in pituitary adenomas: Measurement by
monoclonal antibody Ki-67. Neurosurgery. 25:927–930. 1989.
View Article : Google Scholar : PubMed/NCBI
|
|
14
|
Losa M, Franzin A, Mangili F, Terreni MR,
Barzaghi R, Veglia F, Mortini P and Giovanelli M: Proliferation
index of nonfunctioning pituitary adenomas: Correlations with
clinical characteristics and long-term follow-up results.
Neurosurgery. 47:1313–1319. 2000. View Article : Google Scholar : PubMed/NCBI
|
|
15
|
Yonezawa K, Tamaki N and Kokunai T:
Clinical features and growth fractions of pituitary adenomas. Surg
Neurol. 48:494–500. 1997. View Article : Google Scholar : PubMed/NCBI
|
|
16
|
Malumbres M and Barbacid M: To cycle or
not to cycle: A critical decision in cancer. Nat Rev Cancer.
1:222–231. 2001. View
Article : Google Scholar : PubMed/NCBI
|
|
17
|
Srivastava V, Patel B, Kumar M, Shukla M
and Pandey M: Cyclin D1, retinoblastoma and p16 protein expression
in carcinoma of the gallbladder. Asian Pac J Cancer Prev.
14:2711–2715. 2013. View Article : Google Scholar : PubMed/NCBI
|
|
18
|
Cho HY, Cho SW, Kim SW, Shin CS, Park KS
and Kim SY: Silent corticotroph adenomas have unique recurrence
characteristics compared with other nonfunctioning pituitary
adenomas. Clin Endocrinol (Oxf). 72:648–653. 2010. View Article : Google Scholar : PubMed/NCBI
|
|
19
|
Knosp E, Steiner E, Kitz K and Matula C:
Pituitary adenomas with invasion of the cavernous sinus space: A
magnetic resonance imaging classification compared with surgical
findings. Neurosurgery. 33:610–618. 1993. View Article : Google Scholar : PubMed/NCBI
|
|
20
|
Shim JH, Song YJ, Kim DC, Park MK, Choi SS
and Kim KU: Silent adenomas of pituitary gland: It's
immunohistochemical features and clinical characteristics. J Korean
Neurosurg Soc. 40:330–335. 2006.
|
|
21
|
Eng J: Receiver operating characteristic
analysis: A primer. Acad Radiol. 12:909–916. 2005. View Article : Google Scholar : PubMed/NCBI
|
|
22
|
Chen Y, Wang CD, Su ZP, Chen YX, Cai L,
Zhuge QC and Wu ZB: Natural history of postoperative nonfunctioning
pituitary adenomas: A systematic review and meta-analysis.
Neuroendocrinology. 96:333–342. 2012. View Article : Google Scholar : PubMed/NCBI
|
|
23
|
Kirsch M, Mörz M, Pinzer T, Schackert HK
and Schackert G: Frequent loss of the CDKN2C (p18INK4c) gene
product in pituitary adenomas. Genes Chromosomes Cancer.
48:143–154. 2009. View Article : Google Scholar : PubMed/NCBI
|
|
24
|
Gayed BA, Youssef RF, Bagrodia A, Kapur P,
Darwish OM, Krabbe LM, Sagalowsky A, Lotan Y and Margulis V:
Prognostic role of cell cycle and proliferative biomarkers in
patients with clear cell renal cell carcinoma. J Urol.
190:1662–1667. 2013. View Article : Google Scholar : PubMed/NCBI
|
|
25
|
Kishimoto I, Mitomi H, Ohkura Y, Kanazawa
H, Fukui N and Watanabe M: Abnormal expression of p16(INK4a),
cyclin D1, cyclin-dependent kinase 4 and retinoblastoma protein in
gastric carcinomas. J Surg Oncol. 98:60–66. 2008. View Article : Google Scholar : PubMed/NCBI
|
|
26
|
Guo LL, Gao P, Wu YG, Jian WC, Hao CY, Li
H and Lin XY: Alteration of cyclin D1 in Chinese patients with
breast carcinoma and its correlation with Ki-67, pRb, and p53. Arch
Med Res. 38:846–852. 2007. View Article : Google Scholar : PubMed/NCBI
|
|
27
|
Morgan D, Murray A, Hunt T and Nurse P:
The Cell Cycle and Programmed Cell DeathAlberts B, Johnson A, Lewis
J, Raff M, Roberts K and Walter P: Molecular Biology of the Cell.
Garland Science; New York: pp. 983–1026. 2002
|
|
28
|
Horvath E and Kovacs K: The
AdenohypophysisFunctional Endocrine Pathology. Kovacs K and Asa SL:
Blackwell; Boston, MA: pp. 245–281. 1990
|