Introduction
Bladder urothelial carcinoma (BUC), a malignancy of
the genitourinary system, is one of the most common types of
bladder cancer (1). At present, the
risk factors of BUC primarily comprise smoking and contact with
aromatic amine chemicals (1). BUC may
be divided into two categories: Non-muscle- and muscle-invasive BUC
(2). Transurethral resection and
radical cystectomy are the current treatment strategies for
non-muscle- and muscle-invasive BUC, respectively (3). Although numerous methods have been
suggested, an effective treatment remains elusive due to high
recurrence rates. A more thorough understanding of the underlying
molecular mechanism of prognostic risk may be beneficial for the
development of therapeutic interventions, and therefore the
prognosis of patients with BUC.
MicroRNAs are a group of non-coding small RNAs,
comprising ~21 nucleotides, which regulate the expression of target
genes through binding to 3′-untranslated regions (UTRs) (4). Previous studies have demonstrated the
association between microRNAs and risk factors in the prognosis of
BUC (5), including miR-141
expression, which was revealed to be significantly downregulated in
invasive bladder cancer (6). miR-141
regulates kelch-like ECH-associated protein 1 and controls the
oxidative stress response that is associated with the prognosis of
BUC (7). In addition, miR-205 targets
PH domain leucine-rich repeat-containing protein phosphatase 2 and
phosphatase and tensin homolog (PTEN), further influencing
protein kinase B signaling (8).
Cathomas et al (9)
demonstrated that the expression of PTEN was associated with
the development of chemotherapy- and castration-resistant cancer,
as well as patient prognosis. Additionally, members of the
epidermal growth factor (EGF) family have been suggested as
potential prognostic markers in BUC (10); at the same time, resistance of EGF
receptor is reversed by miR-200 in BUC (11). Therefore, miR-200 serves an important
role in the prognostic risk of BUC and is an independent marker
associated with an increased risk of non-muscle-invasive bladder
cancer recurrence (12).
An improved understanding of microRNA-associated
risk factors may clarify the prognostic molecular mechanism of BUC.
In the present study, microRNA expression profile data and clinical
data were downloaded, survival curves were created to estimate risk
factors and target genes regulated by microRNA were analyzed. In
addition, regulation networks were constructed and functional
analysis of target genes was performed. Finally, a protein-protein
interaction (PPI) network of target genes regulated by microRNA was
analyzed and a sub-pathway analysis was performed.
Materials and methods
Data sources
Clinical case data and expression profile data of
microRNAs were downloaded from the Cancer Genome Atlas (TCGA;
cancergenome.nih.gov) database on the
BCGSC_IlluminaHiSeq_miRNASeq platform (Canada's Michael Smith
Genome Sciences Centre, Vancouver, BC, Canada). The TCGA microRNA
expression data were obtained from 529 patients with BUC (download
cut-off date, August 11, 2014). Reads per kilobase of exon per
million mapped reads (RPKM) was used to quantify the expression
value of patient microRNA (13) using
the following formula: RPKM = total microRNA reads/[total mapped
reads (million) × microRNA sequence length (kb)]. Additionally,
clinical case data comprised 411 patients with urothelial bladder
carcinoma (download cut-off date, August 11, 2014). A total of 408
cases that exhibited microRNA expression profile data were selected
for analysis.
Survival analysis
The mean expression value of each microRNA in the
408 cases was calculated as the critical value. All cases were
divided into two groups: MicroRNA expression greater than the
critical value, and microRNA expression equal to or less than the
critical value of microRNA expression. A Kaplan-Meier estimator
survival curve was created for microRNA in the two groups and a
log-rank test was applied to analyze the significance. MicroRNAs
exhibiting a significantly different survival curve were screened
as candidates for prognostic factors. P<0.05 was considered to
indicate a statistically significant difference.
Identification of risk-related
miRNAs
Cox's proportional hazards regression model was used
to estimate the risk factors for collected clinical data and
microRNA that demonstrated a significant effect on the survival
curves. KMsurv (14) and survival
(15) packages in R language were
applied for the plotting of survival curves and Cox's proportional
hazards regression model. Cox's proportional hazards regression
model was created according to the backward selection method;
variables were first introduced and subsequently the free variables
with no significant differences were eliminated [hazard ratio (HR),
0.99997; P=0.0449].
Analysis of key target genes regulated
by microRNA
MicroRNA target genes were predicted from relevant
databases, including two validation databases, miRNecords (16) and miRWalk (17). To be applicable for the present study,
the predicted regulatory association must have existed in at least
three of the following databases: miRanda (18), mirTarget2 (19), PicTar (20), PITA (21) and TargetScan (22). Genes that complied with the two
aforementioned requirements were screened. A regulatory network was
created and visualized using Cytoscape (23), based on the predicted target genes.
Cytoscape is an open source software platform for visualizing
complex networks and integrating these with any data type.
Functional analysis of target
genes
The Database for Annotation, Visualization and
Integrated Discovery, which provides analytical tools for
extracting biological relevance from collections of genes (24), was used for Gene Ontology (GO) and
Kyoto Encyclopedia of Genes and Genomes pathway enrichment analysis
of target genes in the microRNA-regulated network. P<0.05 was
used as the threshold criterion.
PPI network analysis of microRNA
target genes
The PPI network of target genes was constructed
using the Search Tool for Retrieval of Interacting Genes database,
which provided integrated knowledge of the known and predicted
associations for protein networks (25). PPI pairs with a combined score >0.4
were screened and visualized using Cytoscape.
Sub-pathway analysis of target
genes
The K-clique method was used to divide metabolic
pathways into sub-pathways, based on structural information, and to
identify risk pathways using hypergeometric test (26). ISubpathway Miner limma (27) in R was applied for investigation of
the processes of K-clique recognized risk sub-pathways.
Sub-pathways with P<0.05 were considered to be risk
sub-pathways. The associations between pathways and disease with
target gene involvement were investigated.
Results
Survival analysis
A total of 16 survival curves that significantly
affected microRNA were obtained. Among them, the survival curves,
including those for hsa-miR-3622a, hsa-miR-1292 and hsa-miR-3138
with significantly longer survival times and has-miR-29a with
shorter survival time, were obtained on the condition that
expression of microRNA was higher than the mean critical value.
Another 12 survival curves exhibited significant longer survival
time on the condition that the expression of microRNA was lower
than mean value.
Cox's proportional regression
analysis
Prognostic hazard ratios of microRNA were obtained
using Cox's proportional regression analysis of the aforementioned
16 microRNA expression values. hsa-miR-29a was identified as a risk
microRNA associated with the prognosis of UBC.
Risk-related microRNA regulation
network
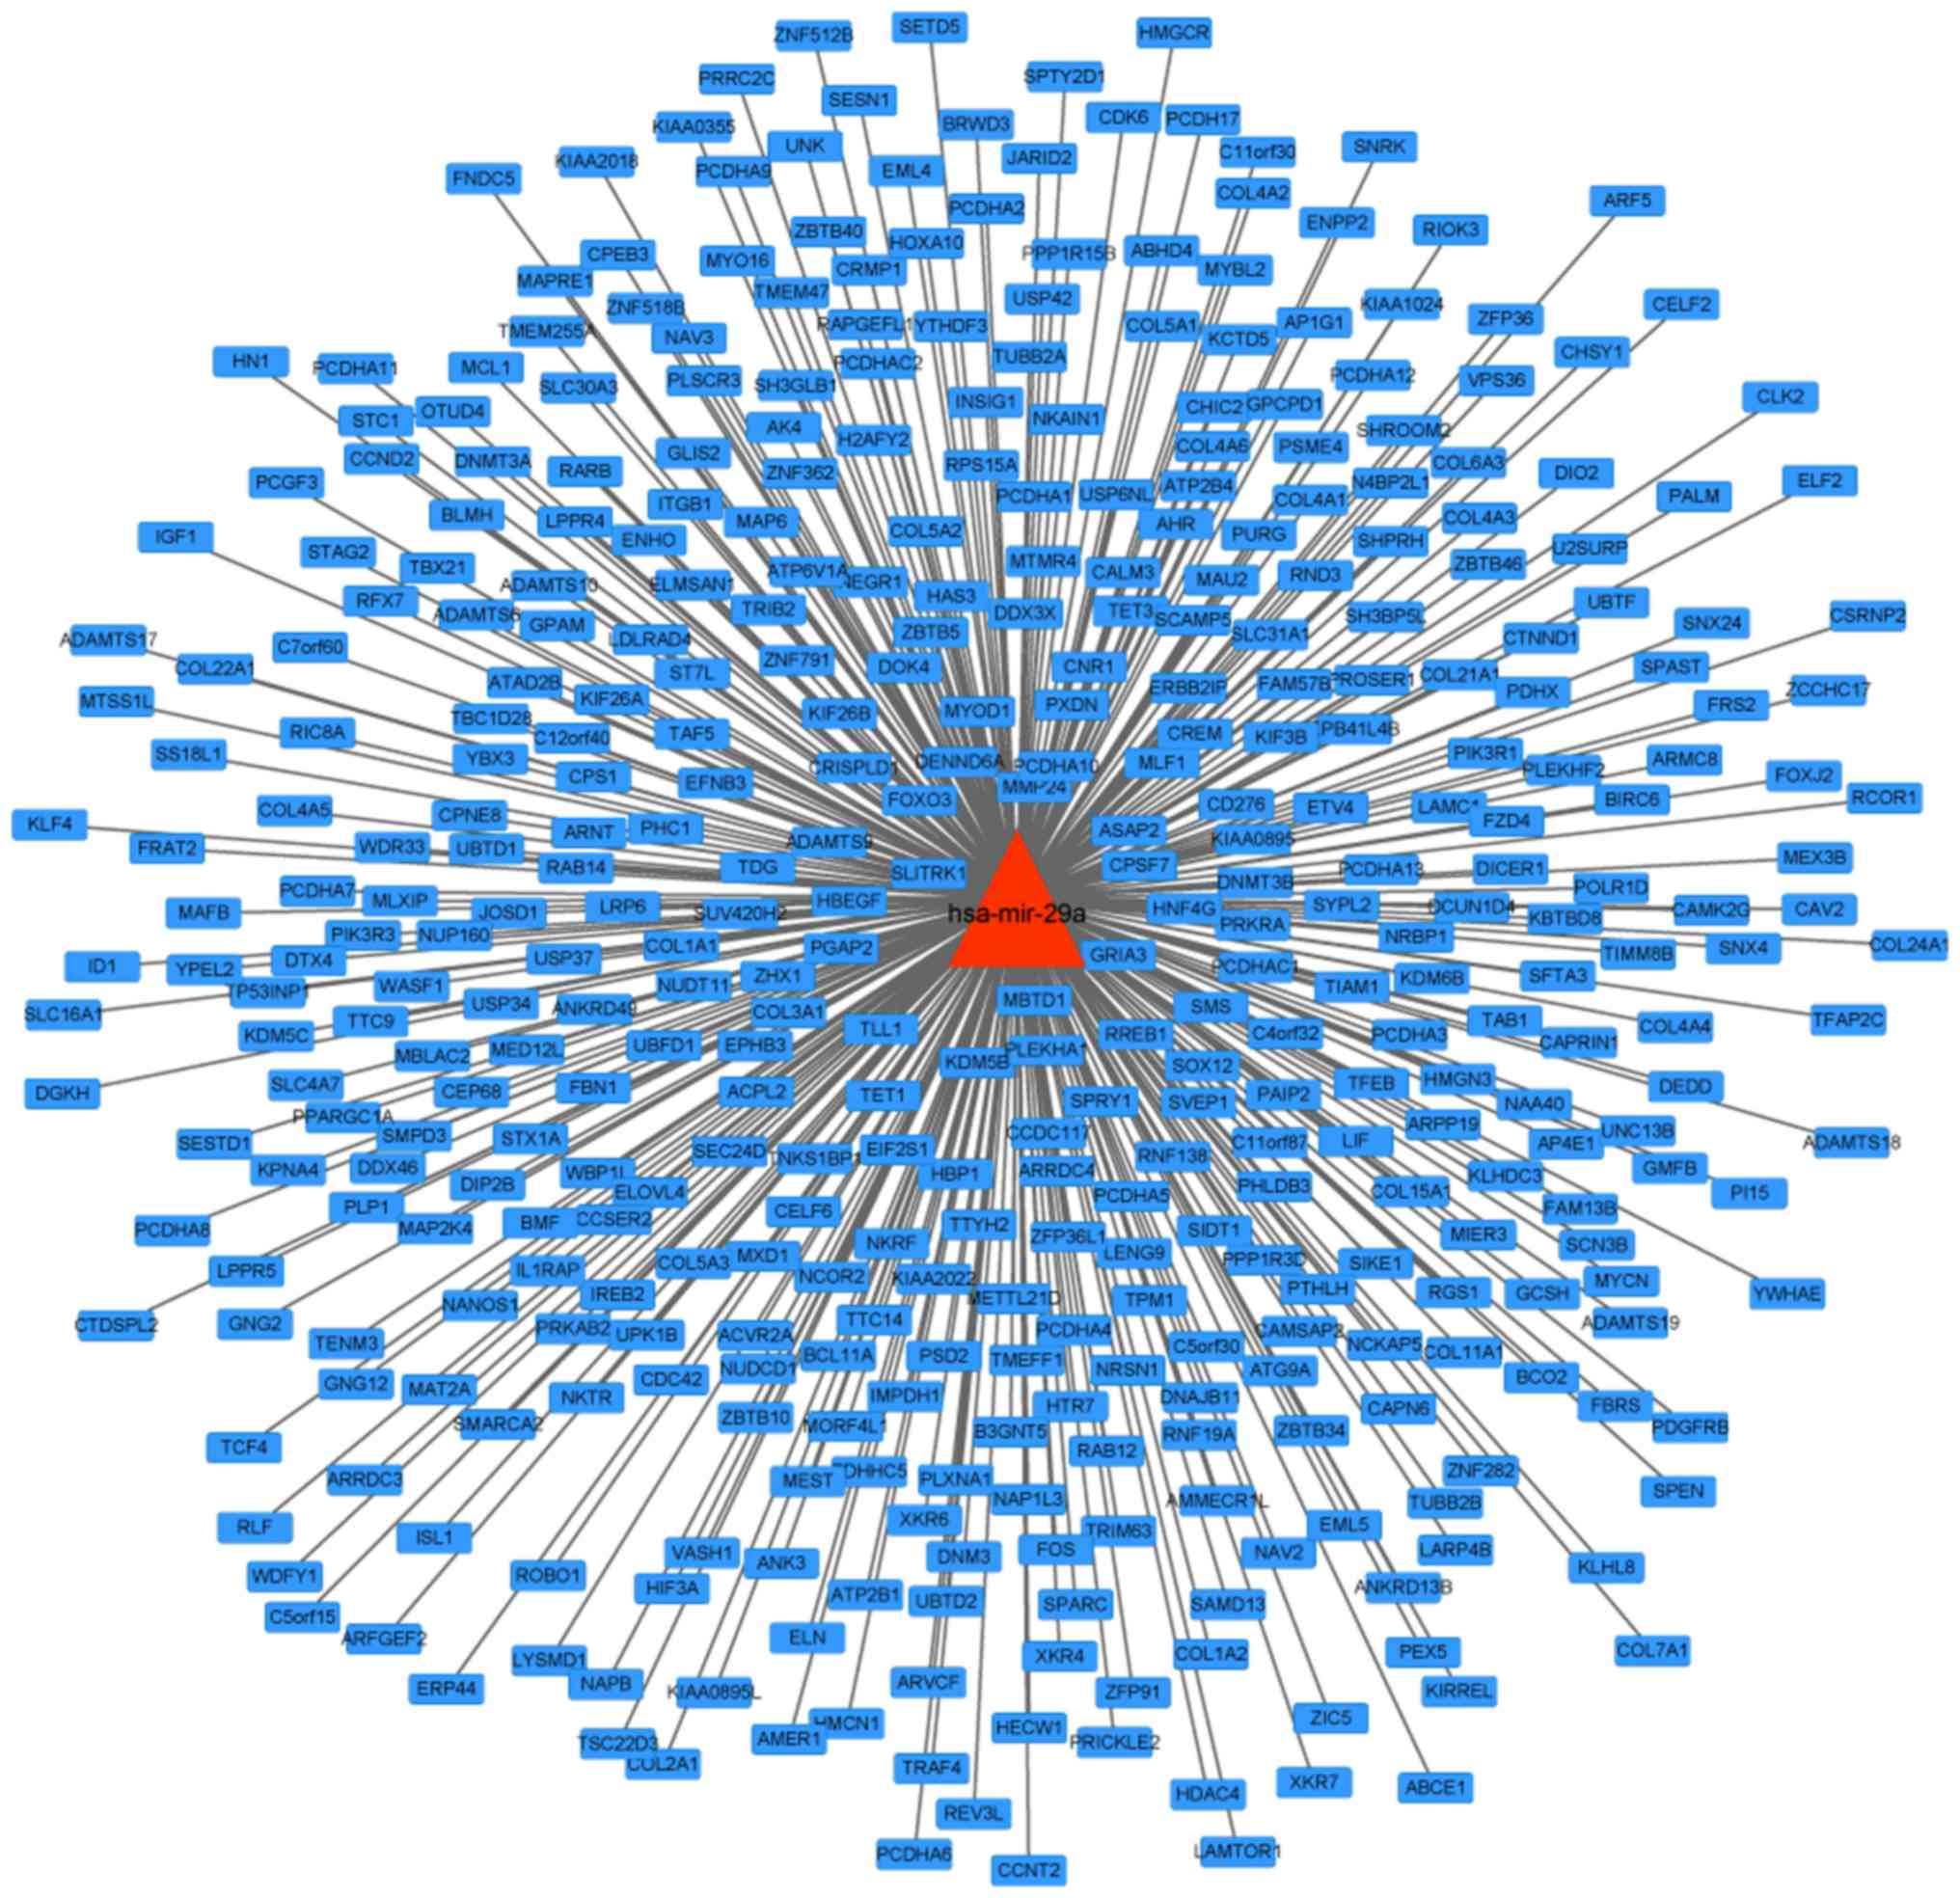
A regulation network of hsa-miR-29a was constructed
by collecting and arranging database data of microRNA regulated
target genes; a total 417 target genes were contained in the
network (Fig. 1).
Functional enrichment analysis of
target genes
Based on the results of enrichment analysis, the
target genes of hsa-miR-29a were primarily enriched in GO terms,
including collagen fibril organization (P=2.64×10⁻⁶),
extracellular matrix (ECM) organization (P=2.02×10⁻⁵),
homophilic cell adhesion (P=3.66×10⁻⁵) and extracellular
structure organization (P=7.45×10⁻⁵). These target genes
were also enriched in pathways that included focal adhesion
(P=5.06×10⁻¹⁰), ECM-receptor interaction
(P=1.16×10⁻⁹) and small cell lung cancer
(P=7.71×10⁻⁶), and pathways in cancer
(P=1.11×10⁻³) (Table
I).
 | Table I.Top 5 GO terms and pathways
enrichment of hsa-miR-29a target genes. |
Table I.
Top 5 GO terms and pathways
enrichment of hsa-miR-29a target genes.
| Category | Term | Count | P-value |
|---|
| GOTERM_BP_FAT | GO:0030199~collagen
fibril organization | 8 |
2.64×10⁻⁶ |
| GOTERM_BP_FAT | GO:0030198~ECM
organization | 12 |
2.02×10⁻⁵ |
| GOTERM_BP_FAT |
GO:0007156~homophilic cell adhesion | 13 |
3.66×10⁻⁵ |
| GOTERM_BP_FAT |
GO:0043062~extracellular structure
organization | 14 |
7.45×10⁻⁵ |
| GOTERM_BP_FAT |
GO:0022610~biological adhesion | 33 |
9.53×10⁻⁵ |
| GOTERM_CC_FAT |
GO:0005581~collagen | 18 |
4.91×10⁻²⁰ |
| GOTERM_CC_FAT | GO:0044420~ECM
part | 24 |
1.84×10⁻¹⁶ |
| GOTERM_CC_FAT |
GO:0005578~proteinaceous ECM | 34 |
2.30×10⁻¹⁴ |
| GOTERM_CC_FAT | GO:0031012~ECM | 35 |
3.42×10⁻¹⁴ |
| GOTERM_CC_FAT | GO:0005604~basement
membrane | 15 |
6.33×10⁻¹⁰ |
| GOTERM_MF_FAT | GO:0005201~ECM
structural constituent | 19 |
9.83×10⁻¹³ |
| GOTERM_MF_FAT | GO:0048407~PDGF
binding | 7 |
6.57×10⁻⁸ |
| GOTERM_MF_FAT |
GO:0005198~structural molecule
activity | 30 |
4.42×10⁻⁴ |
| GOTERM_MF_FAT | GO:0003677~DNA
binding | 76 |
1.83×10⁻³ |
| GOTERM_MF_FAT | GO:0019838~growth
factor binding | 9 |
3.22×10⁻³ |
| KEGG_PATHWAY | hsa04510: Focal
adhesion | 22 |
5.06×10⁻¹⁰ |
| KEGG_PATHWAY | hsa04512:
ECM-receptor interaction | 15 |
1.16×10⁻⁹ |
| KEGG_PATHWAY | hsa05222: Small
cell lung cancer | 11 |
7.71×10⁻⁶ |
| KEGG_PATHWAY | hsa05200: Pathways
in cancer | 17 |
1.11×10⁻³ |
| KEGG_PATHWAY | hsa05214:
Glioma | 7 |
1.85×10⁻³ |
|
REACTOME_PATHWAY | REACT_16888:
Signaling by PDGF | 14 |
2.20×10⁻¹⁰ |
|
REACTOME_PATHWAY | REACT_18266: Axon
guidance | 12 |
1.99×10⁻⁹ |
|
REACTOME_PATHWAY | REACT_13552:
Integrin cell surface interactions | 11 |
4.20×10⁻⁶ |
|
REACTOME_PATHWAY | REACT_604:
Hemostasis | 10 |
4.97×10⁻² |
PPI network analysis of target
genes
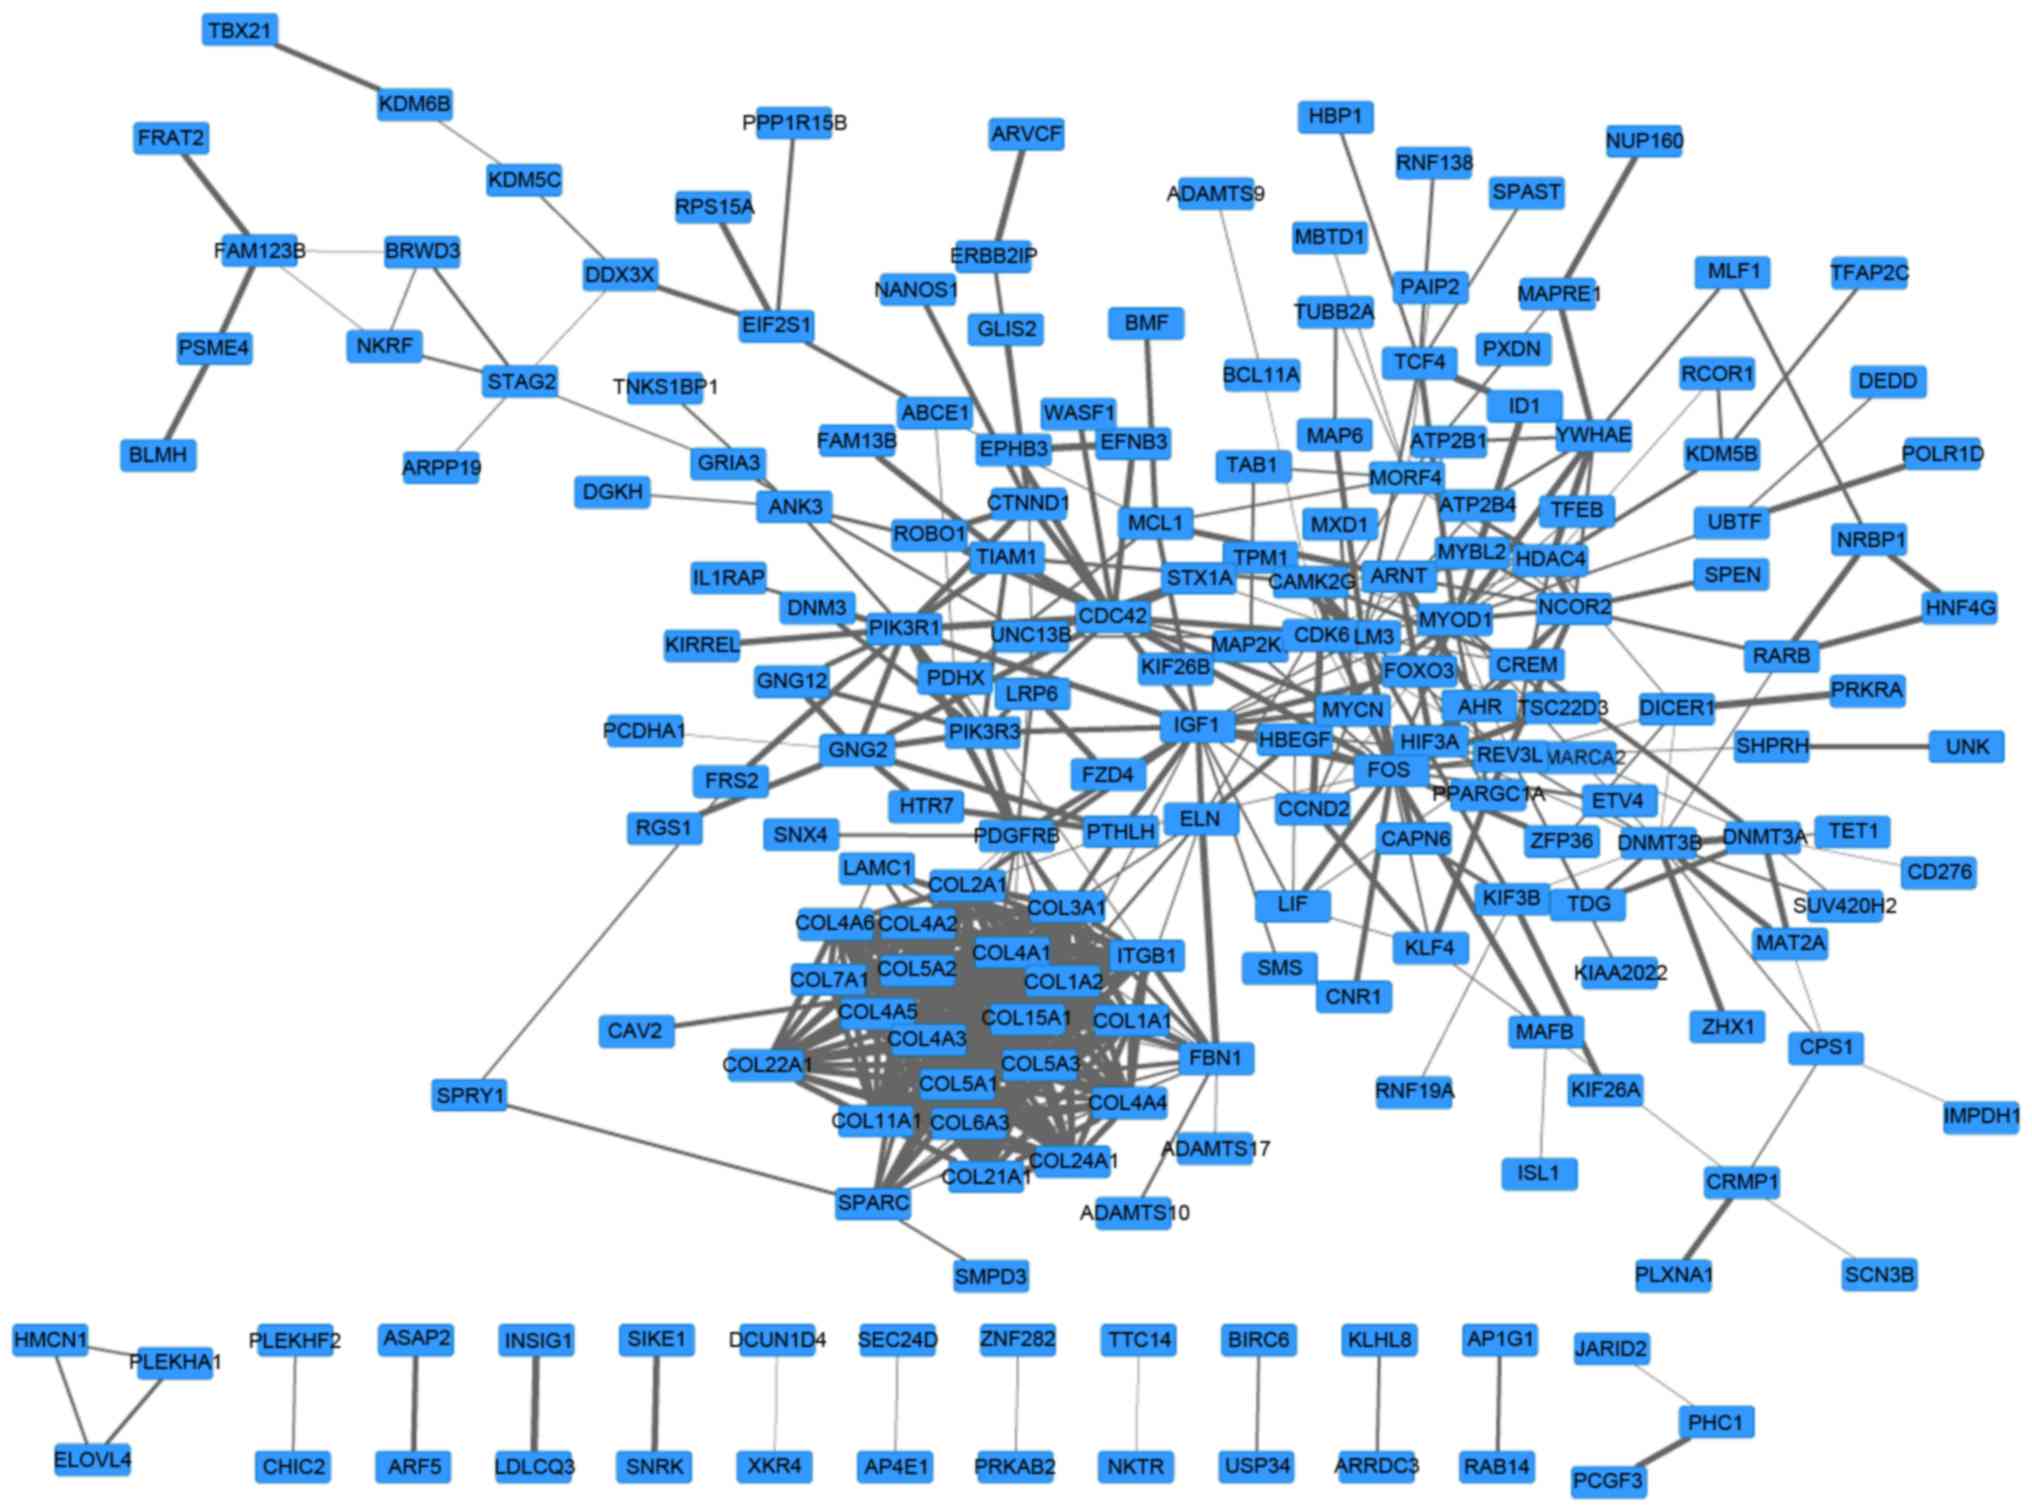
A PPI network with 197 genes and 510 edges was
constructed (Fig. 2). In this
network, collagen type 1 α chain 2 (COL1A2)2, COL1A1
and COL3A1 were the top three nodes, the degrees of which
were 25, 24 and 24, respectively. In addition, the top 5 pairs with
the greatest combined score were phosphatidylinositol 3-kinase
regulatory subunit 1-platelet-derived growth factor receptor β
(0.999), COL5A2-COL5A1 (0.992), L5A2-COL11A1 (0.999),
L5A1-COL5A3 (0.999) and COL4A6-COL4A5 (0.999). Values
in brackets are the combined score value.
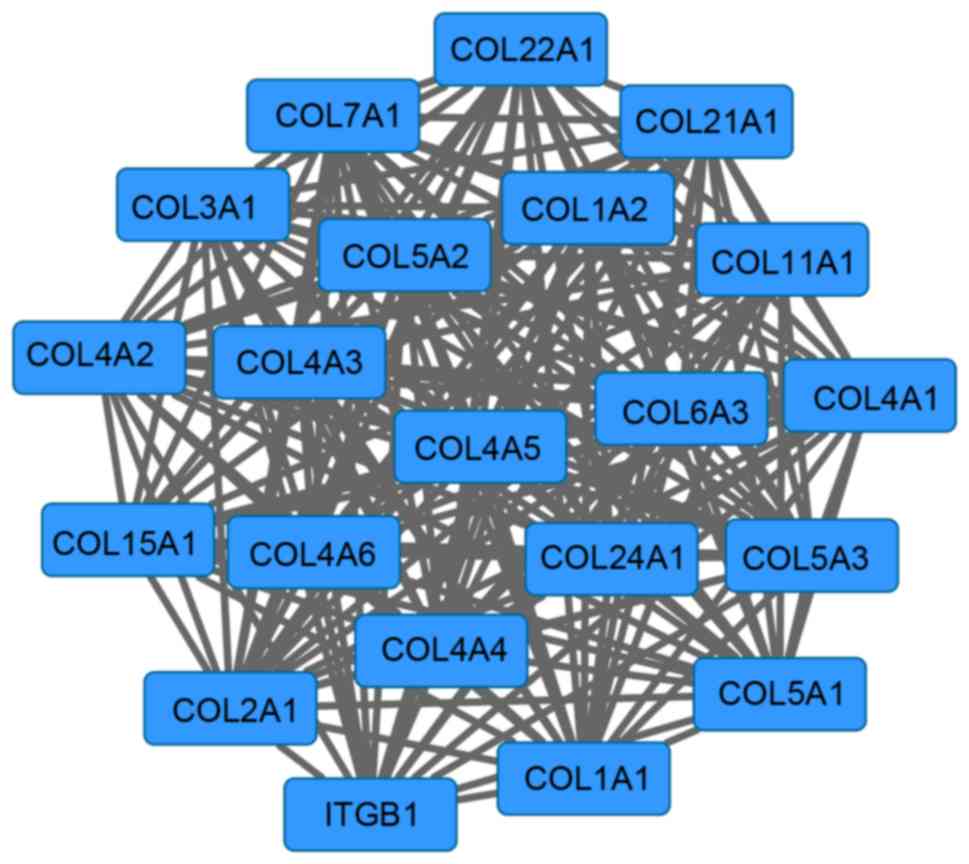
Furthermore, a network module with 21 genes was
screened from the PPI network (Fig.
3). The enrichment results of this module are presented in
Table II. The genes in this module
were primarily enriched in functions that included collagen fibril
organization (P=2.97×10⁻¹⁵), ECM organization
(P=3.01×10⁻¹⁵), cell adhesion (P=1.15×10⁻¹³)
and biological adhesion (P=1.17×10⁻¹³).
| Table II.Top 5 GO terms and pathway enrichment
of hsa-miR-29a target genes in network module 1. |
Table II.
Top 5 GO terms and pathway enrichment
of hsa-miR-29a target genes in network module 1.
| Category | Term | Count | P-value |
|---|
| GOTERM_BP_FAT | GO:0030199~collagen
fibril organization | 8 |
2.97×10⁻¹⁵ |
| GOTERM_BP_FAT | GO:0030198~ECM
organization | 10 |
3.01×10⁻¹⁵ |
| GOTERM_BP_FAT | GO:0007155~cell
adhesion | 14 |
1.15×10⁻¹³ |
| GOTERM_BP_FAT |
GO:0022610~biological adhesion | 14 |
1.17×10⁻¹³ |
| GOTERM_BP_FAT |
GO:0043062~extracellular structure
organization | 10 |
1.90×10⁻¹³ |
| GOTERM_CC_FAT |
GO:0005581~collagen | 18 |
2.85×10−43 |
| GOTERM_CC_FAT | GO:0044420~ECM
part | 18 |
7.38×10⁻³³ |
| GOTERM_CC_FAT |
GO:0005578~proteinaceous ECM | 20 |
4.29×10⁻³⁰ |
| GOTERM_CC_FAT | GO:0031012~ECM | 20 |
1.86×10⁻²⁹ |
| GOTERM_CC_FAT |
GO:0044421~extracellular region part | 20 |
6.82×10⁻²¹ |
| GOTERM_MF_FAT | GO:0005201~ECM
structural constituent | 16 |
8.63×10⁻³⁰ |
| GOTERM_MF_FAT |
GO:0005198~structural molecule
activity | 18 |
4.09×10⁻²⁰ |
| GOTERM_MF_FAT | GO:0048407~PDGF
binding | 6 |
2.32×10⁻¹² |
| GOTERM_MF_FAT | GO:0019838~growth
factor binding | 6 |
4.43×10⁻⁷ |
| GOTERM_MF_FAT | GO:0005178~integrin
binding | 4 |
9.62×10⁻⁵ |
| KEGG_PATHWAY | hsa04512:
ECM-receptor interaction | 14 |
2.60×10⁻²⁴ |
| KEGG_PATHWAY | hsa04510: Focal
adhesion | 14 |
3.93×10⁻¹⁹ |
| KEGG_PATHWAY | hsa05222: Small
cell lung cancer | 5 |
4.42×10⁻⁵ |
| KEGG_PATHWAY | hsa05200: Pathways
in cancer | 5 |
7.63×10⁻³ |
|
REACTOME_PATHWAY | REACT_18266: Axon
guidance | 12 |
2.01×10⁻²⁰ |
|
REACTOME_PATHWAY | REACT_16888:
Signaling by PDGF | 12 |
5.11×10⁻¹⁹ |
|
REACTOME_PATHWAY | REACT_13552:
Integrin cell surface interactions | 9 |
3.37×10⁻¹¹ |
Risk sub-pathway analysis
A total of 4 sub-pathways of cysteine and methionine
metabolism were obtained, including paths 00270_4
(P=4.11×10⁻⁴), 00270_1 (P=6.16×10⁻⁴), 00270_2
(P=5.40×10⁻³) and 00270_5 (P=6.26×10⁻³).
Paths 00270_4 and 00270_1 were enriched by DNA
(cytosine-5)-methyltransferase 3α (DNMT3A), DNMT3β
(DNMT3B), methionine adenosyltransferase 2α (MAT2Α)
and spermine synthase (SMS), whereas paths 00270_2 and
00270_5 were enriched by DNMT3A, DNMT3B and MAT2A (Table III).
| Table III.Analyzed results of risk
pathways. |
Table III.
Analyzed results of risk
pathways.
| Pathway ID | Pathway name | P-value | Gene |
|---|
| path:00270_4 | Cysteine and
methionine metabolism |
4.11×10⁻⁴ | DNMT3A, DNMT3B,
MAT2A, SMS |
| path:00270_1 | Cysteine and
methionine metabolism |
6.16×10⁻⁴ | DNMT3A, DNMT3B,
MAT2A, SMS |
| path:00270_2 | Cysteine and
methionine metabolism |
5.40×10⁻³ | DNMT3A, DNMT3B,
MAT2A |
| path:00270_5 | Cysteine and
methionine metabolism |
6.26×10⁻³ | DNMT3A, DNMT3B,
MAT2A |
Discussion
BUC is a malignancy of the genitourinary system that
is difficult to effectively treat due to high recurrence rates
(28). In the present study,
hsa-miR-29a was screened as a prognostic risk-related microRNA of
BUC. In addition, 21 genes in the network module were enriched in
GO terms, including collagen fibril organization and ECM
organization, and were enriched in pathways, including ECM-receptor
interaction and focal adhesion. Finally, 4 pathways, including
path00270_4, path00270_1, path00270_2 and path00270_5, were
obtained and enriched by 4 target genes, DNMT3A DNMT3B,
MAT2A and SMS.
hsa-miR-29a was the only microRNA that significantly
affected the prognosis of BUC. hsa-miR-29a is a microRNA member of
the miR-29 family, the dysregulation of which has been demonstrated
to affect DNMT3A expression in the HL1 cell line (29). Notably, in the DNMT3A mutation
samples, DNA methylation patterns were altered (30). In other types of cancer, including
lung cancer, the miR-29 family reversed biological processes of
aberrant DNA methylation and was associated with a poor prognosis
in cancer (31). In addition,
downregulated miR-29a may promote transforming growth factor β
induction and further promote the fibrotic response by interacting
with genes, including fibrillin, elastin and collagens (32). Similar to DNMT3A, DNMT3B also
exhibits complementarities with the miR-29 family at 3′-UTRs
(31). The synthesis of
S-adenosyl-(L)-methionine (adoMet), the primary methyl group donor
in humans, is the primary step in the process of methionine
metabolism (33). Through Adohcy, the
transfer of activated methyl groups is naturally catalyzed from
AdoMet to C5 atom by DNMT3A and DNMT3B (34). Consistent with previous studies,
results in the present study revealed that DNMT3A and
DNMT3B were regulated by miR-29a, and enriched in the
cysteine and methionine metabolism pathway, affecting the prognosis
of BUC.
Furthermore, miR-29a has also been demonstrated to
regulate MAT2A and SMS. MAT2A is a mammalian
gene that encodes MAT (35). AdoMet
is an intermediate metabolite that also functions as an
intracellular control switch, which regulates essential functions
(36). Furthermore, MAT2A
serves a role in the methionine cycle pathway, which is an
important metabolic pathway (37).
Although the molecular mechanisms of SMS associated with BUC
prognostic risk have not been reported, the results of the present
study suggest that they may serve important roles in BUC prognostic
risk through their involvement in the cysteine and methionine
metabolism pathway.
In addition to the aforementioned pathways, miR-29a
was also enriched in ECM organization and biological adhesion.
Ioachim et al (38)
demonstrated that thrombospondin type 1 serves an important role in
the prognosis of cancer, being enriched in ECM organization
pathways. β1-integrin has been demonstrated to downregulate
expression of miR-29a, whilst increased expression of β1-integrin
in BUC cells induces tissue invasion (39). Cell invasion is the primary factor
associated with poor prognosis (40).
Through these pathways, miR-29a may exhibit an important prognostic
risk.
Although several key genes and pathways associated
with BUC were identified using comprehensive bioinformatic methods,
no experiment was conducted to verify the results and this
therefore presents a clear limitation to the present study. Further
experimental studies of diverse samples are thus required to
validate the results of the present study.
In conclusion, the identified microRNAs,
particularly hsa-miR-29a, may serve important roles in the
prognostic risk mechanism of BUC through the regulation of 4 target
genes, including DNMT3A, DNMT3B, MAT2A and SMS, and
through involvement in cysteine and methionine metabolism pathways.
However, further study is required to support the potential
association between microRNAs, target genes and prognostic risk
factors.
Glossary
Abbreviations
Abbreviations:
|
BUC
|
bladder urothelial carcinoma
|
|
EGF
|
epidermal growth factor
|
|
GO
|
Gene Ontology
|
|
PPI
|
protein-protein interaction
|
References
|
1
|
Ploeg M, Aben KK and Kiemeney LA: The
present and future burden of urinary bladder cancer in the world.
World J Urol. 27:289–293. 2009. View Article : Google Scholar : PubMed/NCBI
|
|
2
|
Kauffman EC, Ng CK, Lee MM, Otto BJ, Wang
GJ and Scherr DS: Early oncological outcomes for bladder urothelial
carcinoma patients treated with robotic-assisted radical
cystectomy. BJU Int. 107:628–635. 2011. View Article : Google Scholar : PubMed/NCBI
|
|
3
|
Wright JL, Black PC, Brown GA, Porter MP,
Kamat AM, Dinney CP and Lin DW: Differences in survival among
patients with sarcomatoid carcinoma, carcinosarcoma and urothelial
carcinoma of the bladder. J Urol. 178:2302–2307. 2007. View Article : Google Scholar : PubMed/NCBI
|
|
4
|
Bartel DP: MicroRNAs: Genomics,
biogenesis, mechanism, and function. Cell. 116:281–297. 2004.
View Article : Google Scholar : PubMed/NCBI
|
|
5
|
Shi Z, Wei Q, Zhang M and She J: MicroRNAs
in bladder cancer: Expression profiles, biological functions,
regulation, and clinical implications. Crit Rev Eukaryot Gene Expr.
24:55–75. 2014. View Article : Google Scholar : PubMed/NCBI
|
|
6
|
Wszolek MF, Rieger-Christ KM, Kenney PA,
Gould JJ, Neto Silva B, Lavoie AK, Logvinenko T, Libertino JA and
Summerhayes IC: A MicroRNA expression profile defining the invasive
bladder tumor phenotype. Urol Oncol. 29:794–801.e1. 2011.
View Article : Google Scholar : PubMed/NCBI
|
|
7
|
Soini Y, Haapasaari KM, Vaarala MH,
Turpeenniemi-Hujanen T, Kärjä V and Karihtala P:
8-hydroxydeguanosine and nitrotyrosine are prognostic factors in
urinary bladder carcinoma. Int J Clin Exp Pathol. 4:267–275.
2011.PubMed/NCBI
|
|
8
|
Cai J, Fang L, Huang Y, Li R, Yuan J, Yang
Y, Zhu X, Chen B, Wu J and Li M: miR-205 targets PTEN and PHLPP2 to
augment AKT signaling and drive malignant phenotypes in non-small
cell lung cancer. Cancer Res. 73:5402–5415. 2013. View Article : Google Scholar : PubMed/NCBI
|
|
9
|
Cathomas R, Rothermundt C, Klingbiel D,
Bubendorf L, Jaggi R, Betticher DC, Brauchli P, Cotting D, Droege
C, Winterhalder R, et al: Efficacy of cetuximab in metastatic
castration-resistant prostate cancer might depend on EGFR and PTEN
expression: Results from a phase II trial (SAKK 08/07). Clin Cancer
Res. 18:6049–6057. 2012. View Article : Google Scholar : PubMed/NCBI
|
|
10
|
Thogersen VB, Sørensen BS, Poulsen SS,
Orntoft TF, Wolf H and Nexo E: A subclass of HER1 ligands are
prognostic markers for survival in bladder cancer patients. Cancer
Res. 61:6227–6233. 2001.PubMed/NCBI
|
|
11
|
Adam L, Zhong M, Choi W, Qi W, Nicoloso M,
Arora A, Calin G, Wang H, Siefker-Radtke A, McConkey D, et al:
miR-200 expression regulates epithelial-to-mesenchymal transition
in bladder cancer cells and reverses resistance to epidermal growth
factor receptor therapy. Clin Cancer Res. 15:5060–5072. 2009.
View Article : Google Scholar : PubMed/NCBI
|
|
12
|
Yun SJ, Jeong P, Kim WT, Kim TH, Lee YS,
Song PH, Choi YH, Kim IY, Moon SK and Kim WJ: Cell-free microRNAs
in urine as diagnostic and prognostic biomarkers of bladder cancer.
Int J Oncol. 41:1871–1878. 2012. View Article : Google Scholar : PubMed/NCBI
|
|
13
|
Trapnell C, Pachter L and Salzberg SL:
TopHat: Discovering splice junctions with RNA-Seq. Bioinformatics.
25:1105–1111. 2009. View Article : Google Scholar : PubMed/NCBI
|
|
14
|
Diez D: Survival analysis in R.
2012.https://folk.ntnu.no/bo/TMA4275/Download/R.tutorialDiez.pdfAugust
11–2014
|
|
15
|
Therneau TM and Grambsch PM: Modeling
survival data: Extending the Cox model. Springer-Verlag; New York,
NY: 2000
|
|
16
|
Xiao F, Zuo Z, Cai G, Kang S, Gao X and Li
T: miRecords: An integrated resource for microRNA-target
interactions. Nucleic Acids Res. 37:D105–D110. 2009. View Article : Google Scholar : PubMed/NCBI
|
|
17
|
Dweep H, Sticht C, Pandey P and Gretz N:
miRWalk-database: Prediction of possible miRNA binding sites by
‘walking’ the genes of three genomes. J Biomed Inform. 44:839–847.
2011. View Article : Google Scholar : PubMed/NCBI
|
|
18
|
Enright AJ, John B, Gaul U, Tuschl T,
Sander C and Marks DS: MicroRNA targets in Drosophila. Genome Biol.
5:R12003. View Article : Google Scholar : PubMed/NCBI
|
|
19
|
Wang X and El Naqa IM: Prediction of both
conserved and nonconserved microRNA targets in animals.
Bioinformatics. 24:325–332. 2008. View Article : Google Scholar : PubMed/NCBI
|
|
20
|
Krek A, Grün D, Poy MN, Wolf R, Rosenberg
L, Epstein EJ, MacMenamin P, da Piedade I, Gunsalus KC, Stoffel M
and Rajewsky N: Combinatorial microRNA target predictions. Nat
Genet. 37:495–500. 2005. View
Article : Google Scholar : PubMed/NCBI
|
|
21
|
Kertesz M, Iovino N, Unnerstall U, Gaul U
and Segal E: The role of site accessibility in microRNA target
recognition. Nat Genet. 39:1278–1284. 2007. View Article : Google Scholar : PubMed/NCBI
|
|
22
|
Lewis BP, Shih IH, Jones-Rhoades MW,
Bartel DP and Burge CB: Prediction of mammalian microRNA targets.
Cell. 115:787–798. 2003. View Article : Google Scholar : PubMed/NCBI
|
|
23
|
Shannon P, Markiel A, Ozier O, Baliga NS,
Wang JT, Ramage D, Amin N, Schwikowski B and Ideker T: Cytoscape: A
software environment for integrated models of biomolecular
interaction networks. Genome Res. 13:2498–2504. 2003. View Article : Google Scholar : PubMed/NCBI
|
|
24
|
Huang da W, Sherman BT and Lempicki RA:
Systematic and integrative analysis of large gene lists using DAVID
bioinformatics resources. Nat Protoc. 4:44–57. 2009. View Article : Google Scholar : PubMed/NCBI
|
|
25
|
Franceschini A, Szklarczyk D, Frankild S,
Kuhn M, Simonovic M, Roth A, Lin J, Minguez P, Bork P, von Mering C
and Jensen LJ: STRING v9.1: Protein-protein interaction networks,
with increased coverage and integration. Nucleic Acids Res.
41:D808–D815. 2013. View Article : Google Scholar : PubMed/NCBI
|
|
26
|
Toivonen R, Onnela JP, Saramäki J, Hyvönen
J and Kaski K: A model for social networks. Physica A: Statistical
Mechanics and its. Applications. 371:851–860. 2006.
|
|
27
|
Li C and Li MC: Package
‘iSubpathwayMiner’. 2013.http://ftp.cs.pu.edu.tw/network/CRAN/web/packages/iSubpathwayMiner/iSubpathwayMiner.pdfAugust
11–2014
|
|
28
|
Schmidbauer J, Witjes F, Schmeller N,
Donat R, Susani M and Marberger M: Hexvix PCB301/01 Study Group:
Improved detection of urothelial carcinoma in situ with
hexaminolevulinate fluorescence cystoscopy. J Urol. 171:135–138.
2004. View Article : Google Scholar : PubMed/NCBI
|
|
29
|
Iorio MV and Croce CM: MicroRNA
dysregulation in cancer: Diagnostics, monitoring and therapeutics.
A comprehensive review. EMBO Mol Med. 4:143–159. 2012. View Article : Google Scholar : PubMed/NCBI
|
|
30
|
Yan XJ, Xu J, Gu ZH, Pan CM, Lu G, Shen Y,
Shi JY, Zhu YM, Tang L, Zhang XW, et al: Exome sequencing
identifies somatic mutations of DNA methyltransferase gene DNMT3A
in acute monocytic leukemia. Nat Genet. 43:309–315. 2011.
View Article : Google Scholar : PubMed/NCBI
|
|
31
|
Fabbri M, Garzon R, Cimmino A, Liu Z,
Zanesi N, Callegari E, Liu S, Alder H, Costinean S,
Fernandez-Cymering C, et al: MicroRNA-29 family reverts aberrant
methylation in lung cancer by targeting DNA methyltransferases 3A
and 3B. Proc Natl Acad Sci USA. 104:pp. 15805–15810. 2007,
View Article : Google Scholar : PubMed/NCBI
|
|
32
|
van Rooij E, Sutherland LB, Thatcher JE,
DiMaio JM, Naseem RH, Marshall WS, Hill JA and Olson EN:
Dysregulation of microRNAs after myocardial infarction reveals a
role of miR-29 in cardiac fibrosis. Proc Natl Acad Sci USA. 105:pp.
13027–13032. 2008, View Article : Google Scholar : PubMed/NCBI
|
|
33
|
Pradhan S, Bacolla A, Wells RD and Roberts
RJ: Recombinant human DNA (cytosine-5) methyltransferase. I.
Expression, purification, and comparison of de novo and maintenance
methylation. J Biol Chem. 274:33002–33010. 1999. View Article : Google Scholar : PubMed/NCBI
|
|
34
|
Gowher H and Jeltsch A: Enzymatic
properties of recombinant Dnmt3a DNA methyltransferase from mouse:
The enzyme modifies DNA in a non-processive manner and also
methylates non-CpG [correction of non-CpA] sites. J Mol Biol.
309:1201–1208. 2001. View Article : Google Scholar : PubMed/NCBI
|
|
35
|
Mato JM, Corrales FJ, Lu SC and Avila MA:
S-Adenosylmethionine: A control switch that regulates liver
function. FASEB J. 16:15–26. 2002. View Article : Google Scholar : PubMed/NCBI
|
|
36
|
Roje S: S-Adenosyl-L-methionine: Beyond
the universal methyl group donor. Phytochemistry. 67:1686–1698.
2006. View Article : Google Scholar : PubMed/NCBI
|
|
37
|
Main PA, Angley MT, Thomas P, O'Doherty CE
and Fenech M: Folate and methionine metabolism in autism: A
systematic review. Am J Clin Nutr. 91:1598–1620. 2010. View Article : Google Scholar : PubMed/NCBI
|
|
38
|
Ioachim E, Michael MC, Salmas M, Damala K,
Tsanou E, Michael MM, Malamou-Mitsi V and Stavropoulos NE:
Thrombospondin-1 expression in urothelial carcinoma: Prognostic
significance and association with p53 alterations, tumour
angiogenesis and extracellular matrix components. BMC Cancer.
6:1402006. View Article : Google Scholar : PubMed/NCBI
|
|
39
|
Chakraborty A, White SM and Lerner SP:
Granulocyte colony-stimulating factor receptor signals for
beta1-integrin expression and adhesion in bladder cancer. Urology.
63:177–183. 2004. View Article : Google Scholar : PubMed/NCBI
|
|
40
|
Lopez-Beltran A and Cheng L: Histologic
variants of urothelial carcinoma: Differential diagnosis and
clinical implications. Hum Pathol. 37:1371–1388. 2006. View Article : Google Scholar : PubMed/NCBI
|