Introduction
Human gallbladder cancer is the most common type of
malignant tumor in the biliary system worldwide (1). Since gallbladder cancer is insensitive
to radiotherapy and chemotherapy and the efficiency of radical
excision is between 20 and 40%, and the 5-year survival rate is 5%
(2). As a result, it is important to
identify novel therapeutic strategies.
Tumor initiating cells (TICs) have been hypothesized
to be the primary cause of tumorigenesis. This hypothesis posits
that tumors exhibit a structure composed of heterogeneous subsets
of cells at different stages of development, and that the
initiation of a tumor is triggered by a certain subset of cells
(3). As identified by Bonnet and Dick
(4), TICs serve stem cell functions,
and exhibit the potential for self-renewal, differentiation and
tumor formation in leukemia. Previous studies have validated the
TIC hypothesis in a number of types of solid tumor (5–8), and
cluster of differentiation (CD)133 has been identified as a surface
marker for TICs (9–11). However, it remains unknown whether
CD133+ TICs exist in human gallbladder cancer.
Effective isolation and purification of a certain
subset of tumor cells is the premise to study TICs. The approaches
for isolating TICs include cell sorting by surface markers,
isolation of cell colonies, isolation of side populations and
screening using aldehyde dehydrogenase (12). However, identifying TICs in human
gallbladder cancer remains in an exploratory stage, due to the lack
of stable methods for cell sorting and the identification of
biological characteristics. To perform cell sorting by surface
markers, the primary approach for isolating and purifying of TICs
include magnetic cell sorting (MACS) and fluorescence activated
cell sorting (13). Despite progress
in studying TICs in human gallbladder cancer, it remains unknown
whether TICs exist in human gallbladder cancer, and the biological
characteristics of TICs remain to be characterized (14,15). In
the preliminary investigations of the present study, the proportion
of the CD133+ subset was determined in a number of human
gallbladder cancer cell lines, and the results revealed that this
cell subset was relatively increased in GBC-SD cells (14). The aim of the present study was to
isolate the CD133+ subset from human gallbladder cancer
cells using immunomagnetic separation, and identify the efficiency
of cell sorting using quantitative and localization analysis.
Furthermore, the present study aimed to evaluate the capabilities
of the CD133+ subset by analyzing colony formation,
tumor formation in vivo, cell proliferation, resistance to
drugs, cell invasion, and the expression levels of stem
cell-associated markers. The results of the present study may
support the TIC hypothesis, and provide a theoretical basis for
chemoresistance and tumor invasion.
The interaction between stromal cell-derived factor
1α (SDF-1α) and its receptor, C-X-C chemokine receptor type 4
(CXCR4), is associated with intercellular signal transduction and
cell migration (16). A previous
study identified that the SDF-1α/CXCR4 axis served key functions in
the migration, invasion and metastasis of cells in breast,
prostate, lung and pancreatic cancer (17). The protein kinase B (Akt) signaling
pathway primarily participates in cell growth, cell
differentiation, tumor invasion and the expression of
cancer-associated genes (18).
Furthermore, a previous study demonstrated that the SDF-1α/CXCR4
axis may promote cell migration through the phosphoinositide
3-kinase (PI3K)/Akt signaling pathway (19). In addition, the present study aimed to
clarify whether the SDF-1α/CXCR4 and PI3K/Akt axes participated in
the metastasis and invasion of human gallbladder cancer cells, and
whether certain signaling pathways exist in TICs in human
gallbladder cancer.
Materials and methods
Animals
A total of 15 5-week old male nude mice (BCLB/c),
with a body weight between 20 and 30 g, were supplied by Shanghai
Laboratory Animal Center (certificate no. 2007000544043; Shanghai,
China). Mice were raised in a specific-pathogen-free feeding room
at a temperature of 22–25°C, 0.03% CO2. Mice were
exposed to a 12-h light/dark cycle, and food and water was
routinely provided. All experiments were performed with approval
from the Animal Care and Use Committee of Xinhua Hospital,
affiliated with the Medical College of Shanghai Jiao Tong
University (Shanghai, China).
Cell culture and cell sorting with
immunomagnetic beads
GBC-SD cells (Institute of Cell Biology, Chinese
Academy of Sciences, Shanghai, China) were cultured at 37°C in
Dulbecco's modified Eagle's medium (DMEM; Genom Biotech Pvt., Ltd.,
Bhandup, Mumbai) supplemented with 10% fetal bovine serum (HyClone;
GE Healthcare Life Sciences, Logan, UT, USA), 100 U/ml penicillin
and 100 U/ml streptomycin in an astrosphere containing 5%
CO2 and saturated humidity. Cells were passaged every
2–3 days. GBC-SD cells were selected, resuspended with 300 µl PBS
at a density of 1×10⁷ cells/ml and sorted using MiniMACS
(Miltenyi Biotec GmbH, Bergisch Gladbach, Germany) according to the
manufacturer's protocol. Following this, cells were resuspended
with serum free DMEM supplemented with 20 ng/ml human epidermal
growth factor (EGF) and 10 ng/ml human basic fibroblast growth
factor (bFGF) (each purchased from PeproTech, Inc., Rocky Hill, NJ,
USA), and divided into two groups (CD133+ and
CD133− groups). Flow cytometry was used to detect the
percentage of CD133+ cells in each group, as
subsequently described.
Flow cytometry
GBC-SD cells at the logarithmic growth phase
(density, 1×10⁵ cells/ml) were used to determine the
proportion of the CD133+ subset in each group using flow
cytometry. GBC-SD cells were digested with 0.2% ethylene diamine
tetraacetic acid-trypsin (Gibco; Thermo Fisher Scientific, Inc.,
Waltham, MA, USA), resuspended with 80 µl PBS and adjusted to the
density of 1×10⁷/ml. An aliquot of 20 µl FcR blocking
reagent (Miltenyi Biotec GmbH) was added at room temperature for 1
h. Subsequently, cells were incubated with 10 µl phycoerythrin
(PE-) conjugated anti-CD133 antibody (1:500 dilution; cat no.
130-080-801) or PE-conjugated immunoglobulin G (IgG) (negative
control; 1:500 dilution) (both from Miltenyi Biotec GmbH) at 4°C
for 10 min in a dark room. Following two washes with PBS, cells
were resuspended with 500 µl PBS and subjected to detection by flow
cytometry, as described previously (20,21), using
Flowlogic (v7; Miltenyi Biotec GmbH).
Immunofluorescence detection
GBC-SD cells at the logarithmic growth phase were
seeded in 24-well plates at a density of 1×10⁷
cells/well, fixed with 4% paraformaldehyde for 20 min at room
temperature, blocked with 200 µl 1% bovine serum albumin (Beyotime
Institute of Biotechnology, Haimen, China) for 30 min at room
temperature, and incubated with mouse anti-human CD133 monoclonal
antibody (dilution, 1:11; cat no. 130-050-801; Miltenyi Biotec
GmbH) at 4°C overnight. PBS was used as a negative control.
Subsequently, fluorescein isothiocyanate-labeled goat anti-mouse
secondary antibody (dilution, 1:200; cat no. 115-095-003; Jackson
ImmunoResearch Laboratories, Inc., West Grove, PA, USA) was added
at 4°C for 1 h. Cell nuclei were stained with DAPI at 4°C for 1 h.
Cells were subsequently observed (9 non-overlapping fields of view)
using a Nikon ECLIPSE Ti-S fluorescence microscope (Nikon
Corporation, Tokyo, Japan).
Semi-quantitative reverse
transcription polymerase chain reaction (RT-PCR)
Total RNA was extracted from CD133+ and
CD133− GBC-SD cells using TRIzol reagent (Takara Bio,
Inc., Otsu Japan), reverse transcribed into cDNA using
RevertAid™ First-Strand cDNA Synthesis kit (Sangon
Biotech Co., Ltd., Shanghai China) (42°C for 30 min, 99°C for 5 min
and 4°C for 5 min), and subjected to PCR using a QuantiTect SYBR
Green kit (Bimake, Houston, TX, USA) with the following reaction
conditions: 94°C for 3 min followed by 35 cycles of 94°C for 30
sec, between 50 and 57°C for 30 sec, 72°C for 30 sec, and 4°C for
10 min. The primers used were as follows: CXCR4 forward,
5′-ATCATCTTCTTAACTGGCATTGTG−3′ and reverse,
5′-GCTGTAGAGGTTGACTGTGTAG-3′; GAPDH forward,
5′-ACGGATTTGGTCGTATTGGGCG-3′ and reverse,
5′-CTCCTGGAAGATGGTGATGG-3′; ABCG2 forward,
5′-GCGACCTGCCAATTTCAAAT-3′ and reverse,
5′-AGCCAGTTGTAGGCTCATCCA−3′; CD44 forward,
5′-CAAGCAATAGGAATGATGTC-3′ and reverse, 5′-GGTCACTGGGATGAAGGT-3′;
EGFR forward, 5′-TAACAAGCTCACGCAGTTGG-3′ and reverse,
5′-GCCCTTCGCACTTCTTACAC-3′; Musashi-1 forward,
5′-TAATTCCTGTCCAGCAGTCTC-3′ and reverse,
5′-GAACCATCCCGTCCTGTATCAT-3′; Nanog forward,
5′-CAGCTGTGTGTACTCAATGATAGATTT-3′ and reverse,
5′-ACACCATTGCTATTCTTCGGCCAGTTG-3′; Sox2 forward,
5′-CAAGATGGCCCAGGAGAACC-3′ and reverse,
5′-GCTGCGAGTAGGACATGCTGTA-3′; Oct-4 forward,
5′-GGCGTTCTCTTTGGAAAGGTGTTC-3′ and reverse,
5′-CAAAGCTCCAGGTTCTCTTG-3′; and CD133 forward,
5′-TTACGGCACTCTTCACCT-3′ and reverse, 5′-TATTCCACAAGCAGCAAA−3′.
The length of the PCR product was 228 base pairs;
the annealing temperature for CXCR4 was 53°C and for GAPDH was
55°C. The FusionCapt Advance FX7 (Vilber Lourmat, Marne-la-Vallée,
France) was used for semi-quantitative analysis of the PCR product.
PCR products were separated by electrophoresis on gels containing
2% agarose and visualized using ethidium bromide. GAPDH (Cell
Signaling Technology, Inc., Danvers, MA, USA) was amplified as the
control. The mRNA expression level of CXCR4 was evaluated by
analyzing the ratio of gray value between CXCR4 and GAPDH, as
described previously (20,21).
Western blot analysis
Western blot analysis was performed as previously
described (16,17). GBC-SD cells (1×10⁵) were
digested using trypsin, treated with 100 µl lysis buffer (Beyotime
Institute of Biotechnology) on ice for 30 min and subjected to
centrifugation at 4°C (11,279 × g) for 5 min. Determination of
protein concentration was performed by BCA assay. Supernatant (60
µl) was combined with loading buffer (15 µl) and 30 µg protein per
lane was separated using 10% SDS-PAGE. Proteins were transferred
onto a polyvinylidene fluoride (PVDF) membrane with a transfer
apparatus (Bio-Rad Laboratories, Inc.). Subsequently, the PVDF
membrane was blocked with 5% non-fat milk powder diluted in TBST at
room temperature for 2 h and incubated with the following primary
monoclonal antibodies (all diluted to 1:200): Mouse anti-human
CD133 (cat no. 130-105-226; Miltenyi Biotec GmbH), rabbit
anti-human Snail (cat no. 3879s), rabbit anti-epithelial
(E-)cadherin (cat no. 3195s), mouse anti-human neural (N-)cadherin
(cat no. 13116s), rabbit anti-human Akt (cat no. 4685s), rabbit
anti-human phosphorylated (p-)Akt (cat no. 4060s), rabbit
anti-human extracellular signal-regulated kinase (Erk; cat no.
4695s), rabbit anti-human p-Erk (cat no. 4370s) (all from Cell
Signaling Technology, Inc.), or rabbit anti-human CXCR4 (cat no.
ab124824; Abcam, Cambridge, MA, USA) at 4°C overnight. PVDF
membrane was subsequently washed for 10 min with Tris-buffered
saline (TBS) and Tween-20 (TBST) 3 times. PVDF membrane was
incubated with horseradish peroxidase-labeled goat anti-rabbit or
anti-mouse IgG secondary antibodies (dilution, 1:2,000; cat nos.
111-225-144 and 115-685-205, respectively; Jackson ImmunoResearch
Laboratories, Inc.) at room temperature for 2 h. Subsequently, the
membranes were washed for 10 min with TBST twice and once with TBS
for 10 min, and developed using enhanced chemiluminescence
(Immobilon Western Chemiluminescent HRP substrate; EMD Millipore,
Billerica, MA, USA). Films were scanned using Universal Hood
II-S.N.76S/01406 (Bio-Rad Laboratories, Inc.). Semi-quantitative
analysis was performed using Quantity One software (version 4.62;
Bio-Rad Laboratories, Inc.). All experiments were done in
triplicate. Mean values were calculated.
Comparison of proliferation ability in
vitro
Target cells in the CD133+ or
CD133− group were resuspended in DMEM containing EGF (20
ng/ml) and bFGF 10 ng/ml), seeded in 96-well plates (density,
1×10⁴ cells/well) with a final volume of 100 µl, and
cultured at 37°C in an atmosphere containing 5% CO2.
After 24 h, the proliferative ability of cells in each group was
compared following the addition of 10 µl Cell Counting Kit-8
(CCK-8) reagent (Cayman Chemical Company, Ann Arbor, MI, USA) every
24 h for 7 days. Cells were allocated into 1 blank control group
and 6 experimental groups, for which the mean was taken. Absorbance
was determined at 450 nm using the Model 680 (Bio-Rad Laboratories,
Inc.), as previously described (21).
Drug sensitivity analysis
Target cells were resuspended in DMEM containing EGF
(20 ng/ml) and bFGF (10 ng/ml), seeded in 96-well plates (density,
1×10⁴ cells/well) with a final volume of 100 µl, and
cultured at 37°C in an atmosphere containing 5% CO2 for
24 h. Subsequently, 0.1 µg/ml fluorouracil (5-FU) or 0.1 µg/ml
gemcitabine was added. After 72 h, 10 µl CCK-8 reagent was added,
cells were incubated at 37°C for 2 h and absorbance at 450 nm was
determined. The mean values were calculated to compare the
proliferation rates. The blank control sample was identical but did
not contain cells. Inhibition efficiency was calculated as follows:
Absorbance (experimental group)/absorbance (blank group) (21).
Colony formation assay
Single cells were obtained from the
CD133+ or CD133− groups through limiting
dilution, and cells were seeded into 96-well plates and cultured
with 100 µl serum-free DMEM supplemented with EGF and bFGF for 24 h
at 37°C. Colony formation was observed under an inverted light
microscope at ×10 magnification. A total of 50 wells containing a
single cell were observed and colony formation efficiency was
calculated as follows: Number of wells with colonies/50, as
described previously (21).
Signal pathway inhibitors
Cells were incubated with SDF-1α (PeproTech, Inc.,
Rocky Hill, NJ, USA) or an equivalent volume of vehicle at 25, 50,
100 and 200 ng/ml for 2 h and in 37°C for western blotting and at
100 ng/ml for 2 h for all other experiments. To explore the
CXCR4/Akt/CD133 signaling pathway, cells were pre-incubated with 40
µmol/l of the CXCR4 inhibitor AMD3100 (Sigma-Aldrich; Merck KGaA,
Darmstadt, Germany) or PI3K inhibitor LY294002 (Cayman Chemical
Company) which inhibit the PI3K/Akt pathway, for 30 min at
37°C.
Tumor formation assay in nude
mice
Unsorted cells and cells from the CD133+
and CD133− subsets were seeded into the left armpit of
nude mice (density, 1×10⁵ cells/ml), and PBS was
injected into the opposite side as the negative control. A total of
5 mice were used in each group. Tumor formation efficiency was
calculated as the number of mice with tumor formation. Mice were
sacrificed 4 weeks later. Tumors were selected, subjected to
hematoxylin eosin staining and immunohistochemical staining for
histopathological examination under light magnification at ×20
magnification, as previously described (20,21).
Transwell invasion assay
Matrigel (BD Biosciences, Franklin Lakes, NJ, USA)
was diluted with serum free DMEM at a ratio of 1:1. The Transwell
plates were from Corning Incorporated (Corning, NY, USA) and the
upper chamber was coated with 50 µl diluted Matrigel and incubated
at 37°C in a cell incubator until the Matrigel solidified.
CD133+ and CD133− cells in the logarithmic
growth phase were resuspended with serum-free DMEM medium and 100
µl cells were seeded in the upper chamber (density,
1–5×10⁵ cells/well). DMEM medium supplemented with 20%
fetal bovine serum was added to the lower chamber of the Transwell
insert. Following 24 h of culture at 37°C, Matrigel and the cells
on the upper surface of the Transwell chamber were wiped off with a
cotton swab. Cells were fixed with 4% paraformaldehyde for 20 min
and stained with crystal violet at 4°C for 20 min. Subsequently, an
Nikon ECLIPSE Ti-S inverted confocal microscope (Nikon Corporation)
was used for observation at high magnification (×200) in 9
independent visual fields. The number of transmembrane cells was
counted, and the mean value was calculated as previously described
(22).
Statistical analysis
SPSS software (version 17.0; SPSS, Inc., Chicago,
IL, USA) was used for statistical analysis. All data were presented
as the mean ± standard deviation. One-way analysis of variance was
used for comparison between groups. P<0.05 was considered to
indicate a statistically significant difference.
Results
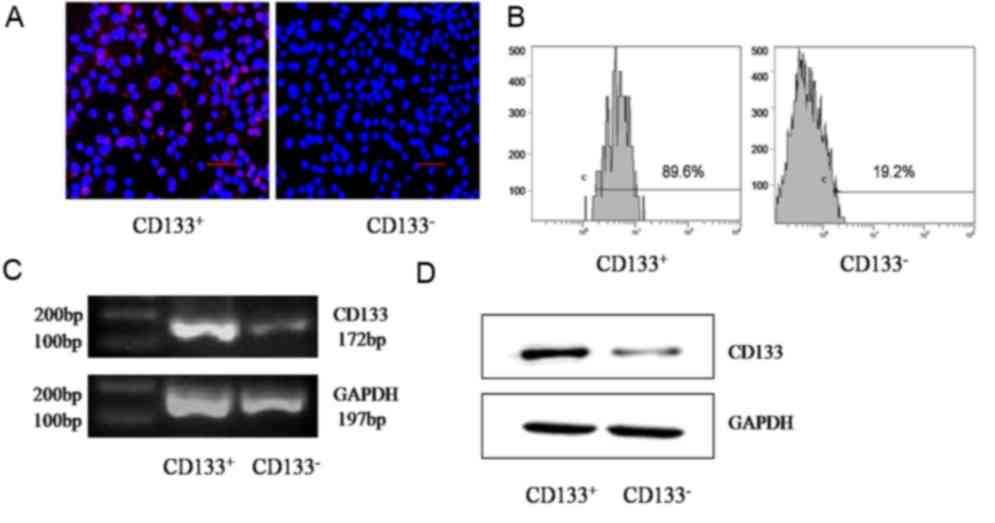
Purity of sorted cells
GBC-SD cells were divided into CD133+ or
CD133− groups using MACS with the CD133 marker. As
determined using immunofluorescence, CD133, located in the surface
of GBC-SD cells, was expressed at an increased level in the
CD133+ group compared with that in the CD133−
group (Fig. 1A). Flow cytometry
detection indicated that the proportion of the CD133+
subset in the CD133+ group was significantly increased
compared with that in the CD133− group (90.2±2 and
17.4±3%, respectively; P=0.001; Fig.
1B). Semi-quantitative RT-PCR determined that the relative gray
value of CD133 mRNA in the CD133+ group was
significantly increased compared with that in the CD133−
group (0.7734±0.0217 and 0.2146±0.0174, respectively; P=0.001;
Fig. 1C). Data from western blot
analysis indicated that the relative gray value of the CD133
protein in the CD133+ group was significantly increased
compared with that in the CD133− group (0.3689±0.0375
and 0.0345±0.0040, respectively; P=0.003; Fig. 1D).
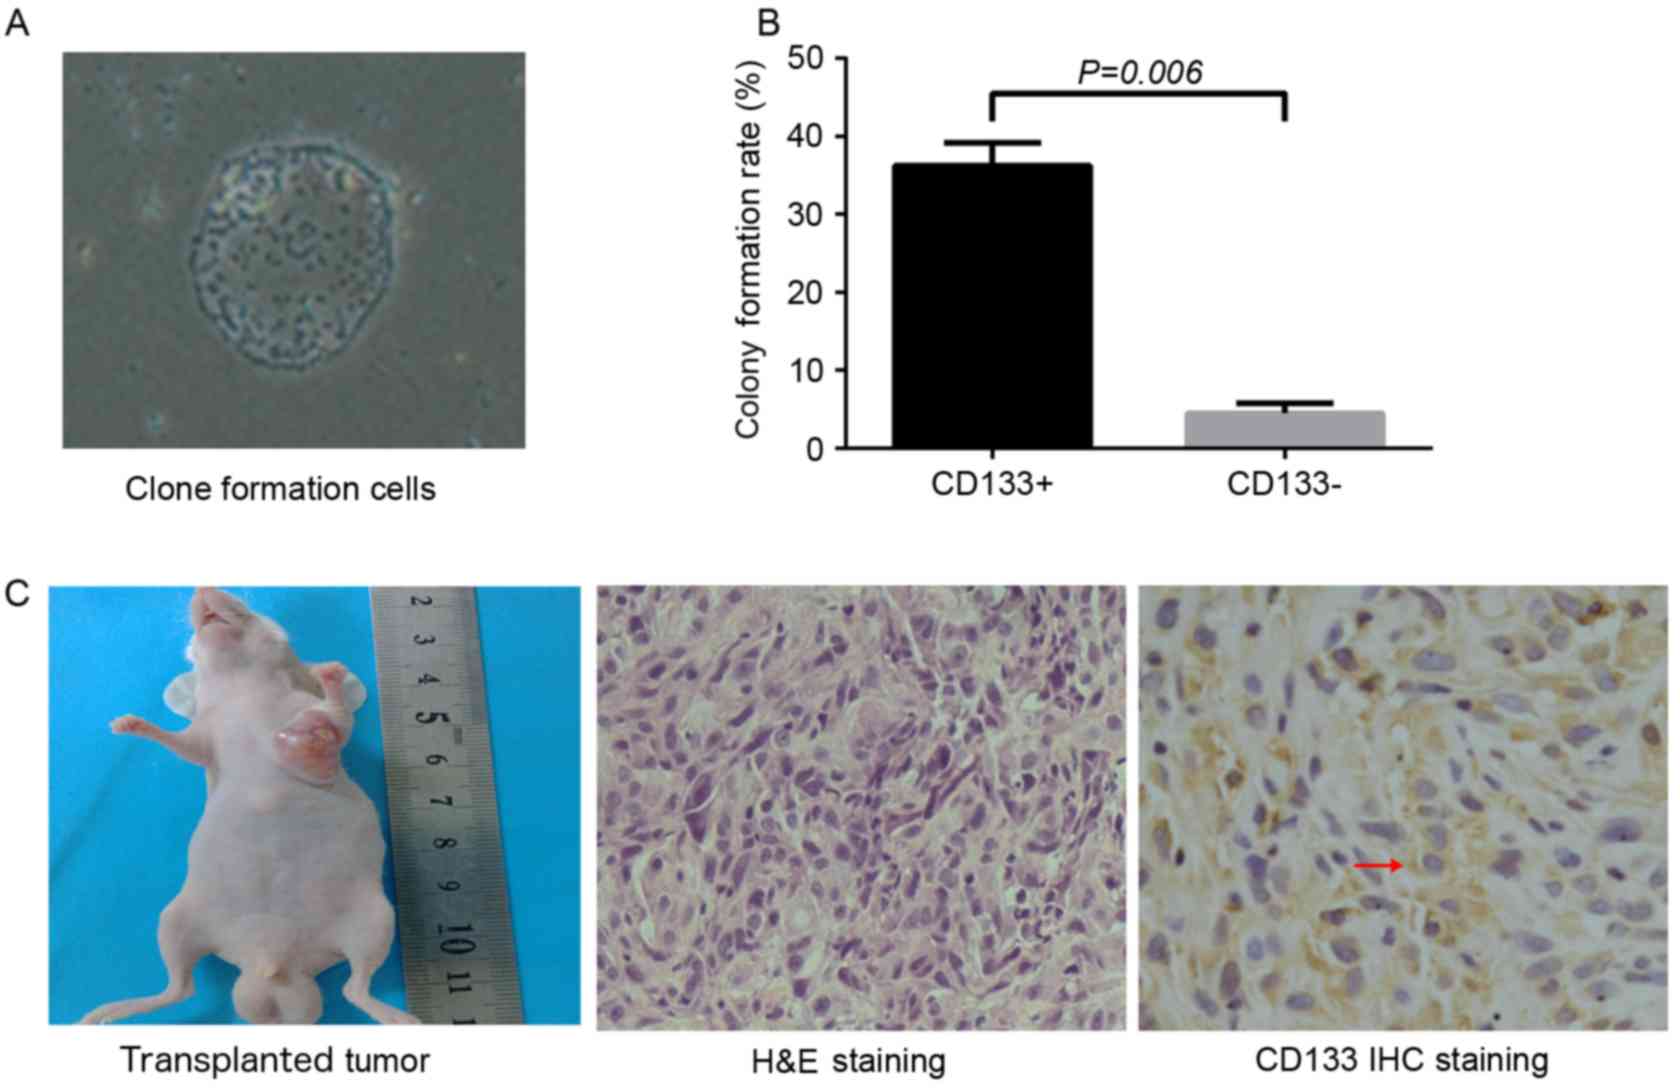
Colony formation and tumor formation
assay
CD133+ cells were subjected to limiting
dilution and seeded into 96-well plates with a single cell in each
well. After 5 days of culture, between 2 and 3 cells were observed
in each well. After 9 days, cell spheres were identified and, 20
days subsequently, sphere colonies with an oval or round shape were
observed. Colony formation efficiency in the CD133+
group was significantly increased compared with that that in the
CD133− group (36.25±2.99 and 4.5±1.29%, respectively;
P=0.006; Fig. 2A and B). Cells in
each group were seeded into the left armpit of nude mice at the
density of 1×10⁵ cells/ml. After 5 weeks, tumor
formation efficiency in the CD133+ group and unsorted
group was 100 and 60%, respectively, and no tumor was observed in
the CD133− group. The shape of the xenograft tumor was
oval or round, and the color of the section was pale. Under a light
microscope, the hematoxylin and eosin-stained section of the
xenograft tumor revealed atypia and invasive growth, and cells were
assembled into crypt-like structures. In addition, irregular
mitosis was observed. Cells were abnormally assembled in general.
As indicated by immunohistochemistry, granules representing the
expression of CD133 were localized in the cell membrane and
cytoplasm (Fig. 2C).
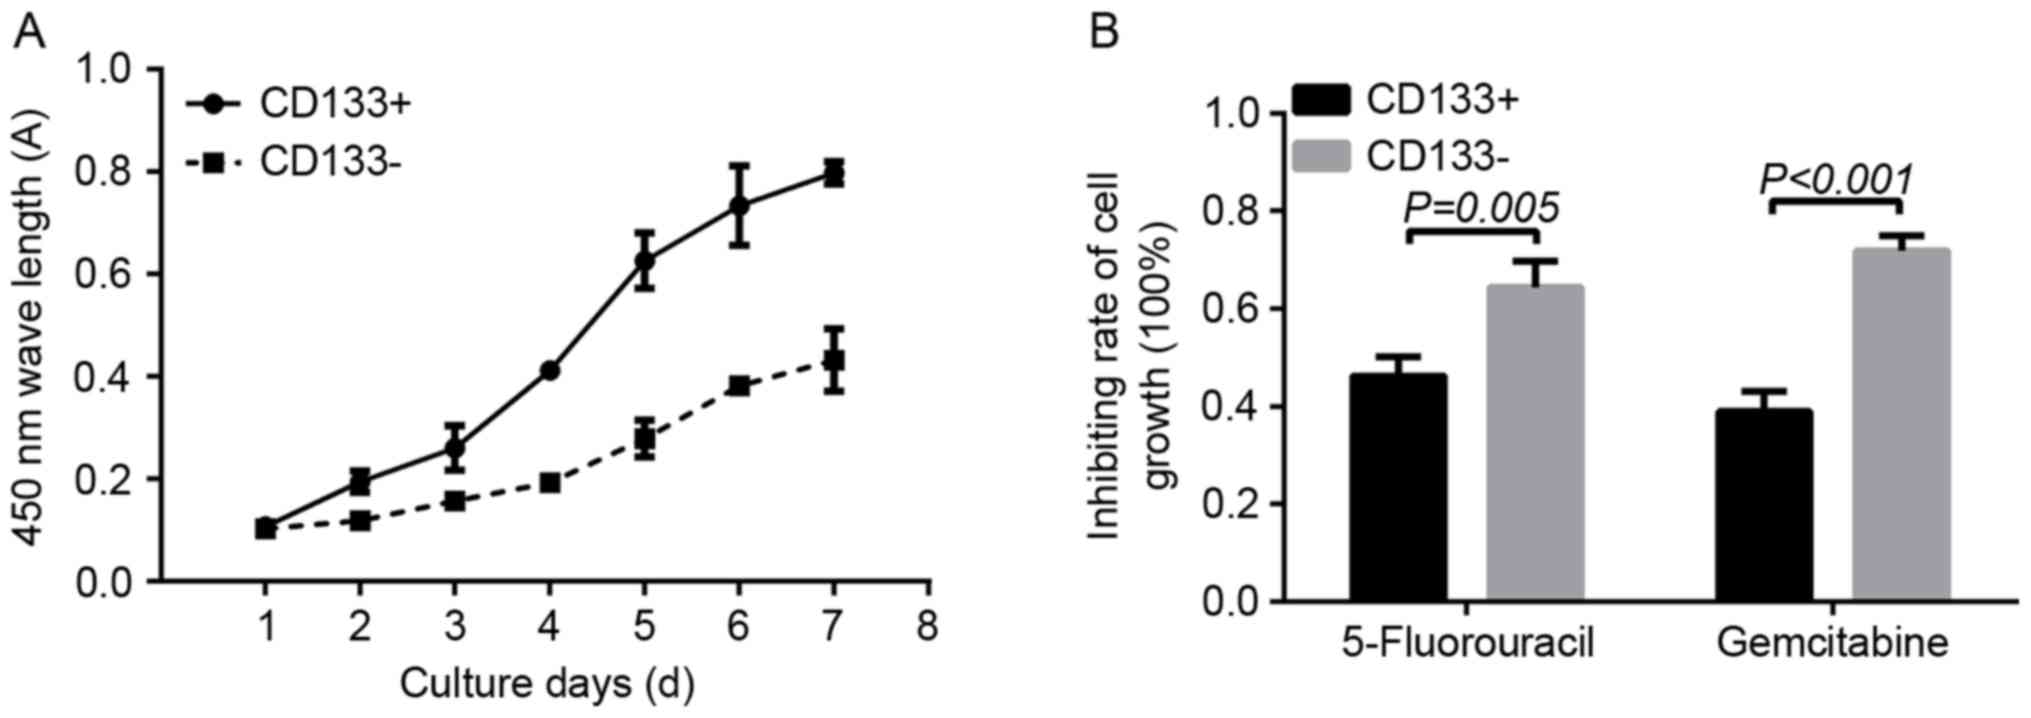
Cell proliferation and drug resistance
assay
Doubling time was used to determine the in
vitro proliferation ability of CD133+ and
CD133− cells. On day 1, the absorbance in the
CD133+ group revealed no significant difference when
compared with that in the CD133− group (0.1070±0.0075
and 0.1032±0.0022, respectively; P=0.22). Between days 2 and 7, the
absorbance of cells in the CD133+ group was
significantly increased compared with that in the CD133−
group (day 2, 0.1950±0.0214 vs. 0.1190±0.0109, P=0.0047; day 3,
0.2607±0.0435 vs. 01575.±0.0048, P=0.0110; day 4, 0.4122±0.0104 vs.
0.1932±0.0169, P=0.0001; day 5, 0.6265±0.0546 vs. 0.2790±0.0357,
P=0.0014; day 6, 0.7335±0.0776 vs. 0.3825±0.0160, P=0.0008; day 7,
0.7982±0.0217 vs. 0.4320±0.0606, P=0.0013, respectively; Fig. 3A). As determined using a CCK-8 assay,
following treatment with 0.1 µg/ml 5-FU, the inhibition rate of
cell proliferation in the CD133− group was significantly
increased compared with in the CD133+ group
(0.6435±0.0544 and 0.4620±0.0404, respectively; P=0.005). In
addition, treatment with 1 µg/ml gemcitabine resulted in a
significantly increased inhibition rate of cell growth in the
CD133− group compared with that in the CD133+
group (0.7185±0.0301 vs. 0.3895±0.0417, respectively; P<0.001;
Fig. 3B).
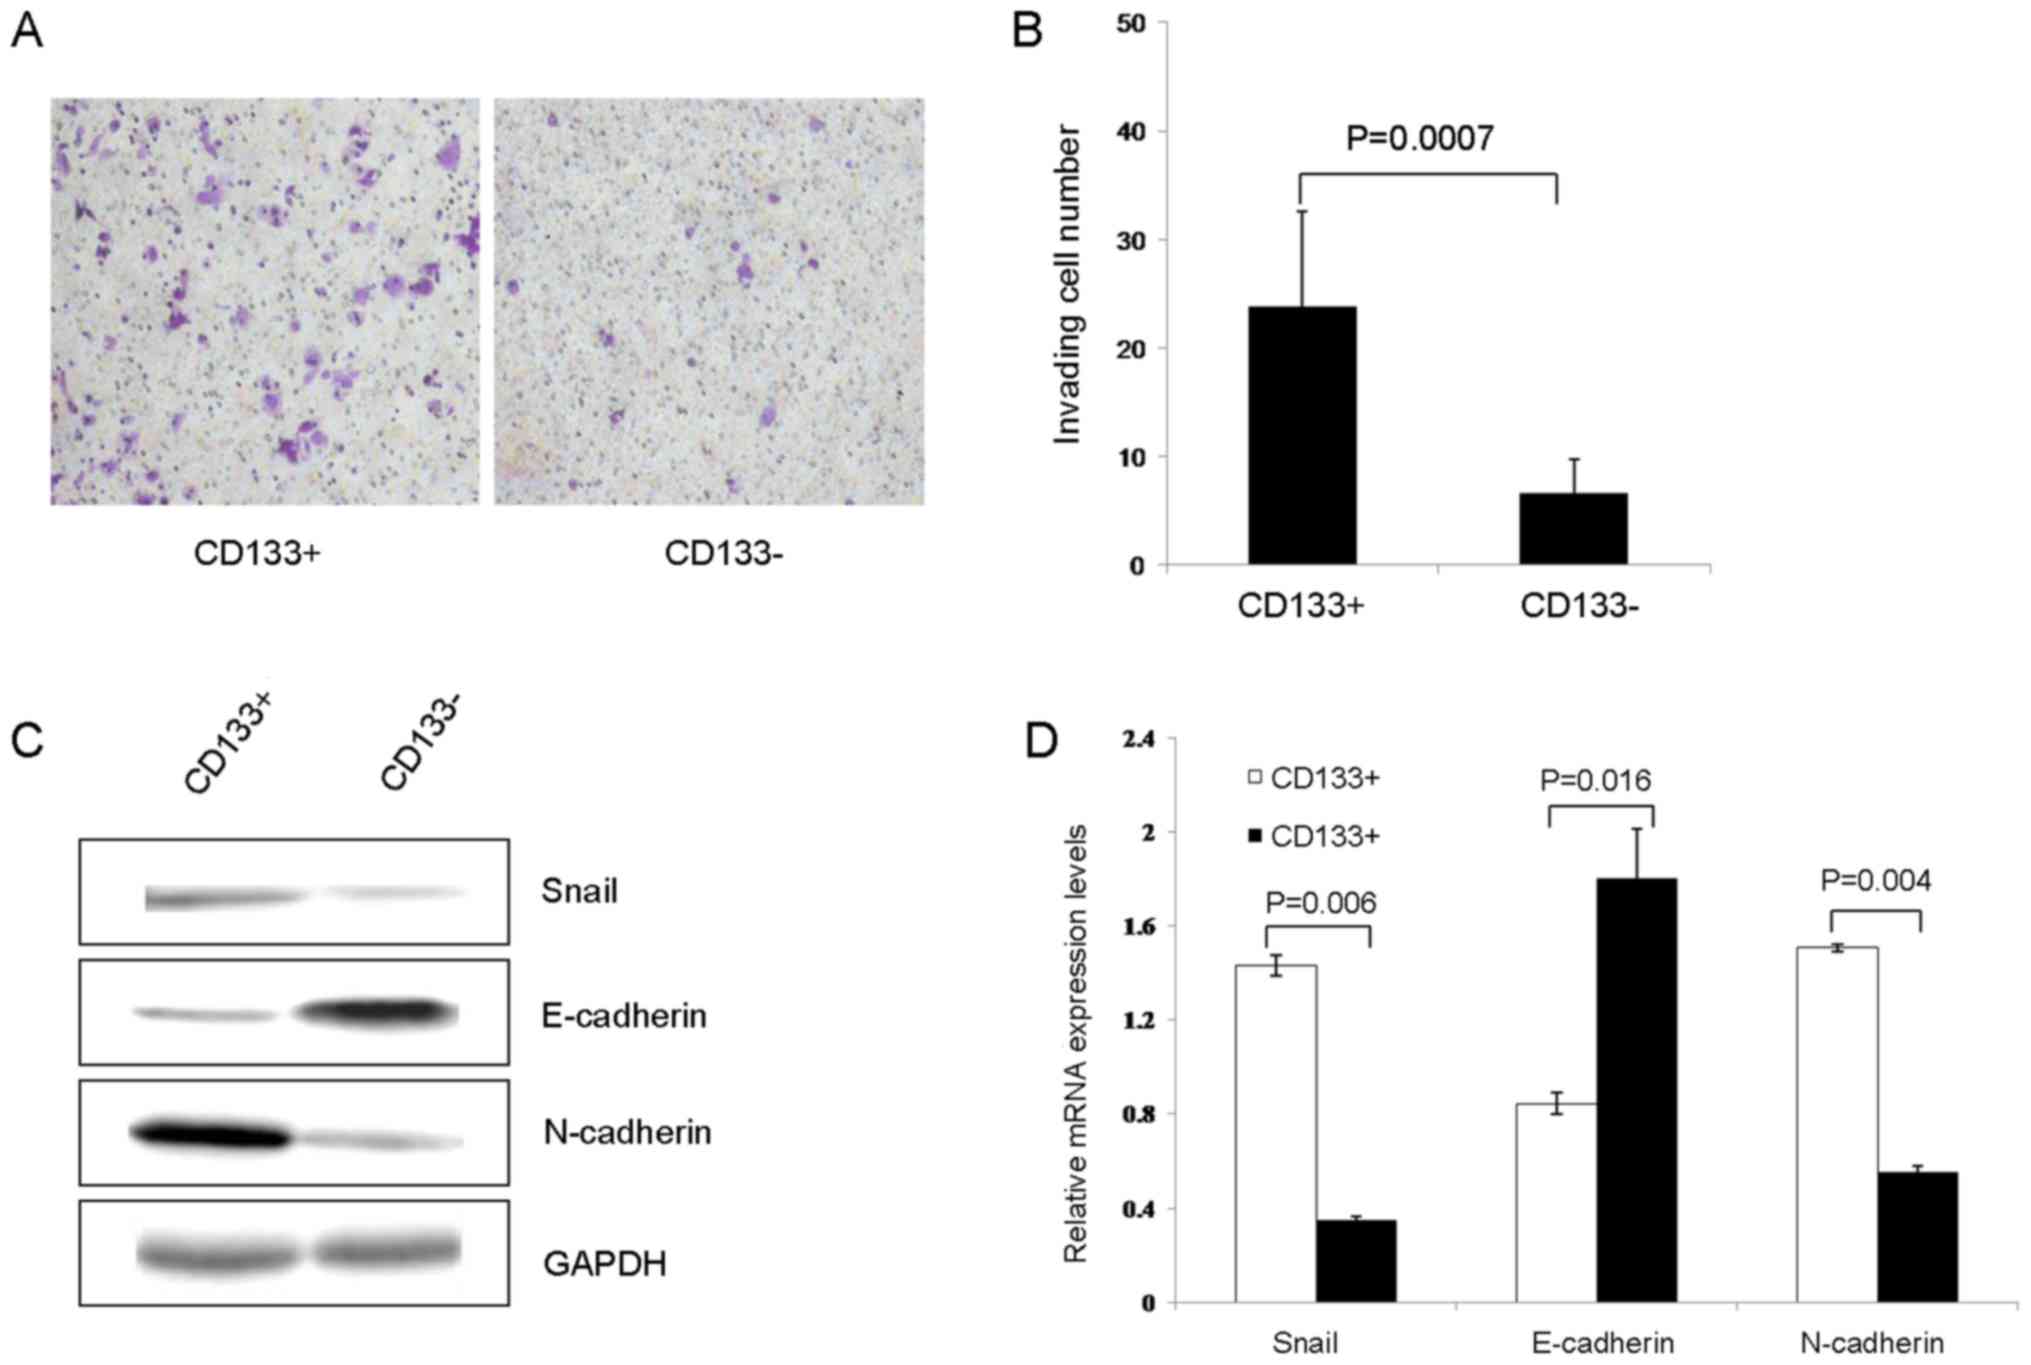
Cell invasion and
epithelial-mesenchymal transition (EMT)
As determined using the Transwell assay, the number
of transmembrane cells in the CD133+ group was
significantly increased compared with that in CD133−
group (23.78±8.74 vs. 6.56±3.09, respectively; P=0.0007; Fig. 4A and B). Subsequently, the expression
of EMT-associated proteins was conducted using western blot
analysis. The results of the present study revealed that the
expression of Snail and N-cadherin in the CD133+ group
were significantly increased, compared with those in the
CD133− group (1.4321±0.0448 vs. 0.3489±0.0162, P=0.006;
and 1.5061±0.1650 vs. 0.5539±0.0279; P=0.004, respectively). The
expression of E-cadherin in the CD133+ group was
significantly decreased compared with that in the CD133−
group (0.8455±0.0453 vs. 1.7998±0.2114, respectively; P=0.016;
Fig. 4C and D).
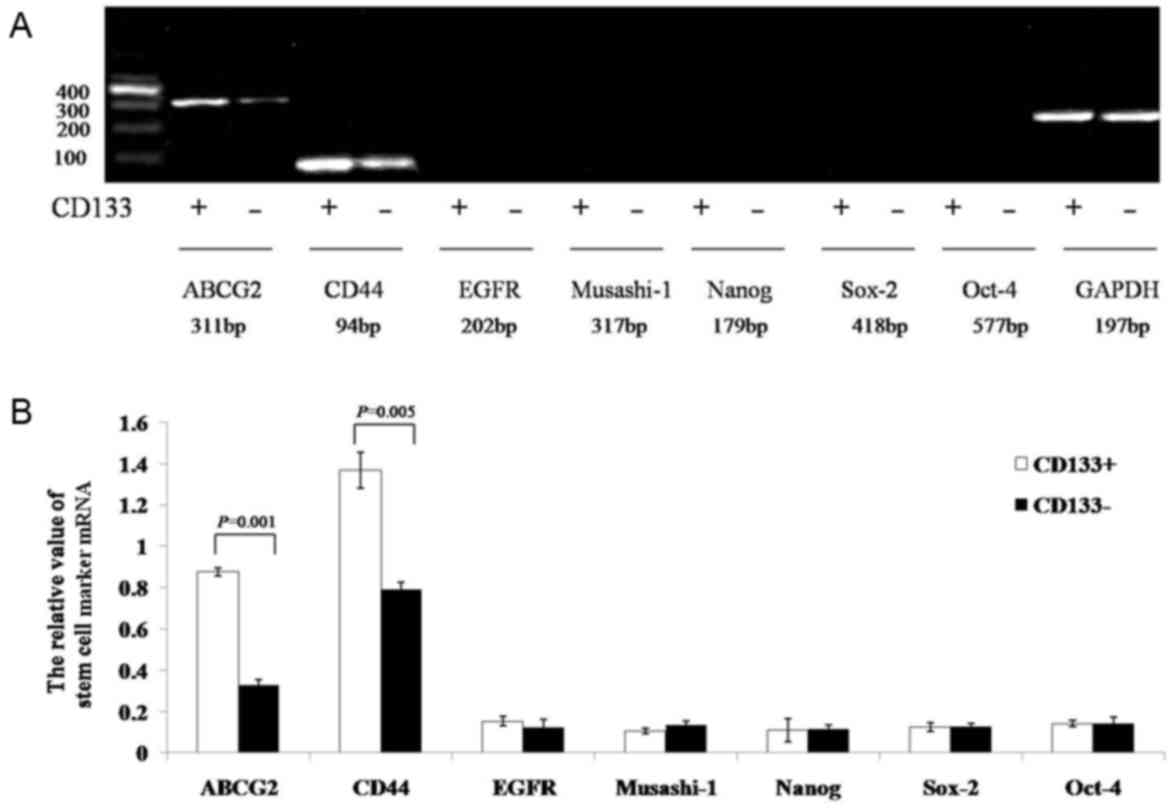
Expression of stem cell-associated
genes
The results of the semi-quantitative RT-PCR assay
indicated that the gray values of ATP-binding cassette sub-family G
member 2 (ABCG2) and CD44 mRNA in the CD133+ group were
significantly increased compared with those in the
CD133− group (0.8774±0.0191 vs. 0.3276±0.0272, P=0.001;
and 1.3681±0.0879 vs. 0.7891±0.0385, P=0.005, respectively). The
expression of EGF-receptor, Musashi-1, Nanog, sex determining
region Y-box 2, and octamer-binding transcription factor-4 mRNA did
not significantly differ between the two groups (CD133+
group, 0.1541±0.0221, 0.1057±0.0122, 0.1088±0.0562, 0.1266±0.0207
and 0.1424±0.0168, respectively; CD133− group,
0.1252±0.0384, 0.1334±0.0194, 0.1175±0.0188, 0.1275±0.0159, and
0.1411±0.0289, respectively; P=0.241, P=0.070, P=0.364, P=0.462,
and P=0.472, respectively; Fig. 5A and
B).
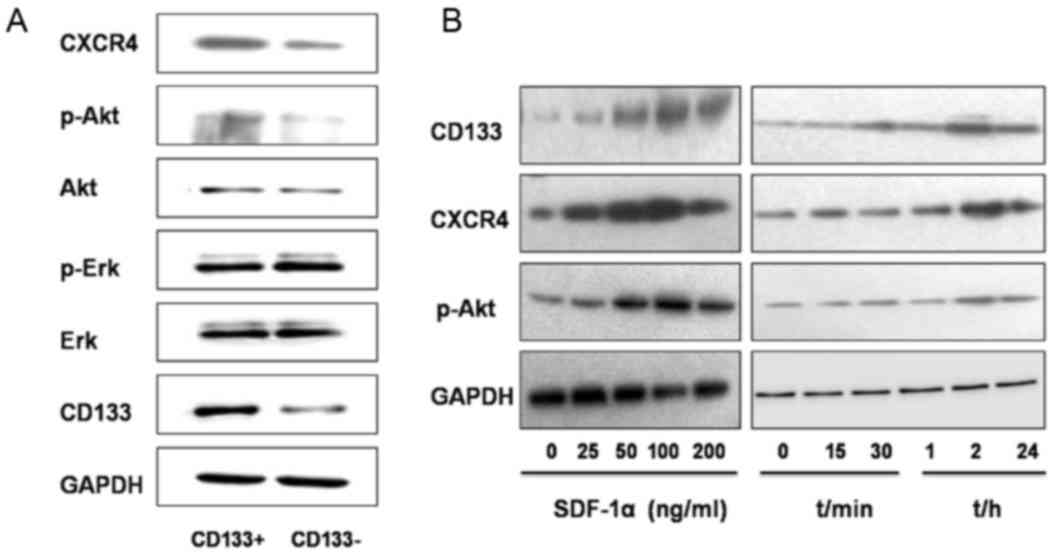
Regulation of the CXCR4/Akt/CD133
signaling pathway
As determined using western blot analysis, the
relative gray value referring to the expression level of proteins
CXCR4, p-AKT and CD133 were significantly increased in the
CD133+ group compared with those in the
CD133− group (0.5427±0.0135 vs. 0.2770±0.0378, P=0.001;
0.4207±0.0291 vs. 0.2187±0.0035, P=0.005; and 0.5349±0.069 vs.
0.2906±0.0259, P=0.003, respectively, Fig. 6A). The expression levels of Akt, p-Erk
and Erk revealed no statistically significant differences between
the two groups (CD133+ group, 0.4098±0.0105,
0.6614±0.0320 and 0.6914±0.040, respectively; CD133−
group, 0.3759±0.0323, 0.6608±0.0623 and 0.6627±0.0237,
respectively; P=0.104, P=0.493, and P=0.084, respectively; Fig. 6A).
SDF-1α, an activator of CXCR4, was then introduced
into the study. Treatment with SDF-1α for 2 h at different
concentrations (25, 50, 100 and 200 ng/ml) resulted in increased
protein expression levels of CD133, CXCR4 and p-Akt in GBC-SD cells
compared with those in the untreated group (Fig. 6B). When SDF-1α was used at a
concentration of 100 ng/ml, protein expression reached the peak
value and the level of expression decreased following treatment
with 200 ng/ml SDF-1α. Following treatment with SDF-1α (100 ng/ml),
the expression of CD133, CXCR4 and p-Akt in GBC-SD cells was
determined at different time points (15, 30 min, 1, 2 and 24 h).
Compared with those in the untreated group, the expression level of
these proteins increased 30 min following treatment, reached the
peak value 2 h following treatment, and began to decrease at 24 h
following treatment (Fig. 6B).
In order to identify the associations between CD133
and CXCR4, the activator and inhibitor of CXCR4 (SDF-1α and
AMD3100, respectively) and the inhibitors of PI3K/Akt and
mitogen-activated protein kinase/ERK signaling pathways were used
to treat the CD133+ and CD133− groups. In the
CD133+ group, SDF-1α treatment induced significantly
increased expression of CD133 and CXCR4 mRNA expression. Following
treatment, with AMD3100, LY294002, or combined treatment with
AMD3100 and SDF-1α, LY294002 and SDF-1α, the expression of CD133
and CXCR4 mRNAs significantly decreased in the CD133+
group. Additionally, in the CD133+ group, following
treatment with PD98059 or combined treatment with PD98059 and
SDF-1α, the expression of CD133 and CXCR4 mRNA revealed no
significant difference. However, in the CD133− group,
following treatment with SDF-1α, AMD3100, LY294002, PD98059, or
combined treatment with AMD3100 and SDF-1α, LY294002 and SDF-1α,
PD98059 and SDF-1α, no significant difference was observed in the
mRNA expression of CD133 and CXCR4 (Fig.
7A).
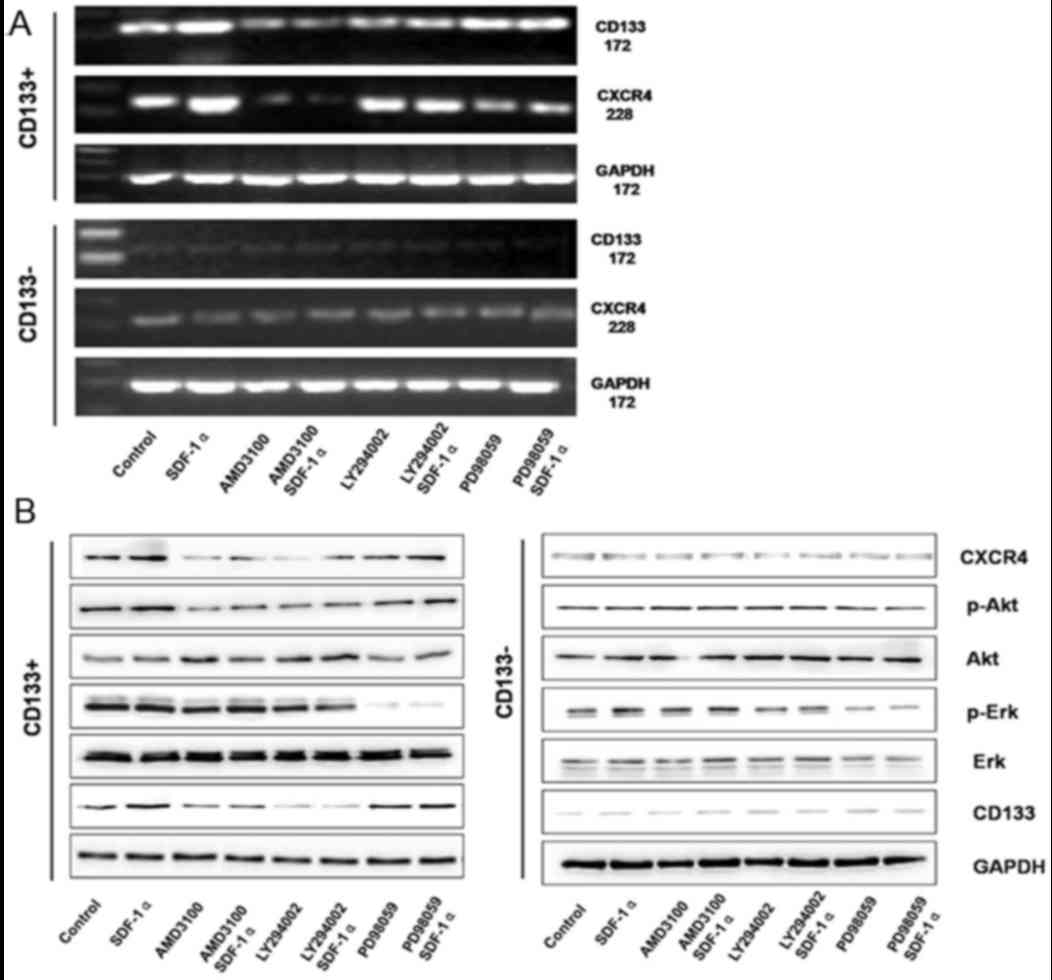 | Figure 7.(A) CD133 and CXCR4 mRNA expression
profiles in the CD133+ and CD133− groups
following treatment with SDF-1α/AMD3100/LY294002. (B) CXCR4, p-Akt,
Akt, p-Erk, Erk, and CD133 protein expression profiles in the
CD133+ and CD133− groups following treatment
with SDF-1α/AMD3100/LY294002. The CXCR4/Akt/CD133 axis and its
potential function. CXCR4, C-X-C motif chemokine receptor 4; Akt,
protein kinase B; CD, cluster of differentiation; SDF-1α, stromal
cell-derived factor 1α; p-, phosphorylated; Erk, extracellular
signal-regulated kinase. |
The signaling pathway alterations in different
groups were determined. In the CD133+ group, SDF-1α
treatment induced significantly increased protein expression of
CXCR4, p-Ak and CD133; however, there was no significant difference
determined in the expression of Akt, Erk and p-Erk. AMD3100
treatment or combined treatment with AMD3100 and SDF-1α induced
significantly decreased expression of p-Akt and CD133, whereas the
expression of Akt, Erk, and p-Erk revealed no significant
differences. LY294002 treatment or combined treatment with LY294002
and SDF-1α induced significantly decreased expression of p-Akt and
CD133, whereas the expression of CXCR4, Akt, Erk and p-Erk revealed
no significant differences. PD98059 treatment or combined treatment
with PD98059 and SDF-1α induced significantly decreased expression
of p-Akt; however, the expression of CXCR4, Akt, p-Akt, Erk and
CD133 revealed no significant differences (Fig. 7B). In the CD133− group,
following treatment with SDF-1α, AMD3100, LY294002, PD98059, or
combined treatment with AMD3100 and SDF-1α, LY294002 and SDF-1α,
PD98059 and SDF-1α, no significant differences were observed in
CXCR4, p-Akt, Akt, Erk, p-Erk and CD133 protein expression
(Fig. 7B). The CXCR4/Akt/CD133 axis
may serve an important function in the regulation of colony and
tumor formation, cell proliferation and chemoresistance, cell
invasion and stemness in human gallbladder cancer.
Discussion
TICs make up a small number of cells that remain in
the initiation stage of differentiation (23). TICs have the ability of self-renewal,
limitless proliferation and multi-directional differentiation;
therefore, TICs are a key factor for the initiation of malignant
proliferation, invasion, and metastasis of tumor cells. Tumor cells
in the stage of terminal differentiation lose the capability of
differentiation and tumorigenesis (13,3).
Targeting certain cell surface markers may be a
useful approach for screening for TICs. Human CD133 antigen is a
5-transmembrane glycoprotein participating in the formation of the
topological structure of the cell membrane. The expression of CD133
is downregulated as cell differentiation progresses; therefore,
CD133 has become one of the markers for the isolation and
identification of tumor stem cells and/or progenitor cells
(24). Studies on brain, pancreatic,
colon and prostate cancer have validated CD133 as an important
marker for TICs (10–13,25).
Previous studies have attempted to isolate TICs from gallbladder
cancer, but the biological characteristics of isolated TICs remain
unknown (14,15). In preliminary investigations of the
present study, CD133 expression in the human gallbladder cancer
cell line GBC-SD was significantly increased compared with that in
the human gallbladder cancer cell line SGC996. CD133 expression was
located in the cell membrane at an increased level of expression.
Therefore, using the human gallbladder cancer cell line GBC-SD, it
may be possible to obtain abundant CD133+-subset cells
for further research into their biological characteristics.
The present study is among the first to sort
CD133+ human gallbladder cancer cells using MACS.
Immunofluorescence and flow cytometry analysis indicated that the
purity of CD133+ cells in CD133+ group was
significantly increased compared with that of the CD133−
group, and CD133 was primarily located in the cell membrane. In
addition, the mRNA and protein expression of CD133 in the
CD133+ group was significantly increased compared with
that in the CD133− group.
Tumor formation and colony formation assays are key
methods of analyzing tumorigenesis capability (26). In the present study, tumor formation
efficiency in the CD133+ group was 100%, whereas no
tumors were observed in the CD133− group. Colony
formation in the CD133+ group was significantly
increased compared with that of the CD133− group. The
results of the present study indicated that CD133+ cells
have tumorigenesis capabilities, and may contain an increased
number of TICs than CD133− cells. Furthermore, following
treatment with EGF and bFGF for 3 weeks, a single CD133+
cell was able to proliferate, forming dozens of cells which made up
a cell sphere. Thus, a single CD133+ cell, isolated
using cell sorting, exhibited self-renewal and colony formation
abilities, as do stem cells originated from the same clone.
Limitless proliferation and resistance to drugs are
the fundamental characteristics which distinguish TICs from other
tumor cells (26,27). The results of the present study
indicated that, when cultured with serum free medium supplemented
with EGF and bFGF, cells in the CD133+ group revealed
significantly increased in vitro proliferative abilities
compared with those in the CD133− group. Gemcitabine and
5-FU are routine chemotherapeutics in clinical use. Sorted cells in
the CD133+ and CD133− groups were treated
with 5-FU and gemcitabine, and drug susceptibility of the cells in
the two groups was observed. The inhibiting rate of cell growth in
the CD133− group was significantly increased compared
with that in the CD133+ group, indicating that
CD133+ cells exhibited decreased sensitivity to
anti-tumor drugs.
EMT is a process where epithelial cells lose
polarity and transform into mesenchymal cells, followed by
subsequent cell migration. EMT is an important characteristic in
embryonic development (28). A
previous study identified that the initiation of EMT served a key
function in triggering invasion and metastasis of tumor cells
(29). In the present study, using an
Transwell assay, cells in the CD133+ group demonstrated
significantly increased invasive abilities compared with those in
the CD133− group. Furthermore, protein expression of
E-cadherin, a biomarker for epithelial cells, was decreased in the
CD133+ subset, whereas the protein expression of
N-cadherin and Snail, biomarkers for mesenchymal cells, was
increased. Therefore, it may be inferred that the increased
invasive ability of the CD133+ subset was obtained
through the initiation of EMT.
A previous study on embryonic stem cells (ESCs)
demonstrated that the transcription factors Sox-2, Oct-4 and Nanog
form a key regulatory loop that controls the transcription of
various mRNAs, and induces the reverse transformation of adult
cells into ESCs (30). Adenosine
triphosphate-binding cassette transporters (ABCs) are transmembrane
pumps which transport endogenous lipids, peptides, nucleotides and
mycins. The DNA dye Hoechst 33342 may be pumped out of cells by
ABCG2, which is used to isolate side population cells exhibiting
the characteristics similar to TICs (31). As reported by Yin et al
(14), the human gallbladder cancer
cell line GBC-SD formed spherical colonies under serum-free culture
conditions and the stem cell markers Nanog, Oct-4, Sox-2 and ABCG2
were expressed at an increased level in spherical colonies. The
Musashi family is an evolutionarily conserved RNA binding protein
in neural cells which is selectively expressed in neural
stem/progenitor cells (14). A
previous study demonstrated that Musashi-1 is associated with the
degree of malignancy, clinical pathology and prognosis in
colorectal cancer (32). The EGF
receptor (EGFR) is a receptor that serves important functions in
cell proliferation and signal transduction, and is abnormally
expressed in a number of types of solid tumor (33). In human gallbladder cancer cells,
increased expression of EGFR may accelerate the process of
malignant tumors through transactivation of inducible nitric oxide
synthase (34). CD44 has been
identified as an important marker for TICs (35). In the present study, the expression of
stem cell markers in CD133+ cells were determined using
semi-quantitative PCR, which revealed that ABCG2 and CD44 were
highly expressed in CD133+ cells and indicated that
CD44+ or CD44+ ABCG+ cells may
exist in the CD133+ group. The expression of Nanog,
Oct-4, Sox2, Musashi-1 and EGFR revealed no significant
differences, and the underlying molecular mechanism of this
requires additional study.
Ping et al (36) demonstrated that the SDF-1/CXCR4 axis
may upregulate the expression of CD133 in glioma stem cells through
the PI3K/Akt signaling pathway, and promote the formation of blood
vessels. The results of the present study identified that the
expression of CXCR4/Akt/CD133 signaling pathway proteins in the
CD133+ group was significantly increased, compared with
that in the CD133− group; therefore, it is possible to
infer from these data that proteins in the CXCR4/Akt/CD133
signaling pathway were activated in human gallbladder cancer cell
line GBC-SD. Furthermore, GBC-SD cells were treated with SDF-1α,
and the intracellular expression of CXCR4, p-Akt and CD133 proteins
was determined. The protein expression levels of CXCR4, p-Akt and
CD133 were identified to be increased in a time-dependent manner.
The present study identified that the optimal concentration of
SDF-1α was 100 ng/ml, and the optimal duration for SDF-1α treatment
was 2 h.
To determine whether the CXCR4/Akt/CD133 signaling
pathway was activated, CD133+ GBC-SD cells were treated
with SDF-1α and AMD3100 (a specific blocker for CXCR4), and the
expression of proteins in CXCR4/Akt/CD133 signaling pathway was
observed. The results of the present study identified that SDF-1α
significantly promoted the expression of CD133 at the mRNA and
protein level in CD133+ GBC-SD cells, whereas AMD3100
downregulated the expression of CD133 mRNA and protein. However, in
CD133− GBC-SD cells, neither SDF-1α nor AMD3100
treatment resulted in a regulatory effect on CD133 expression.
Therefore, in CD133+ GBC-SD cells, the SDF-1α/CXCR4 axis
participated in the regulation of CD133 expression. The underlying
molecular mechanism remains unknown.
Following treatment of CD133+ GBC-SD
cells with SDF-1α or AMD3100, the protein expression level of p-Akt
increased or decreased, whereas the expression of total Akt, p-Erk
and total Erk did not change, suggesting that the SDF-1α/CXCR4 axis
participated in the regulation of the PI3K/Akt signaling pathway.
To identify the underlying molecular mechanisms associating the
SDF-1α/CXCR4 axis with the regulation of CD133 expression,
CD133+ GBC-SD cells were treated with LY294002, a
specific inhibitor of the Akt signaling pathway, or PD98059, a
specific inhibitor of the Erk signaling pathway, and the expression
levels of proteins associated with the CXCR4/Akt/CD133 signaling
pathway were determined. In CD133+ GBC-SD cells treated
with LY294002, the expression of Akt protein did not change and the
expression level of p-Akt was downregulated, which resulted in
downregulated expression of CD133 at the mRNA and protein level.
However, PD98059 treatment did not result in altered in CD133
expression. The results from the present study suggested that the
SDF-1α/CXCR4 axis may participate in the regulation of CD133
expression in CD133+ GBC-SD cells through the Akt
signaling pathway, but not the Erk signaling pathway. In
CD133− GBC-SD cells, SDF-1α, AMD3100, LY294002 or
PD98059 treatment did not result in significant changes to CD133
expression, indicating that the CXCR4/Akt/CD133 signaling pathway
may be specifically activated in CD133+ GBC-SD
cells.
The results of the present study revealed that, in
CD133+ GBC-SD cells, SDF-1α or AMD3100 may promote or
suppress the SDF-1α/CXCR4 axis, resulting in increased or decreased
expression of CD133 in GBC-SD cells through the Akt signaling
pathway. Inhibition of the Akt signaling pathway may downregulate
CD133 expression in human gallbladder cancer cells.
There are a limited number of previous studies
isolating CD133+ human gallbladder cancer cells using
MACS. The present study demonstrated that the CD133+
subset in human gallbladder cancer cell line GBC-SD exhibited TIC
characteristics, including increased proliferative and invasive
abilities, in vivo tumor formation and in vitro
colony formation, and was resistant to anti-tumor drugs.
Furthermore, the CXCR4/Akt/CD133 signaling pathway may be activated
in CD133+ cells from the human gallbladder cancer cell
line GBC-SD.
Acknowledgements
The authors would like to thank the National Natural
Science Foundation of China (grant no. 81101850) and the Department
of General Surgery, Xinhua Hospital, Shanghai Jiao Tong University
School of Medicine.
References
|
1
|
Park HS, Lim JY, Yoon DS, Park JS, Lee DK,
Lee SJ, Choi HJ, Song SY, Lee WJ and Cho JY: Outcome of adjuvant
therapy for gallbladder cancer. Oncology. 79:168–173. 2010.
View Article : Google Scholar : PubMed/NCBI
|
|
2
|
Misra S, Chaturvedi A, Misra NC and Sharma
ID: Carcinoma of the gallbladder. Lancet Oncol. 4:167–176. 2003.
View Article : Google Scholar : PubMed/NCBI
|
|
3
|
Meacham CE and Morrison SJ: Tumour
heterogeneity and cancer cell plasticity. Nature. 501:328–337.
2013. View Article : Google Scholar : PubMed/NCBI
|
|
4
|
Bonnet D and Dick JE: Human acute myeloid
leukemia is organized as a hierarchy that originates from a
primitive hematopoietic cell. Nat Med. 3:730–737. 1997. View Article : Google Scholar : PubMed/NCBI
|
|
5
|
Dalerba P, Dylla SJ, Park IK, Liu R, Wang
X, Cho RW, Hoey T, Gurney A, Huang EH, Simeone DM, et al:
Phenotypic characterization of human colorectal cancer stem cells.
Proc Natl Acad Sci USA. 104:pp. 10158–10163. 2007, View Article : Google Scholar : PubMed/NCBI
|
|
6
|
Li C, Heidt DG, Dalerba P, Burant CF,
Zhang L, Adsay V, Wicha M, Clarke MF and Simeone DM: Identification
of pancreatic cancer stem cells. Cancer Res. 67:1030–1037. 2007.
View Article : Google Scholar : PubMed/NCBI
|
|
7
|
Bao S, Wu Q, McLendon RE, Hao Y, Shi Q,
Hjelmeland AB, Dewhirst MW, Bigner DD and Rich JN: Glioma stem
cells promote radioresistance by preferential activation of the DNA
damage response. Nature. 444:756–760. 2006. View Article : Google Scholar : PubMed/NCBI
|
|
8
|
Alvero AB, Chen R, Fu HH, Montagna M,
Schwartz PE, Rutherford T, Silasi DA, Steffensen KD, Waldstrom M,
Visintin I and Mor G: Molecular phenotyping of human ovarian cancer
stem cells unravels the mechanisms for repair and chemoresistance.
Cell Cycle. 8:158–166. 2009. View Article : Google Scholar : PubMed/NCBI
|
|
9
|
Choy W, Nagasawa DT, Trang A, Thill K,
Spasic M and Yang I: CD133 as a marker for regulation and potential
for targeted therapies in glioblastoma multiforme. Neurosurg Clin N
Am. 23:391–405. 2012. View Article : Google Scholar : PubMed/NCBI
|
|
10
|
Lee HJ, You DD, Choi DW, Choi YS, Kim SJ,
Won YS and Moon HJ: Significance of CD133 as a cancer stem cell
markers focusing on the tumorigenicity of pancreatic cancer cell
lines. J Korean Surg Soc. 81:263–270. 2011. View Article : Google Scholar : PubMed/NCBI
|
|
11
|
Wang C, Xie J, Guo J, Manning HC, Gore JC
and Guo N: Evaluation of CD44 and CD133 as cancer stem cell markers
for colorectal cancer. Oncol Rep. 28:1301–1308. 2012. View Article : Google Scholar : PubMed/NCBI
|
|
12
|
Sugihara E and Saya H: Complexity of
cancer stem cells. Int J Cancer. 132:1249–1259. 2013. View Article : Google Scholar : PubMed/NCBI
|
|
13
|
Kreso A and Dick JE: Evolution of the
cancer stem cell model. Cell Stem Cell. 14:275–291. 2014.
View Article : Google Scholar : PubMed/NCBI
|
|
14
|
Yin BB, Wu SJ, Zong HJ, Ma BJ and Cai D:
Preliminary screening and identification of stem cell-like sphere
clones in a gallbladder cancer cell line GBC-SD. J Zhejiang Univ
Sci B. 12:256–263. 2011. View Article : Google Scholar : PubMed/NCBI
|
|
15
|
Shi CJ, Gao J, Wang M, Wang X, Tian R, Zhu
F, Shen M and Qin RY: CD133(+) gallbladder carcinoma cells exhibit
self-renewal ability and tumorigenicity. World J Gastroenterol.
17:2965–2971. 2011. View Article : Google Scholar : PubMed/NCBI
|
|
16
|
Chatterjee S, Behnam Azad B and Nimmagadda
S: The intricate role of CXCR4 in cancer. Adv Cancer Res.
124:31–82. 2014. View Article : Google Scholar : PubMed/NCBI
|
|
17
|
Sun X, Cheng G, Hao M, Zheng J, Zhou X,
Zhang J, Taichman RS, Pienta KJ and Wang J: CXCL12/CXCR4/CXCR7
chemokine axis and cancer progression. Cancer Metastasis Rev.
29:709–722. 2010. View Article : Google Scholar : PubMed/NCBI
|
|
18
|
Vasko V, Saji M, Hardy E, Kruhlak M, Larin
A, Savchenko V, Miyakawa M, Isozaki O, Murakami H, Tsushima T, et
al: Akt activation and localization correlate with tumour invasion
and oncogene expression in thyroid cancer. J Med Genet. 41:161–170.
2004. View Article : Google Scholar : PubMed/NCBI
|
|
19
|
Friedl P and Alexander S: Cancer invasion
and the microenvironment: Plasticity and reciprocity. Cell.
147:992–1009. 2011. View Article : Google Scholar : PubMed/NCBI
|
|
20
|
Yu JW, Zhang P, Wu JG, Wu SH, Li XQ, Wang
ST, Lu RQ, Ni XC and Jiang BJ: Expressions and clinical
significances of CD133 protein and CD133 mRNA in primary lesion of
gastric adenocacinoma. J Exp Clin Cancer Res. 29:1412010.
View Article : Google Scholar : PubMed/NCBI
|
|
21
|
Lu RQ, Wu JG, Zhou GC, Jiang HG, Yu JW and
Jiang BJ: Sorting of CD133(+) subset cells in human gastric cancer
and the identification of their tumor initiating cell-like
properties. Zhonghua Wei Chang Wai Ke Za Zhi. 15:174–179.
2012.PubMed/NCBI
|
|
22
|
Zhang SS, Han ZP, Jing YY, Tao SF, Li TJ,
Wang H, Wang Y, Li R, Yang Y, Zhao X, et al: CD133(+)CXCR4(+) colon
cancer cells exhibitmetastatic potential and predict poor prognosis
of patients. BMC Med. 10:852012. View Article : Google Scholar : PubMed/NCBI
|
|
23
|
Magee JA, Piskounova E and Morrison SJ:
Cancer stem cells: Impact, heterogeneity, and uncertainty. Cancer
Cell. 21:283–296. 2012. View Article : Google Scholar : PubMed/NCBI
|
|
24
|
O'Brien CA, Pollett A, Gallinger S and
Dick JE: A human colon cancer cell capable of initiating tumour
growth in immunodeficient mice. Nature. 445:106–110. 2007.
View Article : Google Scholar : PubMed/NCBI
|
|
25
|
Vander Griend DJ, Karthaus WL, Dalrymple
S, Meeker A, DeMarzo AM and Isaacs JT: The role of CD133 in normal
human prostate stem cells and malignant cancer-initiating cells.
Cancer Res. 68:9703–9711. 2008. View Article : Google Scholar : PubMed/NCBI
|
|
26
|
Reya T, Morrison SJ, Clarke MF and
Weissman IL: Stem cells, cancer, and cancer stem cells. Nature.
414:105–111. 2001. View Article : Google Scholar : PubMed/NCBI
|
|
27
|
Singh S, Chitkara D, Mehrazin R, Behrman
SW, Wake RW and Mahato RI: Chemoresistance in prostate cancer cells
is regulated by miRNAs and Hedgehog pathway. PLoS One.
7:e400212012. View Article : Google Scholar : PubMed/NCBI
|
|
28
|
Thiery JP: Epithelial-mesenchymal
transitions in tumour progression. Nat Rev Cancer. 2:442–454. 2002.
View Article : Google Scholar : PubMed/NCBI
|
|
29
|
Singh A and Settleman J: EMT, cancer stem
cells and drug resistance: An emerging axis of evil in the war on
cancer. Oncogene. 29:4741–4751. 2010. View Article : Google Scholar : PubMed/NCBI
|
|
30
|
Yu J, Vodyanik MA, Smuga-Otto K,
Antosiewicz-Bourget J, Frane JL, Tian S, Nie J, Jonsdottir GA,
Ruotti V, Stewart R, et al: Induced pluripotent stem cell lines
derived from human somatic cells. Science. 318:1917–1920. 2007.
View Article : Google Scholar : PubMed/NCBI
|
|
31
|
Liu DC, Yang ZL and Jiang S:
Identification of musashi-1 and ALDH1 as carcinogenesis,
progression, and poor-prognosis related biomarkers for gallbladder
adenocarcinoma. Cancer Biomark. 8:113–121. 2010–2011. View Article : Google Scholar
|
|
32
|
Lichtenberger BM, Tan PK, Niederleithner
H, Ferrara N, Petzelbauer P and Sibilia M: Autocrine VEGF signaling
synergizes with EGFR in tumor cells to promote epithelial cancer
development. Cell. 140:268–279. 2010. View Article : Google Scholar : PubMed/NCBI
|
|
33
|
Li CF, Fang FM, Wang JM, Tzeng CC, Tai HC,
Wei YC, Li SH, Lee YT, Wang YH, Yu SC, et al: EGFR nuclear import
in gallbladder carcinoma: Nuclear phosphorylated EGFR upregulates
iNOS expression and confers independent prognostic impact. Ann Surg
Oncol. 19:443–454. 2012. View Article : Google Scholar : PubMed/NCBI
|
|
34
|
Chen S, Hou JH, Feng XY, Zhang XS, Zhou
ZW, Yun JP, Chen YB and Cai MY: Clinicopathologic significance of
putative stem cell marker, CD44 and CD133, in human gastric
carcinoma. J Surg Oncol. 107:799–806. 2013. View Article : Google Scholar : PubMed/NCBI
|
|
35
|
Britton KM, Eyre R, Harvey IJ, Stemke-Hale
K, Browell D, Lennard TW and Meeson AP: Breast cancer, side
population cells and ABCG2 expression. Cancer Lett. 323:97–105.
2012. View Article : Google Scholar : PubMed/NCBI
|
|
36
|
Ping YF, Yao XH, Jiang JY, Zhao LT, Yu SC,
Jiang T, Lin MC, Chen JH, Wang B, Zhang R, et al: The chemokine
CXCL12 and its receptor CXCR4 promote glioma stem cell-mediated
VEGF production and tumour angiogenesis via PI3K/AKT signaling. J
Pathol. 224:344–354. 2011. View Article : Google Scholar : PubMed/NCBI
|