Introduction
Hepatocellular carcinoma (HCC), the most common
histological subtype of liver cancer, is the fifth most frequently
diagnosed malignancy in males worldwide and the seventh most
commonly diagnosed carcinoma in females (1). The cancer-related mortality rate of HCC
ranked second in men and sixth in women (1). In total, ~85% of HCC cases have occurred
in developing countries (2). The
incidence of HCC has increased in certain low-incidence countries
(2). Furthermore, the prognosis of
HCC is poor, with a 5-year survival rate of 11% (3). Therefore, predictive and prognostic
factors for the diagnosis and treatment of HCC should be
identified.
Hypoxia is widely observed in numerous solid tumors,
including HCC. Hypoxic regions may induce abnormal vascular
structure, poor vascular permeability and blood shunting (4). Furthermore, hypoxia is able to
facilitate tumor progression and resistance to chemoradiation
therapy (5). Therefore, hypoxia is a
key factor in enabling tumor cells to adapt to a decreased oxygen
microenvironment (6).
Transcription factors and hypoxia-inducible factors
(HIFs), including HIF1α, HIF2α and HIF3α, regulate gene expression
in numerous tumor cells to adapt to a microenvironment of reduced
oxygen (7). HIF1α and HIF2α are
highly expressed in a number of types of cancer, indicating the
important roles of these HIFs. However, the role of HIF2α in HCC
remains controversial (8–12). A number of studies have reported that
HIF2α overexpression is associated with poor prognosis (8–10), however
Sun et al (11) reported the
opposite results. Previously, Yang et al (12) revealed that there was no correlation
between HIF2α and prognosis in patients with HCC.
HIF degradation is performed using HIF prolyl
hydroxylase 1–3 (PHD1-3) enzymes under normoxic conditions
(13). PHDs consist of three types:
PHD1 [Egl-9 family hypoxia-inducible factor 2 (EGLN2)], PHD2
(EGLN1) and PHD3 (EGLN3). Among these PHDs, PHD3 is most efficient
at regulating HIF2α compared with other HIFs (14,15).
However, these studies were performed in vitro under normal
oxygen conditions. It is well established that cancer is a chronic
hypoxic process (16). The present
study aimed to explore the association between PHD3 and HIF2α
expression in HCC (under hypoxic conditions). Several studies have
demonstrated that PHD3 serves a novel role in the progression and
prognosis of cancer (15–24); PHD3 is also able to induce apoptosis
and inhibit proliferation in cancer cells (22–29). To
the best of our knowledge, the present study is the first to report
that PHD3 overexpression induces apoptosis and inhibits growth and
proliferation in HCC cells. However, no reports are available
regarding the expression and prognostic significance of PHD3 in
patients with HCC. In addition, the potential correlation between
PHD3 and HIF2α under hypoxic conditions remains unclear. In the
present study, the association of PHD3 and HIF2α expression with
clinicopathological characteristics was analyzed in 84 patients
with HCC, and the correlation between PHD3 and HIF2α was
evaluated.
Materials and methods
Patients and tissue samples
Tumor and adjacent non-tumor liver tissues were
obtained from 84 patients with HCC who underwent curative surgery
between January 2012 and May 2013 at the Affiliated Hospital of
Guangdong Medical University (Guangdong, China). The selection
criteria were as follows: i) Patients with HCC provided written
informed consent; ii) sample diagnosis was confirmed by two
pathologists; iii) the patients had not received any anticancer
therapy prior to surgery and iv) they had not suffered from a
second cancer type. Paired tumor tissues and adjacent non-tumor
liver tissues for immunohistochemical (IHC) analysis were fixed in
4% buffered formaldehyde at room temperature for 24 h and processed
into paraffin blocks. The samples for the western blot and reverse
transcription quantitative polymerase chain reaction (RT-qPCR)
assays were snap frozen in liquid nitrogen for 5 min after surgical
removal and then stored at −80°C. The age, sex, tumor size, tumor,
node and metastasis (TNM) stage (30), α-fetoprotein (AFP) level, Edmondson
grade and portal vein tumor thrombus were all recorded (Tables I–III). The present study was approved by the
Medical Ethics Committee of the Affiliated Hospital of Guangdong
Medical University.
 | Table I.Association between PHD3 expression
and clinicopathological parameters in HCC. |
Table I.
Association between PHD3 expression
and clinicopathological parameters in HCC.
|
| PHD3 mRNA
(RT-qPCR) | PHD3 protein (western
blotting) |
|---|
|
|
|
|
|---|
| Variable | Cases | mRNA
2−ΔΔCq | t-value | P-value | Protein
expression | t-value | P-value |
|---|
| Age, years |
|
<50 | 64 |
8.586±1.861 | 1.228 | 0.223 |
1.032±0.279 | 0.916 | 0.362 |
| ≥50 | 20 |
7.980±2.128 |
|
|
0.967±0.273 |
|
|
| Sex |
| Male | 70 |
8.390±1.926 | −0.536 | 0.594 |
1.008±0.282 | −0.617 | 0.539 |
|
Female | 14 |
8.695±2.015 |
|
|
1.058±0.259 |
|
|
| Tumor size, cm |
| ≤5 | 52 |
9.042±1.898 | 3.939 |
<0.001b |
1.089±0.284 | 3.254 | 0.002a |
|
>5 | 32 |
7.465±1.574 |
|
|
0.897±0.225 |
|
|
| AFP |
|
<400 | 52 |
8.282±2.017 | −0.963 | 0.338 |
0.985±0.276 | −1.341 | 0.184 |
|
≥400 | 32 |
8.700±1.786 |
|
|
1.068±0.277 |
|
|
| TNM stage |
|
I–II | 60 |
8.287±2.092 | −1.161 | 0.249 |
1.003±0.309 | −0.712 | 0.479 |
|
III–IV | 24 |
8.827±1.424 |
|
|
1.050±0.179 |
|
|
| Edmonson |
|
I–II | 46 |
9.030±1.788 | 3.242 | 0.002a |
1.109±0.248 | 3.627 |
<0.001b |
|
III–IV | 38 |
7.730±1.880 |
|
|
0.903±0.272 |
|
|
| Portal vein tumor
thrombus |
| No | 72 |
8.425±2.010 | −0.184 | 0.854 |
1.017±0.297 | 0.047 | 0.963 |
|
Yes | 12 |
8.537±1.444 |
|
|
1.013±0.117 |
|
|
| Table III.Association between HIF2α expression
and clinicopathological parameters in HCC. |
Table III.
Association between HIF2α expression
and clinicopathological parameters in HCC.
|
| HIF2α mRNA
(RT-qPCR) | HIF2α protein
(western blotting) |
|---|
|
|
|
|
|---|
| Variable | Cases | mRNA
2−∆∆Cq | t-value | P-value | Protein
expression | t-value | P-value |
|---|
| Age, years |
|
<50 | 64 |
0.602±0.124 | 0.519 | 0.605 |
0.884±0.488 | 0.782 | 0.436 |
|
≥50 | 20 |
0.586±0.110 |
|
|
0.792±0.351 |
|
|
| Sex |
|
Male | 70 |
0.603±0.119 | −0.705 | 0.483 |
0.884±0.473 | 0.945 | 0.348 |
|
Female | 14 |
0.578±0.129 |
|
|
0.757±0.375 |
|
|
| Tumor size, cm |
| ≤5 | 52 |
0.592±0.128 | −0.619 | 0.537 |
0.865±0.504 | 0.066 | 0.947 |
|
>5 | 32 |
0.609±0.109 |
|
|
0.858±0.382 |
|
|
| AFP |
|
<400 | 52 |
0.604±0.120 | 0.554 | 0.581 |
0.887±0.420 | 0.625 | 0.533 |
|
≥400 | 32 |
0.589±0.122 |
|
|
0.822±0.503 |
|
|
| TNM stage |
|
I–II | 60 |
0.604±0.124 | 0.637 | 0.526 |
0.887±0.469 | 0.773 | 0.442 |
|
III–IV | 24 |
0.585±0.123 |
|
|
0.801±0.435 |
|
|
| Edmonson |
|
I–II | 46 |
0.611±0.126 | 0.509 | 0.304 |
0.919±0.522 | 0.010 | 0.217 |
|
III–IV | 38 |
0.584±0.125 |
|
|
0.794±0.362 |
|
|
| Portal vein tumor
thrombus |
| No | 72 |
0.604±0.119 | 0.829 | 0.351 |
0.877±0.446 | 0.734 | 0.465 |
|
Yes | 12 |
0.568±0.128 |
|
|
0.772±0.543 |
|
|
RT-qPCR assay
Total RNA was extracted from snap-frozen paired
tumor and adjacent non-tumor liver tissues using TRIzol
(Invitrogen; Thermo Fisher Scientific, Inc., Waltham, MA, USA), and
complimentary DNA was synthesized using a PrimeScript®
RT reagent kit with gDNA Eraser (Takara Bio, Inc., Otsu, Japan) in
accordance with the manufacturer's protocol. qPCR was performed
using SYBR® Premix Ex Taq™ II (Takara Bio, Inc.).
Gene-specific primer pairs were designed and synthesized by Sangon
Biotech Co., Ltd. (Shanghai, China). The following primers were
used in this study: β-actin forward, 5′-CTGTGCCCATCTACGAGG-3′ and
reverse, 5′-ATGTCACGCACGATTTCC-3′; PHD3 forward,
5′-CATCAGCTTCCTCCTGTC-3′ and reverse, 5′-CCACCATTGCCTTAGACC-3′;
HIF2α forward, 5′-TGCGACTGGCAATCAGCT-3′ and reverse,
5′-CACCACGGCAATGAAACC-3′. The thermocycling conditions were as
follows: One cycle at 95°C for 30 sec and 40 cycles at 95°C for 5
sec and at 60°C for 34 sec. Data were analyzed using the
2−ΔΔCq method (31).
Western blot analysis
Total proteins were extracted from paired tumor and
adjacent non-tumor liver tissues using radioimmunoprecipitation
assay lysis buffer (Beyotime Institute of Biotechnology, Haimen,
China). The protein concentration was determined using a
bicinchoninic acid protein assay kit (Beyotime Institute of
Biotechnology). Protein samples (30 µg) mixed with loading buffer
were loaded on to a 10% SDS-PAGE gel, which was then transferred
onto polyvinylidene fluoride membranes. Following blocking with 5%
milk at room temperature for 2 h, the membranes were incubated with
the corresponding primary antibodies (HIF2a, 1:400, ab8365; PHD3,
1:500, ab77610 Abcam, Cambridge, UK) and GAPDH (1:1,000, Abcam,
ab9484) at 4°C overnight and a secondary antibody [horseradish
peroxidase (HRP)-labeled Goat Anti-Rat IgG; cat. no. a0192,
1:1,000, Beyotime Institute of Biotechnology] at room temperature
for 2 h in turns. The bands were detected by BeyoECL Plus (Beyotime
Institute of Biotechnology). Finally, the blot was imaged using the
VersaDoc 5000 Imager (Quantity one software; version 4.6.9; Bio-Rad
Laboratories, Inc., Hercules, CA, USA) and scanned for the relative
value of protein expression in grayscale using ImageJ software
(version 1.45; National Institutes of Health, Bethesda, MD,
USA).
Immunohistochemical assay
Formalin-fixed and paraffin-embedded blocks were cut
into 4 µm-thick sections and baked at 60°C for 2 h. These sections
were deparaffinized twice in xylene for 12 min and then rehydrated
with a gradient of ethanol solution. Antigen retrieval was
performed using a citric acid buffer in a microwave for 10 min, and
endogenous peroxidase activity was blocked by 3%
H2O2 at room temperature for 15 min.
Afterwards, the sections were incubated with the corresponding
primary antibodies (HIF2a, 1:150, ab8365; PHD3, 1:150, ab77610)
overnight and a secondary antibody (HRP-labeled Goat Anti-Rat IgG,
cat. no. a0192, 1:1,000, Beyotime Institute of Biotechnology,
Haimen, China) at room temperature for 30 min in turns. The
sections were stained with diaminobenzidine reagent (DAB; Boster
Biological Technology, Ltd., Wuhan, China) at room temperature for
10 min and hematoxylin at room temperature for 2 min. Sections were
visualized using the positive signal of The sections were
counterstained with hematoxylin, rehydrated with a gradient of
ethanol, treated with xylene, and then embedded in neutral
resin.
The immunoreactivity of PHD3 and HIF2α was evaluated
as follows: Five random microscopic fields were observed using
light microscopy at ×400 magnification (CKX41; Olympus Corporation,
Tokyo, Japan). The percentage of immune-stained cells were counted,
and the mean percentages and intensities were calculated. The score
was based on the percentage of immune-staining cells (0, <10%;
1, 10–30%; 2, 31–60%; and 3, >61%). Another four-grade scoring
scale was performed on the basis of the intensities of
immune-staining cells (0, lack of any immunoreactivity; 1,
light-yellow; 2, yellow-brown; and 3, brown). The final score was
calculated (percentage of immune-staining cells × staining
intensity of immune-staining cells) as negative (0–3) or positive
(≥4).
Statistical analysis
Data were analyzed using SPSS software (version
17.0; SPSS, Inc., Chicago, IL, USA). The values are presented as
the mean ± standard error of the mean. Statistical comparisons
between two groups were performed using the χ2 or
Student's t-test. Furthermore, correlations between PHD3 and HIF2α
were assessed using Pearson's or Spearman's correlation
coefficient. P<0.05 was considered to indicate a statistically
significant difference. Finally, experimental charts were created
using GraphPad Prism (version 5; GraphPad Software, Inc., La Jolla,
CA, USA).
Results
Association between PHD3 expression
and clinicopathological characteristics in HCC
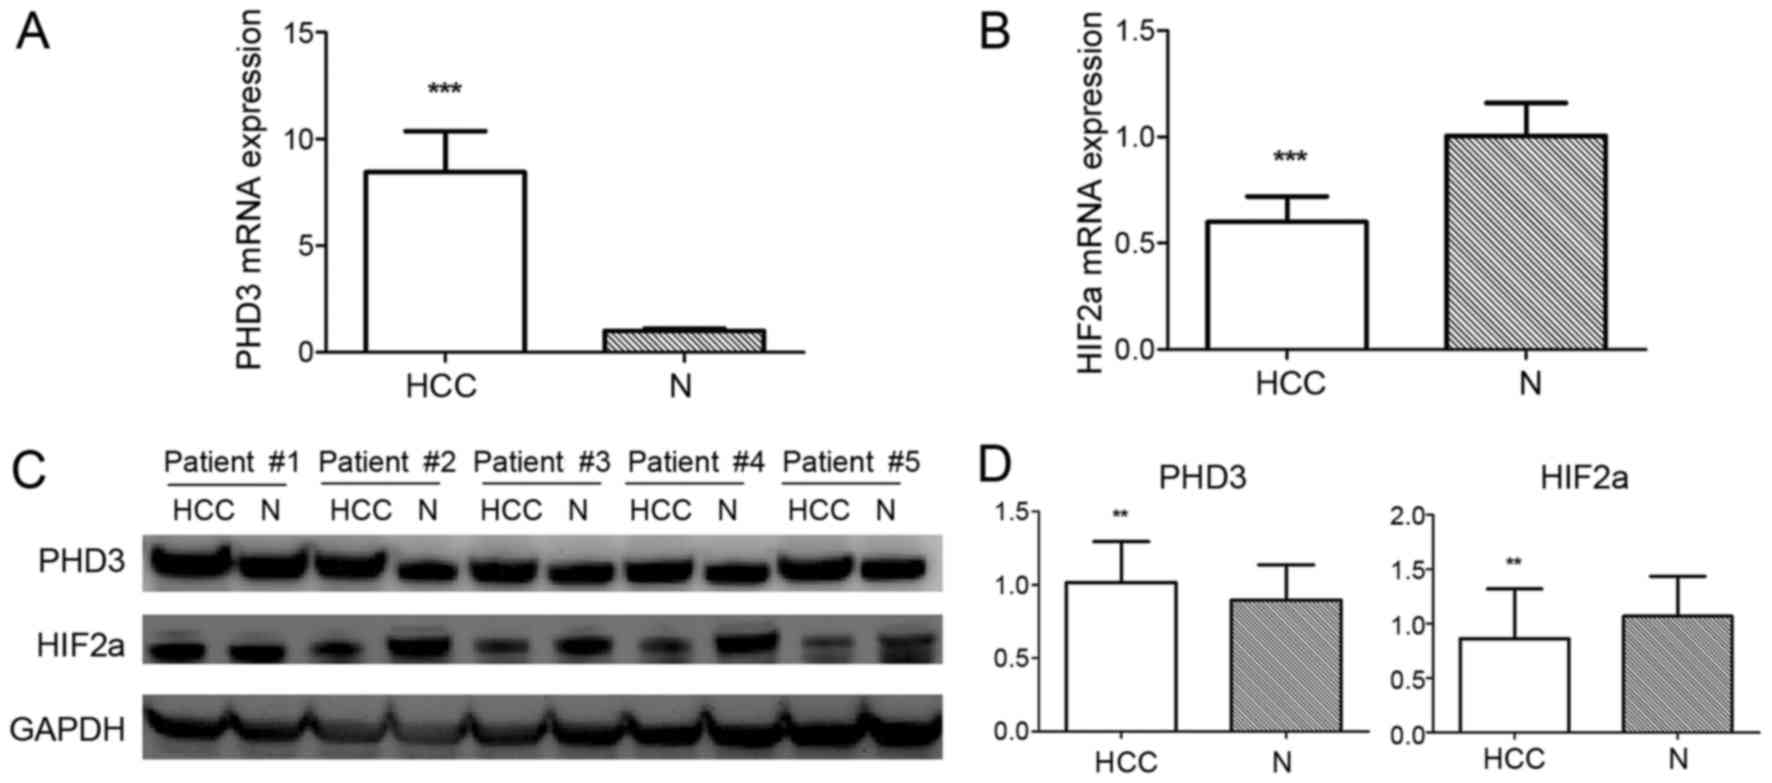
The mRNA and protein expression levels of PHD3 were
evaluated from 84 paired tissues by RT-qPCR and western blot
analysis, respectively. The mRNA and protein expression levels of
PHD3 were significantly higher in HCC tissues compared with
adjacent non-tumor liver tissues (average mRNA expression:
8.441±1.932 vs. 1.000±0.123, P<0.001; average protein
expression: 1.016±0.278 vs. 0.896±0.241, P=0.003; Fig. 1). Subsequently, the association
between PHD3 expression and clinicopathological parameters in HCC
was analyzed (Table I). The mRNA and
protein expression levels of PHD3 were negatively associated with
tumor size (mRNA, P<0.01; protein, P=0.002) and Edmonson grade
(mRNA, P=0.002; protein, P<0.001). Furthermore, no significant
association was detected between PHD3 expression and other
clinicopathological parameters, including age, sex, AFP, TNM stage
and portal vein tumor thrombus status.
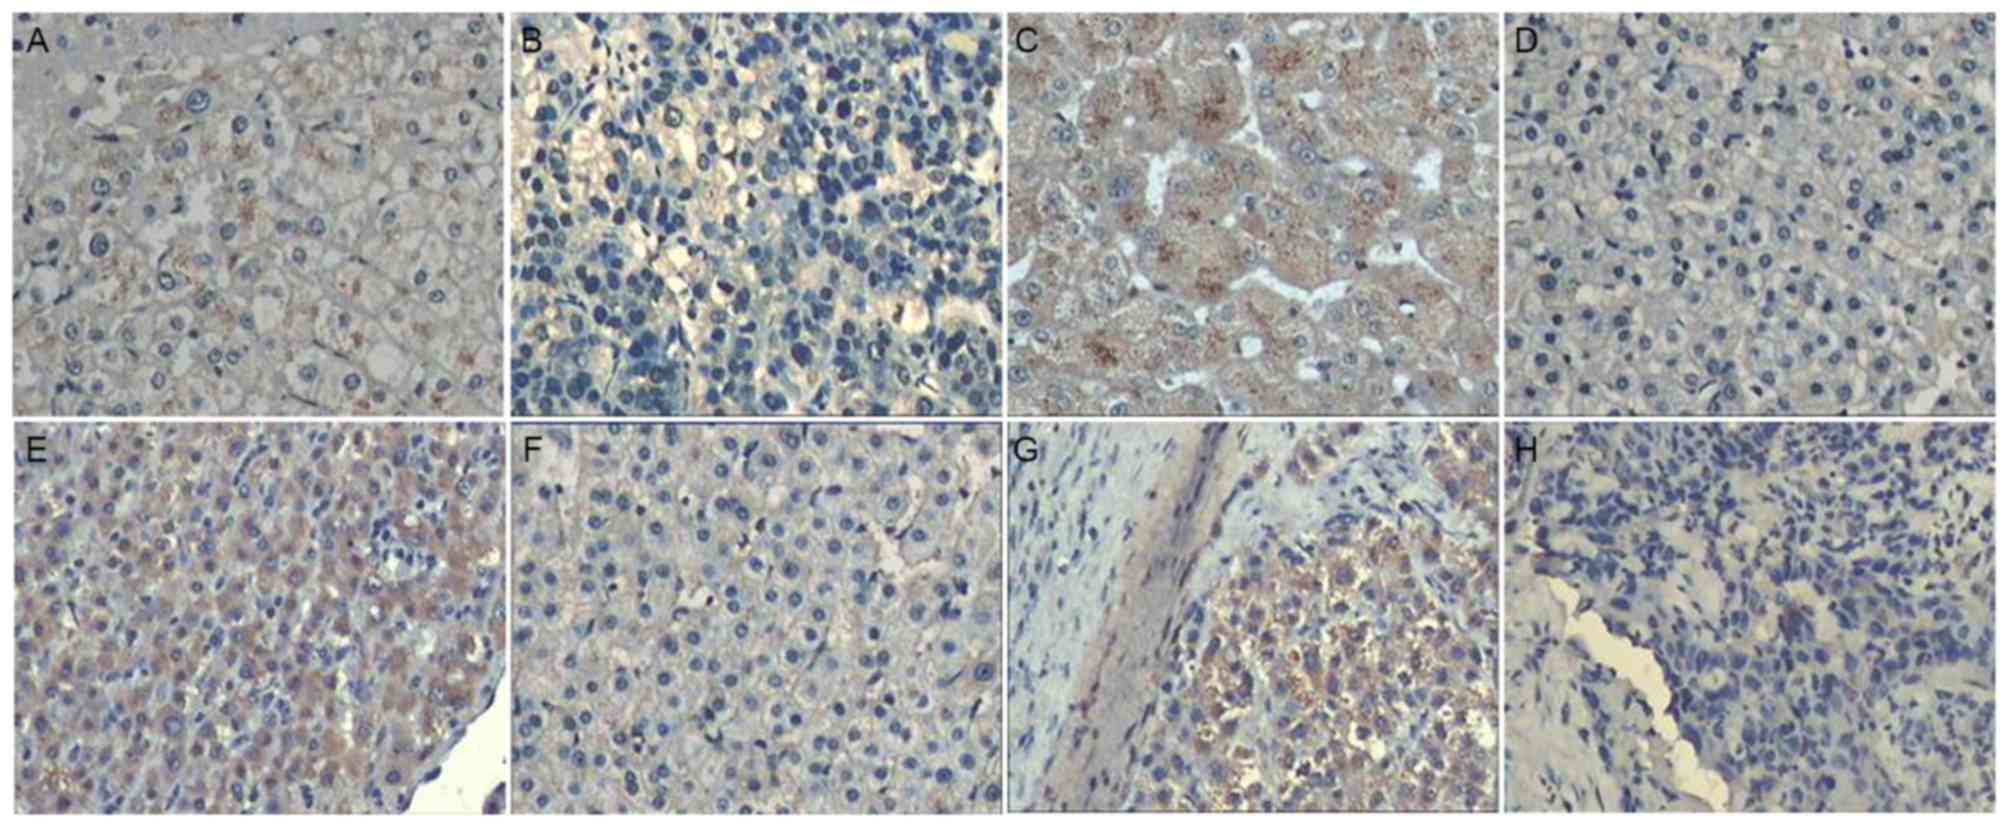
The positive rate of IHC staining in 84 paired HCC
tumor tissues and non-cancerous tissues revealed a significantly
higher expression of PHD3 in HCC tissues compared with
non-cancerous tissues (P=0.001; Fig.
2; Table IV). Furthermore, PHD3
expression was negatively associated with the tumor size
(P<0.001; Table II) and Edmonson
grade (P=0.001; Table II). No
significant associations were observed between PHD3 expression and
other clinicopathological characteristics.
| Table IV.Immunohistochemistry positive rates
of PHD3 and HIF2α. |
Table IV.
Immunohistochemistry positive rates
of PHD3 and HIF2α.
|
| PHD3 | HIF2α |
|---|
|
|
|
|
|---|
| Rates | HCC tissues | Adjacent non-tumor
tissues | HCC tissues | Adjacent non-tumor
tissues |
|---|
| Positive (n) | 56 |
| 34 | 34 |
| 54 |
| Negative (n) | 28 |
| 50 | 50 |
| 30 |
| Positive rate
(%) | 66.7 |
| 40.5 | 40.5 |
| 64.3 |
| χ2 |
| 11.583 |
|
| 9.545 |
|
| P-value |
| 0.001a |
|
| 0.002a |
|
| Table II.Association between PHD3 and HIF2α
expression and clinicopathological parameters in HCC (detected by
immunohistochemistry). |
Table II.
Association between PHD3 and HIF2α
expression and clinicopathological parameters in HCC (detected by
immunohistochemistry).
|
| PHD3 | HIF2α |
|---|
|
|
|
|
|---|
| Variable | + | − | +% | χ2 | P-value | + | − | +% | χ2 | P-value |
|---|
| Age, years |
|
<50 | 44 | 20 | 68.8 | 0.525 | 0.469 | 26 | 38 | 40.6 | 0.002 | 0.960 |
|
≥50 | 12 | 8 | 60.0 |
|
| 8 | 12 | 40.0 |
|
|
| Sex |
|
Male | 48 | 22 | 68.6 | 0.686 | 0.408 | 28 | 42 | 40.0 | 0.040 | 0.842 |
|
Female | 8 | 6 | 57.1 |
|
| 6 | 8 | 42.9 |
|
|
| Tumor size, cm |
| ≤5 | 42 | 10 | 80.8 | 12.216 |
<0.001b | 26 | 26 | 50.0 | 2.844 | 0.092 |
|
>5 | 14 | 18 | 43.8 |
|
| 8 | 24 | 25.0 |
|
|
| AFP |
|
<400 | 32 | 20 | 61.5 | 1.615 | 0.204 | 24 | 28 | 46.2 | 1.826 | 0.177 |
|
≥400 | 24 | 8 | 75.0 |
|
| 10 | 22 | 31.2 |
|
|
| TNM stage |
|
I–II | 38 | 22 | 63.3 | 1.050 | 0.306 | 26 | 34 | 43.3 | 0.712 | 0.399 |
|
III–IV | 18 | 6 | 75.0 |
|
| 8 | 16 | 33.3 |
|
|
| Edmonson |
|
I–II | 38 | 8 | 82.6 | 11.629 | 0.001a | 22 | 24 | 47.8 | 2.280 | 0.131 |
|
III–IV | 18 | 20 | 47.4 |
|
| 12 | 26 | 31.6 |
|
|
| Portal vein tumor
thrombus |
| No | 46 | 26 | 63.9 | 1.750 | 0.186 | 30 | 42 | 41.7 | 0.296 | 0.586 |
|
Yes | 10 | 2 | 83.3 |
|
| 4 | 8 | 33.3 |
|
|
Association between HIF2α expression
and clinicopathological characteristics in HCC
A total of 84 paired tissues were subjected to
RT-qPCR and western blot analyses. The average expression of HIF2α
significantly decreased in HCC tissues in comparison with non-tumor
tissues (average mRNA expression: 0.599±0.121 vs. 1.005±0.155,
P<0.001; average protein expression: 0.862±0.458 vs.
1.067±0.369, P=0.002; Fig. 1). IHC
staining of the 84 paired sections of HCC and non-tumor tissues
demonstrated that the HIF2α expression of HCC was lower compared
with non-tumor tissues (P=0.002; Fig.
2; Table IV). Subsequently, the
effect of HIF2α expression on the clinicopathological parameters of
the patients was analyzed. No statistically significant
associations were identified between HIF2α expression and the
clinicopathological parameters considered in the present study
(Tables II and III).
Correlation between PHD3 and
HIF2α
Pearson's correlation coefficient was calculated to
determine the correlation between the average mRNA and protein
expression of PHD3 and HIF2α. No statistically significant
correlations were identified between PHD3 and HIF2α mRNA expression
(r=0.004 and P=0.968) or protein expression (r=0.052 and P=0.642).
In addition, Spearman's coefficient analysis revealed no
statistically significant correlation between the IHC staining
results of PHD3 and HIF2α (r=−0.137 and P=0.213).
Discussion
To the best of our knowledge, the present study is
the first to evaluate the prognostic effect of PHD3 on HCC.
RT-qPCR, western blot analysis and immunohistochemistry were
performed and PHD3 expression was demonstrated to be higher in HCC
tissues compared with adjacent non-tumor liver tissues. Decreased
expression of PHD3 was identified to be associated with poor
differentiation and large tumor size. To date, numerous studies
have revealed that PHD3 is associated with a favorable prognosis
(15–19,22,24). For
instance, Peurala et al (15)
assessed the IHC expression of PHD3 in 102 breast cancer samples
and revealed that the decreased expression of PHD3 correlates with
poor differentiation, high proliferation and large tumor size.
Tanaka et al (17)
demonstrated that high PHD3 expression is correlated with a
favorable recurrence-free survival in patients with renal cell
carcinoma. Furthermore, Chen et al (19) identified that PHD3 is upregulated in
non-small-cell lung cancer (NSCLC), and this observation is
associated with early-stage cancer and good differentiation. Xue
et al (24) also revealed that
PHD3 expression decreases in colorectal cancer and is associated
with poor tumor grade and metastasis. In gastric cancer, high PHD3
expression correlates with good differentiation and with a
favorable tumor grade and size (18,22). By
contrast, Gossage et al (21)
demonstrated that PHD3 exhibits a trend toward an unfavorable
overall disease-specific survival in pancreatic cancer. Andersen
et al (20) also reported that
high PHD3 expression is associated with poor disease-specific
survival in NSCLC.
Given the increasing number of observational studies
on PHD3, considerable attention has been focused on the mechanism
of PHD3 (17,18,24–28). Su
et al (18) revealed that
PHD3-induced apoptosis is dependent on nerve growth factor by
activating caspase-3 in pancreatic cancer. Furthermore, PHD3 is
able to inhibit cell growth by blocking β-catenin/T-cell factor
signaling in gastric cancer and suppressing the inhibitor of
nuclear factor κB (NF-κB) kinase β subunit/NF-κB signaling in
colorectal cancer (22,24). PHD3 is also able to be regulated by
the phosphatidylinositol-3-kinase (PI3K)/Akt/mechanistic target of
rapamycin (mTOR) pathway in renal cell carcinoma (17).
Recent studies have demonstrated that PHD3
suppresses tumor growth by regulating the epidermal growth factor
receptor activity (26,27). In our previous study, a vector
containing the PHD3 gene was transfected into HepG2 cells and PHD3
overexpression was revealed to inhibit cell proliferation and
induce apoptosis by activating caspase-3 (28). Furthermore, stably PHD3-overexpressing
HepG2 cells were injected into nude mice and the average tumor size
of the PHD3 overexpression group was identified to be larger
compared with the control group (25). Accordingly, the functions of PHD3 were
confirmed by the present study.
Numerous studies have reported the correlation of
HIF2α with carcinogenesis and tumor progression. However, the
mechanism underlying HCC remains inconsistent. Bangoura et
al (8) reported that a high
expression of HIF2α correlates with poor clinicopathological
characteristics and a short cumulative survival. Sun et al
(11) demonstrated that a high
expression of HIF2α induces apoptosis through the TFDP3/E2F1
pathway and correlates with an increased overall survival. Notably,
Yang et al (12) identified no
association between HIF2α and clinicopathological characteristics,
overall and disease-free survival. The results of the present study
were similar to those of Yang et al (12). Additionally, the correlation between
PHD3 and HIF2α expression was analyzed in the present study.
RT-qPCR, western blot analysis and immunoreactivity analyses were
performed and no statistically significant correlation was
identified between PHD3 and HIF2α expression. Furthermore, HIF
degradation was previously conducted using HIF PHD enzymes under
normoxic conditions (13). However,
the activation of PHD3 may be inhibited under the chronic hypoxic
conditions of HCC. Additionally, PHD3 may be associated with
another pathway. Our previous study revealed that PHD3
overexpression could not regulate HIF2α expression in HpG2 cells
(28). Furthermore, Tanaka et
al (17) demonstrated that PHD3
is able to be regulated by the PI3K/Akt/mTOR pathway independently
of HIF proteins in renal cell carcinoma. Therefore, PHD3-induced
apoptosis may independently affect HIF2α proteins in HCC.
In conclusion, the present study assessed PHD3 and
HIF2α expression in 84 paired HCC and adjacent non-tumor liver
tissues. The high average expression of PHD3 was associated with
good differentiation and small tumor size. Therefore, PHD3
expression acts as a favorable prognostic marker for patients with
HCC. No correlation was identified between PHD3 and HIF2α
expression in HCC.
Acknowledgements
The present study was supported by grants from the
Science and Technology Innovation Fund of Guangdong Medical College
(grant no. STIF201126) and the Excellent Master's Thesis Fostering
Fund of Affiliated Hospital of Guangdong Medical College (grant no.
YS1108).
References
|
1
|
Jemal A, Bray F, Center MM, Ferlay J, Ward
E and Forman D: Global cancer statistics. CA Cancer J Clin.
61:69–90. 2011. View Article : Google Scholar : PubMed/NCBI
|
|
2
|
El-Serag HB: Epidemiology of viral
hepatitis and hepatocellular carcinoma. Gastroenterology.
142:1264–1273, e1. 2012. View Article : Google Scholar : PubMed/NCBI
|
|
3
|
Blechacz B and Mishra L: Hepatocellular
carcinoma biology. Recent Results Cancer Res. 190:1–20. 2013.
View Article : Google Scholar : PubMed/NCBI
|
|
4
|
Webb JD, Coleman ML and Pugh CW: Hypoxia,
hypoxia-inducible factors (HIF), HIF hydroxylases and oxygen
sensing. Cell Mol Life Sci. 66:3539–3554. 2009. View Article : Google Scholar : PubMed/NCBI
|
|
5
|
Stegeman H, Span PN, Kaanders JH and
Bussink J: Improving chemoradiation efficacy by PI3-K/AKT
inhibition. Cancer Treat Rev. 40:1182–1191. 2014. View Article : Google Scholar : PubMed/NCBI
|
|
6
|
Folkman J: Tumor angiogenesis: Therapeutic
implications. N Engl J Med. 285:1182–1186. 1971. View Article : Google Scholar : PubMed/NCBI
|
|
7
|
Semenza GL: Defining the role of
hypoxia-inducible factor 1 in cancer biology and therapeutics.
Oncogene. 29:625–634. 2010. View Article : Google Scholar : PubMed/NCBI
|
|
8
|
Bangoura G, Liu ZS, Qian Q, Jiang CQ, Yang
GF and Jing S: Prognostic significance of HIF-2alpha/EPAS1
expression in hepatocellular carcinoma. World J Gastroenterol.
13:3176–3182. 2007. View Article : Google Scholar : PubMed/NCBI
|
|
9
|
Tong WW, Tong GH, Chen XX, Zheng HC and
Wang YZ: HIF2α is associated with poor prognosis and affects the
expression levels of survivin and cyclin D1 in gastric carcinoma.
Int J Oncol. 46:233–242. 2015. View Article : Google Scholar : PubMed/NCBI
|
|
10
|
Putra AC, Eguchi H, Lee KL, Yamane Y,
Gustine E, Isobe T, Nishiyama M, Hiyama K, Poellinger L and
Tanimoto K: The A Allele at rs13419896 of EPAS1 is associated with
enhanced expression and poor prognosis for non-small cell lung
cancer. PLoS One. 10:e01344962015. View Article : Google Scholar : PubMed/NCBI
|
|
11
|
Sun HX, Xu Y, Yang XR, Wang WM, Bai H, Shi
RY, Nayar SK, Devbhandari RP, He YZ, Zhu QF, et al: Hypoxia
inducible factor 2 alpha inhibits hepatocellular carcinoma growth
through the transcription factor dimerization partner 3/E2F
transcription factor 1-dependent apoptotic pathway. Hepatology.
57:1088–1097. 2013. View Article : Google Scholar : PubMed/NCBI
|
|
12
|
Yang SL, Liu LP, Jiang JX, Xiong ZF, He QJ
and Wu C: The correlation of expression levels of HIF-1α and HIF-2α
in hepatocellular carcinoma with capsular invasion, portal vein
tumor thrombi and patients' clinical outcome. Jpn J Clin Oncol.
44:159–167. 2014. View Article : Google Scholar : PubMed/NCBI
|
|
13
|
Bruick RK and McKnight SL: A conserved
family of prolyl-4-hydroxylases that modify HIF. Science.
294:1337–1340. 2001. View Article : Google Scholar : PubMed/NCBI
|
|
14
|
Appelhoff RJ, Tian YM, Raval RR, Turley H,
Harris AL, Pugh CW, Ratcliffe PJ and Gleadle JM: Differential
function of the prolyl hydroxylases PHD1, PHD2 and PHD3 in the
regulation of hypoxia-inducible factor. J Biol Chem.
279:38458–38465. 2004. View Article : Google Scholar : PubMed/NCBI
|
|
15
|
Peurala E, Koivunen P, Bloigu R,
Huaapasaari KM and Jukkola-Cuorinen A: Expressions of individual
PHDs associate with good prognostic factors and increased
proliferation in breast cancer patients. Breast Cancer Res Treat.
133:179–188. 2012. View Article : Google Scholar : PubMed/NCBI
|
|
16
|
Michiels C, Tellier C and Feron O: Cycling
hypoxia: A key feature of the tumor microenvironment. Biochim
Biophys Acta. 1866:76–86. 2016.PubMed/NCBI
|
|
17
|
Tanaka T, Torigoe T, Hirohashi Y, Sato E,
Honma I, Kitamura H, Masumori N, Tsukamoto T and Sato N:
Hypoxia-inducible factor (HIF)-independent expression mechanism and
novel function of HIF prolyl hydroxylase-3 in renal cell carcinoma.
J Cancer Res Clin Oncol. 140:503–513. 2014. View Article : Google Scholar : PubMed/NCBI
|
|
18
|
Su C, Huang K, Sun L, Yang D, Zheng H, Gao
C, Tong J and Zhang Q: Overexpression of the HIF hydroxylase PHD3
is a favorable prognosticator for gastric cancer. Med Oncol.
29:2710–2715. 2012. View Article : Google Scholar : PubMed/NCBI
|
|
19
|
Chen S, Zhang J, Li X, Luo X, Fang J and
Chen H: The expression of prolyl hydroxylase domain enzymes are
up-regulated and negatively correlated with Bcl-2 in non-small cell
lung cancer. Mol Cell Biochem. 358:257–263. 2011. View Article : Google Scholar : PubMed/NCBI
|
|
20
|
Andersen S, Donnem T, Stenvold H, Al-Saad
S, Al-Shibli K, Busund LT and Bremnes RM: Overexpression of the HIF
hydroxylases PHD1, PHD2, PHD3 and FIH are individually and
collectively unfavorable prognosticators for NSCLC survival. PLoS
One. 6:e238472011. View Article : Google Scholar : PubMed/NCBI
|
|
21
|
Gossage L, Zaitoun A, Fareed KR, Turley H,
Aloysius M, Lobo DN, Harris AL and Madhusudan S: Expression of key
hypoxia sensing prolyl-hydroxylases PHD1, −2 and −3 in
pancreaticobiliary cancer. Histopathology. 56:908–920. 2010.
View Article : Google Scholar : PubMed/NCBI
|
|
22
|
Cui L, Qu J, Dang S, Mao Z, Wang X, Fan X,
Sun K and Zhang J: Prolyl hydroxylase 3 inhibited the
tumorigenecity of gastric cancer cells. Mol Carcinog. 53:736–743.
2014. View
Article : Google Scholar : PubMed/NCBI
|
|
23
|
Liu QL, Liang QL, Li ZY, Zhou Y, Ou WT and
Huang ZG: Function and expression of prolyl hydroxylase 3 in
cancers. Arch Med Sci. 9:589–593. 2013. View Article : Google Scholar : PubMed/NCBI
|
|
24
|
Xue J, Li X, Jiao S, Wei Y, Wu G and Fang
J: Prolyl hydroxylase-3 is down-regulated in colorectal cancer
cells and inhibits IKKbeta independent of hydroxylase activity.
Gastroenterology. 138:606–615. 2010. View Article : Google Scholar : PubMed/NCBI
|
|
25
|
Zhou Y, Liang QL, Ou WT, Liu QL, Zhang XN,
Li ZY and Huang X: Effect of stable transfection with PHD3 on
growth and proliferation of HepG2 cells in vitro and in vivo. Int J
Clin Exp Med. 7:2197–2203. 2014.PubMed/NCBI
|
|
26
|
Henze AT, Garvalov BK, Seidel S, Cuesta
AM, Ritter M, Filatova A, Foss F, Dopeso H, Essmann CL, Maxwell PH,
et al: Loss of PHD3 allows tumours to overcome hypoxic growth
inhibition and sustain proliferation through EGFR. Nat Commun.
5:55822014. View Article : Google Scholar : PubMed/NCBI
|
|
27
|
Garvalov BK, Foss F, Henze AT, Bethani I,
Gräf-Höchst S, Singh D, Filatova A, Dopeso H, Seidel S, Damm M, et
al: PHD3 regulates EGFR internalization and signalling in tumours.
Nat Commun. 5:55772014. View Article : Google Scholar : PubMed/NCBI
|
|
28
|
Liang QL, Li ZY, Zhou Y, Liu QL, Ou WT and
Huang ZG: Construction of a recombinant eukaryotic expression
vector containing PHD3 gene and its expression in HepG2 cells. J
Exp Clin Cancer Res. 31:642012. View Article : Google Scholar : PubMed/NCBI
|
|
29
|
Su Y, Loos M, Giese N, Hines OJ, Diebold
I, Görlach A, Metzen E, Pastorekova S, Friess H and Büchler P: PHD3
regulates differentiation, tumour growth and angiogenesis in
pancreatic cancer. Br J Cancer. 103:1571–1579. 2010. View Article : Google Scholar : PubMed/NCBI
|
|
30
|
International Union Against Cancer (UICC),
. Sobin LH and Wittekind C: TNM classification of malign ant
tumors. 6th. New York: Wiley-Liss; pp. 81–83. 2002
|
|
31
|
Livak KJ and Schmittgen TD: Analysis of
relative gene expression data using real-time quantitative PCR and
the 2(-Delta Delta C(T)) method. Methods. 25:402–408. 2001.
View Article : Google Scholar : PubMed/NCBI
|