Introduction
Melanoma is a highly malignant tumor of the skin
melanocytes that is insensitive to chemotherapy or radiotherapy
(1). The majority of patients with
melanoma exhibit a poor prognosis, and the disease is associated
with a high mortality rate (2).
Patients with melanoma frequently exhibit activation of the
BRAF gene due to somatic mutations, with up to 50% of
patients exhibiting BRAF oncogenic mutations (3,4). The most
common BRAF mutation in melanoma, BRAF V600E, accounts for
~79% of BRAF mutations (5).
BRAF is a member of the RAF kinase family, which includes ARAF,
BRAF and CRAF (6). BRAF
mutations can lead to the constitutive activation of downstream
signaling through mitogen-activated protein kinase (MAPK) pathways,
including the mitogen-activated protein kinase kinase
(MEK)-extracellular signal-regulated kinase (ERK) pathway, which
subsequently upregulates cell migration and proliferation (7).
Good clinical outcomes have been obtained with
melanoma treatments that target BRAF mutants and with
MEK/ERK inhibitors. As a first-line clinical treatment for
melanoma, vemurafenib (PLX4032) is a potent inhibitor of mutated
BRAF and a specific therapy for advanced melanoma (8). However, targeted inhibitors typically
only maintain their efficacy for 8–9 months before the tumor
develops resistance to the inhibitor, allowing rapid growth to
continue (9). Thus, controlling drug
resistance is a key issue in melanoma treatment.
A number of studies have attempted to elucidate the
mechanisms of drug resistance in melanoma patients. Hepatocyte
growth factor (HGF) expression has been observed in the stromal
cells of patients carrying BRAF mutations, and an
association has been demonstrated between HGF-secreting stromal
cells and the resistance to Raf inhibitors (10). Another potential cause for the
development of resistance is mitogen-activated protein kinase
kinase kinase 8 overexpression by cells (11). Mutations of the asparaginyl-tRNA
synthetase (NARS) gene were identified in
vemurafenib-resistant cells in vitro, and in the lymph node
cells of vemurafenib-resistant patients. NARS mutations may
be active in the MAPK pathway, leading to the resistance of
melanoma cells to targeted inhibitors (12).
The BRAF mutation itself may lead to
resistance development. In previous reports, patients with the BRAF
V600E mutation exhibited a poor prognosis due to acquired
resistance to vemurafenib and trametinib (13,14). Other
studies have demonstrated that the BRAF V600E mutation or MEK
inhibitor resistance may be associated with epidermal growth factor
receptor (EGFR) activation in tumor cells (15,16). For
example, Prahallad et al identified that in a subset of
patients, BRAF V600E inhibitors may lead to EGFR activation, which,
in turn, may enhance the resistance of cancer cells to BRAF
inhibitors (15). Sun et al
demonstrated that EGFR expression enhances the proliferation of
melanoma cells in the presence of inhibitors against BRAF or MEK
(16).
There remains no effective clinical treatment for
patients with EGFR-activating feedback. Furthermore, it has yet to
be established whether patients with EGFR-activating BRAF V600E
mutations experience alterations to gene expression prior to and
following disease or treatment. Therefore, the aim of the present
study was to analyze changes in the expression of genes by melanoma
tumors in patients with EGFR-activating BRAF mutations,
including during the development of drug resistance. The overall
goal was to identify potential drug targets for melanoma
treatment-resistant patients.
Materials and methods
Identification of differentially
expressed genes (DEGs) from a public database
All cases were pathologically diagnoses to be skin
melanoma while the controls were well identified as have drug
resistance with EGFR-activating BRAF mutations. Sample numbers
SRR961663, SRR961664, SRR961665, SRR961666, SRR961667 and SRR961668
were downloaded from dataset GSE50535 of the Gene Expression
Omnibus (GEO; https://www.ncbi.nlm.nih.gov/geo/). TopHat 2.1.1 and
Cufflinks 2.2.1 software packages were utilized to analyze assembly
data and differences in the gene expression profiles, respectively
(17). RNA-seq data of 130 samples
from tumor and non-tumor sites of patients with BRAF V600E
mutations of unknown EGFR activation status were downloaded from
the Cancer Genome Atlas (TCGA) cutaneous melanoma database
(https://cancergenome.nih.gov/). Using
the edgeR3.5 package in Bioconductor, DEGs between pre- and
post-treatment data from the GEO dataset and between pre-treatment
data from the GEO dataset vs. tumor or non-tumor sample data from
the TCGA site were analyzed (18).
P<0.05 was considered to indicate a statistically significant
difference.
Functional enrichment analysis of
DEGs
A functional enrichment analysis of DEGs, including
gene ontology (GO) functional analysis and Kyoto Encyclopedia of
Genes and Genomes (KEGG) pathway analysis, was performed using the
Database for Annotation Visualization and Integrated Discovery
(DAVID; https://david.ncifcrf.gov/). GO
analysis included the categories of cellular component (CC),
biological process (BP), and molecular function (MF). P<0.05 was
considered to indicate a statistically significant difference.
Results
Gene expression changes in tumors
prior to and following treatment in drug-resistant patients with
EGFR-activating BRAF mutations
A total of 6 samples of melanoma from 3 patients
prior to and following treatment from the GSE50535 dataset were
analyzed. The analysis resulted in the identification of 94
significant DEGs (62 upregulated and 32 downregulated genes), which
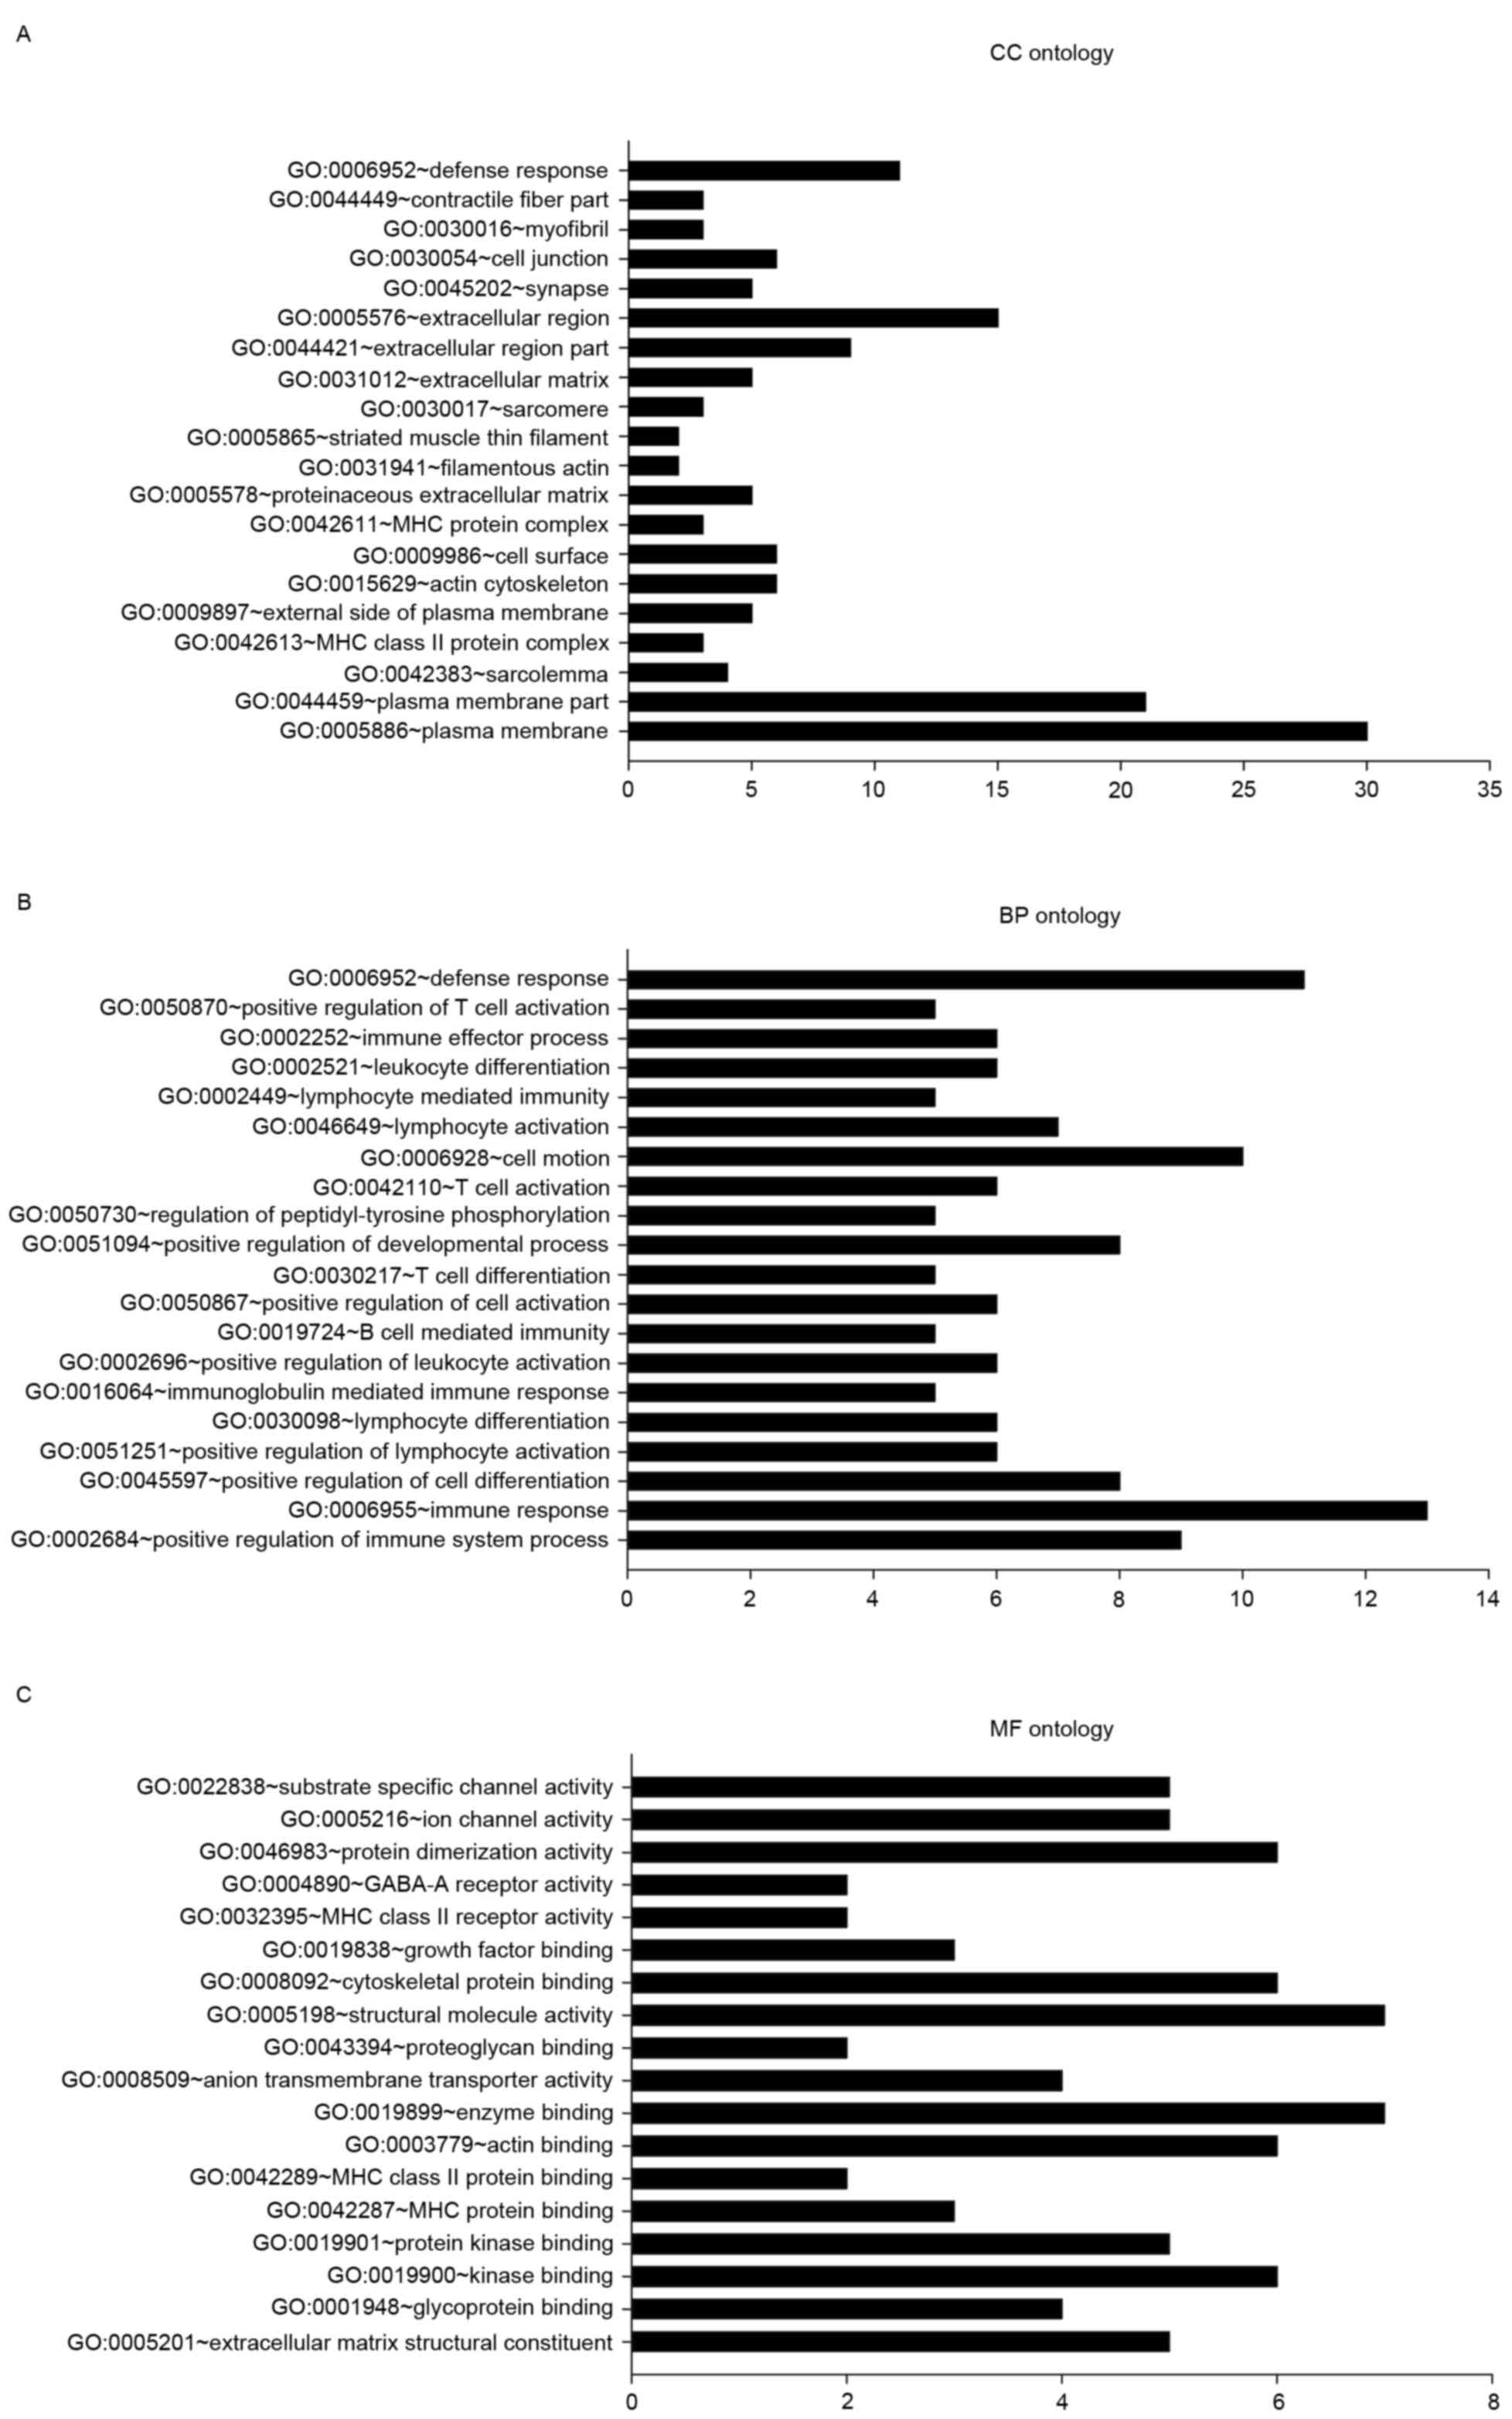
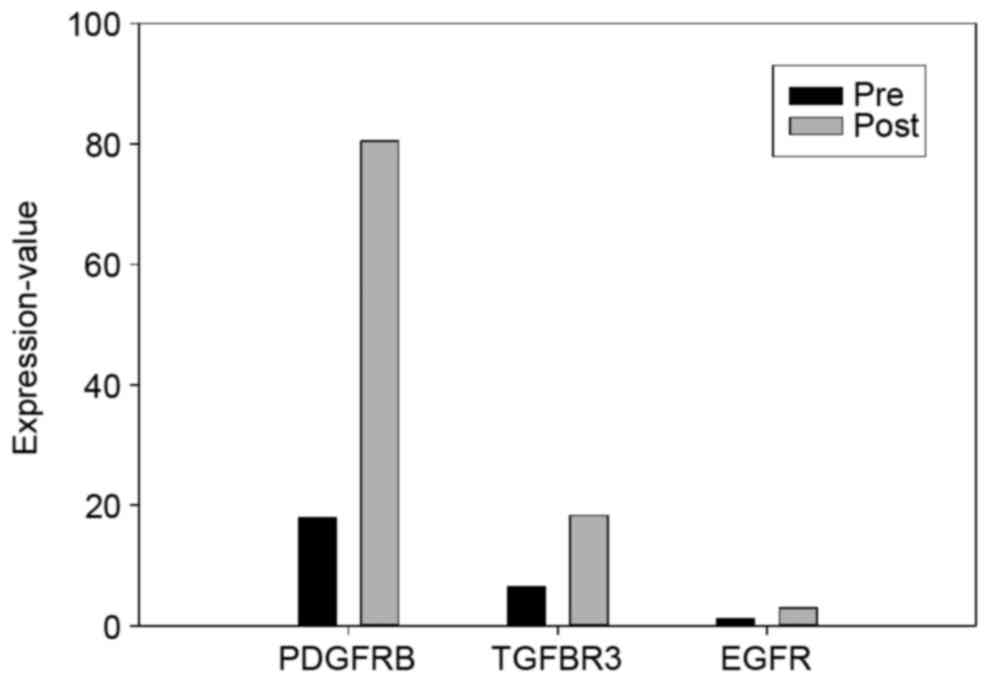
were categorized using GO analysis in DAVID (Fig. 1). EGFR and EGFR-associated mutations
were also analyzed (Fig. 2).
In the CC ontology analysis (Fig. 1A), the majority of the significantly
enriched genes were associated with the terms plasma membrane (PM;
30 genes, 33.25% of all DEGs; P=0.002), PM part (21 genes, 22.58%;
P=0.002) and sarcolemma [4 genes, including biglycan (BGN),
collagen type VI α-3 chain (COL6A3), COL6A2, and
calcium voltage-gated channel subunit α-1C (CACNA1C); 4.30%
of all DEGs; P=0.003].
In the BP ontology analysis (Fig. 1B), 9 genes [including protein tyrosine
phosphatase, receptor type C (PTPRC), coronin 1A
(CORO1A), IKAROS family zinc finger 1 (IKZF1),
clusterin (CLU), cluster of differentiation 4 (CD4),
inositol polyphosphate-5-phosphatase D (INPP5D), complement
c1q C chain (C1QC), CD74, and major
histocompatibility complex, class II, DR-α (HLA-DRA)] were
enriched in the positive regulation of immune system process
(P=1.08×10⁻⁵). Other categories with significant
enrichment included immune response (13; P=0.003), positive
regulation of lymphocyte activation (6; P=7.29×10⁻⁵),
and lymphocyte differentiation (6; P=9.84×10⁻⁵). A total
of 8 genes were associated with the positive regulation of cell
differentiation (P=7.29×10⁻⁵).
In the MF ontology (Fig.
1C), categories with significant enrichment of DEGs included
extracellular matrix structural constituent (5 genes: BGN,
elastin, COL6A2, CD4, and COL5A1;
P=5.43×10⁻⁴), glycoprotein binding (4 genes;
P=5.61×10⁻⁴), kinase binding [six genes: PTPRC,
CORO1A, integrin subunit β-2 (ITGB2), CD4,
troponin I3, cardiac type (TNNI3), and topoisomerase II-β
(TOP2B); P=0.001], and protein kinase binding [five genes:
PTPRC, ITGB2, CD4, TNNI3 and
TOP2B; P=0.003].
KEGG pathway analysis of the 94 DEGs was also
performed (Table I). The most
significantly enriched KEGG pathway was cell adhesion molecules
(CAMs; 7 DEGs; P=1.70×10⁻⁴). A total of 5 DEGs were
enriched in the antigen processing and presentation pathway.
 | Table I.Top 5 Kyoto Encyclopedia of Genes and
Genomes pathway terms with significant enrichment of DEGs in
patients with epidermal growth factor receptor-activating BRAF
mutations prior to and following treatment. |
Table I.
Top 5 Kyoto Encyclopedia of Genes and
Genomes pathway terms with significant enrichment of DEGs in
patients with epidermal growth factor receptor-activating BRAF
mutations prior to and following treatment.
| Term | DEGs, n | P-value |
|---|
| HSA04514: Cell
adhesion molecules | 7 |
1.70×10⁻⁴ |
| HSA04612: Antigen
processing and presentation | 5 |
1.88×10⁻³ |
| HSA04940: Type I
diabetes mellitus | 4 |
2.41×10⁻³ |
| HSA05414: Dilated
cardiomyopathy | 5 |
2.75×10⁻³ |
| HSA04672:
Intestinal immune network for IgA production | 4 |
3.75×10⁻³ |
Gene changes in tumor compared with
non-tumor melanoma samples
The present study aimed to improve the understanding
of the differences between tumor samples from melanoma patients
with EGFR-activating BRAF mutations and non-tumor samples
from melanoma patients. Melanoma samples (SRR961663, SRR961665 and
SRR961667) from 3 patients prior to treatment were compared with 1
non-tumor sample from the TCGA cutaneous melanoma database. A total
of 274 significant DEGs were identified, which were then
categorized with GO analysis in DAVID.
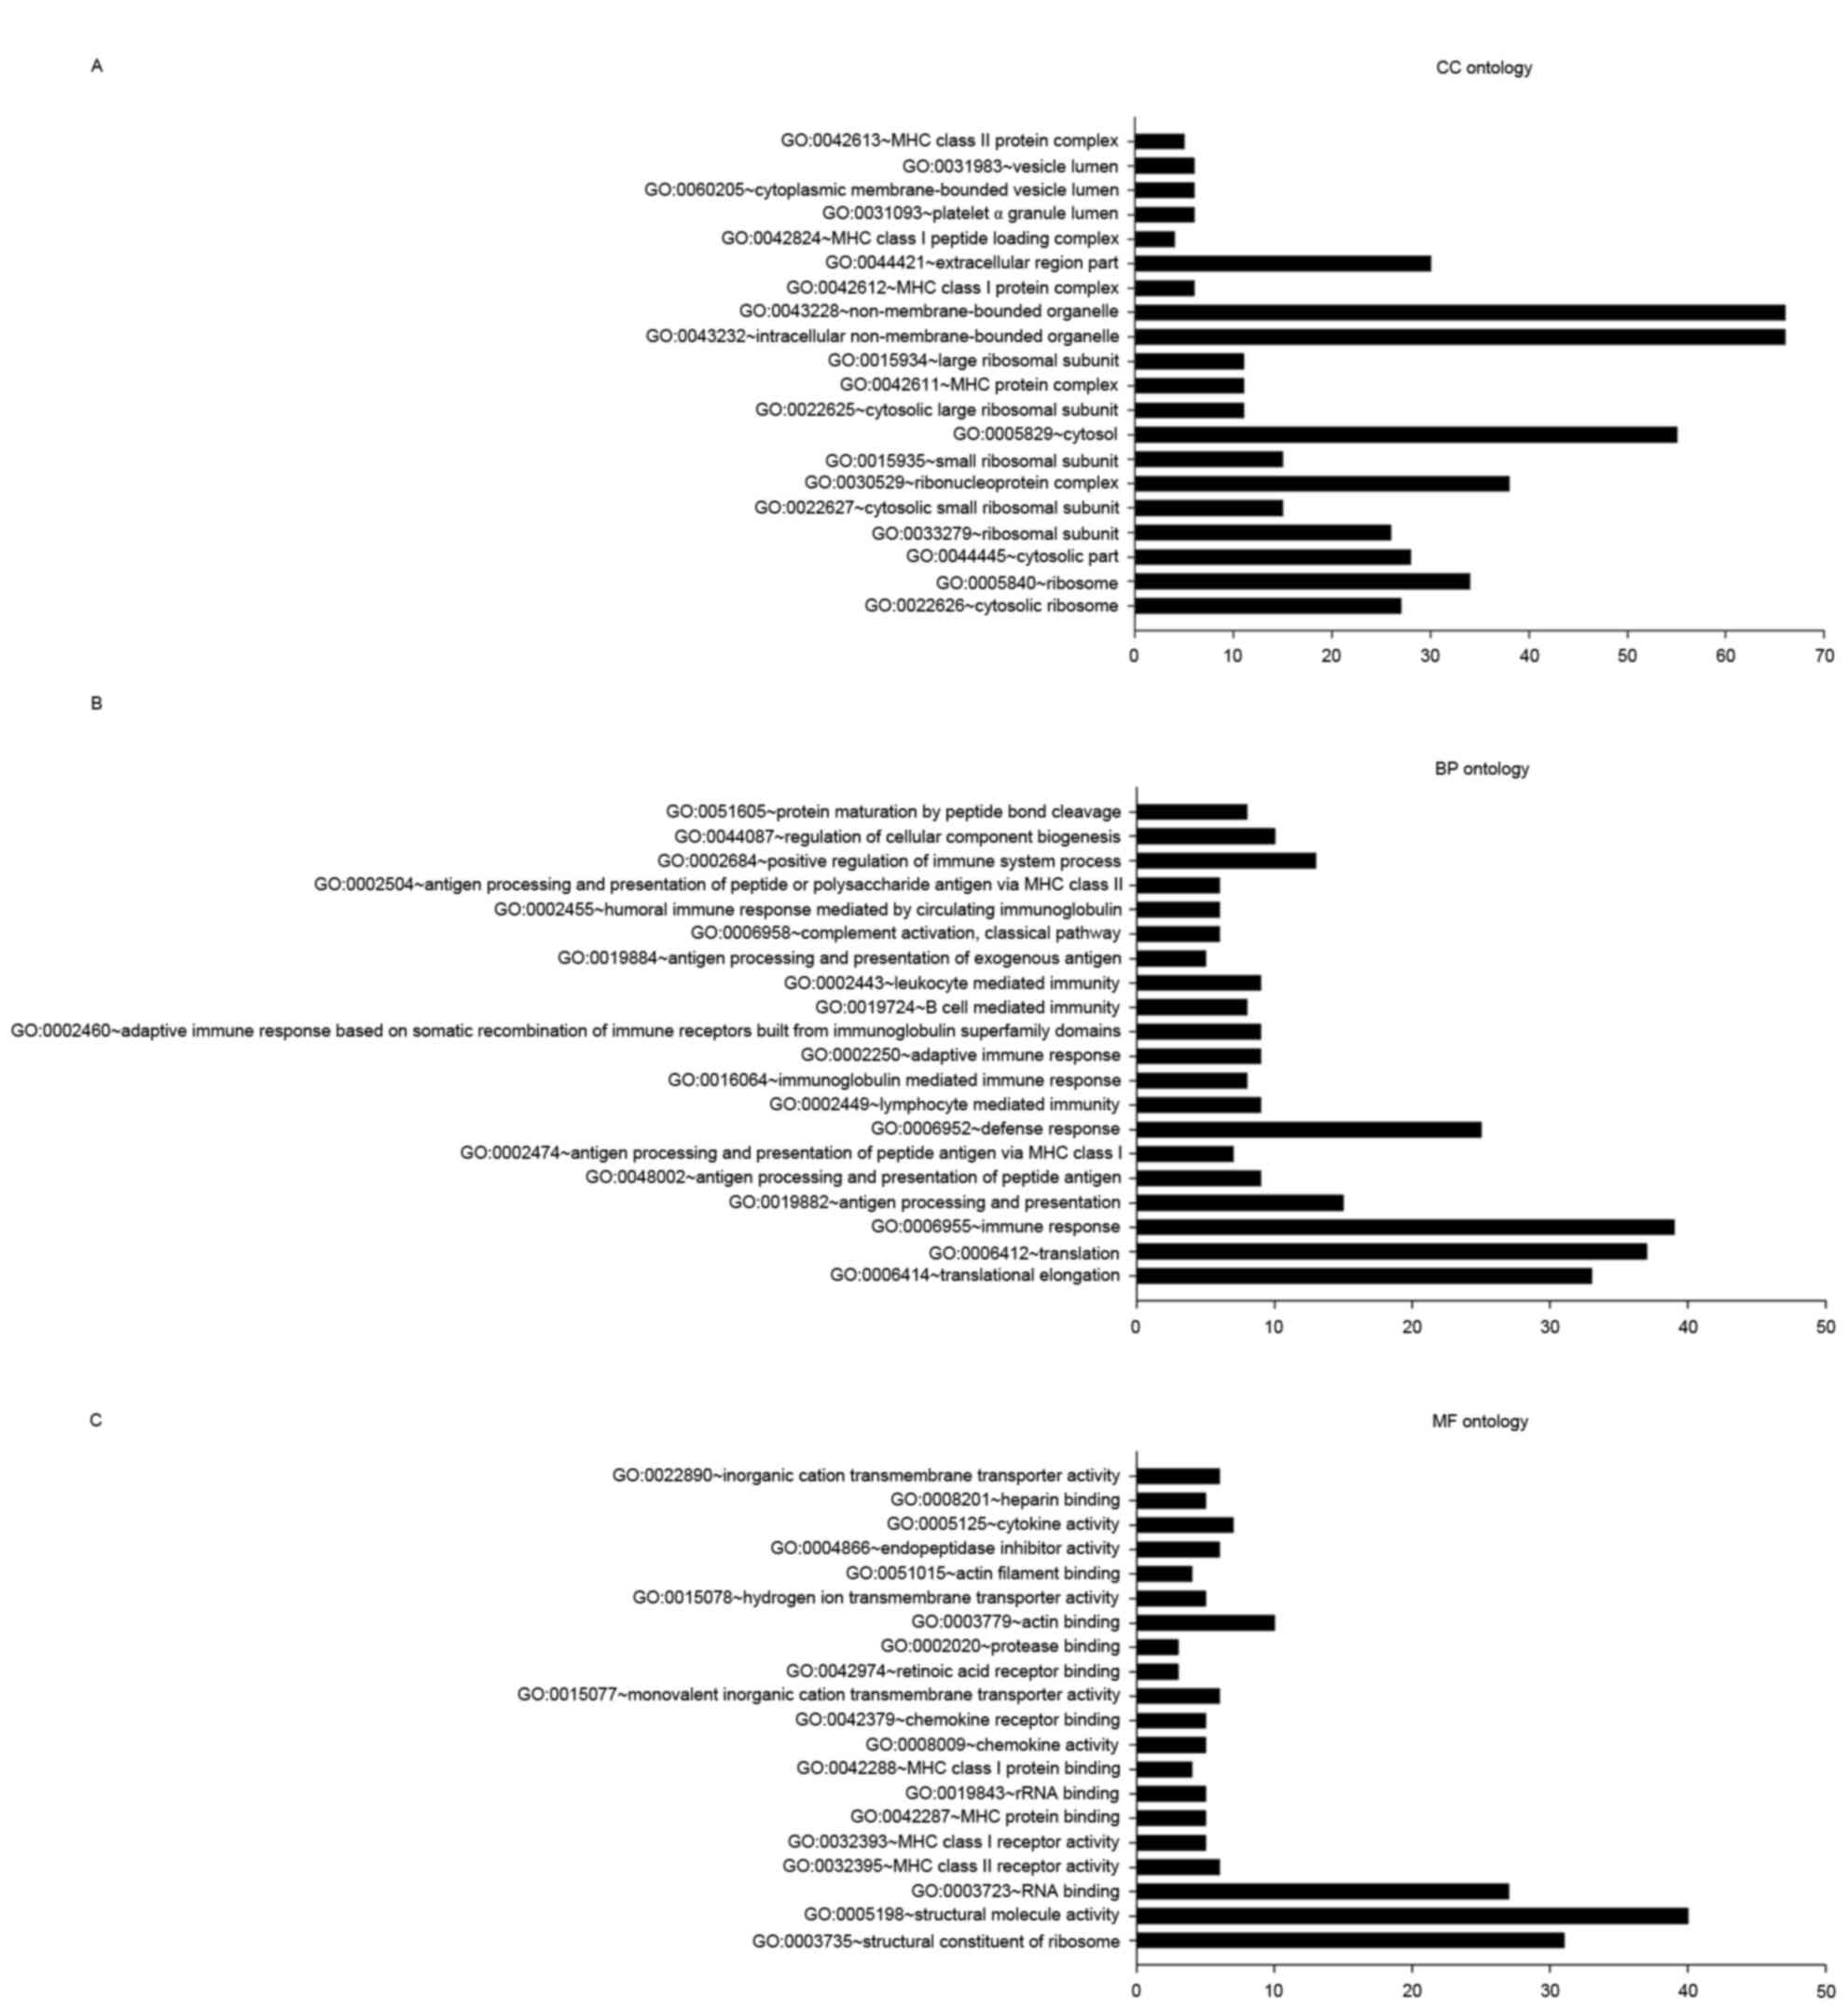
In the CC ontology analysis (Fig. 3A), the most significantly enriched
categories were adhesion-associated items pertaining to the
ribosome, including the cytosolic ribosome (27 genes;
P=3.27×10⁻²⁸), ribosome (34 genes;
P=2.59×10⁻²⁴), ribosomal subunit (26 genes;
P=2.59×10⁻²¹), cytosolic small ribosomal subunit (15
genes; P=3.38×10⁻¹³), MHC protein complex (11 genes;
P=1.03×10⁻⁸) and MHC class I protein complex (6 genes;
P=5.25×10⁻⁵).
In the BP ontology analysis (Fig. 3B), the majority of categories with
significant DEG enrichment were associated with the translation
process, including translational elongation (33 genes;
P=1.28×10⁻³⁵) and translation (37 genes;
P=1.50×10⁻²²). DEGs were also enriched in
immune-associated categories, including immune response (39 genes;
P=1.08×10⁻¹³), antigen processing and presentation (15
genes; P=5.67×10⁻¹²), and antigen processing and
presentation of peptide antigens (9 genes;
P=2.59×10⁻⁹).
In the MF ontology analysis (Fig. 3C), categories with significant
enrichment in DEGs included ribosome structural constituents (31
genes; P=4.67×10⁻²⁶), structural molecule activity (40
genes; P=1.30×10⁻¹⁶), RNA binding (27 genes;
P=1.73×10⁻⁶), MHC class II receptor activity (6 genes;
P=3.43×10⁻⁶) and MHC class I receptor activity (5 genes;
P=5.64×10⁻⁵).
To develop an improved understanding of the function
of genetic differences, pathway analysis was performed with the 274
DEGs (Table II). KEGG pathway terms
with significantly enriched DEGs included the ribosome (30 genes;
P=6.20×10⁻²⁷), antigen processing and presentation (17
genes; P=4.64×10⁻¹¹), and systemic lupus erythematosus
(14 genes; P=4.09×10⁻⁷).
| Table II.Top 5 Kyoto Encyclopedia of Genes and
Genomes pathway terms with significant enrichment in DEGs between
tumor samples from patients with EGFR-activating BRAF mutations and
non-tumor samples. |
Table II.
Top 5 Kyoto Encyclopedia of Genes and
Genomes pathway terms with significant enrichment in DEGs between
tumor samples from patients with EGFR-activating BRAF mutations and
non-tumor samples.
| Term | DEGs, n | P-value |
|---|
| HSA03010:
Ribosome | 30 |
6.20×10⁻²⁷ |
| HSA04612: Antigen
processing and presentation | 17 |
4.64×10⁻¹¹ |
| HSA05322: Systemic
lupus erythematosus | 14 |
4.09×10⁻⁷ |
| HSA05330: Allograft
rejection | 9 |
1.33×10⁻⁶ |
| HSA05332:
Graft-versus-host disease | 9 |
2.54×10⁻⁶ |
DEGs between tumor and non-tumor
samples from melanoma patients
A total of 9 genes (C1QC, calcium-dependent
secretion activator (CADPS), CD74, CLU,
CORO1A, formin 1, HLA-DPA1, HLA-DRA, and
lymphocyte-specific protein 1) were differentially expressed in the
two DEG analyses described above (prior to vs. following treatment,
and tumor vs. non-tumor). The greatest enrichments of DEGs were
identified in the GO category immune process
(P=1.21×10⁻⁶) and the KEGG pathway antigen processing
and presentation (17 genes; P=7.81×10⁻⁴).
DEGs between BRAF V600E mutation
patients with and without EGFR activation
Finally, DEGs between samples taken from tumor and
non-tumor sites of patients with the BRAF V600E mutation of
unknown EGFR activation status from the TCGA cutaneous melanoma
database were analyzed. A total of 27 DGEs changed in the two
groups. GO analysis with DAVID revealed that nine genes were
enriched in the immune response category (P=1.22×10⁻⁶),
and eight genes were enriched in the defense response category
(P=7.96×10⁻⁶).
Discussion
Gene expression alterations in the tumors of
patients with EGFR-activating BRAF V600E mutations prior to and
following BRAF inhibitor treatment were analyzed. Samples taken
from tumor and non-tumor sites in patients with BRAF V600E
mutations of unknown EGFR activation status were also compared. The
functions of DEGs were analyzed by GO annotation and KEGG pathway
enrichment analyses. The study aimed to provide information to
guide the development of novel therapeutic strategies for melanoma
patients with EGFR activation who are resistant to typical
drugs.
RNA-sequencing (RNA-seq) technology is a powerful
tool for analyzing gene expression. Using RNA-seq data for melanoma
patients with EGFR activation, 94 genes were identified that were
differentially expressed in samples prior to and following
treatment, including 62 upregulated and 32 downregulated genes.
Gene functional annotation revealed 30 genes associated with
membranes in CC oncology, which provides a possible direction for
future studies.
Ion channels on the membrane are involved in
numerous tumor cell activities, including cell proliferation,
differentiation, secretion and survival (19,20). A
significant upregulation of CACNA1C
(P=5.00×10⁻⁵), which encodes the α-1 subunit of a
voltage-dependent calcium channel located on the PM (21), was observed; this gene is not
detectable in normal tissues (22).
Calcium channel proteins have been associated with primary tumors
of the colon, lung and skin (23).
Certain drugs targeting CACNA1C, including magnesium sulfate and
nicardipine, have been reported; magnesium sulfate can be used to
inhibit the action potential of muscle cells, thereby reducing the
frequency and strength of contractions (24); nicardipine is a potent calcium channel
inhibitor with important vasodilatory and antihypertensive
characteristics that can be used to enhance the efficacy of certain
antitumor agents (25).
A significant downregulation of solute carrier
family 4 member 10 (SLC4A10) (P=5.00×10⁻⁵), which
belongs to a small family of sodium-coupled bicarbonate
transporters that regulate the intracellular pH of neurons
(25), was also observed. In addition
to unlimited cell proliferation, cancer is characterized by an
altered cellular environment that promotes tumor cell proliferation
and metastasis (26). PH homeostasis
in any cell type is a complicated process. In tumor cells, these
processes are even more complex owing to the internal compartment
being slightly more alkaline (pH 7.4 or more) and the external
compartment being more acidic than in normal cells (27). Downregulation of SLC4A10,
leading to decreased Cl−/HCO3−
transport, may be associated with environmental alterations for
melanoma growth.
A total of 274 genes were identified that were
differentially expressed between untreated EGFR-activated melanoma
samples and non-tumor samples from the TCGA Database. GO and
pathway analyses revealed that numerous genes involved in
immune-associated processes, particularly antigen processing and
presentation processes, were enriched. One enriched gene was
CD74, which encodes a protein associated with the class II
major histocompatibility complex (MHC) and is a chaperone that
regulates antigen presentation. CD74 serves as a cell-surface
receptor for the cytokine macrophage migration inhibitory factor,
which, when bound to the encoded protein, initiates survival
pathways and cell proliferation. A previous study indicated that
CD74 is only expressed in melanoma cells and not in benign
melanocytes (28). Milatuzumab is a
drug used for the treatment of tumors expressing the CD74 antigen
(29).
Antigen presentation serves a key role in the
development of melanoma vaccines (30). Broadly speaking, a tumor cell is also
an antigen-presenting cell. Tumor cells form a complex with MHC
class I molecules via the cytosolic processing pathway, with tumor
antigens on the cell surface being recognized by CD8+ T
cells. Alternatively, tumor cells can form MHC class I or II
molecules by lysosomal processing of tumor antigens from dendritic
cells or specialized antigen-presenting macrophages. These tumor
cells are then recognized by CD8+/CD4+ T
cells (30).
Significant enrichment was observed in numerous
genes associated with ribosomal processes. Ribosome synthesis and
translational control are essential processes for cells. Several
tumor suppressor genes and proto-oncogenes can affect the formation
or modification of ribosomes (31).
However, the mechanisms by which these genes affect ribosomes
remain unclear at present and further experiments are required.
The present study analyzed tumor and non-tumor
samples from patients with BRAF V600E mutations of unknown EGFR
status from the TCGA Database. These results were compared with
DEGs between tumor samples from patients with EGFR-activating BRAF
V600E mutations prior to and following treatment. The expression of
27 genes was altered in both comparisons. These genes were
predominantly enriched in categories associated with immune
response, which suggests that using immunotherapy in the early
stages of melanoma may be a valid therapeutic approach. The
expression of 9 genes was altered when comparing tumor and
non-tumor tissues, and treated and untreated tumors. The majority
of these genes exhibited different changes at different stages: For
example, a gene that was downregulated in the tumor area compared
with the non-tumor area might be upregulated upon acquiring
resistance following treatment. DEGs that were significantly
enriched in the immune process category by GO analysis included
CLU, C1QC, CD74, and HLA-DRA. The C1QC
protein is the target of several drugs, as it is a component of the
human complement system. Studies have associated a lack of C1QA
with lupus and glomerulonephritis (32). Several C1QC-targeting drugs, including
tositumomab, palivizumab and cetuxima, are used clinically to treat
cancer (22). CLU has been
shown to be associated with a number of biological processes,
including apoptosis and tumor development, as well as
neurodegenerative diseases.
The present study has several deficiencies. The
sample size was relatively small, with only 3 samples with EGFR
activation and 1 non-tumor sample; the small sample size may lead
inaccuracies when comparing the tumor and non-tumor samples. In
order to improve the accuracy of the results of the present study,
the authors will continue to collect samples with the relevant
mutations for further research.
In conclusion, the treatment of melanoma is a
complex process. Significant changes were observed in genes
associated with the PM of BRAF inhibitor-resistant melanoma
patients with EGFR-activated tumors prior to and following
treatment. Significant changes in immune process-associated genes
were also identified in melanoma patients between tumor and
non-tumor samples. Although these findings may provide direction
for clinical melanoma-specific therapy, follow-up studies on
melanoma are required.
Acknowledgements
The present study was funded by grants from the
Natural Science Foundation of China (grant nos. 81371719), the
Colleges Pearl River Scholar Funded Scheme (grant no., GDUPS, 2013)
and Guangdong Natural Science Foundation (grant nos.
2014A030312013).
References
|
1
|
Chapman PB, Hauschild A, Robert C, Haanen
JB, Ascierto P, Larkin J, Dummer R, Garbe C, Testori A, Maio M, et
al: Improved survival with vemurafenib in melanoma with BRAF V600E
mutation. N Engl J Med. 364:2507–2516. 2011. View Article : Google Scholar : PubMed/NCBI
|
|
2
|
Clary BM, Brady MS, Lewis JJ and Coit DG:
Sentinel lymph node biopsy in the management of patients with
primary cutaneous melanoma: Review of a large single-institutional
experience with an emphasis on recurrence. Ann Surg. 233:250–258.
2001. View Article : Google Scholar : PubMed/NCBI
|
|
3
|
Davies H, Bignell GR, Cox C, Stephens P,
Edkins S, Clegg S, Teague J, Woffendin H, Garnett MJ, Bottomley W,
et al: Mutations of the BRAF gene in human cancer. Nature.
417:949–954. 2002. View Article : Google Scholar : PubMed/NCBI
|
|
4
|
Flaherty KT, Hodi FS and Fisher DE: From
genes to drugs: Targeted strategies for melanoma. Nat Rev Cancer.
12:349–361. 2012. View
Article : Google Scholar : PubMed/NCBI
|
|
5
|
Hartsough EJ, Basile KJ and Aplin AE:
Beneficial effects of RAF inhibitor in mutant BRAF splice
variant-expressing melanoma. Mol Cancer Res. 12:795–802. 2014.
View Article : Google Scholar : PubMed/NCBI
|
|
6
|
Heidorn SJ, Milagre C, Whittaker S, Nourry
A, Niculescu-Duvas I, Dhomen N, Hussain J, Reis-Filho JS, Springer
CJ, Pritchard C and Marais R: Kinase-dead BRAF and oncogenic RAS
cooperate to drive tumor progression through CRAF. Cell.
140:209–221. 2010. View Article : Google Scholar : PubMed/NCBI
|
|
7
|
Vial E, Sahai E and Marshall CJ: ERK-MAPK
signaling coordinately regulates activity of Rac1 and RhoA for
tumor cell motility. Cancer Cell. 4:67–79. 2003. View Article : Google Scholar : PubMed/NCBI
|
|
8
|
Gautschi O, Pauli C, Strobel K, Hirschmann
A, Printzen G, Aebi S and Diebold J: A patient with BRAF V600E lung
adenocarcinoma responding to vemurafenib. J Thorac Oncol.
7:e23–e24. 2012. View Article : Google Scholar : PubMed/NCBI
|
|
9
|
Das Thakur M, Salangsang F, Landman AS,
Sellers WR, Pryer NK, Levesque MP, Dummer R, McMahon M and Stuart
DD: Modelling vemurafenib resistance in melanoma reveals a strategy
to forestall drug resistance. Nature. 494:251–255. 2013. View Article : Google Scholar : PubMed/NCBI
|
|
10
|
Kalluri R and Zeisberg M: Fibroblasts in
cancer. Nat Rev Cancer. 6:392–401. 2006. View Article : Google Scholar : PubMed/NCBI
|
|
11
|
McMillin DW, Delmore J, Weisberg E, Negri
JM, Geer DC, Klippel S, Mitsiades N, Schlossman RL, Munshi NC, Kung
AL, et al: Tumor cell-specific bioluminescence platform to identify
stroma-induced changes to anticancer drug activity. Nat Med.
16:483–489. 2010. View
Article : Google Scholar : PubMed/NCBI
|
|
12
|
Lovly CM, Dahlman KB, Fohn LE, Su Z,
Dias-Santagata D, Hicks DJ, Hucks D, Berry E, Terry C, Duke M, et
al: Routine multiplex mutational profiling of melanomas enables
enrollment in genotype-driven therapeutic trials. PLoS One.
7:e353092012. View Article : Google Scholar : PubMed/NCBI
|
|
13
|
Chaft JE, Oxnard GR, Sima CS, Kris MG,
Miller VA and Riely GJ: Disease flare after tyrosine kinase
inhibitor discontinuation in patients with EGFR-mutant lung cancer
and acquired resistance to erlotinib or gefitinib: Implications for
clinical trial design. Clin Cancer Res. 17:6298–6303. 2011.
View Article : Google Scholar : PubMed/NCBI
|
|
14
|
Corcoran RB, Ebi H, Turke AB, Coffee EM,
Nishino M, Cogdill AP, Brown RD, Pelle P Della, Dias-Santagata D,
Hung KE, et al: EGFR-mediated re-activation of MAPK signaling
contributes to insensitivity of BRAF mutant colorectal cancers to
RAF inhibition with vemurafenib. Cancer Discov. 2:227–235. 2012.
View Article : Google Scholar : PubMed/NCBI
|
|
15
|
Prahallad A, Sun C, Huang S, Di
Nicolantonio F, Salazar R, Zecchin D, Beijersbergen RL, Bardelli A
and Bernards R: Unresponsiveness of colon cancer to BRAF(V600E)
inhibition through feedback activation of EGFR. Nature.
483:100–103. 2012. View Article : Google Scholar : PubMed/NCBI
|
|
16
|
Sun C, Wang L, Huang S, Heynen GJ,
Prahallad A, Robert C, Haanen J, Blank C, Wesseling J, Willems SM,
et al: Reversible and adaptive resistance to BRAF(V600E) inhibition
in melanoma. Nature. 508:118–122. 2014. View Article : Google Scholar : PubMed/NCBI
|
|
17
|
Trapnell C, Roberts A, Goff L, Pertea G,
Kim D, Kelley DR, Pimentel H, Salzberg SL, Rinn JL and Pachter L:
Differential gene and transcript expression analysis of RNA-seq
experiments with TopHat and Cufflinks. Nat Protoc. 7:562–578. 2012.
View Article : Google Scholar : PubMed/NCBI
|
|
18
|
Robinson MD, McCarthy DJ and Smyth GK:
edgeR: A Bioconductor package for differential expression analysis
of digital gene expression data. Bioinformatics. 26:139–140. 2010.
View Article : Google Scholar : PubMed/NCBI
|
|
19
|
Arcangeli A, Crociani O, Lastraioli E,
Masi A, Pillozzi S and Becchetti A: Targeting ion channels in
cancer: A novel frontier in antineoplastic therapy. Curr Med Chem.
16:66–93. 2009. View Article : Google Scholar : PubMed/NCBI
|
|
20
|
Cheli VT, González DA Santiago, Spreuer V
and Paez PM: Voltage-gated Ca2+ entry promotes oligodendrocyte
progenitor cell maturation and myelination in vitro. Exp Neurol.
265:69–83. 2015. View Article : Google Scholar : PubMed/NCBI
|
|
21
|
Tsavaler L, Shapero MH, Morkowski S and
Laus R: Trp-p8, a novel prostate-specific gene, is up-regulated in
prostate cancer and other malignancies and shares high homology
with transient receptor potential calcium channel proteins. Cancer
Res. 61:3760–3769. 2001.PubMed/NCBI
|
|
22
|
Imming P, Sinning C and Meyer A: Drugs,
their targets and the nature and number of drug targets. Nat Rev
Drug Discov. 5:821–834. 2006. View Article : Google Scholar : PubMed/NCBI
|
|
23
|
Kunzelmann K: Ion channels and cancer. J
Membr Biol. 205:159–173. 2005. View Article : Google Scholar : PubMed/NCBI
|
|
24
|
Chen X, Ji ZL and Chen YZ: TTD:
Therapeutic target database. Nucleic Acids Res. 30:412–415. 2002.
View Article : Google Scholar : PubMed/NCBI
|
|
25
|
Gurnett CA, Veile R, Zempel J, Blackburn
L, Lovett M and Bowcock A: Disruption of sodium bicarbonate
transporter SLC4A10 in a patient with complex partial epilepsy and
mental retardation. Arch Neurol. 65:550–553. 2008. View Article : Google Scholar : PubMed/NCBI
|
|
26
|
Hanahan D and Weinberg RA: Hallmarks of
cancer: The next generation. Cell. 144:646–674. 2011. View Article : Google Scholar : PubMed/NCBI
|
|
27
|
Neri D and Supuran CT: Interfering with pH
regulation in tumours as a therapeutic strategy. Nat Rev Drug
Discov. 10:767–777. 2011. View Article : Google Scholar : PubMed/NCBI
|
|
28
|
Ong GL, Goldenberg DM, Hansen HJ and
Mattes MJ: Cell surface expression and metabolism of major
histocompatibility complex class II invariant chain (CD74) by
diverse cell lines. Immunology. 98:296–302. 1999. View Article : Google Scholar : PubMed/NCBI
|
|
29
|
Kaufman JL, Niesvizky R, Stadtmauer EA,
Chanan-Khan A, Siegel D, Horne H, Wegener WA and Goldenberg DM:
Phase I, multicentre, dose-escalation trial of monotherapy with
milatuzumab (humanized anti-CD74 monoclonal antibody) in relapsed
or refractory multiple myeloma. Br J Haematol. 163:478–486. 2013.
View Article : Google Scholar : PubMed/NCBI
|
|
30
|
Thompson JA, Srivastava MK, Bosch JJ,
Clements VK, Ksander BR and Ostrand-Rosenberg S: The absence of
invariant chain in MHC II cancer vaccines enhances the activation
of tumor-reactive type 1 CD4+ T lymphocytes. Cancer Immunol
Immunother. 57:389–398. 2008. View Article : Google Scholar : PubMed/NCBI
|
|
31
|
Ruggero D and Pandolfi PP: Does the
ribosome translate cancer? Nat Rev Cancer. 3:179–192. 2003.
View Article : Google Scholar : PubMed/NCBI
|
|
32
|
Weening JJ, D'Agati VD, Schwartz MM,
Seshan SV, Alpers CE, Appel GB, Balow JE, Bruijn JA, Cook T,
Ferrario F, et al: The classification of glomerulonephritis in
systemic lupus erythematosus revisited. Kidney Int. 65:521–530.
2004. View Article : Google Scholar : PubMed/NCBI
|