Introduction
Prostate cancer (PCa) is the most common malignancy
among men worldwide (1) as well as
the second leading cause of cancer-associated mortality (2,3). According
to a previous study, PCa resulted in ~256,000 incidences of
mortality in 2010 globally (4). This
type of cancer is caused by a combination of and environmental
factors, including age, ethnicity and diet, and genetic causes
(5). Although PCa is curable in the
early stages by radiation therapy or surgical resection, the
majority of patients with locally advanced or metastatic PCa lack a
curative treatment option (6).
Metastasis, the most common cause of
cancer-associated mortality, represents the final and the most
devastating stage of tumor progression (7). The majority of cancer types originate
from epithelial tissues and, upon metastasis, leave the primary
tumor and invade the adjacent tissue (8). PCa cells may thus spread from the
prostate to other regions of the body. Pelvic lymph node
involvement is the first indication of metastasis in the majority
of cases of PCa, followed by transfers to other organs, including
bones, lungs and liver (9). The
metastasis of PCa to regional lymph nodes is a frequent early event
that is associated with poor clinical treatment (10). Aurora kinase A is overexpressed in
metastatic PCa and is associated with tumor development and
progression (11). In addition, the
expression of extracellular signal-regulated kinase, p38
mitogen-activated protein kinase and c-Jun-N-terminal kinase were
demonstrated to be significantly reduced in metastatic PCa tissue
compared with primary PCa (12). At
present, prostate specific antigen (PSA), encoded by the
prostate-specific gene kallikrein-3 (KLK3), is a serum
biomarker used for the detection of PCa (13). However, the prognostic value of PSA is
limited due to the variation in its specificity and sensitivity
(14). Therefore, it is urgent to
screen for valid biomarkers for metastatic PCa.
The present study investigated the global gene
expression profile of localized and metastatic PCa, and identified
the differentially expressed genes (DEGs) between localized and
metastatic PCa tissue samples. Protein-protein interaction (PPI)
networks were constructed for the DEGs, and pathway analyses of the
PPI networks were performed. Finally, a set of genes associated
with PCa metastasis was identified. The present study aimed to
identify key genes that were involved in the metastasis of PCa and
provide clues for the treatment of PCa, by bioinformatics
methods.
Materials and methods
Affymetrix microarray data
Gene expression profiles (identification no.,
GSE27616) from the study of Kim et al (15), which were deposited in the National
Center for Biotechnology Information Gene Expression Omnibus (GEO)
database (https://www.ncbi.nlm.nih.gov/geo/) were extracted,
including 4 metastatic and 5 localized PCa tissue sample expression
profiles. Raw data had been collected using the Agilent-014850
Whole Human Genome Microarray 4×44K G4112F array platform (Agilent
Technologies, Inc., Santa Clara, CA, USA).
DEGs analysis
The original expression data from all conditions was
scaled using the robust multi-array average (RMA) method (16), with the default settings in
Bioconductor (http://bioconductor.org/help/search/index.html?q=AgiMicroRna)
(17) and a linear model was
constructed. Linear Models for Microarray Data package (18) was applied to identify DEGs. To reduce
the likelihood of false positive results, the Benjamini-Hochberg
method (19) was used to adjust the
raw P-value. Finally, DEGs with the cut-off criteria
[log2 Fold change (FC)]>1 and P<0.05 were
selected.
Gene ontology (GO) and pathway
enrichment analysis
The Database for Annotation, Visualization and
Integrated Discovery (DAVID; version 6.7, http://david.abcc.ncifcrf.gov/) is an annotation tool
that allows for the extraction of biological meaning from a large
list of genes (20). In the present
study, DAVID was used to identify over-represented GO terms in the
biological process category based on the hypergeometric
distribution with a false discovery rate (FDR) <0.05 and gene
count >2. Kyoto Encyclopedia of Genes and Genomes (KEGG) pathway
enrichment analysis was applied to identify the main functional and
metabolic pathways enriched in DEGs from PCa metastasis. P<0.05
was selected as the cut-off criterion.
PPI network construction
To demonstrate potential PPIs, PPI data from the
Human Protein Reference Database (HPRD) (21) and the Biological General Repository
for Interaction Database (BioGRID) (22) were used to identify interactions among
the DEGs. On the basis of this dataset, PPI networks of the DEGs
were constructed in the Search Tool for the Retrieval of
Interacting Gene database (23) using
Cytoscape (version 3.2.0; http://www.cytoscape.org/release_notes_3_2_0.html)
software (24).
Screening and analyses of relevant
regulatory network modules
The functional modules of the network for
downregulated DEGs were investigated with Cluster ONE in Cytoscape
(25). The sub-modules were screened
with a criterion of P<0.01. Finally, the two most significant
sub-modules from the modularity analysis were selected for GO
functional enrichment analysis and KEGG pathway enrichment
analysis.
Results
DEGs between metastatic and localized
PCa cells
To identify DEGs between metastatic and localized
PCa samples, the publicly available microarray dataset GSE27616 was
obtained from the GEO database. DEGs with a (log2
FC)>1 and P<0.05 were identified. A total of 561 DEGs were
obtained, including 208 upregulated genes and 353 downregulated
genes.
KEGG pathway enrichment and GO
analysis of DEGs
KEGG pathway enrichment analyses were performed for
upregulated and downregulated DEGs. The results revealed that the
upregulated DEGs were enriched in ‘renal cell carcinoma’
(P=0.00848), ‘cell cycle’ (P=0.01438) and ‘homologous
recombination’ (P=0.04125; Table I).
The downregulated DEGs were enriched in ‘vascular smooth muscle
contraction’ (P=0.00889), ‘calcium signaling pathway’ (P=0.03116)
and ‘dilated cardiomyopathy’ (P=0.0436; Table II).
 | Table I.Enriched Kyoto Encyclopedia of Genes
and Genomes pathways for the upregulated differentially expressed
genes. |
Table I.
Enriched Kyoto Encyclopedia of Genes
and Genomes pathways for the upregulated differentially expressed
genes.
| Term | Count | P-value | Genes |
|---|
| hsa05211: Renal
cell carcinoma | 5 | 0.00848 | BRAF,
CREBBP, EGLN3, EGLN1, FLCN |
| hsa04110: Cell
cycle | 6 | 0.01438 | CDKN2D,
CREBBP, PKMYT1, CHEK1, CDC20,
PTTG1 |
| hsa03440:
Homologous recombination | 3 | 0.04125 | POLD1,
RAD52, RAD54L |
| Table II.Enriched Kyoto Encyclopedia of Genes
and Genomes pathways for the downregulated differentially expressed
genes. |
Table II.
Enriched Kyoto Encyclopedia of Genes
and Genomes pathways for the downregulated differentially expressed
genes.
| Term | Count | P-value | Genes |
|---|
| hsa04270: Vascular
smooth muscle contraction | 8 | 0.00889 | KCNMA1,
ACTG2, PLA2G4A, PLCB4, ACTA2,
PPP1R12B, MYLK, ITPR2 |
| hsa04020: Calcium
signaling pathway | 9 | 0.03116 | CD38,
SLC8A1, PLCB4, PHKB, PLN, GRPR,
PPP3CB, MYLK, ITPR2 |
| hsa05414: Dilated
cardiomyopathy | 6 | 0.04364 | SLC8A1,
DES, PLN, DMD, TPM2,
CACNA2D2 |
To investigate whether DEGs share specific
functional features, the online biological classification software
DAVID was used to identify overrepresented GO categories in
biological process. Gene count >2 and P<0.05 were selected as
threshold values. There were 48 categories enriched in upregulated
DEGs and 94 categories enriched in downregulated DEGs that met
these criteria. The most frequent GO functions of upregulated DEGs
included ‘response to hypoxia’ (P=2.72×10⁻⁸), ‘response
to oxygen levels’ (P=4.81×10⁻⁸) and ‘cell cycle phase’
(P=6.60×10⁻⁴; Table
III). The GO functions of downregulated DEGs included ‘response
to organic substance’ (P=3.50×10⁻⁵), ‘response to
cytokine stimulus’ (P=2.70×10⁻⁴) and ‘response to
hypoxia’ (P=3.07×10⁻⁴; Table
IV).
| Table III.Top ten enriched GO functions of
upregulated differentially expressed genes. |
Table III.
Top ten enriched GO functions of
upregulated differentially expressed genes.
| GO term | Count | P-value | Genes |
|---|
| 0001666: Response
to hypoxia | 13 |
2.72×10⁻⁸ | ALDOC,
CREBBP, EGLN3, EGLN1, UBE2B,
ADA, DDIT4, ADM, PLOD2,
SERPINA1, SCNN1B, ANGPTL4, MT3 |
| 0070482: Response
to oxygen levels | 13 |
4.81×10⁻⁸ | ALDOC,
CREBBP, EGLN3, EGLN1, UBE2B,
ADA, DDIT4, ADM, PLOD2,
SERPINA1, SCNN1B, ANGPTL4, MT3 |
| 0022403: Cell cycle
phase | 14 |
6.60×10⁻⁴ | PKMYT1,
CDC20, CHEK1, PTTG1, RCC1,
RAD52, RAD54L, KIF2C, CDCA8,
CDKN2D, POLD1, STMN1, CIT,
FANCA |
| 0010033: Response
to organic substance | 19 |
9.65×10⁻⁴ | F12,
EIF2C2, AQP9, ALDOC, TAF9B,
DUOX1, HSPA1A, UBE2B, SDC1,
HSF1, ADM, SLC25A36, ENO2,
HSPA6, HSPB1, SERPINA1, CA2,
ABCC5, SPP1 |
| 0000279: M
phase | 12 | 0.00104 | KIF2C,
CDCA8, PKMYT1, CHEK1, CDC20,
PTTG1, STMN1, CIT, RAD52, RCC1,
RAD54L, FANCA |
| 0006260: DNA
replication | 8 | 0.00508 | RFC4,
POLD1, CDKN2D, CHTF18, CHEK1,
C16ORF75, TK1, CDT1 |
| 0007049: Cell
cycle | 18 | 0.00517 | CKS1B,
PSRC1, PKMYT1, CHEK1, CDC20,
PTTG1, RAD52, RCC1, RAD54L,
CDT1, KIF2C, CDCA8, POLD1,
CDKN2D, CHTF18, STMN1, CIT,
FANCA |
| 0042060: Wound
healing | 8 | 0.00522 | F12,
FGG, SDC1, MST1, ENO3, SERPINA1,
SCNN1B, TM4SF4 |
| 0010035: Response
to inorganic substance | 8 | 0.00761 | FGG,
SDC1, AQP9, DUOX1, SERPINA1,
CA2, ADA, MT3 |
| 0000278: Mitotic
cell cycle | 11 | 0.00785 | KIF2C,
CDCA8, POLD1, CDKN2D, PKMYT1,
CHEK1, CDC20, PTTG1, STMN1, CIT,
RCC1 |
| Table IV.Top ten enriched GO functions of
downregulated differentially expressed genes. |
Table IV.
Top ten enriched GO functions of
downregulated differentially expressed genes.
| GO term | Count | P-value | Genes |
|---|
| 0010033: Response
to organic substance | 28 |
3.50×10⁻⁵ | CCL2,
SNCA, ADH5, PDE3B, PTEN, ASAH1,
STAT6, SORBS1, BCL2, PPP3CB,
SRD5A2, GNG4, EIF2B4, GHR,
KCNMA1, BSG, SLC8A1, SP100,
SOCS2, FBP1, LIFR, COLEC12,
SELS, CYP7B1, CD38, PLA2G4A,
SMPD1, WFDC1 |
| 0034097: Response
to cytokine stimulus | 8 |
2.70×10⁻⁴ | STAT6,
CD38, SP100, BCL2, SNCA, LIFR,
PPP3CB, GHR |
| 0001666: Response
to hypoxia | 10 |
3.07×10⁻⁴ | KCNMA1,
CD38, SLC8A1, SMAD9, CCL2, BCL2,
PSEN2, CABC1, DPP4, ITPR2 |
| 0009266: Response
to temperature stimulus | 8 |
3.67×10⁻⁴ | PLA2G4A,
CCL2, TRPM8, DIO2, BCL2, CIRBP,
GMPR, EIF2B4 |
| 0070482 Response to
oxygen levels | 10 |
4.47×10⁻⁴ | KCNMA1,
CD38, SLC8A1, SMAD9, CCL2, BCL2,
PSEN2, CABC1, DPP4, ITPR2 |
| 0007610
Behavior | 19 |
5.65×10⁻⁴ | KCNMA1,
CCL2, SNCA, CXCL9, ATP1A2, FOSB,
CXCL11, PTEN, CXCL12, SLIT2,
PTGDS, CCR5, BCL2, PSEN2, GRPR,
PTN, PBX3, FGF2, IL1RAPL1 |
| 0006955 Immune
response | 24 |
7.18×10⁻⁴ | GBP5,
SP100, CCL2, GZMA, IGJ, SNCA,
TUBB2C, GPR65, CXCL9, COLEC12,
CXCL11, CXCL12, CLEC10A, IGSF6,
CCR5, BCL2, PSEN2, MS4A2,
HLA-DRB5, HLA-DPB1, SPON2, IL1RAPL1,
ERCC1, RAB27A |
| 0009725 Response to
hormone stimulus | 16 |
8.63×10⁻⁴ | KCNMA1,
BSG, CCL2, SOCS2, FBP1, PDE3B,
PTEN, CD38, PLA2G4A, SORBS1,
BCL2, WFDC1, SRD5A2, GNG4,
EIF2B4, GHR |
| 0042110 T-cell
activation | 9 |
9.58×10⁻⁴ | BCL2,
LCK, PSEN2, PPP3CB, CD2, CXCL12,
DPP4, RAB27A, RHOH |
| 0048511 Rhythmic
process | 9 | 0.00106 | KCNMA1,
CYP7B1, HLF, PLA2G4A, EGR3,
PTGDS, BCL2, LFNG, EIF2B4 |
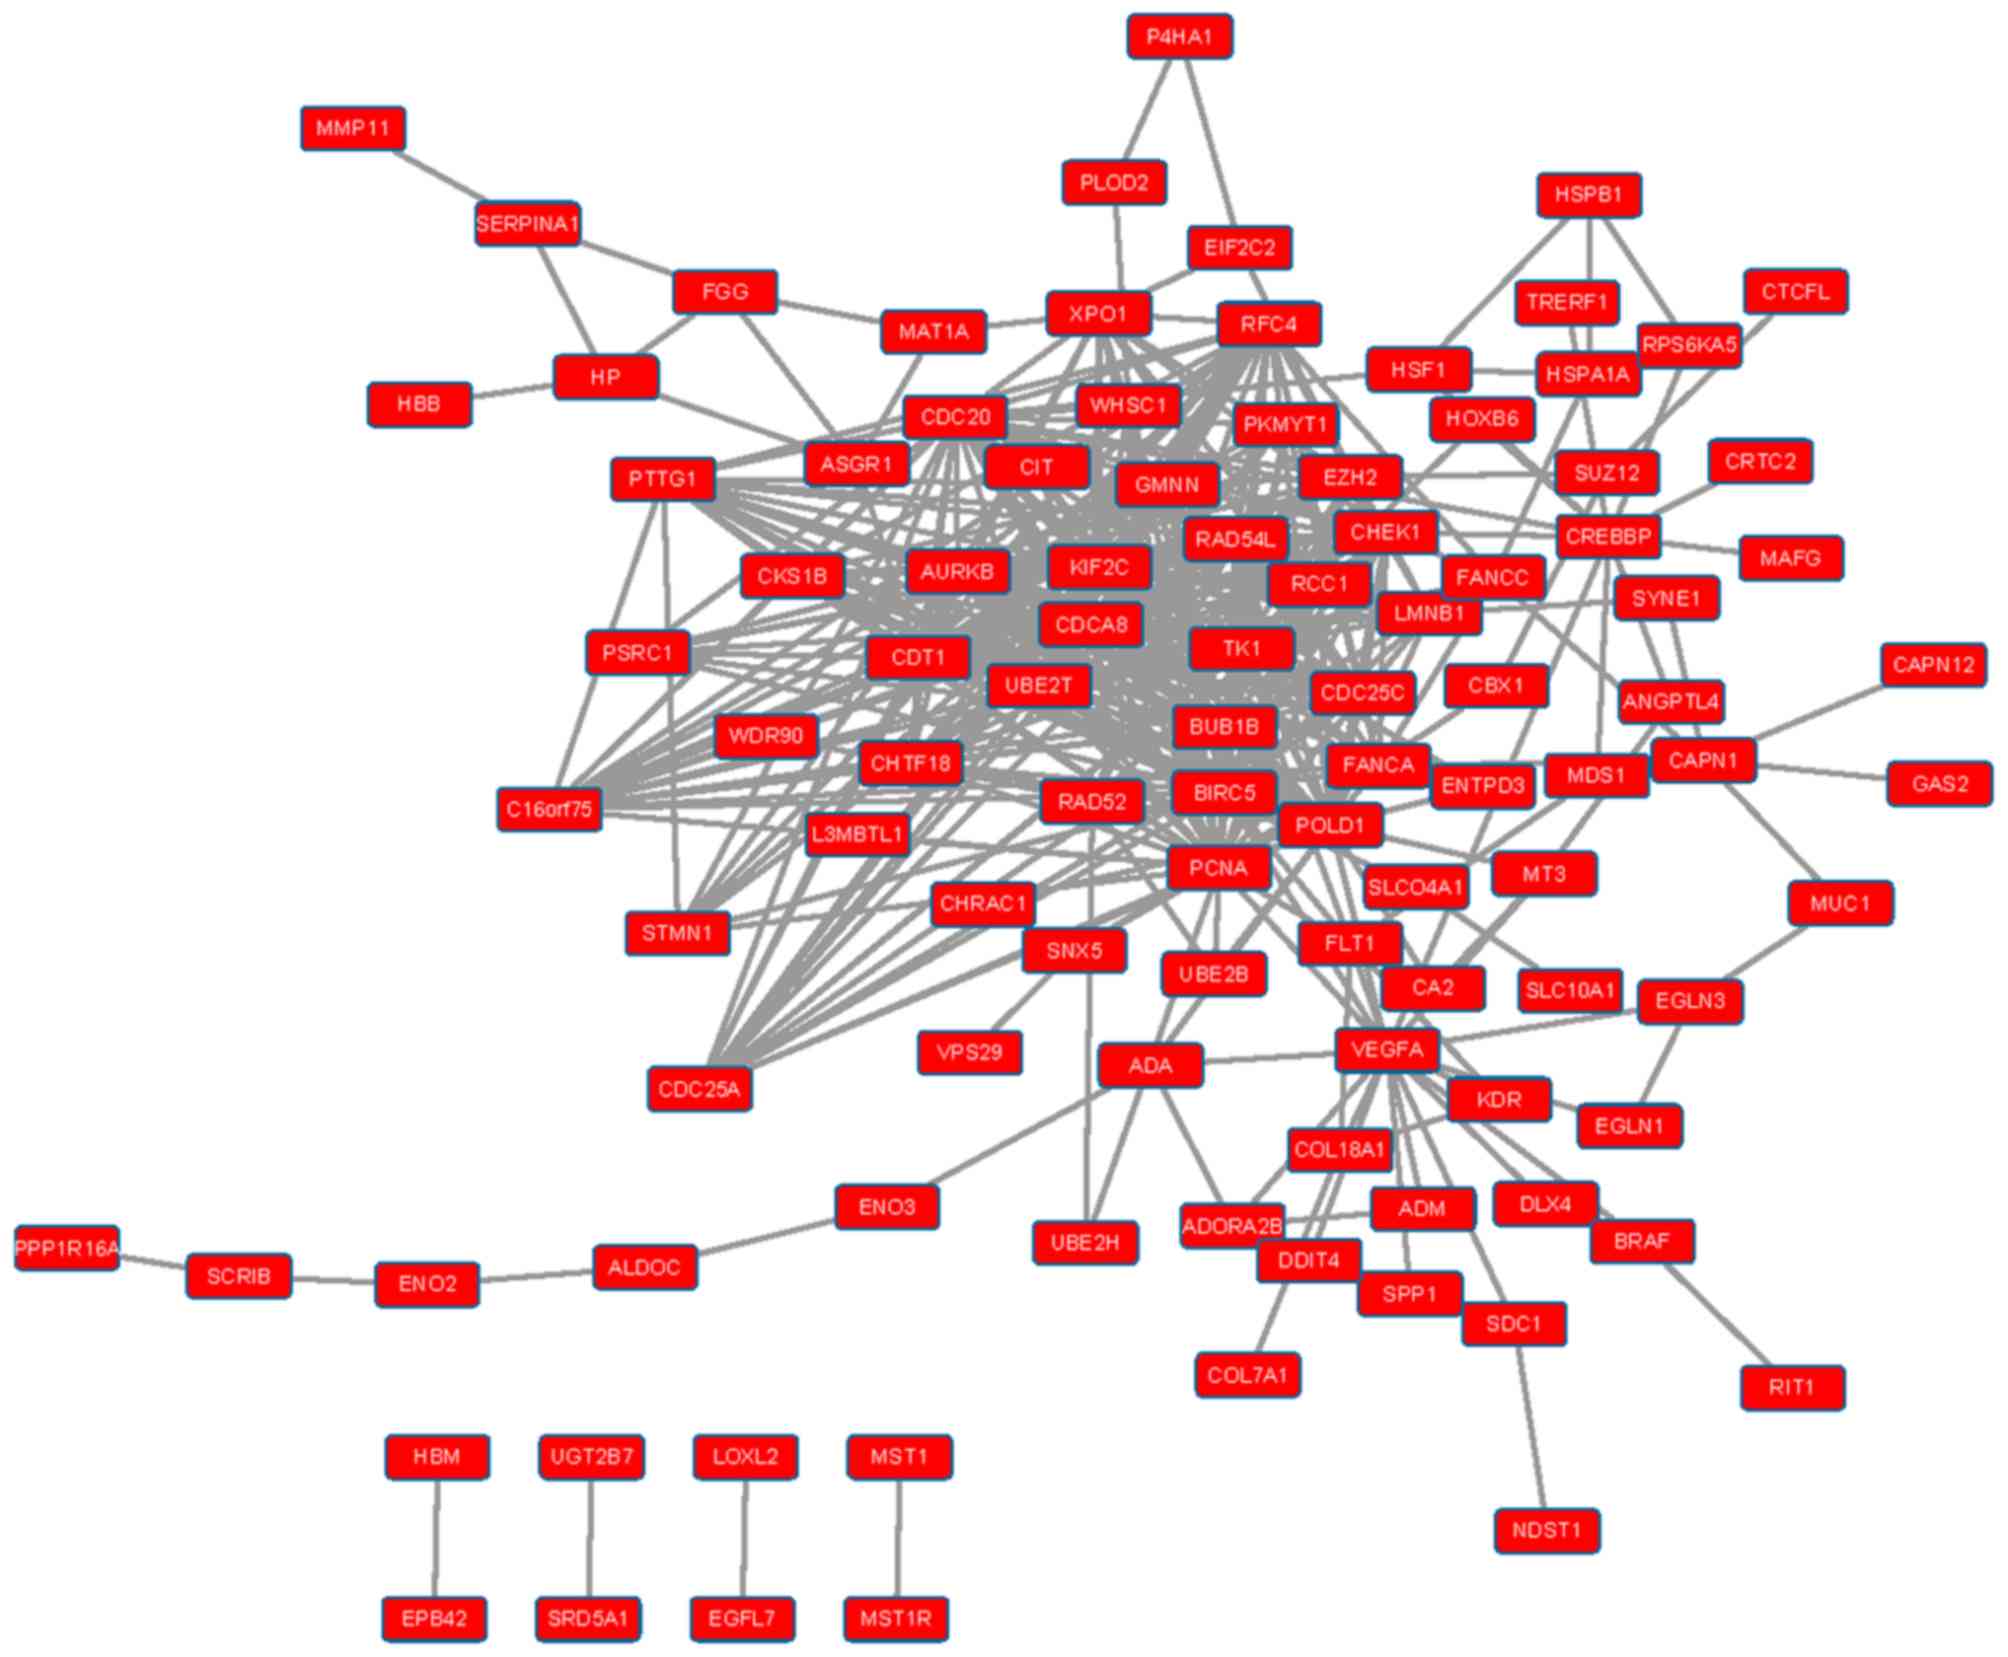
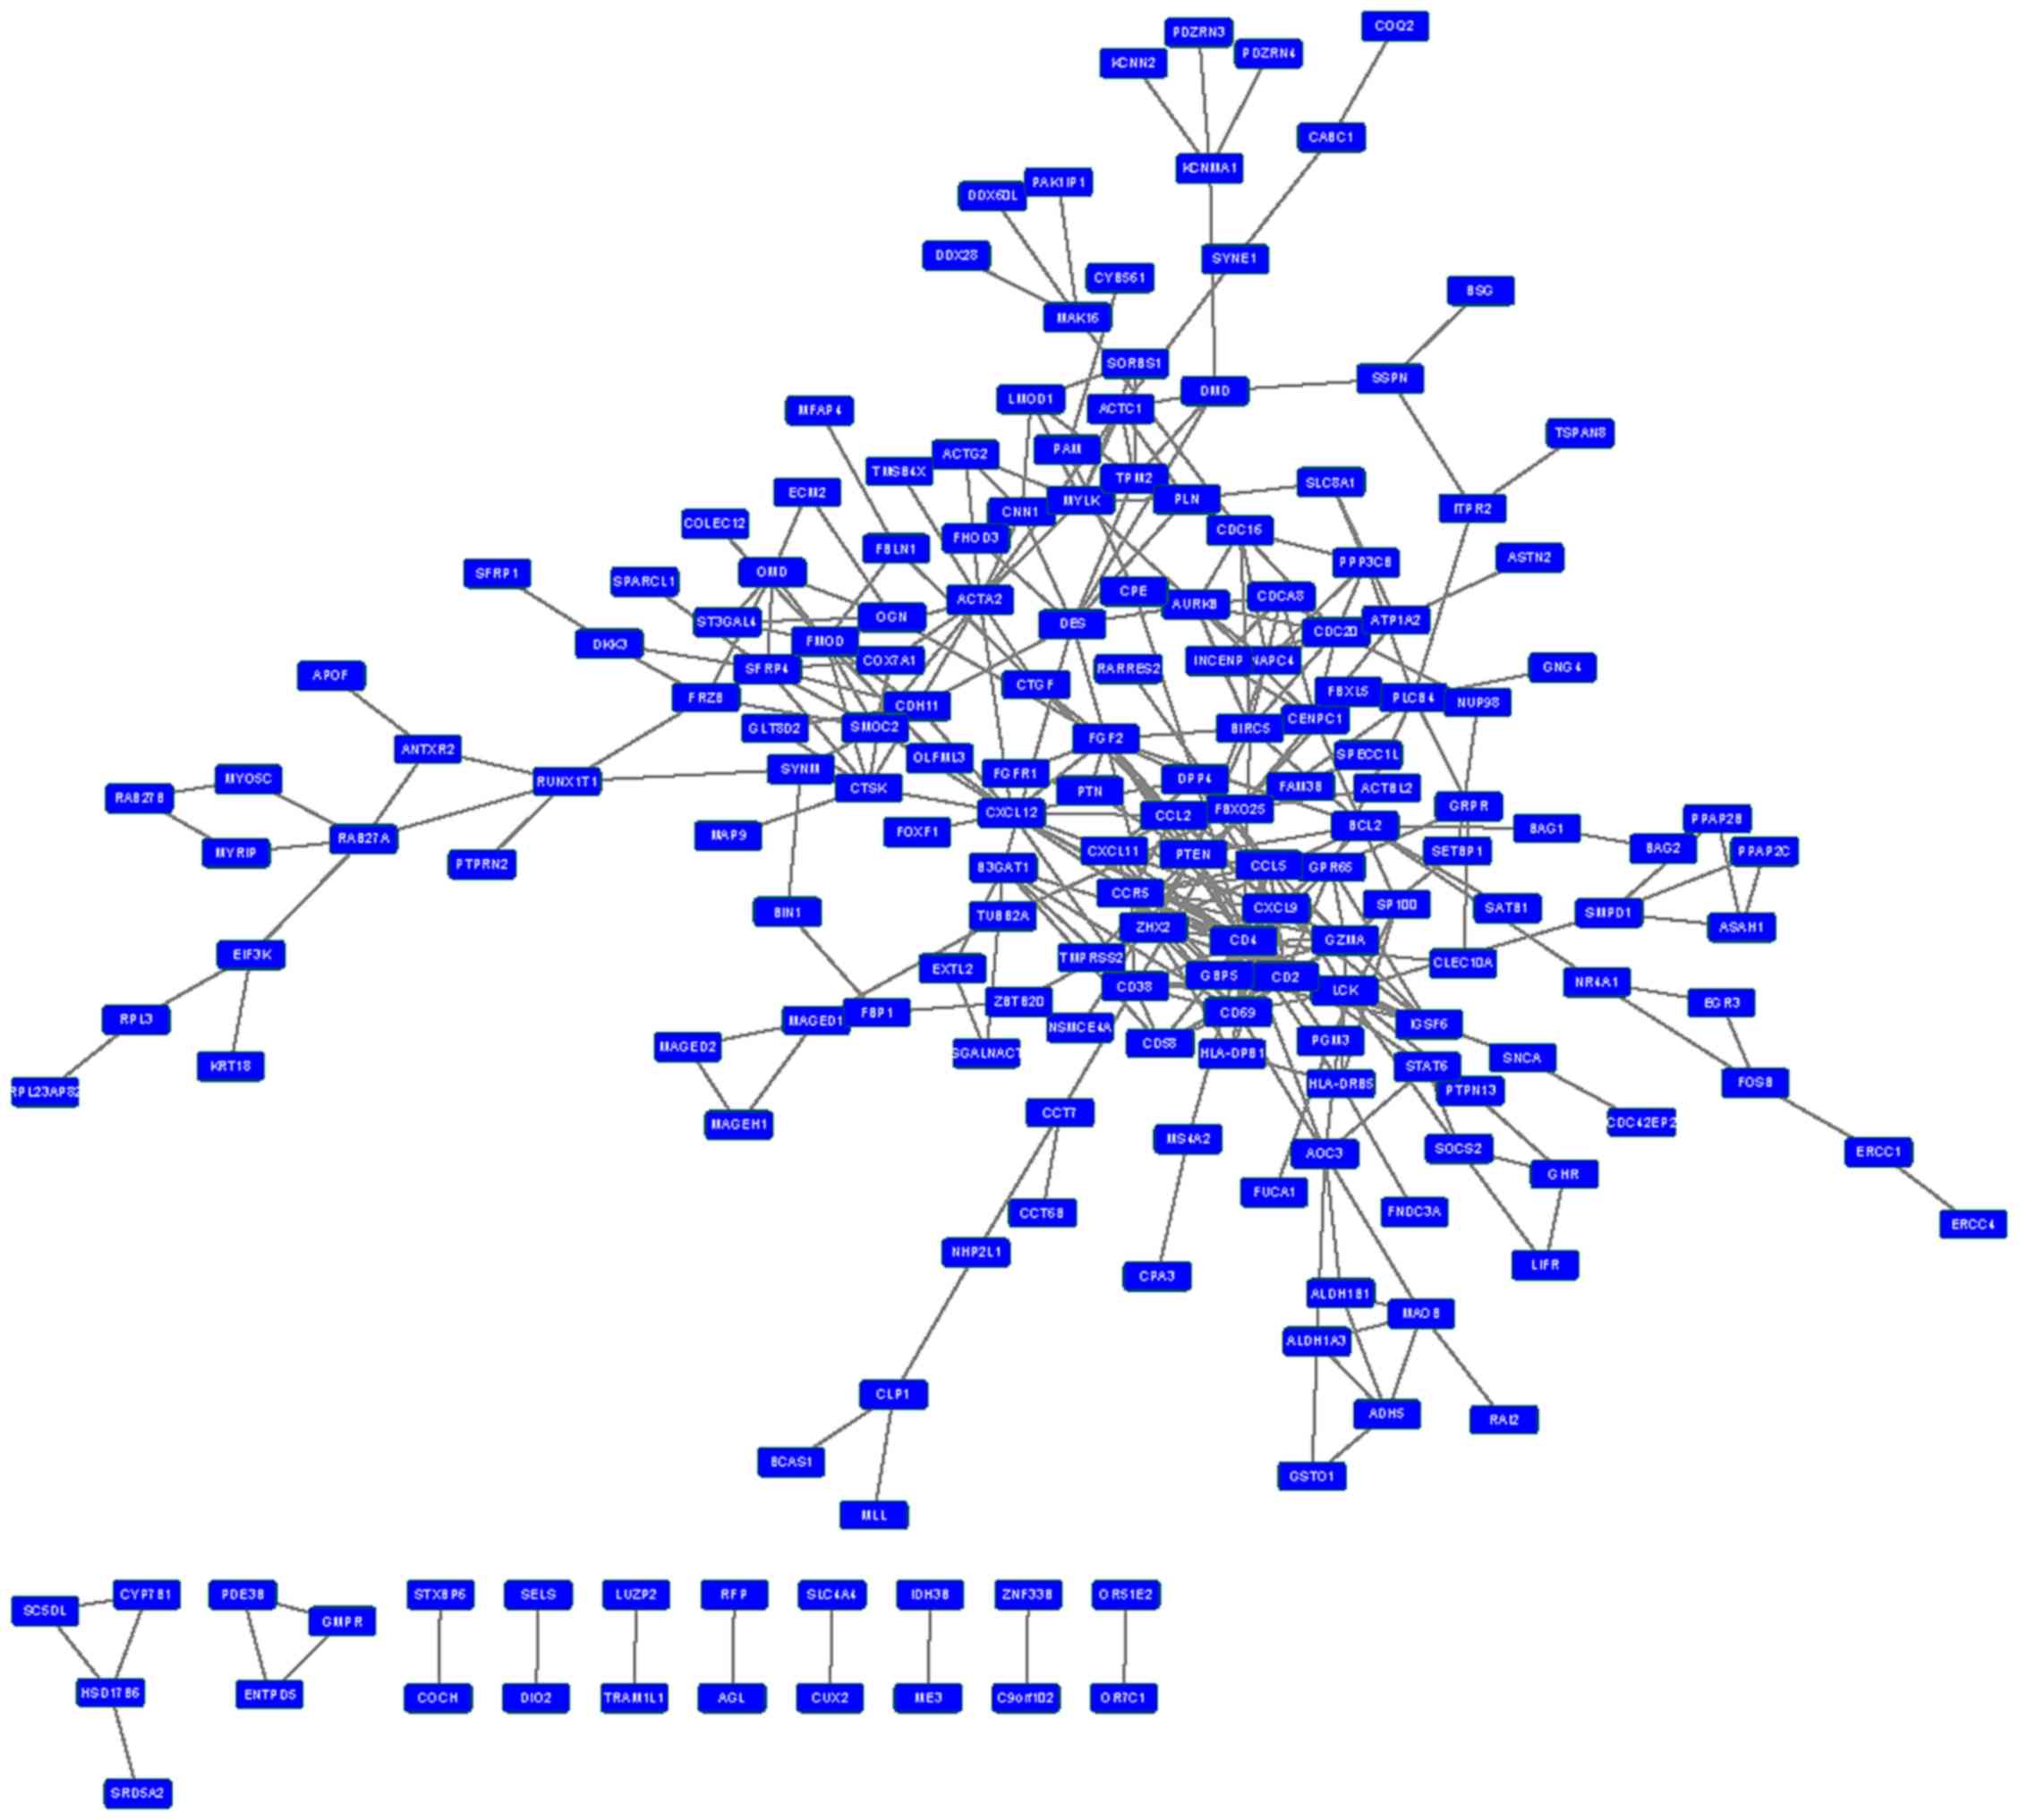
Construction of an integrated PPI
network
PPI interaction data were obtained from HPRD and
BioGRID, and PPI networks were constructed for upregulated and
downregulated DEGs (Figs. 1 and
2). In the PPI network for
upregulated DEGs, the top ten nodes with the highest connectivity
were proliferating cell nuclear antigen (PCNA), cell
division cycle associated 8 (CDCA8), cell division cycle 20
(CDC20), baculoviral IAP repeat containing 5 (BIRC5),
DNA polymerase δ-1, chromatin licensing and DNA replication factor
1, kinesin family member 2C, checkpoint kinase 1, aurora kinase B
(AURKB) and thymidine kinase 1. In the PPI network for
downregulated DEGs, the top ten nodes with the highest connectivity
were CD4, CCR5, LCK, C-X-C motif chemokine
ligand 12 (CXCL12), fibromodulin, fibroblast growth factor
2, CXCL9, CD2, CD69 and CCL5. The
connectivity degree of these proteins was >10 (Table V).
| Table V.Differentially expressed genes with
the top-20 highest connectivity degree in the protein-protein
interaction network. |
Table V.
Differentially expressed genes with
the top-20 highest connectivity degree in the protein-protein
interaction network.
| Status | Gene symbol | Degree |
|---|
| Upregulated | PCNA | 34 |
|
| CDCA8 | 30 |
|
| CDC20 | 30 |
|
| BIRC5 | 30 |
|
| POLD1 | 29 |
|
| CDT1 | 29 |
|
| KIF2C | 28 |
|
| CHEK1 | 28 |
|
| AURKB | 28 |
|
| TK1 | 27 |
|
| RFC4 | 27 |
|
| BUB1B | 27 |
|
| RAD54L | 25 |
|
| UBE2T | 22 |
|
| CDC25C | 21 |
|
| GMNN | 20 |
|
|
C16orf75 | 19 |
|
| PTTG1 | 19 |
|
| EZH2 | 18 |
|
| CDC25A | 18 |
| Downregulated | CD4 | 25 |
|
| CCR5 | 15 |
|
| LCK | 15 |
|
| CXCL12 | 14 |
|
| FMOD | 13 |
|
| FGF2 | 13 |
|
| CXCL9 | 12 |
|
| CD2 | 12 |
|
| CD69 | 12 |
|
| CCL5 | 12 |
|
| PTEN | 11 |
|
| ACTA2 | 11 |
|
| GZMA | 11 |
|
| BIRC5 | 10 |
|
| CCL2 | 9 |
|
| DES | 9 |
|
| CDC20 | 9 |
|
| AURKB | 9 |
|
| SFRP4 | 9 |
|
| MYLK | 9 |
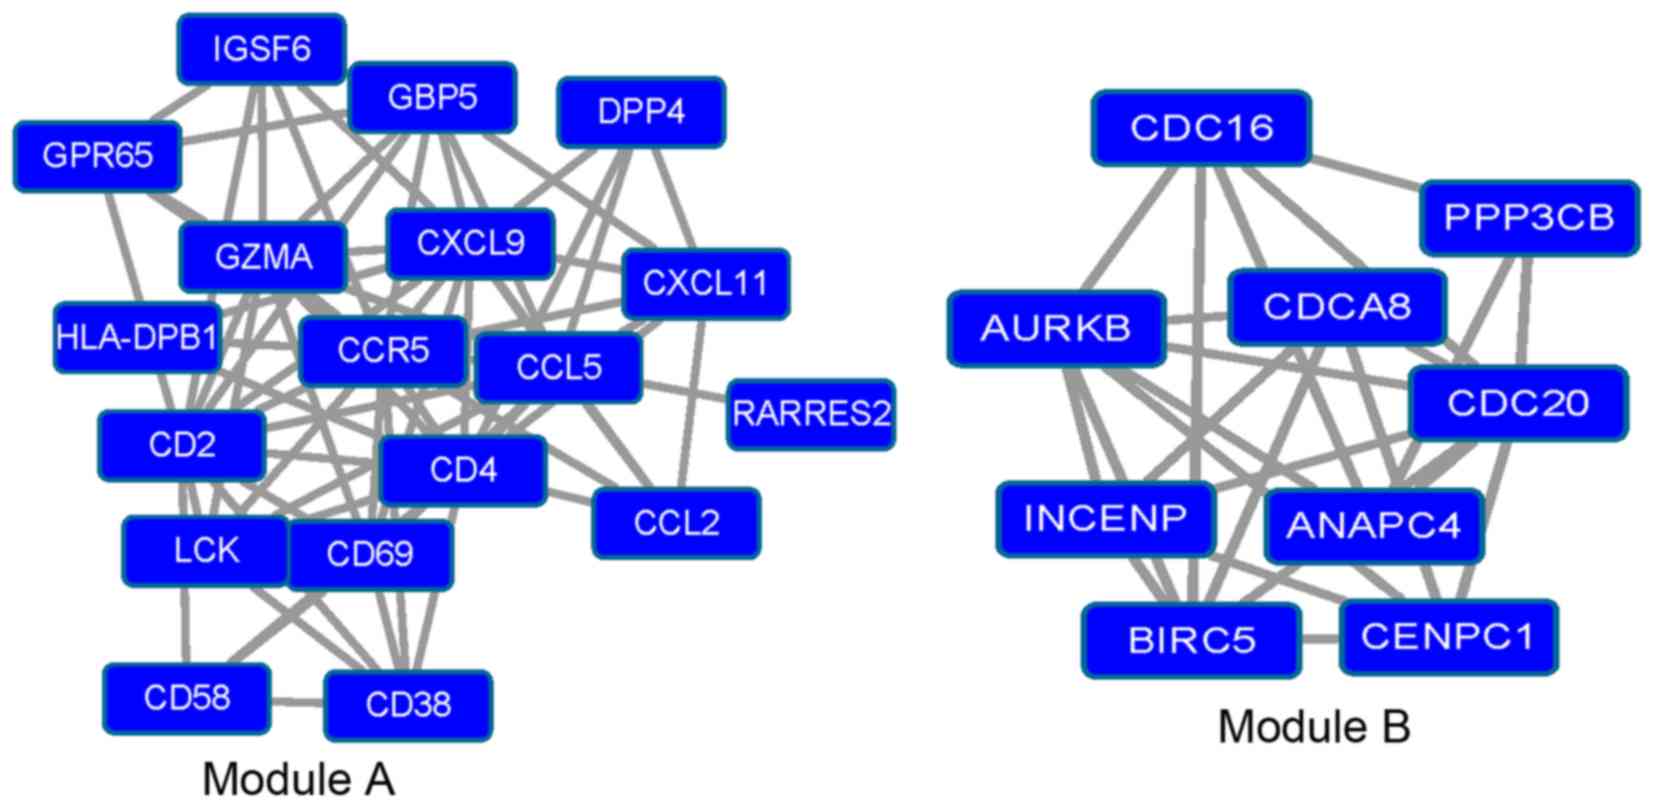
Analysis of modules
Module A (P=3.029×10⁻⁵) and module B
(P=2.901×10⁻⁴; Fig. 3)
were isolated from the PPI network of the downregulated DEGs using
Cluster ONE software. GO and KEGG pathway analysis were then
performed to analyze the modules.
In module A, genes including CCL2,
CCR5, CXCL9, CXCL11 and CCL5 were enriched in
‘chemokine signaling pathway’ (P=4.77×10⁻⁴) and
‘cytokine-cytokine receptor interaction’ (P=0.00171); genes
including CD58, CD2, CD4 and major
histocompatibility complex, class II, DP-β1 (HLA-DPB1) were
enriched in ‘adhesion molecules’ (P=0.00242); genes including
CD38, 2 and 4 were enriched in ‘hematopoietic
cell lineage’ (P=0.01408); genes including CXCL9,
CXCL11 and CCL5 were enriched in ‘toll-like receptor
signaling pathway’ (P=0.01912).
In module B, genes including anaphase promoting
complex subunit 4 (ANAPC4), protein phosphatase 3 catalytic
subunit-β, CDC20 and CDC16 were enriched in ‘oocyte
meiosis’ (P=3.88×10⁻⁵); genes including ANAPC4,
CDC20 and CDC16 were enriched in ‘cell cycle’
(P=0.003482) and ‘ubiquitin mediated proteolysis’ (P=0.004173;
Table VI).
| Table VI.Enriched Kyoto Encyclopedia of Genes
and Genomes pathways for genes in module A and module B. |
Table VI.
Enriched Kyoto Encyclopedia of Genes
and Genomes pathways for genes in module A and module B.
| Module | Term | Count | P-value | Genes |
|---|
| A | hsa04062: Chemokine
signaling pathway | 5 |
4.77×10⁻⁴ | CCL2,
CCR5, CXCL9, CXCL11, CCL5 |
|
| hsa04060:
Cytokine-cytokine receptor interaction | 5 | 0.00171 | CCL2,
CCR5, CXCL9, CXCL11, CCL5 |
|
| hsa04514: Cell
adhesion molecules | 4 | 0.00242 | CD58,
CD2, CD4, HLA-DPB1 |
|
| hsa04640:
Hematopoietic cell lineage | 3 | 0.01408 | CD38,
CD2, CD4 |
|
| hsa04620: Toll-like
receptor signaling pathway | 3 | 0.01912 | CXCL9,
CXCL11, CCL5 |
| B | hsa04114: Oocyte
meiosis | 4 | 3.88
×10−5 | ANAPC4,
PPP3CB, CDC20, CDC16 |
|
| hsa04110: Cell
cycle | 3 | 0.003482 | ANAPC4,
CDC20, CDC16 |
|
| hsa04120: Ubiquitin
mediated proteolysis | 3 | 0.004173 | ANAPC4,
CDC20, CDC16 |
The enriched GO analysis results revealed that the
enriched GO functions for genes in module A were predominantly
enriched in ‘immune response’ (P=6.77×10⁻¹⁰), ‘taxis’
(P=3.07×10⁻⁵) and ‘chemotaxis’ (P=3.07×10⁻⁵).
The enriched GO functions for genes in module B were mainly
enriched in ‘mitotic cell cycle’ (P=1.08×10⁻¹¹), ‘cell
cycle phase’ (P=2.39×10⁻¹¹) and ‘mitosis’
(P=1.19×10⁻¹⁰; Table
VII).
| Table VII.Top ten enriched GO functions for
genes in module A and module B. |
Table VII.
Top ten enriched GO functions for
genes in module A and module B.
| Module | GO term | Count | P-value | Genes |
|---|
| A | 0006955 Immune
response | 11 |
6.77×10⁻¹⁰ | IGSF6,
GBP5, CCL2, CCR5, GZMA, GPR65,
CXCL9, CD4, HLA-DPB1, CXCL11,
CCL5 |
|
| 0042330 Taxis | 5 |
3.07×10⁻⁵ | CCL2,
CCR5, CXCL9, CXCL11, CCL5 |
|
| 0006935
Chemotaxis | 5 |
3.07×10⁻⁵ | CCL2,
CCR5, CXCL9, CXCL11, CCL5 |
|
| 0006874 Cellular
calcium ion homeostasis | 5 |
5.19×10⁻⁵ | CD38,
CCL2, CCR5, LCK, CCL5 |
|
| 0055074 Calcium ion
homeostasis | 5 |
5.77×10⁻⁵ | CD38,
CCL2, CCR5, LCK, CCL5 |
|
| 0006875 Cellular
metal ion homeostasis | 5 |
6.79×10⁻⁵ | CD38,
CCL2, CCR5, LCK, CCL5 |
|
| 0007166 Cell
surface receptor linked signal transductio | 10 |
7.77×10⁻⁵ | IGSF6,
CCL2, CCR5, LCK, GPR65, CD2,
CXCL9, CD4, CXCL11, CCL5 |
|
| 0055065 Metal ion
homeostasis | 5 |
8.08×10⁻⁵ | CD38,
CCL2, CCR5, LCK, CCL5 |
|
| 0030005 Cellular
di-, tri-valent inorganic Cation homeostasis | 5 |
1.20×10⁻⁴ | CD38,
CCL2, CCR5, LCK, CCL5 |
|
| 0055066 Di-,
tri-valent inorganic cation homeostasis | 5 |
1.46×10⁻⁴ | CD38,
CCL2, CCR5, LCK, CCL5 |
| B | 0000278 Mitotic
cell cycle | 8 |
1.08×10⁻¹¹ | CDCA8,
INCENP, ANAPC4, PPP3CB, BIRC5,
CDC20, CDC16, AURKB |
|
| 0022403 Cell cycle
phase | 8 |
2.39×10⁻¹¹ | CDCA8,
INCENP, ANAPC4, PPP3CB, BIRC5,
CDC20, CDC16, AURKB |
|
| 0007067
Mitosis | 7 |
1.19×10⁻¹⁰ | CDCA8,
INCENP, ANAPC4, BIRC5, CDC20, CDC16,
AURKB |
|
| 0000280 Nuclear
division | 7 |
1.19×10⁻¹⁰ | CDCA8,
INCENP, ANAPC4, BIRC5, CDC20,
CDC16, AURKB |
|
| 0000087 M phase of
mitotic cell cycle | 7 |
1.33×10⁻¹⁰ | CDCA8,
INCENP, ANAPC4, BIRC5, CDC20,
CDC16, AURKB |
|
| 0048285 Organelle
fission | 7 |
1.52×10⁻¹⁰ | CDCA8,
INCENP, ANAPC4, BIRC5, CDC20,
CDC16, AURKB |
|
| 0022402 Cell cycle
process | 8 |
2.14×10⁻¹⁰ | CDCA8,
INCENP, ANAPC4, PPP3CB, BIRC5,
CDC20, CDC16, AURKB |
|
| 0051301 Cell
division | 7 |
7.03×10⁻¹⁰ | CDCA8,
INCENP, ANAPC4, BIRC5, CDC20,
CDC16, AURKB |
|
| 0000279
M-phase | 7 |
1.36×10⁻⁹ | CDCA8,
INCENP, ANAPC4, BIRC5, CDC20,
CDC16, AURKB |
|
| 0007049 Cell
cycle | 8 |
1.99×10⁻⁹ | CDCA8,
INCENP, ANAPC4, PPP3CB, BIRC5,
CDC20, CDC16, AURKB |
Discussion
PCa is a relatively common cancer in men, with a
subset ultimately developing metastatic disease to other regions of
the body (25). The severity of the
disease and its clinical heterogeneity, combined with the lack of
effective diagnostic markers and therapeutic strategies, make the
treatment of PCa a major challenge (26,27).
Therefore, it is urgent to screen key genes that are associated
with the metastasis of PCa with the aim of improving its treatment.
The present study used bioinformatics methods to identify the DEGs
between metastatic and localized PCa expression profiles. The
results revealed that the expression of 561 genes (including 208
upregulated and 353 downregulated genes) was altered in metastatic
PCa, compared with localized PCa. PPI networks were then
constructed to reveal the associations among these genes.
Furthermore, two potentially important modules were selected from
the downregulated DEG set and their functions were determined by GO
and KEGG pathway analyses.
The upregulated DEGs were significantly enriched in
‘response to hypoxia’ and ‘response to oxygen levels’. Hypoxia
increases the likelihood of tumor invasion and metastasis by
activating relevant gene expression through the expression of
hypoxia-inducible factor (HIF) (28).
HIF is a transcription factor that responds to changes in the
available oxygen in the cell (29). A
previous study demonstrated that hypoxia may regulate each step in
the process of tumor metastasis, from the initial
epithelial-mesenchymal transition to the final organotropic
colonization (28). Hypoxia also
increases the mRNA expression of lysyl oxidase, which is associated
with the early and later stages of metastasis (30). It also has been reported that hypoxia
promotes cell invasion in PCa cells (31). Thus, these genes may be associated
with the metastasis of PCa.
In addition, it was identified that the
downregulated DEGs were enriched in ‘calcium signaling pathway’.
Calcium, as a ubiquitous second messenger, is an important
signaling molecule that is involved in numerous fundamental
physiological functions, including the cell cycle, apoptosis and
migration (32). Certain human
diseases have been associated with the dysregulation of calcium
homeostasis, including hypertension, diabetes, Alzheimer's disease,
cardiovascular disease and cancer (33,34).
Calcium signaling in cancer cells has been demonstrated to be
associated with events during tumor progression, including
migration, invasion and metastasis (35). Several membrane-bound Ca2+
channels have been reported to have critical roles in regulating
cancer cell migration and malignant metastasis (32,36).
Cationic channels of the transient receptor potential (TRP) family
are considered to be key players in calcium homoeostasis (37). The expression of transient receptor
potential melastain 8 (TRPM8), part of the TRP channel subfamily,
has been demonstrated to reduce the migration of PCa PC-3 cells
(37,38). TRP vanilloid 2, another TRP channel,
enhances PCa cell migration and invasion (39). Therefore, the DEGs enriched in
‘response to hypoxia’ and ‘calcium signaling pathway’ may
contribute to the metastasis of PCa.
Based on the result of a PPI network construction
from the DEGs, it was identified that a number of DEGs may be
linked with others. CD4, LCK and CCR5 had high
degrees of connectivity in the PPI network and were associated with
‘immune system’. It has been reported that a range of T-cell
subsets found in solid tumors are associated with tumor progression
and metastasis (40). CD4
encodes a T-lymphocyte membrane glycoprotein and functions as an
adhesion molecule that binds to non-polymorphic regions of major
histocompatibility complex class II antigens (41,42).
CD4+ cells are involved in the pulmonary metastasis of
mammary carcinoma (43). It has been
reported that the infiltrating CD4+ T cells may promote
PCa metastasis (44). Furthermore,
CD4 was also associated with ‘cell adhesion molecules
(CAMs)’ in module A. CAMs, which belong to the family of membrane
receptors that mediate cell-matrix and cell-cell interactions, are
essential for transducing intracellular signals, which are
responsible for facilitating cell adhesion, invasion, migration and
metastasis (45). LCK is a
member of the Src tyrosine kinase family expressed primarily in T
lymphocytes and natural killer cells (46). LCK localizes to the surface of the
plasma membrane and binds to transmembrane receptors, including CD4
(47). CCR5, a protein on the surface
of white blood cells, has been demonstrated to alter the
proliferation of PCa cells (47). In
the present study, LCK and CCR5 were connected to
CD4 in the PPI network. Therefore, we hypothesize that
CD4, LCK and CCR5 could have important roles
in the metastasis of PCa.
PCNA exhibited a high degree of connectivity
in the PPI network for upregulated DEGs. PCNA belongs to the
family of DNA sliding clamps, is essential for DNA replication and
is associated with DNA repair, chromatin remodeling and epigenetics
(48). The phosphorylation of PCNA is
a frequent event in the development of prostate cancer (49). It was demonstrated that PCNA was
highly expressed in triple-negative breast cancer and associated
with axillary lymph node metastasis (50). Although the regulation of PCNA
function in prostate cancer cells has not been fully characterized,
the data of the present study indicated that PCNA may have a
critical role in PCa metastasis.
GO analysis of module B revealed that the DEGs were
enriched in terms associated with the cell cycle. For example,
BIRC5, CDCA8, inner centromere protein,
ANAPC4, CDC20, CDC16 and AURKB were
enriched in ‘mitosis’, ‘nuclear division’, ‘M phase of mitotic cell
cycle’ and ‘organelle fission’. Cell cycle deregulation is a common
feature of tumors (51). BIRC5
is a member of the inhibitor of apoptosis protein family, which has
a critical role in the occurrence and progression of tumors
(52). BIRC5 has been reported
to be associated with colorectal cancer tumorigenesis and progress
(53). BIRC5, as a component of the
chromosomal passenger complex, is involved in the
microtubule-kinetochore attachment that ensures cohesion between
sister chromatids and centrosome aggregation (54). The regulation of centrosome
coalescence may link mitosis to cell adhesion (55). Therefore, BIRC5 may be
associated with PCa cell metastasis.
There are certain limitations to the present study;
due to the in silico nature of the analysis of the PCa
expression profiles, the obtained results were only forecasted with
contrived criteria. Therefore, a number of important genes may have
been ignored. The absence of experiments verifying the expression
of DEGs was also a limitation in the present study. The limited
sample size may also represent a limitation and restrict the
ability to draw a valid conclusion. Despite these caveats, the
results identified in the present study may provide a novel
stimulus for the further experimental study of PCa metastasis.
The present study analyzed the gene expression
profiles of localized and metastatic PCa tissue using
bioinformatics analysis. It was identified that DEGs, including
CD4, PCNA and BIR5C, may serve roles in
driving the metastasis of PCa. These genes may be novel potential
biomarkers and/or therapeutic targets for patients with PCa.
However, further research is required to confirm these results.
Acknowledgements
The present study was supported by a grant from the
Scientific Research program of Jilin provincial Health department
(grant no. 3D5157343428).
Glossary
Abbreviations
Abbreviations:
|
CAMs
|
cell adhesion molecules
|
|
DAVID
|
database for annotation visualization
and integrated discovery
|
|
DEGs
|
differentially expressed genes
|
|
FDR
|
false discovery rate
|
|
GEO
|
gene expression omnibus
|
|
GO
|
Gene Ontology
|
|
HIF
|
hypoxia inducible factor
|
|
HPRD
|
Human Protein Reference Database
|
|
KEGG
|
Kyoto Encyclopedia of Genes and
Genomes
|
|
PPI
|
protein-protein interaction
|
|
PCa
|
prostate cancer
|
|
PSA
|
prostate specific antigen
|
|
TRP
|
transient receptor potential
|
References
|
1
|
Djulbegovic M, Beyth RJ, Neuberger MM,
Stoffs TL, Vieweg J, Djulbegovic B and Dahm P: Screening for
prostate cancer: Systematic review and meta-analysis of randomised
controlled trials. Bmj. 341:c45432010. View Article : Google Scholar : PubMed/NCBI
|
|
2
|
Henry RY and O'Mahony D: Treatment of
prostate cancer. J Clin Pharm Ther. 24:93–102. 1999. View Article : Google Scholar : PubMed/NCBI
|
|
3
|
Siegel R, Naishadham D and Jemal A: Cancer
statistics, 2012. CA Cancer J Clin. 62:10–29. 2012. View Article : Google Scholar : PubMed/NCBI
|
|
4
|
Lozano R, Naghavi M, Foreman K, Lim S,
Shibuya K, Aboyans V, Abraham J, Adair T, Aggarwal R, Ahn SY, et
al: Global and regional mortality from 235 causes of death for 20
age groups in 1990 and 2010: A systematic analysis for the global
burden of disease study 2010. Lancet. 380:2095–2128. 2012.
View Article : Google Scholar : PubMed/NCBI
|
|
5
|
Abate-Shen C and Shen MM: Molecular
genetics of prostate cancer. Genes Dev. 14:2410–2434. 2000.
View Article : Google Scholar : PubMed/NCBI
|
|
6
|
Hafeez BB, Zhong W, Fischer JW, Mustafa A,
Shi X, Meske L, Hong H, Cai W, Havighurst T, Kim K and Verma AK:
Plumbagin, a medicinal plant (Plumbago zeylanica)-derived
1,4-naphthoquinone, inhibits growth and metastasis of human
prostate cancer PC-3M-luciferase cells in an orthotopic xenograft
mouse model. Mol Oncol. 7:428–439. 2013. View Article : Google Scholar : PubMed/NCBI
|
|
7
|
Pani G, Galeotti T and Chiarugi P:
Metastasis: Cancer cell's escape from oxidative stress. Cancer
Metastasis Rev. 29:351–378. 2010. View Article : Google Scholar : PubMed/NCBI
|
|
8
|
Spano D, Heck C, De Antonellis P,
Christofori G and Zollo M: Molecular networks that regulate cancer
metastasis. Semin Cancer Biol. 22:234–249. 2012. View Article : Google Scholar : PubMed/NCBI
|
|
9
|
Coso S and Williams ED: Prostate Cancer
Lymph Node Metastasis. 2009.
|
|
10
|
Woollard DJ, Opeskin K, Coso S, Wu D,
Baldwin ME and Williams ED: Differential expression of VEGF ligands
and receptors in prostate cancer. Prostate. 73:563–572. 2013.
View Article : Google Scholar : PubMed/NCBI
|
|
11
|
Zhou H, Kuang J, Zhong L, Kuo WL, Gray JW,
Sahin A, Brinkley BR and Sen S: Tumour amplified kinase STK15/BTAK
induces centrosome amplification, aneuploidy and transformation.
Nat Genet. 20:189–193. 1998. View
Article : Google Scholar : PubMed/NCBI
|
|
12
|
Grubb RL, Deng J, Pinto PA, Mohler JL,
Chinnaiyan A, Rubin M, Linehan WM, Liotta LA, Petricoin EF and
Wulfkuhle JD: Pathway biomarker profiling of localized and
metastatic human prostate cancer reveal metastatic and prognostic
signatures. J Proteome Res. 8:3044–3054. 2009. View Article : Google Scholar : PubMed/NCBI
|
|
13
|
Watahiki A and Wang Y, Morris J, Dennis K,
O'Dwyer HM, Gleave M, Gout PW and Wang Y: MicroRNAs associated with
metastatic prostate cancer. PLoS One. 6:e249502011. View Article : Google Scholar : PubMed/NCBI
|
|
14
|
Prensner JR, Rubin MA, Wei JT and
Chinnaiyan AM: Beyond PSA: The next generation of prostate cancer
biomarkers. Sci Transl Med. 4:127rv32012. View Article : Google Scholar : PubMed/NCBI
|
|
15
|
Kim JH, Dhanasekaran SM, Prensner JR, Cao
X, Robinson D, Kalyana-Sundaram S, Huang C, Shankar S, Jing X, Iyer
M, et al: Deep sequencing reveals distinct patterns of DNA
methylation in prostate cancer. Genome Res. 21:1028–1041. 2011.
View Article : Google Scholar : PubMed/NCBI
|
|
16
|
Irizarry RA, Hobbs B, Collin F,
Beazer-Barclay YD, Antonellis KJ, Scherf U and Speed TP:
Exploration, normalization, and summaries of high density
oligonucleotide array probe level data. Biostatistics. 4:249–264.
2003. View Article : Google Scholar : PubMed/NCBI
|
|
17
|
Lopez-Romero P: AgiMicroRna: Processing
and Differential Expression Analysis of Agilent microRNA chips. R
package version 2.24.0. 2016.
|
|
18
|
Smyth GK: Linear models and empirical
bayes methods for assessing differential expression in microarray
experiments. Stat Appl Genet Mol Biol. 3:2004. View Article : Google Scholar : PubMed/NCBI
|
|
19
|
Benjamini Y and Hochberg Y: Controlling
the false discovery rate: A practical and powerful approach to
multiple testing. J Royal Stat Society Series B (Methodological).
57:289–300. 1995.
|
|
20
|
Huang DW, Sherman BT, Tan Q, Kir J, Liu D,
Bryant D, Guo Y, Stephens R, Baseler MW, Lane HC and Lempicki RA:
DAVID bioinformatics resources: Expanded annotation database and
novel algorithms to better extract biology from large gene lists.
Nucleic Acids Res. 35:W169–W175. 2007. View Article : Google Scholar : PubMed/NCBI
|
|
21
|
Keshava Prasad TS, Goel R, Kandasamy K,
Keerthikumar S, Kumar S, Mathivanan S, Telikicherla D, Raju R,
Shafreen B, Venugopal A, et al: Human protein reference
database-2009 update. Nucleic Acids Res. 37(Database issue):
D767–D772. 2009. View Article : Google Scholar : PubMed/NCBI
|
|
22
|
Chatr-aryamontri A, Breitkreutz BJ,
Heinicke S, Boucher L, Winter A, Stark C, Nixon J, Ramage L, Kolas
N, O'Donnell L, et al: The BioGRID interaction database: 2013
update. Nucleic Acids Res. 41(Database issue): D816–D823.
2013.PubMed/NCBI
|
|
23
|
Franceschini A, Szklarczyk D, Frankild S,
Kuhn M, Simonovic M, Roth A, Lin J, Minguez P, Bork P, von Mering C
and Jensen LJ: STRING v9.1: Protein-protein interaction networks,
with increased coverage and integration. Nucleic Acids Res.
41(Database issue): D808–D815. 2013.PubMed/NCBI
|
|
24
|
Shannon P, Markiel A, Ozier O, Baliga NS,
Wang JT, Ramage D, Amin N, Schwikowski B and Ideker T: Cytoscape: A
software environment for integrated models of biomolecular
interaction networks. Genome Res. 13:2498–2504. 2003. View Article : Google Scholar : PubMed/NCBI
|
|
25
|
Lee KC, Bradley DA, Hussain M, Meyer CR,
Chenevert TL, Jacobson JA, Johnson TD, Galban CJ, Rehemtulla A,
Pienta KJ and Ross BD: A feasibility study evaluating the
functional diffusion map as a predictive imaging biomarker for
detection of treatment response in a patient with metastatic
prostate cancer to the bone. Neoplasia. 9:1003–1011. 2007.
View Article : Google Scholar : PubMed/NCBI
|
|
26
|
Perabo F, Von Löw E, Ellinger J, Von
Rücker A, Müller S and Bastian P: Soy isoflavone genistein in
prevention and treatment of prostate cancer. Prostate Cancer
Prostatic Dis. 11:6–12. 2007. View Article : Google Scholar : PubMed/NCBI
|
|
27
|
Shen MM and Abate-Shen C: Molecular
genetics of prostate cancer: New prospects for old challenges.
Genes Dev. 24:1967–2000. 2010. View Article : Google Scholar : PubMed/NCBI
|
|
28
|
Lu X and Kang Y: Hypoxia and
hypoxia-inducible factors: Master regulators of metastasis. Clin
Cancer Res. 16:5928–5935. 2010. View Article : Google Scholar : PubMed/NCBI
|
|
29
|
Smith TG, Robbins PA and Ratcliffe PJ: The
human side of hypoxia-inducible factor. Br J Haematol. 141:325–334.
2008. View Article : Google Scholar : PubMed/NCBI
|
|
30
|
Erler JT and Giaccia AJ: Lysyl oxidase
mediates hypoxic control of metastasis. Cancer Res. 66:10238–10241.
2006. View Article : Google Scholar : PubMed/NCBI
|
|
31
|
Bae K, Dai Y, Vieweg J and Siemann D:
Hypoxia increases the expression of stem-cell markers and promotes
cell invasion in prostate cancer cells. Cancer Res. 71:4852011.
View Article : Google Scholar
|
|
32
|
Chen YF, Chen YT, Chiu WT and Shen MR:
Remodeling of calcium signaling in tumor progression. J Biomed Sci.
20:232013. View Article : Google Scholar : PubMed/NCBI
|
|
33
|
Rizzuto R and Pozzan T: When calcium goes
wrong: Genetic alterations of a ubiquitous signaling route. Nat
Genet. 34:135–141. 2003. View Article : Google Scholar : PubMed/NCBI
|
|
34
|
Parekh AB: Store-operated CRAC channels:
Function in health and disease. Nat Rev Drug Discov. 9:399–410.
2010. View Article : Google Scholar : PubMed/NCBI
|
|
35
|
Monteith GR, Davis FM and Roberts-Thomson
SJ: Calcium channels and pumps in cancer: Changes and consequences.
J Biol Chem. 287:31666–31673. 2012. View Article : Google Scholar : PubMed/NCBI
|
|
36
|
Prevarskaya N, Skryma R and Shuba Y:
Calcium in tumour metastasis: New roles for known actors. Nat Rev
Cancer. 11:609–618. 2011. View Article : Google Scholar : PubMed/NCBI
|
|
37
|
Yang ZH, Wang XH, Wang HP and Hu LQ:
Effects of TRPM8 on the proliferation and motility of prostate
cancer PC-3 cells. Asian J Androl. 11:157–165. 2009. View Article : Google Scholar : PubMed/NCBI
|
|
38
|
Gkika D, Flourakis M, Lemonnier L and
Prevarskaya N: PSA reduces prostate cancer cell motility by
stimulating TRPM8 activity and plasma membrane expression.
Oncogene. 29:4611–4616. 2010. View Article : Google Scholar : PubMed/NCBI
|
|
39
|
Monet M, Lehen'kyi V, Gackiere F, Firlej
V, Vandenberghe M, Roudbaraki M, Gkika D, Pourtier A, Bidaux G,
Slomianny C, et al: Role of cationic channel TRPV2 in promoting
prostate cancer migration and progression to androgen resistance.
Cancer Res. 70:1225–1235. 2010. View Article : Google Scholar : PubMed/NCBI
|
|
40
|
Grivennikov SI, Greten FR and Karin M:
Immunity, inflammation, and cancer. Cell. 140:883–899. 2010.
View Article : Google Scholar : PubMed/NCBI
|
|
41
|
Littman DR: The structure of the CD4 and
CD8 genes. Annu Rev Immunol. 5:561–584. 1987. View Article : Google Scholar : PubMed/NCBI
|
|
42
|
Foti M, Phelouzat MA, Holm A, Rasmusson BJ
and Carpentier JL: p56Lck anchors CD4 to distinct microdomains on
microvilli. Proc Natl Acad Sci USA. 99:pp. 2008–2013. 2002;
View Article : Google Scholar : PubMed/NCBI
|
|
43
|
DeNardo DG, Barreto JB, Andreu P, Vasquez
L, Tawfik D, Kolhatkar N and Coussens LM: CD4(+) T cells regulate
pulmonary metastasis of mammary carcinomas by enhancing protumor
properties of macrophages. Cancer Cell. 16:91–102. 2009. View Article : Google Scholar : PubMed/NCBI
|
|
44
|
Hu S, Li L, Yeh S, Cui Y, Li X, Chang HC,
Jin J and Chang C: Infiltrating T cells promote prostate cancer
metastasis via modulation of FGF11->miRNA-541->androgen
receptor (AR)->MMP9 signaling. Mol Oncol. 9:44–57. 2015.
View Article : Google Scholar : PubMed/NCBI
|
|
45
|
Li DM and Feng YM: Signaling mechanism of
cell adhesion molecules in breast cancer metastasis: Potential
therapeutic targets. Breast Cancer Res Trea. 128:7–21. 2011.
View Article : Google Scholar
|
|
46
|
Hawash IY, Hu XE, Adal A, Cassady JM,
Geahlen RL and Harrison ML: The oxygen-substituted palmitic acid
analogue, 13-oxypalmitic acid, inhibits Lck localization to lipid
rafts and T cell signaling. Biochim Biophys Acta. 1589:140–150.
2002. View Article : Google Scholar : PubMed/NCBI
|
|
47
|
Vaday GG, Peehl DM, Kadam PA and Lawrence
DM: Expression of CCL5 (RANTES) and CCR5 in prostate cancer.
Prostate. 66:124–134. 2006. View Article : Google Scholar : PubMed/NCBI
|
|
48
|
Moldovan GL, Pfander B and Jentsch S:
PCNA, the maestro of the replication fork. Cell. 129:665–679. 2007.
View Article : Google Scholar : PubMed/NCBI
|
|
49
|
Zhao H, Lo YH, Ma L, Waltz SE, Gray JK,
Hung MC and Wang SC: Targeting tyrosine phosphorylation of PCNA
inhibits prostate cancer growth. Mol Cancer Ther. 10:29–36. 2011.
View Article : Google Scholar : PubMed/NCBI
|
|
50
|
Jiaping P: Abstract B104: Expressions of
PCNA in triple negative breast cancers and Their clinical
significance. Cancer Prev Res. 5:B1042012. View Article : Google Scholar
|
|
51
|
Malumbres M and Barbacid M: Cell cycle,
CDKs and cancer: A changing paradigm. Nat Rev Cancer. 9:153–166.
2009. View Article : Google Scholar : PubMed/NCBI
|
|
52
|
Altieri DC: Survivin, cancer networks and
pathway-directed drug discovery. Nat Rev Cancer. 8:61–70. 2008.
View Article : Google Scholar : PubMed/NCBI
|
|
53
|
Wang H, Zhang X, Wang L, Zheng G, Du L,
Yang Y, Dong Z, Liu Y, Qu A and Wang C: Investigation of cell free
BIRC5 mRNA as a serum diagnostic and prognostic biomarker for
colorectal cancer. J Surg Oncol. 109:574–579. 2014. View Article : Google Scholar : PubMed/NCBI
|
|
54
|
Vitale I, Galluzzi L, Senovilla L, Criollo
A, Jemaà M, Castedo M and Kroemer G: Illicit survival of cancer
cells during polyploidization and depolyploidization. Cell Death
Differ. 18:1403–1413. 2010. View Article : Google Scholar : PubMed/NCBI
|
|
55
|
Kwon M, Godinho SA, Chandhok NS, Ganem NJ,
Azioune A, Thery M and Pellman D: Mechanisms to suppress multipolar
divisions in cancer cells with extra centrosomes. Genes Dev.
22:2189–2203. 2008. View Article : Google Scholar : PubMed/NCBI
|