Introduction
Imatinib mesylate (IM) is a targeted drug, which is
specific for the treatment of gastrointestinal stromal tumours
(GISTs) and is the standard first-line treatment for patients with
unresectable primary GISTs or metastasized recurrent GISTs
(1). IM can competitively inhibit the
binding of ATP by binding to the ATP-binding site of the tyrosine
kinase receptor, which inhibits a variety of tyrosine kinases,
inhibits signal transduction, suppresses tumour growth, and can
treat disease (2,3).
Although numerous patients have benefitted from IM,
certain patients are primarily resistant to IM, and the majority of
patients exhibit drug resistance within 18–24 months, which leads
to disease progression and patients even succumbing to mortality
(4). To date, the mechanism
underlying this resistance remains to be elucidated (5–9). The
occurrence of drug resistance is the main reason for the failure of
GIST treatment; therefore, investigations of the resistance
mechanisms are currently a focus of investigations on GISTs. In the
present study, the GIST-T1 cell line was used to establish a
GIST-T1-resistant cell line (GIST-T1 IR) by intermittent dosing
with increasing IM concentrations.
Materials and methods
Cell culture
GIST-T1 cells (IFO 50075; Human Science Research
Resource Bank, Osaka, Japan) were cultured in RPMI 1640 (Gibco;
Thermo Fisher Scientific, Inc., Waltham, MA, USA) medium containing
15% foetal bovine serum (TransGene Biotech, Beijing, China) and
incubated at 37°C with 5% CO2.
Induction of drug-resistant cells
To intermittently dose the cells with increasing IM
concentrations, drug-containing medium was applied to the cells in
the logarithmic growth phase. Following culturing for 48 h, the
medium was replaced with drug-free medium. The cells were then
passaged until confluent. The administration of the specific IM
concentration was continued until the cells grew normally.
Subsequently, the concentration was increased and the above process
was repeated to obtain a drug-resistant cell line through repeated
induction. The CCK-8 assay results (Dojindo Molecular Technologies,
Inc., Kumamoto, Japan) revealed that the half maximal inhibitory
concentration (IC50) was 10 µM. The drug administration
for induction was initiated at a concentration of
2.5×10⁴ of the IC50 (25 µM) followed by 37.5
µM and a gradual increase to 50 µM.
Cellular morphological
observation
Hematoxylin and eosin (H&E) staining at 25°C for
3 min, was performed on slides containing adherent cells for the
morphological observation of the cells and to observe changes in
the nuclei stained by Hematoxylin under an inverted microscope.
Determination of the cell growth curve
and calculation of the doubling time
The two types of cells were digested with trypsin
solution when they reached a confluence of 90% under a microscope
and seeded into 24-well plates at a concentration of
5×10⁴ cells/ml. The living cells were counted every 24 h
for 5 days consecutively, and the results of three wells were
averaged. The growth curve was prepared with the results of the
daily cell counting. The majority of the cell proliferation was
‘two division’. All data were fit into an exponential fitting model
in SSPS 20.0 software (IBM SPSS, Armonk, NY, USA), according to the
following formula: Y=aebtln2, where Y is the number of
cells, t is the time of continuous culture, and a and b are curve
constants. The cell doubling cycle was calculated using the
following equation: T=t × lg2/lg (Nt/N0),
where T is the population doubling time, t is the time of
continuous culture, Nt is the final number of cells, and
N0 is the initial number of cells. All time was measured
in hours.
Cell scratch assay
The GIST-T1 and GIST-T1 IR cells were digested with
trypsin for passage when they reached a confluence of 80–90% to
obtain 70% confluence at 12 h. An even scratch was introduced onto
the bottom of the culture plate, which was followed by two PBS
washes. The media were then replaced with complete medium
containing 2% FBS and the drug at a concentration of 0 or 25
µM.
Determination of the cell cycle
The GIST-T1 and GIST-T1 IR cells in the logarithmic
growth phase were digested with trypsin and centrifuged at 3,800 ×
g and 4°C for 3 min. Ice-cold 75% ethanol was added, followed by
incubation at 4°C overnight for fixation. Following centrifugation
at 3,800 × g and 4°C for 3 min, the supernatant was discarded.
Following washing twice and resuspension in PBS, propidium iodide
(PI) and RNase were added, and the cells were incubated at 4°C in
the dark for 30 min. Subsequently, the sample was centrifuged at
3,800 × g and 4°C for 3 min and the supernatant was discarded.
Following washing once with PBS, the sample was transferred into a
flow cytometry tube for detection on the instrument.
Determination of the IC50
for the two cell lines with the CCK-8 assay and calculation of the
resistance index (RI)
The GIST-T1 and GIST-T1 IR cells in the logarithmic
growth phase were digested with trypsin and resuspended following
centrifugation. The cell density was adjusted to 5,000 cells/100
µl. A 100-µl cell suspension was added to each well. When the cells
were adherent, the GIST-T1 cell medium was replaced with fresh
medium containing 2.5, 10, 15, 20, 25, 30, 40 or 50 µM IM. The
GIST-TI IR cell medium was replaced with fresh medium containing 5,
25, 30, 35, 40, 50, 62.5 or 75 µM IM. Six duplicate wells were set
up for each concentration, and all experiments included a drug-free
control and a blank control. Following culture for 48 h under the
same conditions, 10 µl of the CCK-8 reagent was added to each well.
The absorbance was measured following incubation for 1 h. The
IC50 values were calculated using Graph Pad Prism 6
software (GraphPad Software, Inc., La Jolla, CA, USA). The dose
response (variable slope) model in GraphPad Prism 6 software was
used to fit the cell inhibition rate curve. The equation was as
follows:
Y=Bottom + (Top-Bottom)/(1 + 10
^((LogIC50-X)*HillSlope))
IC50 is the concentration of agonist,
which results in a response halfway between Bottom and Top.
HillSlope describes the steepness of the family of curves. Top and
Bottom are plateaus in the units of the Y axis.
Statistical analysis
All data were statistically analyzed using SPSS 20.0
software (IBM Corps., Chicago, IL, USA) and GraphPad Prism 6.0
(GraphPad Software, Inc.). The results are presented as the mean ±
standard deviation. Comparison of different groups was performed by
one-way analysis of variance, followed by Tukey's post-hoc test for
multiple comparisons. The dose response (variable slope) model in
GraphPad Prism 6 software was used to fit the cell inhibition rate
curve and the exponential fitting model in SSPS 20.0 software was
used to fit the cell growth curve. P<0.05 was considered to
indicate a statistically significant difference.
Results
Establishment of the IM-resistant
GIST-T1 IR cell line
The GIST-T1 cells were continuously cultured with
media containing various concentrations of IM for 48 h. The cells
were observed and recorded at 24 and 48 h. Based on the above
preliminary experiment and considering a variety of factors,
treatment with 25 µM IM for 48 h was selected as the starting
condition for the experiment. Following repeated treatments with
stepwise increases in the drug concentration over 6 months, an
IM-resistant GIST-T1 IR cell line was successfully induced. No
significant change in RI was found following continuous cultured of
the cells in the drug-free medium for 1 month. In addition, GIST-T1
IR cells thawed following cryopreservation remained drug-resistant
without a statistically significant change in IC50
value, which suggested that the resistance of the GIST-T1 IR cells
was stable. Therefore, these cells can be used as a model for
studies investigating drug resistance.
Following induction with IM at 25 and 37.5 µM
concentrations, the concentration was gradually increased to 50 µM.
When the cells became stable, an appropriate concentration gradient
of the drug was determined in a preliminary experiment. The
IC50 concentrations of the parental cells and the
resistant cells were repeatedly detected to determine the drug
resistance of the cells. As shown in Fig.
1A and B, the mean IC50 of the parental cells was
10.5±0.12 µM (R2=0.9596, P<0.05), and the RI of the
resistant cells was 42.0±0.32 µM, (R2=0.9056,
P<0.05). The RI was ~4.0, and, in the range of 1–5, the
resistance of the cells was in the low range. The R2
values of the curve of cell inhibition rate close to 1, indicating
that the above models simulated the cell inhibition curve well.
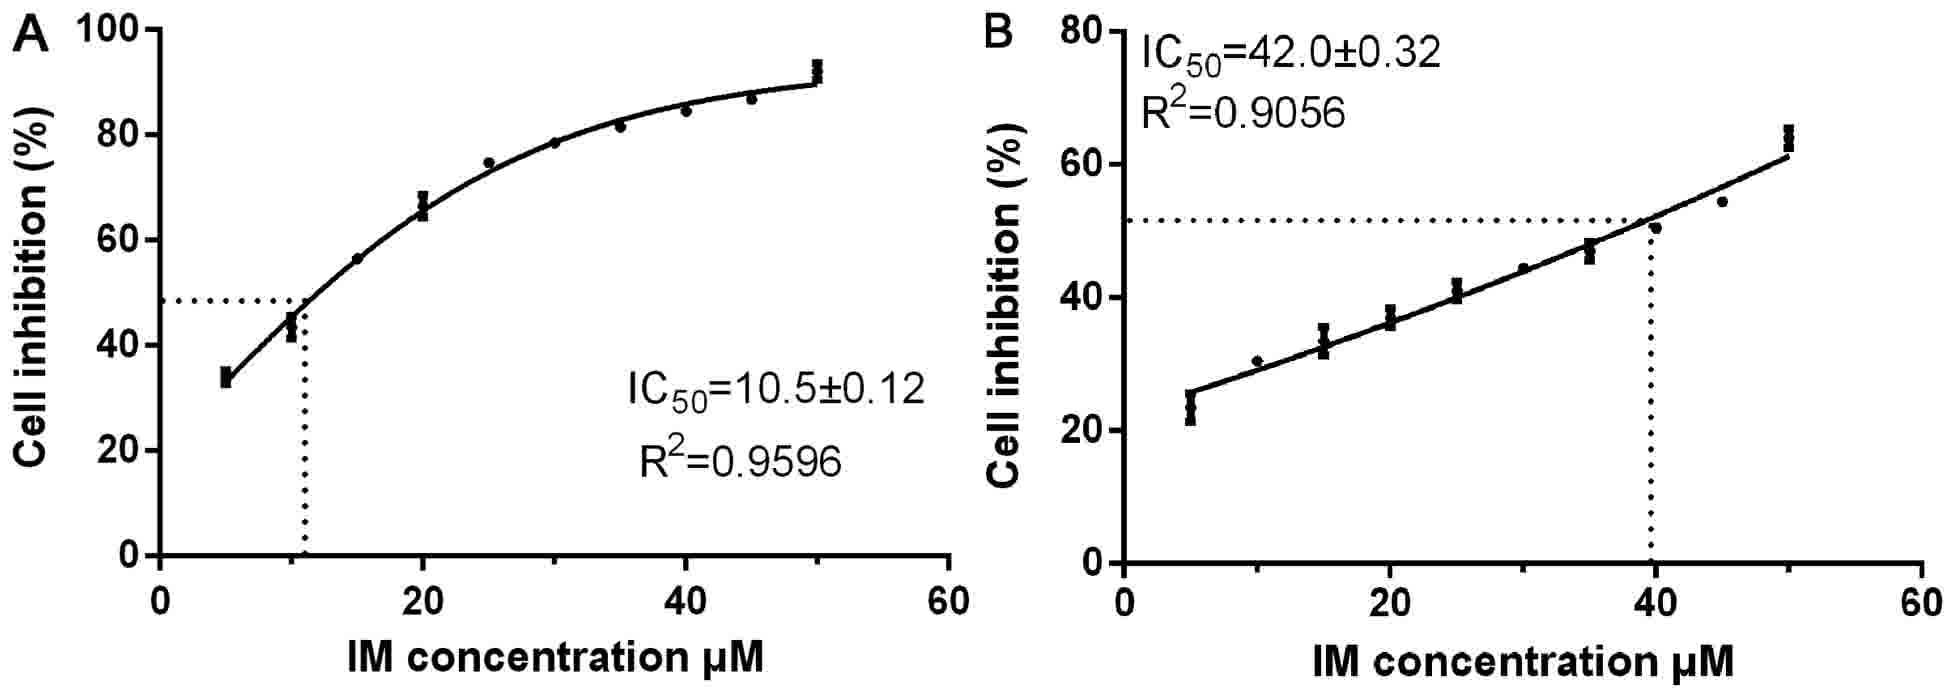 | Figure 1.GIST-T1 and GIST-T1 IR cells. (A)
GIST-T1 cell density was adjusted to 5, 000 cells/100 µl, and the
cells were cultured in 2.5, 10, 15, 20, 25, 30, 40 and 50 µM IM.
(B) GIST-TI IR cell medium contained 5, 25, 30, 35, 40, 50, 62.5
and 75 µM IM, and the cells were cultured at the same cell density.
GIST, gastrointestinal stromal tumour; IM, imatinib mesylate; IR,
IM-resistant. |
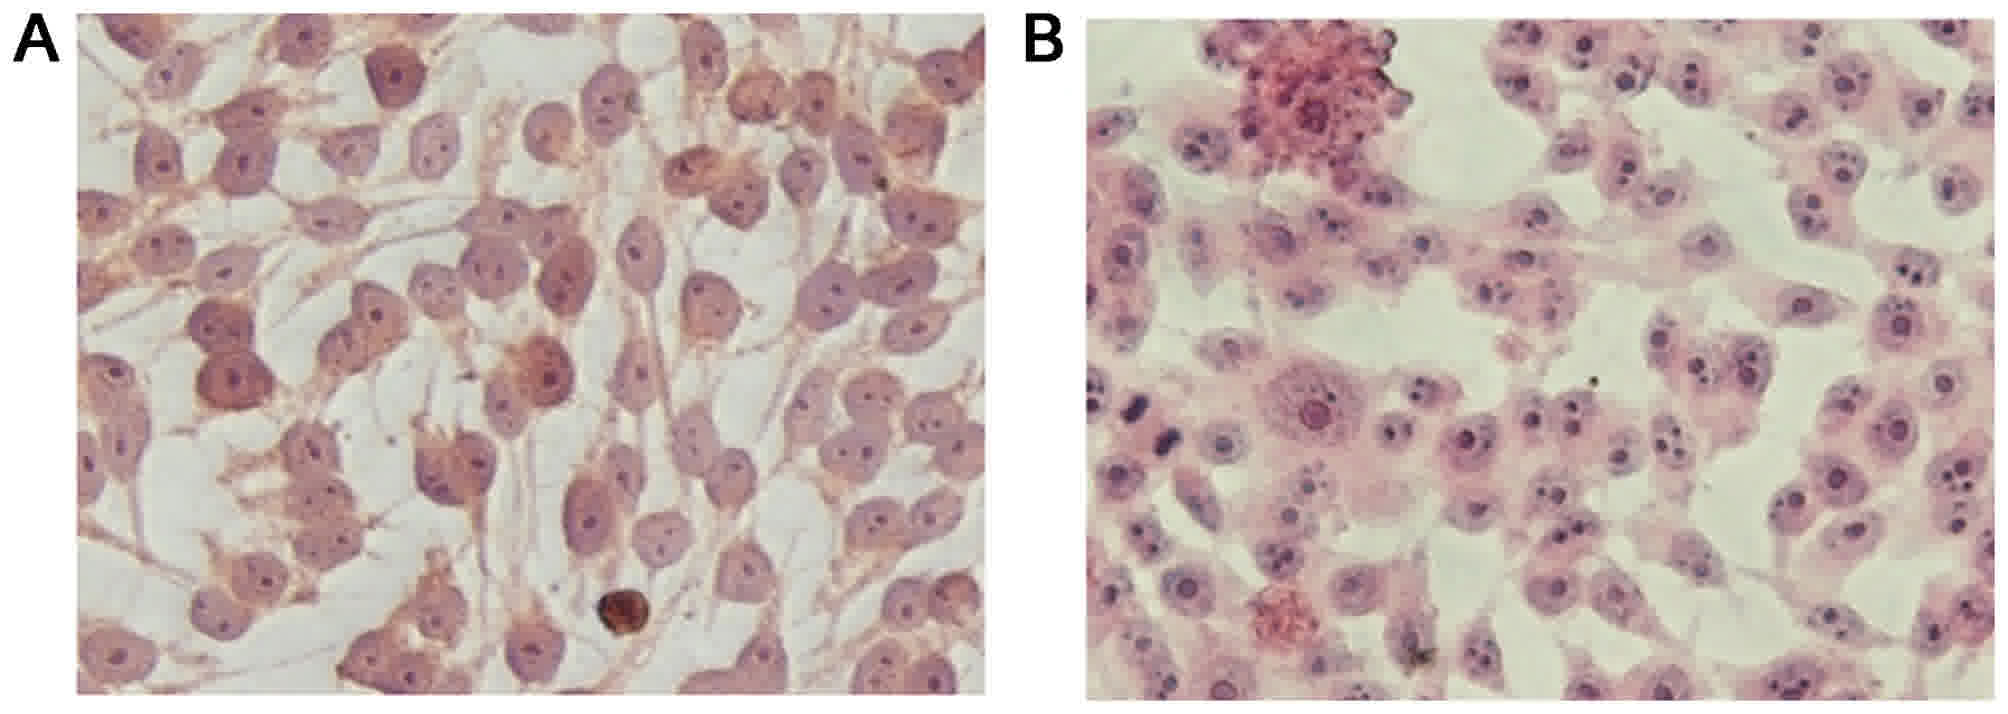
Differences in the biological
behaviours of the GIST-T1 and GIST-T1 IR cells
Slides containing adherent parental and resistant
cells were observed under an inverted microscope following H&E
staining. The results, as shown in Fig.
2A and B, indicated that the GIST-T1 cells were elongated,
spindle-shaped, mononuclear or binuclear, and had a relatively
large volume. The GIST-T1 IR cells had a smaller volume with darkly
stained nuclei, were predominantly binuclear, triple-nuclear or
multiple-nuclear, and had large nuclei.
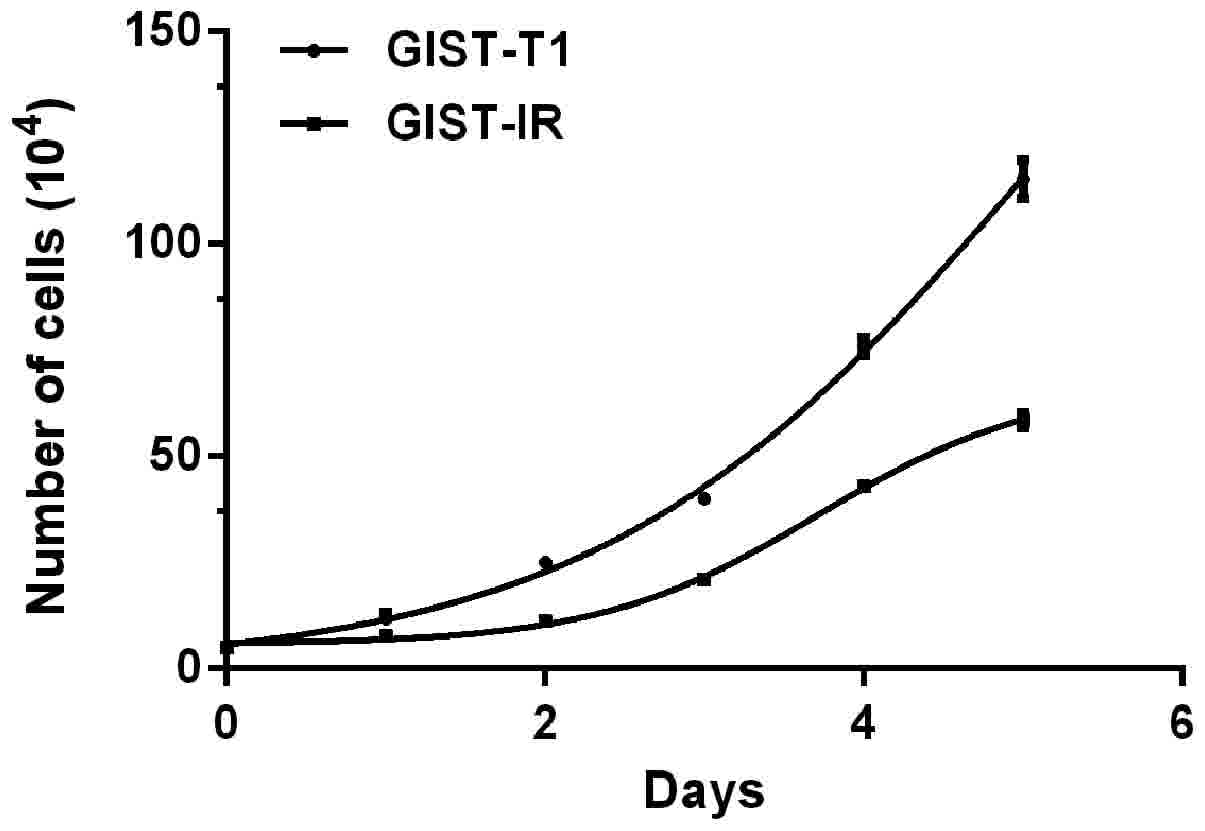
The cell growth curves are shown in Fig. 3. The average proliferation times
calculated by consecutive counting based on the equation for the
GIST-T1 and GIST-T1 IR cells were 26.59±1.34 h
(R2=0.9280, P<0.05) and 33.63±2.82 h
(R2=0.9883, P<0.05), respectively, and this
difference represented a significant extension of ~7.04 h for the
GIST-T1 IR cells (P<0.05). The R2 values of the two
cell growth curves indicated that the above models simulated the
cell growth well. The two cell types did not exhibit a significant
difference over 1–2 days. Cell proliferation was in a relatively
static stage. Subsequently, the difference in the cell
proliferation rate gradually increased and was marked within 3–5
days. After 5 days, the average total numbers of cells observed to
be actively proliferating were 1.1×10⁶ for the GIST-T1
cells and only 6×10⁵ for the resistant cells.
Additionally, the resistant cells were found to be more dependent
on the highly nutritious medium, compared with the untreated cells
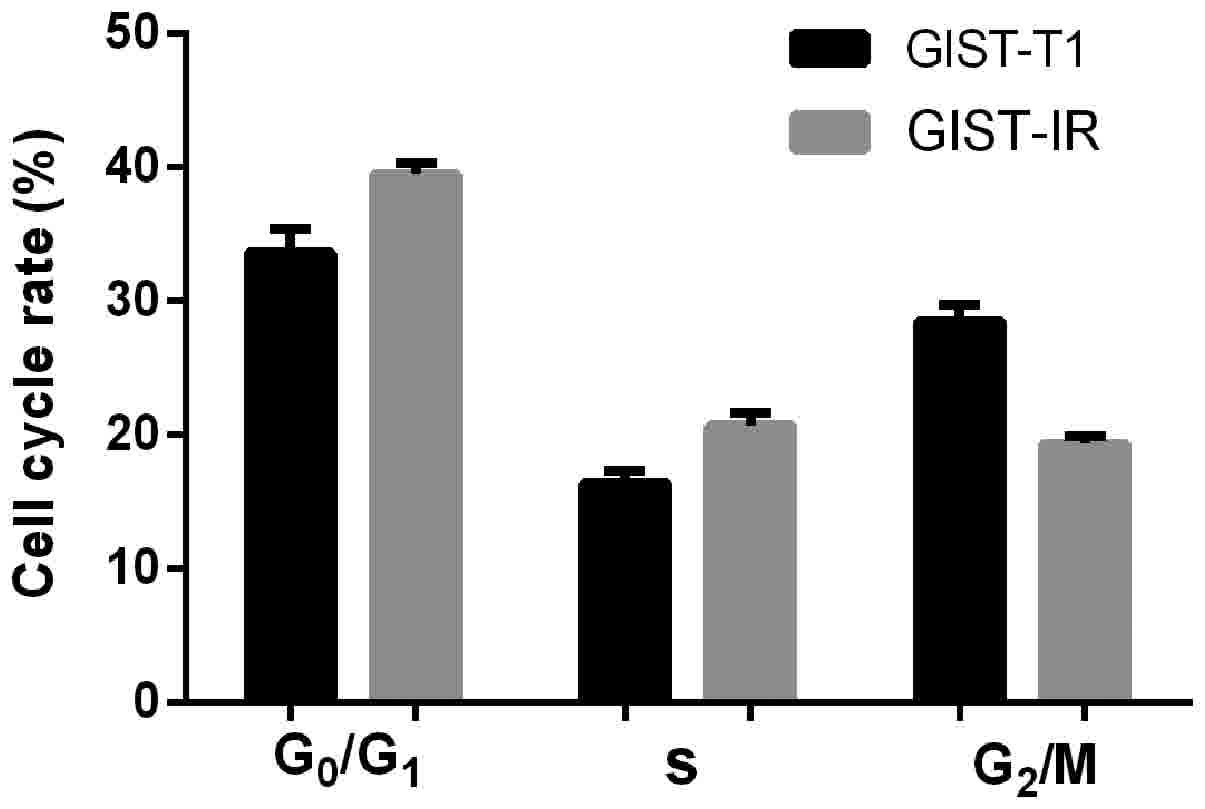
in this experiment. A graph of the cells in the different phases of
the cell cycle is shown in Fig. 4.
The distributions of the GIST-T1 and GIST-T1 IR cells in the
different phases of the cell cycle were 16.46 and 20.72% in the S
phase, 33.45 and 39.88% in the G0/G1 phase,
and 28.48 and 19.01% in the G2/M phase, respectively.
The GIST-T1 IR distribution was increased by ~4.26% in the S phase
and ~6.43% in the G0/G1 phase, and was decreased by ~9.47% in the
G2/M phase. The differences were considered significant
at P<0.05.
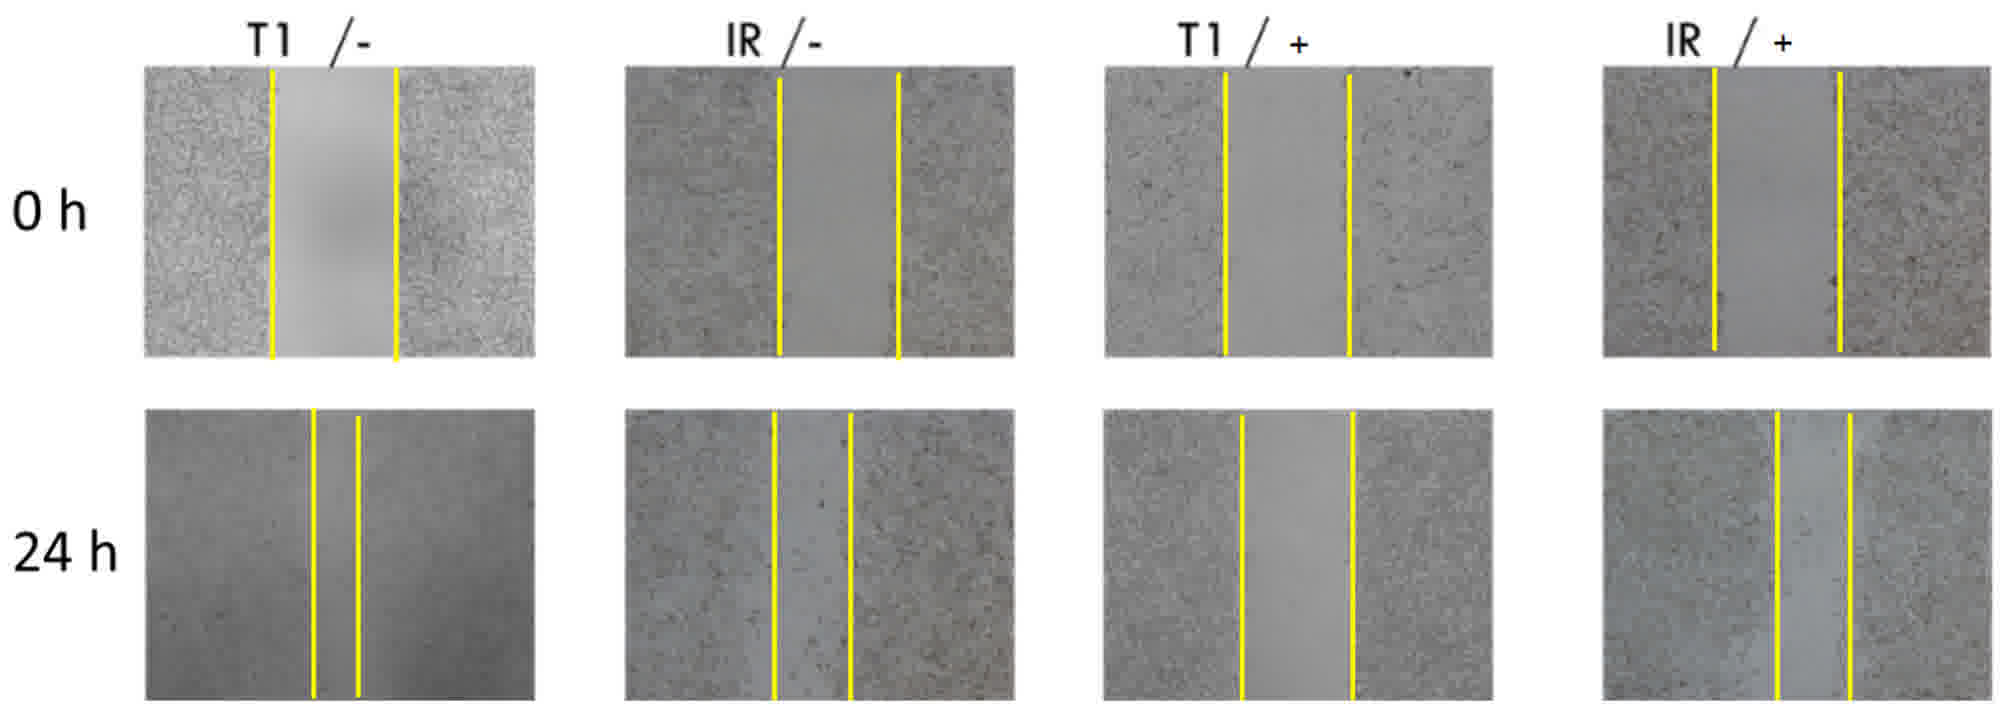
The effects of 2% FBS medium and a drug
concentration of 25 µM on the parental and resistant cells were
investigated using the scratch assay. The results of the scratch
assay are shown in Fig. 5. The
GIST-T1 cells and GIST-T1 IR cells migrated towards the centre in
the absence of the drug. The migration ability of the GIST-T1 cells
was greater than that of the GIST-T1 IR cells under the same
conditions in the absence of drug treatment. When the drug was
added at the concentration of 25 µM, no significant migration of
the GIST-T1 cells was observed, which demonstrated significant
inhibition. By contrast, the GIST-T1 IR cells migrated and did not
exhibit a significant difference, compared with the cells in the
group with no drug. Therefore, IM significantly inhibited the
migration of the GIST-T1 cells, compared with the cells under the
same condition with no drug, whereas its effect on the GIST-T1 IR
cells was weaker.
Discussion
The main methods used to establish drug-resistant
cells include the large dose impact method, drug concentration
increasing method, and large dose impact with concentration
increasing method (5). In the present
study, the drug concentration increasing method was applied to
induce the GIST-T1 cell line. Compared with a study on GIST-882
cell line induction, the GIST-T1 line is difficult to induce due to
its attribute of an IM-sensitive subtype (6). The method used to induce tumour cell
resistance in the present study was in line with the process of
acquired resistance of tumour cells, and can more accurately
simulate the biological changes following tumour resistance. The
drug-resistant cell lines were subjected to DNA and RNA sequencing,
with no new gene mutations found on DNA sequencing. The results of
RNA-sequencing showed that a number of drug-related genes were
abnormally expressed. Similar studies have found the gene
expression profiles change in IM-resistant cell line, including the
upregulation of genes associated with tumor-related genes MYC and
Frizzled class receptor 10, which may be involved in tumorigenesis
(7). The expression of Erb-B2
receptor tyrosine kinase 4 was found to be the most marked, which
was similar to KIT and was activated as an alternative pathway
following IM treatment, resulting in tumor resistance to IM
(7,8).
In addition, the expression of a large number of genes associated
with drug metabolism have been found, including aldehyde oxidase 1,
cytochrome P450 family 3 (CYP3)A4, CYP3A5 and UDP
glucuronosyltransferase family 1A1, which are also involved in the
metabolism of IM, leading to functional resistance. The majority of
the downregulated genes belong predominantly to cell junction
communication, tumor inhibition and complement defense (8). Examinations on the function of these
drug resistance-associated genes are ongoing, therefore, data are
not available in the present study.
Primary IM resistance is the wild-type GIST, which
is without mutations in the c-kit gene. Even in the KIT mutant type
of GIST, the different mutant reaction sites to IM are not the
same. A clinical study identified that the effective rate of exon
11 mutation subtype GIST was 87.3% and exon 9 mutation subtype was
47.8%, while the exon 13 and exon 17 mutation subtypes were invalid
for the treatment with IM as IM could not effectively block the
activation of mutations in the intracellular segment of KIT due to
mutations of exon 13 and 17 (9). The
exon 13 and exon 17 mutation subtype GIST are IM sensitive in
vitro, it is possible that the metabolism of IM in vivo
affects the IM affinity of exon 13 and exon 17 mutation subtypes
GIST. However, their clinical efficacy remains to be elucidated and
resistance mechanisms need to be further studied. The present
clinical study found that not all wild-type KIT and GISTs were
resistant to IM, although certain types showed positive results.
The present study found a mutation in the PDGFRA gene in these
patients. The PDGFRA gene mutations were mainly located in exon 12
and exon 18; for the exon 12 mutation, it was experimentally
confirmed that the subtype was IM-sensitive in vitro. In
clinical studies, it has also been shown that the drug of this
subtype has certain curative effects; exon 18 mutations of D842V
mutant strains resistant to IM subtype in the presence of other
mutant strains are susceptible to the drug. The mechanism of
secondary resistance to IM remains to be fully elucidated, although
no gene overlapping with primary drug resistance has been found in
gene detection of secondary drug-resistant cell lines (10). This suggests that the primary drug
resistance mechanism of GIST is different from secondary acquired
resistance, and it is necessary to confirm the above difference
using in vitro drug resistance assessments. The construction
of in vitro drug resistance model is critical.
IM as a first-line target drug use to treat GIST and
is the most widely recognized drug for the treatment of solid
tumours. Resistance is common following IM treatment for GIST and
is currently a major problem for GIST treatment. Studies have
demonstrated that ~50% of patients with GIST who are susceptible to
IM experience secondary resistance to IM treatment after 2–2.5
years, which seriously affects the prognoses of the patients
(11,12). The mechanism of IM resistance has
become one of the focuses of current investigations in tumour
molecular biology. The in vitro establishment of a
drug-resistant tumour cell line is an effective method in cancer
research and has been generally applied for the investigation of
drug resistance in China and other countries. This method has the
advantages of a relatively simple experimental procedure, readily
controllable conditions and relatively low costs. Therefore, the
induction of an IM-resistant GIST-T1 cell line is a simple, direct
and effective approach for the investigation of GIST resistance and
its reversal.
The present study used GIST-T1 cells as the study
subject. An IM-resistant GIST-T1 cell line, termed GIST-T1 IR, was
successfully established via repeated induction with gradually
increasing doses over 6 months. The comparison of the biological
characteristics of the GIST-T1 and GIST-T1 IR cells revealed that
the growth of the cells with induced resistance was marginally
slower, the nucleus-to-cytoplasm ratio was increased, and the cells
were predominantly multinucleated with more cellular particulate
matter when their tolerance to IM was increased. The changes in the
cell cycle detected using flow cytometry revealed that more GIST-T1
IR cells were in the S and G0/G1 phases, and
fewer cells were in the G2/M phase, compared with the
GIST-T1 cells. These results indicated that the mitosis of the
drug-resistant cells was reduced, and the rate of DNA synthesis was
reduced. Therefore, more cells were retained in the G0
phase to reduce energy consumption due to reproduction.
Subsequently, this saved energy was utilized for resistance to the
drug. The migration assay revealed that the resistant cells
continuously migrated in the presence of the drug, and exhibited an
enhanced ability to migrate with an increased degree of
malignancy.
A change to the morphologies of resistant cells is
one of the indicators of resistance. The comparison of the GIST-T1
cells and the drug-resistant GIST-T1 IR cells in the present study
revealed that the drug-resistant cells were smaller and less
smooth, with an irregular cell contour and ill-defined boundary.
The number of nuclei was increased with the abnormal morphology, in
addition to and increased nuclear-cytoplasmic ratio and mitotic
appearance. The growth curve of the cells revealed that the cell
proliferation rate was reduced and their proliferation was
significantly weaker, compared with that of the untreated cells.
The cell doubling time was 33.63 h, which was significantly longer
than the 26.59 h observed for the parental cells.
In the present study, the
G0/G1 ratio of the GIST-T1 IR cells was
increased by ~6.43%, compared with that of the GIST-T1 cells
(G0 is the resting phase of the cells). One explanation
is that substantial energy was consumed for drug resistance;
therefore, the energy supply available for the other life
activities of the cells was reduced, and the syntheses of proteins
and DNA required for mitosis was reduced, which resulted in the
retention of cells in the resting phase. However, the regulation of
cell cycle proteins may be important in the changes in the cell
cycle during the process of resistance. This finding is consistent
with the results of other studies that have investigated the cell
cycle in drug-resistant cell lines (13,14). The
number of cells in the S phase was increased by ~4.26%, whereas the
number of cells in the G2/M phases was decreased by
~9.47%. The increase in the number of cells in the S phase
suggested an increase in DNA synthesis, whereas the decrease in the
number of cells in the G2/M phases indicated a reduction
of cells in the mitotic stage and that cell division may be
arrested in the G2 phase.
The results of the scratch assay revealed that the
drug-resistant cells continued to migrate in the presence of the
drug with an enhanced migration capacity and an increased degree of
malignancy. When the effectiveness of IM on GIST is weakened, and
the patient becomes resistant to the drug, subsequent metastasis of
GIST to the liver, abdomen and other organs may occur. According to
the results of the present study, IM can significantly inhibit the
migration of tumour cells with no drug resistance, which can
suppress tumour metastasis (15).
However, the capacity of IM to inhibit metastasis was weakened in
the GIST-T1 IR cells, and the metastasis of tumour cells still
occurred at certain IM concentrations. Based on these results, it
was hypothesized that the migration capacity of the tumour cells
was regained in the presence of the drug following the development
of drug resistance, which may be one important reason for
metastasis in patients (16). One
possible explanation for the lower strength of this migration
compared with that in the parental cells is that the energy and
components in the drug-resistant cells were redistributed to retain
its resistance capacity. Therefore, components, including proteins,
required for migration were decreased, which resulted in weaker
migration ability, compared with the ability prior to the
development of drug resistance (17).
Further investigations are required to elucidate the specific
mechanism.
Zhen et al (18) investigated the susceptibilities of two
different cell lines (GIST-T1 and GIST-882) to IM and found a
marked difference (18). The
proliferation of GIST-T1 cells was inhibited by IM at the
concentration of 0.1 µM, whereas the proliferation of GIST-882
cells was not inhibited until the IM concentration reached 1.0 µM.
In the study of Nakatani et al (19), The GIST-T1 cells were more sensitive
to IM, and the induction of their resistance was lower with a lower
level of induction. These findings were consistent with the results
of the present study. The mutations found in exon 11 of GIST-T1
were the same as those detected in the majority of clinical
patients with stromal tumours, which reflects a good IM response
and significant clinical effect. However, mild or serious drug
resistance is elicited by extending the period of drug treatment,
which is also consistent with the clinical situation.
In conclusion, an IM-resistant GIST cell model
(GIST-T1 IR) was successfully established in the present study
based on the clinical characteristics of the chemotherapeutic drug.
The GIST-T1 cells acquired resistance to IM, but also showed
changes in cell morphology, proliferation, migration and cell
cycle, suggesting there is a complex mechanism in the process of
tumour resistance. Therefore, the construction of drug-resistant
cell lines can provide a solid foundation for further
investigations of the mechanism of acquired resistance and provide
a reliable example of targeting drug-induced resistance. The model
exhibited the basic biological properties of resistant cells, and
provides an elementary experimental model for further
investigations of IM resistance mechanisms and the screening of
effective drugs for the treatment of GIST.
Acknowledgements
This study was funded by the National Natural
Science Foundation of China (grant no. 81172380). The authors would
like to thank Dr Yangyu Feng (Life Sciences, Fuzhou University,
Fujian, China) for advice and critical manuscript reading.
Competing interests
The authors declare that they have no competing
interests.
References
|
1
|
Milhem M and Deutsch JM: Imatinib dosing
in gastrointestinal stromal tumors (GISTs): When, how much, and how
long. Curr Clin Pharmacol. 10:311–320. 2015. View Article : Google Scholar : PubMed/NCBI
|
|
2
|
Lee JH, Kim Y, Choi JW and Kim YS:
Correlation of imatinib resistance with the mutational status of
KIT and PDGFRA genes in gastrointestinal stromal tumors: A meta
analysis. J Gastrointestin Liver Dis. 22:413–418. 2013.PubMed/NCBI
|
|
3
|
Yan L, Zou L, Zhao W, Wang Y, Liu B, Yao H
and Yu H: Clinicopathological significance of cKIT mutation in
gastrointestinal stromal tumors: A systematic review and meta
analysis. Sci Rep. 5:137182015. View Article : Google Scholar : PubMed/NCBI
|
|
4
|
Yang J, Ikezoe T, Nishioka C, Takezaki Y,
Hanazaki K, Taguchi T and Yokoyama A: Long term exposure of
gastrointestinal stromal tumor cells to sunitinib induces
epigenetic silencing of the PTEN gene. Int J Cancer. 130:959–966.
2012. View Article : Google Scholar : PubMed/NCBI
|
|
5
|
Serranogarcia C, Heinrich MC, Zhu M, Raut
CP, Eilers G, Ravegnini G, Demetri GD, Bauer S, Fletcher JA and
George S: In vitro and in vivo activity of regorafenib (REGO) in
drug-resistant gastrointestinal stromal tumours (GIST). Vet Radiol
Ultrasound. 54:365–372. 2013.PubMed/NCBI
|
|
6
|
Corless CL, Barnett CM and Heinrich MC:
Gastrointestinal stromal tumours: Origin and molecular oncology.
Nat Rev Cancer. 11:865–878. 2011. View
Article : Google Scholar : PubMed/NCBI
|
|
7
|
Prakash S, Sarran L, Socci N, DeMatteo RP,
Eisenstat J, Greco AM, Maki RG, Wexler LH, LaQuaglia MP, Besmer P
and Antonescu CR: Gastrointestinal stromal tumors in children and
young adults: A clinicopathologic, molecular, and genomic study of
15 cases and review of the literature. J Pediatr Hematol Oncol.
27:179–187. 2005. View Article : Google Scholar : PubMed/NCBI
|
|
8
|
Frolov A, Chahwan S, Ochs M, Arnoletti JP,
Pan ZZ, Favorova O, Fletcher J, von Mehren M, Eisenberg B and
Godwin AK: Response markers and the molecular mechanisms of action
of Gleevec in gastrointestinal stromal tumors. Mol Cancer Ther.
2:699–709. 2003.PubMed/NCBI
|
|
9
|
Chou TY, Chiu CH, Li LH, Hsiao CY, Tzen
CY, Chang KT, Chen YM, Perng RP, Tsai SF and Tsai CM: Mutation in
the tyrosine kinase domain of epidermal growth factor receptor is a
predictive and prognostic factor for gefitinib treatment in
patients with non-small cell lung cancer. Clin Cancer Res.
11:3750–3757. 2005. View Article : Google Scholar : PubMed/NCBI
|
|
10
|
Takahashi T, Elzawahry A, Mimaki S,
Furukawa E, Nakatsuka R, Nakamura H, Nishigaki T, Serada S, Naka T,
Hirota S, et al: Genomic and transcriptomic analysis of imatinib
resistance in gastrointestinal stromal tumors. Genes Chromosomes
Cancer. 56:303–313. 2017. View Article : Google Scholar : PubMed/NCBI
|
|
11
|
Cao G, Li J, Shen L and Zhu X:
Transcatheter arterial chemoembolization for gastrointestinal
stromal tumors with liver metastases. World J Gastroenterol.
18:6134–6140. 2012. View Article : Google Scholar : PubMed/NCBI
|
|
12
|
Hsueh YS, Lin CL, Chiang NJ, Yen CC, Li
CF, Shan YS, Ko CH, Shih NY, Wang LM, Chen TS and Chen LT:
Selecting tyrosine kinase inhibitors for gastrointestinal stromal
tumor with secondary KIT activation-loop domain mutations. PLoS
One. 8:e657622013. View Article : Google Scholar : PubMed/NCBI
|
|
13
|
Xu J and Cao H: Molecular mechanism and
therapeutic strategy for resistance to tyrosine kinase inhibitors
in targeted treatment of gastrointestinal stromal tumors. Zhonghua
Wei Chang Wai Ke Za Zhi. 16:288–291. 2013.(In Chinese). PubMed/NCBI
|
|
14
|
Buleje SJ, Yábar BA, Guevara-Fujita M and
Fujita R: Molecular and genetic features of gastrointestinal
stromal tumors (GIST). Rev Gastroenterol Peru. 32:394–399.
2012.PubMed/NCBI
|
|
15
|
Patel S: Exploring novel therapeutic
targets in GIST: Focus on the PI3K/Akt/mTOR pathway. Curr Oncol
Rep. 15:386–395. 2013. View Article : Google Scholar : PubMed/NCBI
|
|
16
|
Heinrich MC, Griffith D, McKinley A,
Patterson J, Presnell A, Ramachandran A and Debiec-Rychter M:
Crenolanib inhibits the drug-resistant PDGFRA D842V mutation
associated with imatinib-resistant gastrointestinal stromal tumors.
Clin Cancer Res. 18:4375–4384. 2012. View Article : Google Scholar : PubMed/NCBI
|
|
17
|
Zhu HL, Liu T, Meng WT and Jia YQ:
Establishment of an imatinib resistance cell line K562R and its
resistant principia. Sichuan Da Xue Xue Bao Yi Xue Ban. 38:22–26.
2007.(In Chinese). PubMed/NCBI
|
|
18
|
Zhen S, Wang H, Leng HJ, Tong WJ, Tao D
and Pan YL: Establishment of an imatinib resistance cell line and
Identification of biological characteristics. Chin J Experimental
Surg. 29:550–551. 2012.(In Chinese).
|
|
19
|
Nakatani H, Araki K, Jin T, Kobayashi M,
Sugimoto T, Akimori T, Namikawa T, Okamoto K, Nakano T, Okabayashi
T, et al: STI571 (Glivec) induces cell death in the
gastrointestinal stromal tumor cell line, GIST-T1, via endoplasmic
reticulum stress response. Int J Mol Med. 17:893–897.
2006.PubMed/NCBI
|