Introduction
Invasive ductal carcinoma (IDC), a heterogeneous
disease, is the most common pathological type of breast cancer
(1). There are three main prognostic
determinants for breast cancer, including the lymph node status,
tumor size and histological grade (2). The prognostic value of histological
grade is considered to be equivalent to that of the lymph node
status (3), whereas it is greater
than that of tumor size (4).
According to the World Health Organization (5), IDC can be classified into grades I, II
and III, depending on the nuclear features, tubular formation and
mitotic count. Compared with grades I and II, IDC of grade III is
associated with a reduced time to relapse or mortality due to
breast cancer (6). Therefore, the
accurate determination of the IDC histological grade is
particularly important for selection of the appropriate treatment
and prediction of the disease prognosis.
Diffusion weighted imaging (DWI) is an advanced
functional magnetic resonance imaging (MRI) technique, which is
based on the measurement of water molecule diffusion in tissues
(7,8).
Diffusion is quantified by the apparent diffusion coefficient
(ADC), with low ADC values suggesting restricted diffusion
(8). DWI has been initially applied
for the diagnosis of acute stroke in clinical practice (9). With the rapid development of MRI
techniques over the past years, the clinical application of DWI has
been greatly extended for the imaging of various tumors (7–10). DWI is
particularly helpful in the evaluation of breast masses by
providing information on tumor behavior (8).
There have been numerous studies regarding the
application of DWI in the diagnosis of breast lesions, and in the
differential diagnosis between benign and malignant breast tumors
(11,12). The association between DWI and the
histological grade of IDC has also been reported, although
differential findings have been observed due to the use of a
different region of interest (ROI) and measurement methods
(13–20). The majority of previous studies have
applied the mean ADC value to indicate the pathological
characteristics of tumors. However, the minimum ADC
(ADCmin) value is considered to be able to reflect the
most malignant portions of tumors (21). In particular, the ADCmin
value would be helpful for the selection of treatment plans if
information on the IDC histological grade was also provided.
In the present retrospective study, the aim was to
investigate the correlation of the ADCmin value with the
histological grade and the aggressiveness of breast IDC.
Materials and methods
Study patients
In total, 281 patients with suspected with breast
cancer were examined by breast MRI at the Second Hospital of
Shandong University, (Jinan, Shandong, China) between May 2013 and
July 2016 were reviewed. Among these cases, 152 cases were excluded
due to receiving chemotherapy or radiotherapy (n=25), lack of
surgical confirmation (n=26), benign lesions (n=76) or suffering
from other types of malignant tumors (n=25). The remaining 129
patients with pathologically-diagnosed invasive ductal carcinoma
according to the World Health Organization classification of tumors
of the breast (5), who were all
females, aged between 27 to 72 years old (median age of 48 years),
with a mean age of 47.42±10.26 years, were included into the
analysis. Following MRI examination, all lesions were
pathologically verified by lumpectomy, mastectomy or biopsy at the
Institute of Pathology at the Second Hospital of Shandong
University (Jinan, China). In order to avoid misdiagnosis caused by
tumor heterogeneity, the biopsy was performed under the guidance of
MRI inspection. Prior written informed consent was obtained from
each patient, and the study was approved by the ethics committee of
the Second Hospital of Shandong University.
MRI examination
All breast MRI examinations were performed on a
3.0-T system (GE Discovery MR750; GE Healthcare, Milwaukee, WI,
USA), with an eight-channel dedicated breast coil. Patients were in
the prone position, and both breasts were imaged simultaneously.
For premenopausal females, imaging was performed between day 7 and
day 14 of the menstrual cycle. An MRI plain scan was performed with
the axial T2-weighted single-shot fast spin echo sequence using a
modified Dixon technique (T2 IDEAL) for intravoxel
fat-water separation, using the following parameters: Repetition
time (TR), 2,500 msec; echo time (TE), 53.5 msec; slice thickness,
6 mm; layer spacing, 1.0 mm; field of view, 360×360 mm; matrix
size, 320×192 pixels; and number of excitations (NEX), 3.
Similarly, the parameters for the axial T1-weighted fast spin-echo
were as follows: TR, 569 msec; TE, 15.6 msec; slice thickness, 6
mm; layer spacing, 1.0 mm; field of view, 360×360 mm; matrix size,
256×192; NEX, 4.
In order to obtain dynamic contrast-enhanced (DCE)
MRI scans, a dynamic examination was performed using the axial
T1-weighted 3D dynamic gradient echo fat sequence. The parameters
for this examination were as follows: TR/TE, 3.9/1.7; flip angle,
5°; field of view, 360×360 mm; matrix size, 348×348; and slice
thickness, 1.8 mm. Subsequent to unenhanced acquisition,
Gadodiamide (0.2 mmol/kg body weight, GE Healthcare Life Sciences,
Little Chalfont, UK) was intravenously injected at the rate of 2
ml/sec, followed by 20 ml saline flush. DCE image acquisition was
initiated immediately after the saline injection. The sequence was
repeated for seven times without time gaps, and each sequence
lasted for 60 sec.
DWI was performed with an axial single-shot fat
suppressed echo-planar diffusion weighted sequence (TR, 3,000 msec;
TE, 49.5 msec; slice thickness, 6 mm; layer spacing, 1.0 mm; field
of view, 360×360 mm; matrix size, 128×96; and NEX, 4). The
diffusion-sensitizing gradient was applied along the x, y and z
axes, while b-values of 0 and 800 sec/mm2 were used.
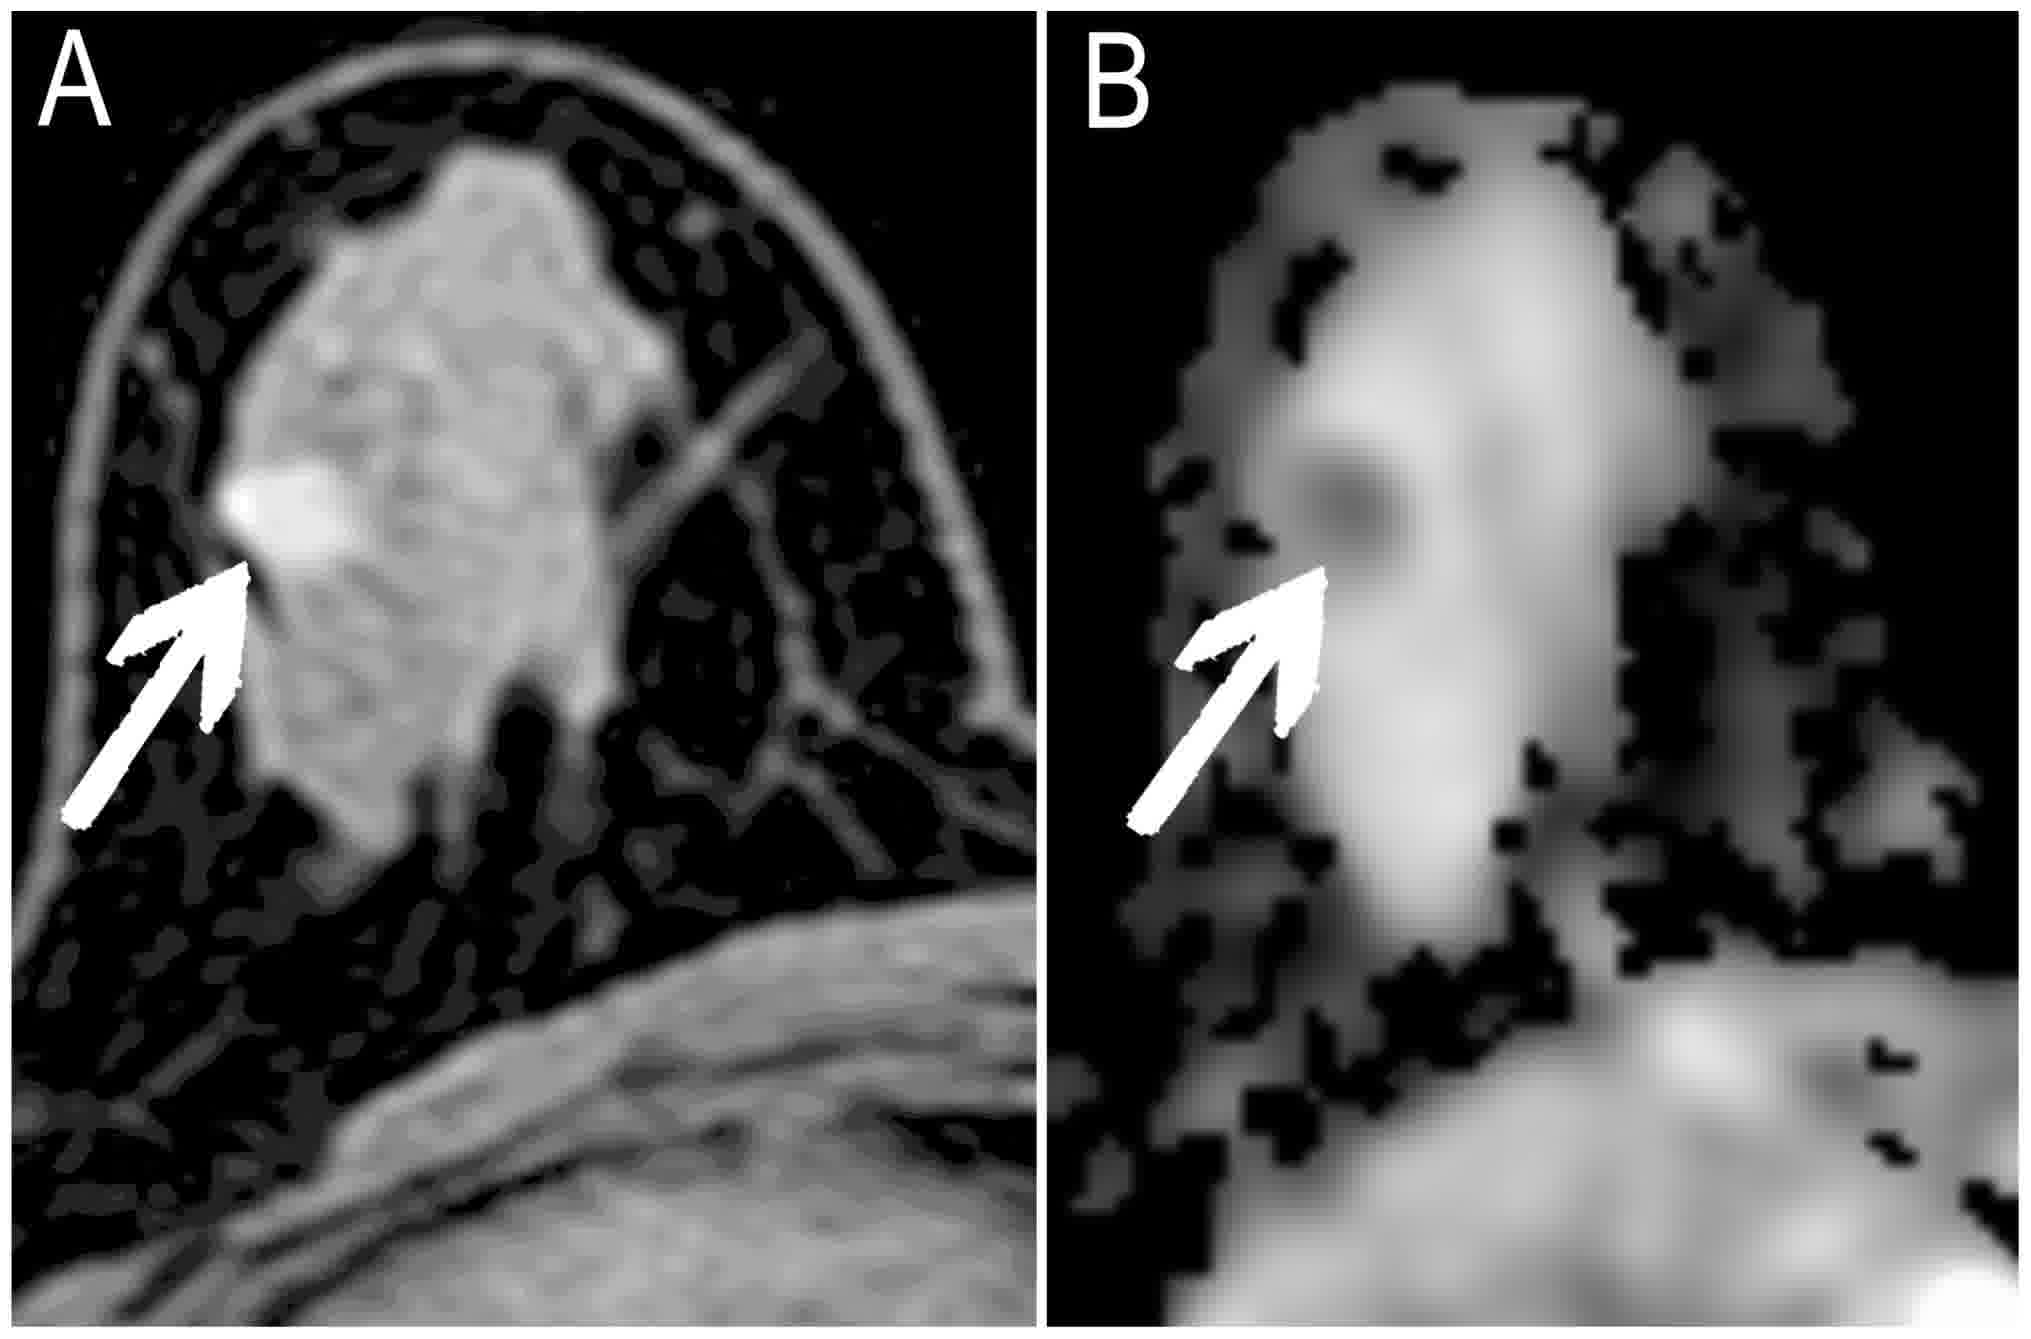
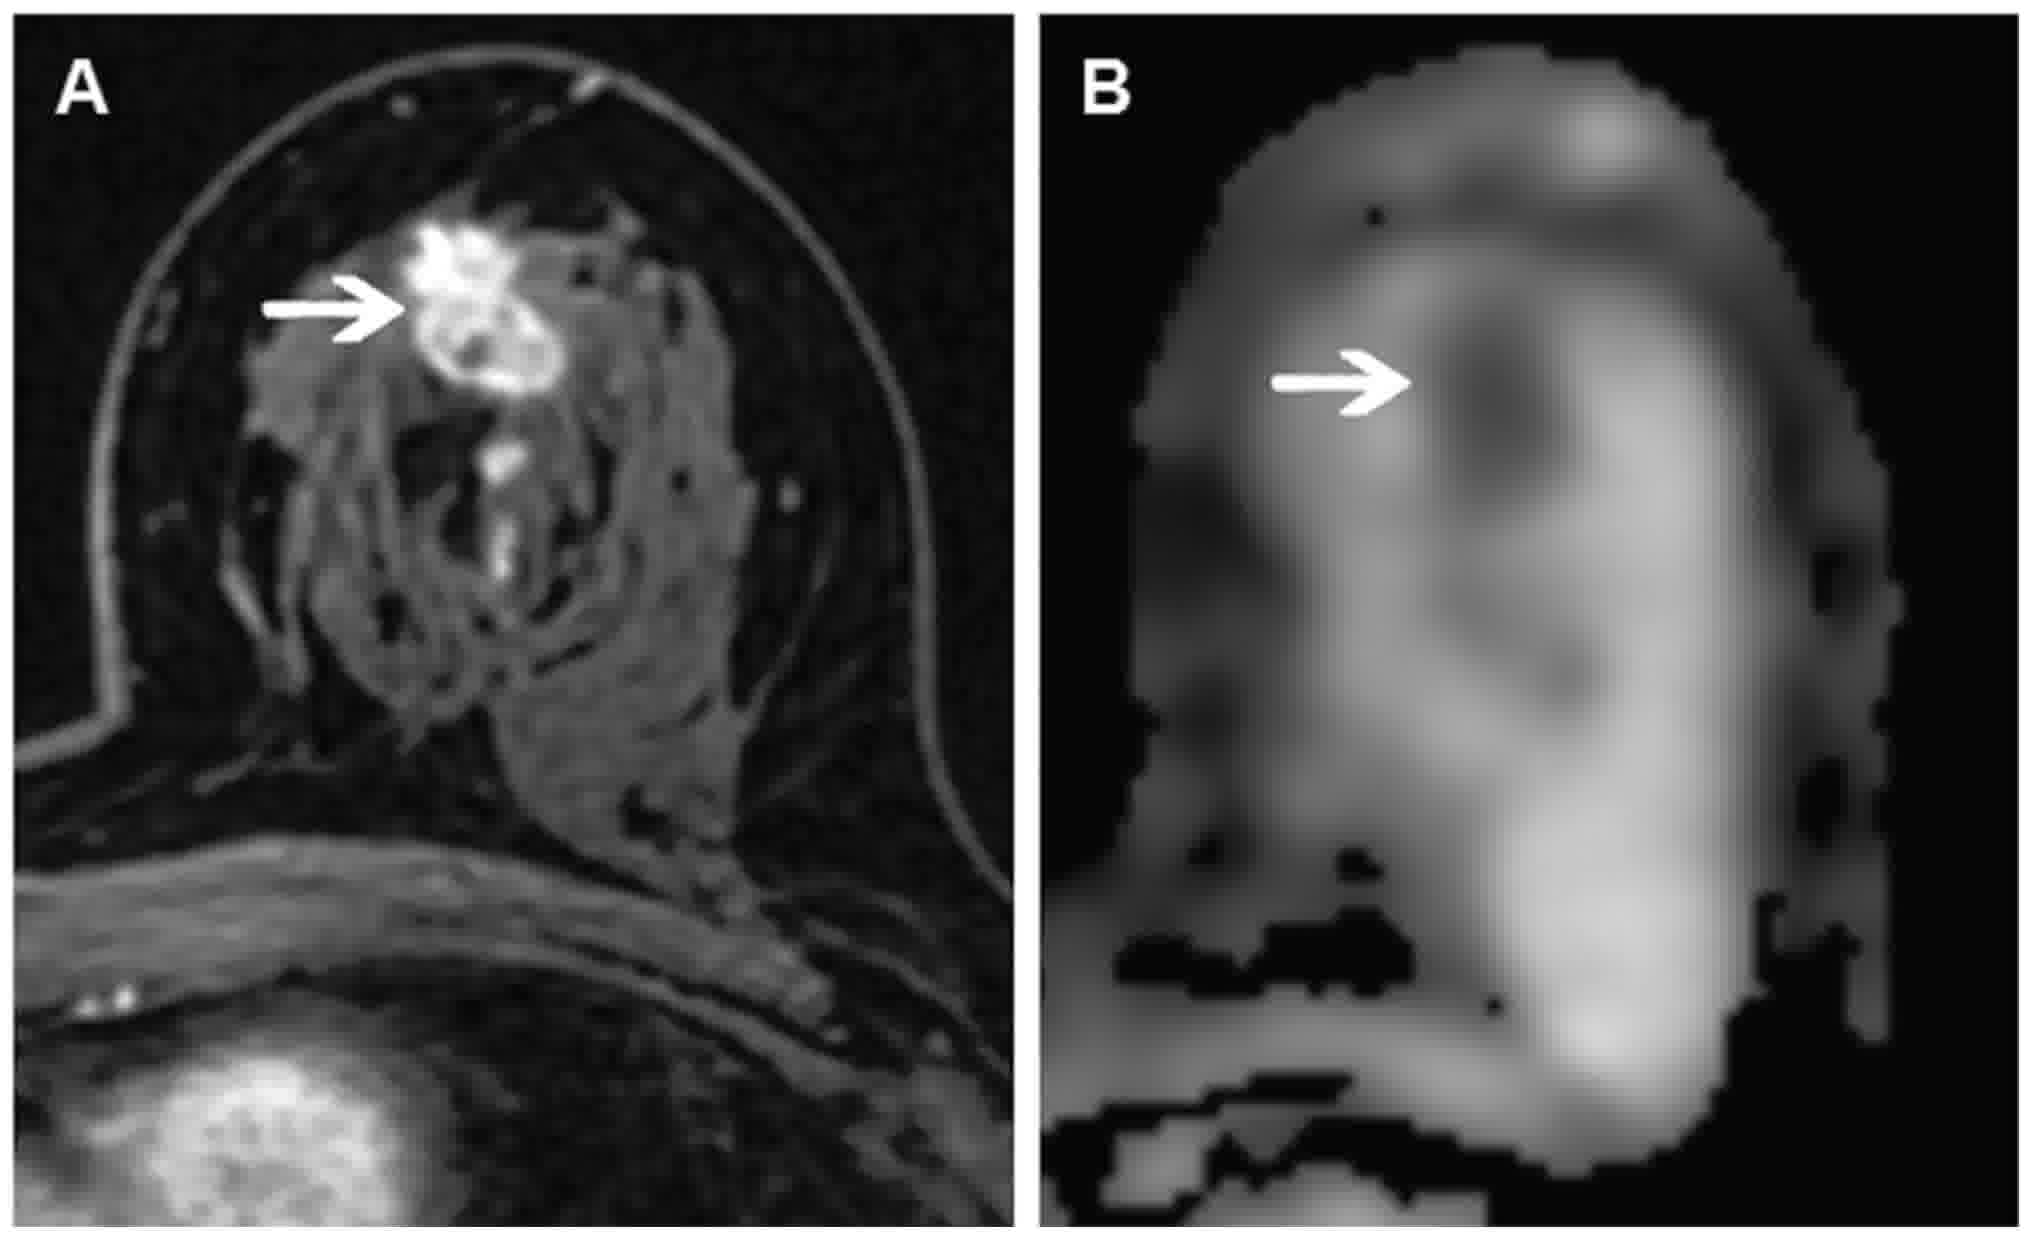
Image analysis
MRI scans were independently reviewed by two
experienced radiologists at a workstation (Advantage Windows
Workstation 4.6; GE Healthcare) in a blinded manner. For each case,
the final decision was made only upon agreement between these two
radiologists. ADC measurement was performed in the GE workstation
software. A ROI with a mean size of 25.7 mm2 (ranging
between 8.0 and 79.0 mm2) was placed on the
highest-signal focal in the DWI images that corresponded to the
lowest-signal area in the ADC maps. Subsequently, the ADC values
were automatically calculated on the ADC maps. The ROI was smaller
than the lesion size and was placed in the solid part of IDC,
avoiding the necrotic and hemorrhagic regions. The ROI size of each
lesion was consistent for multiple measurements, in which the
lowest of three measurements was accepted as the minimum ADC
(ADCmin) value.
Histopathological analysis
The histological grade of the tumors was assessed
using the Nottingham modification of the Bloom-Richardson system
(22), considering the following
three parameters: i) Tubular formation (1 point, tubular formation
in >75% of the tumor; 2 points, tubular formation in 10–75%; and
3 points, tubular formation in <10%); ii) nuclear pleomorphism
(1 point, nuclei with minimal variation in size and shape; 2
points, moderate nuclear variation; and 3 points, marked nuclear
variation); and iii) mitotic count (1 point, 0–11 mitotic counts; 2
points, 12–22 mitotic counts; and 3 points, >23 mitotic counts),
calculated using a light microscope (BX43; Olympus Corporation,
Tokyo, Japan) at magnification of ×40 with a field diameter of 0.63
mm and a field area of 0.312 mm2. The final decision on
the histological grade was established only upon agreement of the
investigators (two pathologists). Scores of 3–5, 6–7 and 8–9 were
considered to indicate histological grades I, II and III,
respectively (22).
Statistical analysis
Data are expressed as the mean ± standard deviation.
SPSS software (version 18.0; SPSS, Inc., Chicago, IL, USA) was used
for statistical analysis. Due to the fact that the minimum
ADCmin or maximum ADCmin represented a
specific value for each patient, no statistical analysis could be
performed on these data. In the present study, the mean
ADCmin value was calculated by averaging the values of
all the patients. The mean ADCmin value difference was
compared with the histological grade using the one-way analysis of
variance and least significant difference test. Independent sample
(Student's t-test) and receiver operating characteristic (ROC)
curve analysis were used to analyze the diagnostic value of the
mean ADCmin value in differentiating less and more
aggressive IDC cases. The optimal cutoff point of the mean
ADCmin value, and the corresponding sensitivity and
specificity were determined. P<0.05 was considered to indicate
differences that were statistically significant.
Results
Histological grade and
ADCmin values in IDC patients
Among the 129 breast IDC cases included in the
present study, pathological analysis revealed that there were 17
(13.18%) cases of histological grade I, 79 (61.24%) cases of
histological grade II, and 33 (25.58%) cases of histological grade
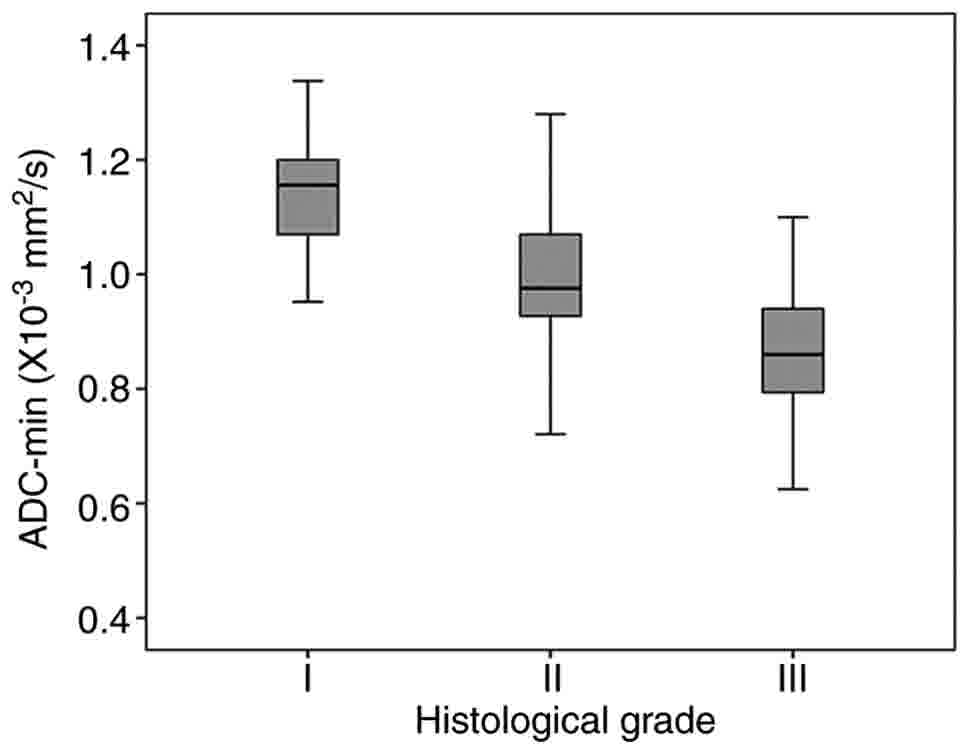
III (Figs. 1–3). Furthermore, the mean ADCmin
value of all IDC cases was (0.97±0.15)×10−3
mm2/sec. The minimum, maximum and mean ADCmin
values of IDC obtained by histological grade are presented in
Table I.
 | Table I.Range and mean values of
ADCmin of IDC according to the different histological
grades. |
Table I.
Range and mean values of
ADCmin of IDC according to the different histological
grades.
| Grade | n | ADCmin
range (×10−3 mm2/sec) | Mean
ADCmin (×10−3 mm2/sec) | P-value |
|---|
| I | 17 | 0.95–1.34 | 1.14±0.11 | <0.01 |
| II | 79 | 0.72–1.30 | 0.99±0.12 | <0.01 |
| III | 33 | 0.50–1.10 | 0.86±0.13 | <0.01 |
When considering the different histological grades
of the included IDC patients, the mean ADCmin values
were (1.14±0.11)×10−3, (0.99±0.12)×10−3 and
(0.86±0.13)×10−3 mm2/sec for patients with
grade I, II and III disease, respectively. The corresponding ranges
of these values were (0.95–1.34)×10−3,
(0.72–1.30)×10−3 and (0.50–1.10)×10−3
mm2/sec, respectively. These measurement results
revealed that different ADCmin values corresponded to
IDC cases with different histological grades. Compared with cases
of higher grades, tumors of lower grades exhibited significantly
higher ADC values (F=33.49; P<0.01). In particular, there was a
significant difference in the ADCmin value between grade
II and III tumors (P<0.01), as well as between grade I and II
tumors (P<0.01; Fig. 4). Taken
together, these results suggest that, the ADCmin value
is inversely correlated with the histological grade of IDC.
ADCmin value and disease
aggressiveness in IDC patients
To evaluate the role of the ADCmin value
in determining the aggressiveness of IDC, the cases were divided
into the less aggressive (grades I and II) and more aggressive
(grade III) groups. The results revealed that the mean
ADCmin values in the less aggressive group was
(1.01±0.13)×10−3 mm2/sec, while this value
was (0.86±0.13)×10−3 mm2/sec in the more
aggressive group (t=5.76, P<0.01). These results suggest that
the ADCmin value is inversely correlated with the
aggressiveness of IDC.
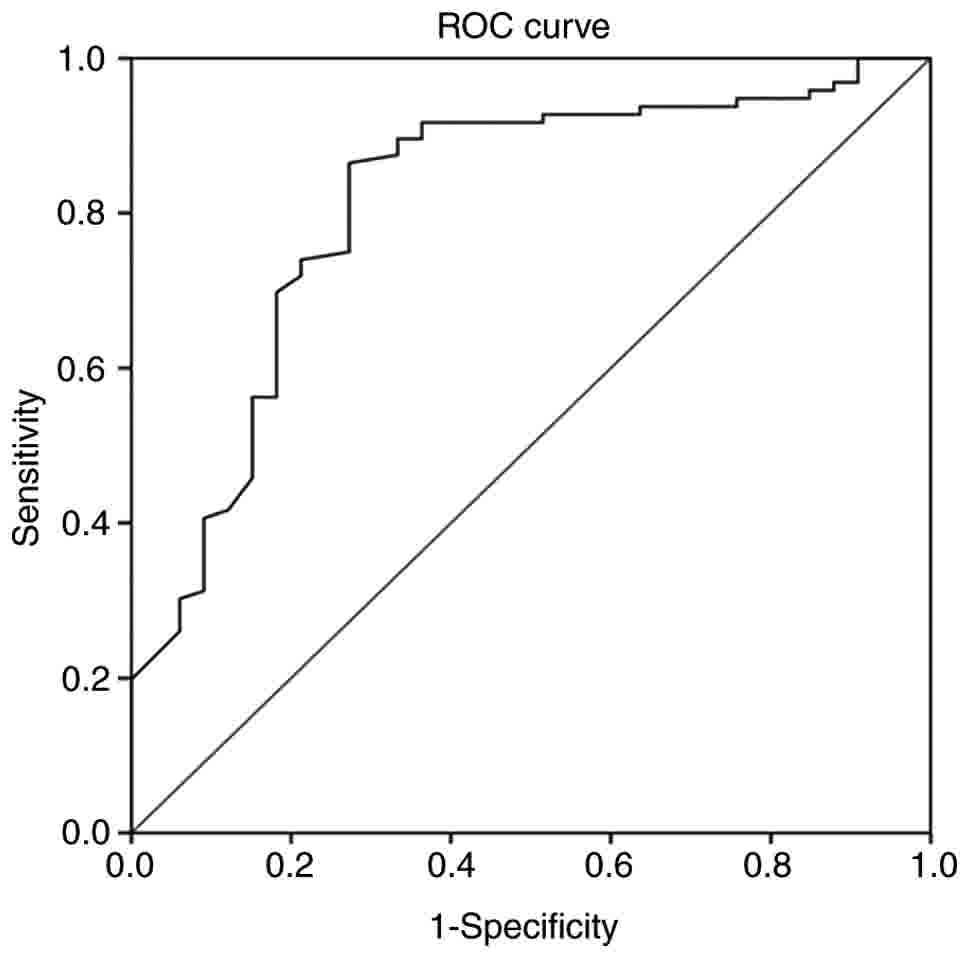
ROC analysis of ADCmin
value in IDC diagnosis
ROC analysis demonstrated that the ADCmin
value was a significant parameter in the diagnosis of less
aggressive IDC, with an area under the curve (AUC) of 0.81. The
ADCmin threshold value of 0.90×10⁻³
mm2/sec corresponded to a sensitivity of 86.5% and a
specificity of 72.7% in the detection of less aggressive tumors
(Fig. 5). These results suggest the
importance of the ADCmin value in diagnosing less
aggressive IDC.
Discussion
The histological grade represents an important
prognostic factor for tumors in clinical practice, which is helpful
in evaluating the tumor behavior (2).
In addition, DWI is quick examination that does not require the use
of a contrast agent and is quantified by the apparent diffusion
coefficient. Moreever, the ADC value is quantitative and,
therefore, an objective calculation (8,23).
Previous studies have examined the association between the ADC
value and tumor grade. For instance, certain studies have
demonstrated that the ADC value is inversely correlated with the
tumor grade (13–15). Cipolla et al (16) also revealed that the ADC values were
significantly higher in G1 tumors as compared with G3 tumors, while
there was no statistically significant difference upon comparison
of G1 and G3 tumors with G2 tumors. By contrast, several other
studies have indicated that no correlation exists between the ADC
value and tumor grade (17–20).
In the present study, the results demonstrated that
the mean ADCmin values for IDC of grades I, II and III
were (1.14±0.11)×10−3, (0.99±0.12)×10−3 and
(0.86±0.13)×10−3 mm2/sec, respectively, with
the corresponding ranges of (0.95–1.34)×10−3,
(0.72–1.30)×10−3 and (0.50–1.10)×10−3
mm2/sec. Tumors of lower grades were observed to exhibit
significantly higher ADC values compared with tumors of higher
grades. In addition, there was significant difference in the
ADCmin value between tumors of grades II and III, as
well as between tumors of grades I and II. This phenomenon may be
attributed to the higher cellular density and smaller extracellular
space in IDC of higher grades, which results in lower ADC values
(24). Additionally, the overlapping
of the ADCmin for the three grades of IDC is possibly
due to tumor heterogeneity (1).
The majority of previous studies (13–20) have
used the mean ADC value when investigating its correlation with the
tumor grade. However, in the present study, the ADCmin
values were used instead, and significant differences were observed
in these values between different tumor grades. IDC is a
heterogeneous tumor consisting of invasive cancer nests, fibrosis
and necrosis. In MRI scans, the regions of the maximum ADC
(ADCmax) values reflect the lowest cellular zone, while
the regions of the ADCmin values reflect the highest
cellular zone composed of stroma (21). Furthermore, the presence of fibrosis
and necrosis may affect the ADC values, particularly the
ADCmax values. Therefore, there will always be
differences in the ADCmax values in the local
measurement and pathological characterization of tumors. In the
present study, the ADCmin value was used for tumor
pathological characterization, which has been suggested to reflect
the most malignant portions of tumors (21).
There have been several studies investigating the
application of the ADCmin values in differentiating the
benign and malignant breast masses (as well as in differentiating
breast cancer subtypes), and in detecting the invasive component in
ductal carcinoma in situ (21,25,26). Byun
et al (27) have measured the
mean ADC and the mean ADCmin values in the regions with
the highest fluorodeoxyglucose (FDG) uptake using sequential
18F-FDG positron-emission tomography and MRI, and
examined the correlation of the corresponding ADC values with the
histological grade of IDC. The majority of these aforementioned
studies have applied the multiple ROI method in breast MRI, and the
ADCmin value represented the lowest mean ADC value among
multiple small ROIs within the lesion. However, this method is
time-consuming, limiting its clinical application (21,25,27). In
the present study, the single ROI was smaller in size when compared
with the lesion size, and was placed in the solid part of the IDC,
avoiding the necrotic and hemorrhagic regions. The ROI size of each
lesion was consistent for multiple measurements, and the lowest ADC
value among three measurements was determined as the
ADCmin for each lesion. This method has been previously
reported, with considerable feasibility in clinical settings
(26). Furthermore, the results of
the current study were consistent with previous findings (13–15), with
a simpler and more feasible method used, and confirmed that the
ADCmin value was inversely correlated with the
histological grade of breast IDC. Further studies with larger
sample sizes are required to evaluate the clinical application of
the ADCmin value in tumor grading.
Biological evaluation of tumors is important for the
selection of treatment options. Different tumor cell densities may
indicate different histological structures and biological
invasions. The ADC values for IDC lesions were lower as compared
with those of other malignant tumors, which may be due to the
densely packed tumor cells, restricting effective motion and
diffusion of water molecules (28).
Costantini et al (13) have
identified that the mean ADC value for IDC was 1.03×10⁻³
mm2/sec, while the mean ADC value for ductal carcinoma
in situ was 1.05×10⁻³ mm2/sec. In the
present study, the mean ADCmin value for IDC was
(0.97±0.15)×10−3 mm2/sec, while the values
for the less aggressive (grades I and II) and more aggressive
(grade III) tumor groups were (1.01±0.13)×10−3 and
(0.86±0.13)×10−3 mm2/sec, respectively. Thus,
a significant difference was observed in the mean ADCmin
value between the less and more aggressive IDC groups, which was in
line with previous observations (13). Furthermore, a cutoff point for the
ADCmin threshold value of 0.90×10⁻³
mm2/sec was used to detect the less aggressive tumors in
the present study, corresponding to a sensitivity of 86.5% and a
specificity of 72.7%. The results of the ROC curve analysis further
revealed that the ADCmin value was important in the
diagnosis of less aggressive IDC cases, with an AUC of 0.81.
There are also certain limitations in the present
study. Firstly, the sample size was relatively small; therefore,
the findings need to be validated in studies using larger sample
sizes. In addition, all lesions herein were IDCs, appearing as a
mass-like enhancement. Therefore, it was not able to evaluate the
ADCmin value of other types of breast carcinoma
appearing as non mass-like enhancement with respect to the
pathological grade. Furthermore, the measurement of
ADCmin value was relatively subjective, which may lead
to observational bias. Another limitation is that the association
between the histological grade and the morphological alterations,
as well as the enhancement pattern, were not examined in the
present study. Routine imaging findings combined with the ADC value
would improve the accuracy of the preoperative assessment of the
histological grade for IDC, which would assist in the selection of
the appropriate treatment options for breast cancer. Additionally,
the association between the ADCmin values and other
pathological characteristics was not investigated herein, which
should be considered in further in-depth studies in the future.
According to a previous study (29)
and clinical practice, only two b-values (0 and 800
mm2/sec) were applied in the present study; thus, DWI
images with more b values would be required in the future to obtain
accurate ADC values. Finally, the present study was a retrospective
study, and therefore, the ADCmin value was not
considered in the clinical decisions.
In conclusion, the results of the current study
indicated that the ADCmin value was correlated with the
histological grade of IDC. Lower ADCmin values were
associated with higher histological grades. These findings suggest
that the ADCmin value may be considered as a promising
prognostic parameter in identifying tumor aggressiveness.
Acknowledgements
Not applicable.
Funding
This study was supported by the Key Research and
Development Plan of Shandong Province (grant no. 2015GSF119034) and
the Seed Fund of the Second Hospital of Shandong University (grand
no. S2014010020).
Availability of data and materials
The datasets used and/or analyzed during the current
study are available from the corresponding author on reasonable
request.
Authors' contributions
GS and WG designed the study. SZ, RT, PC, ZL, and FS
performed the experiments. SZ analysed the data.
Ethics approval and consent to
participate
The present study was approved by the ethics
committee of the Second Hospital of Shandong University.
Consent for publication
Prior written informed consent was obtained from
each patient.
Competing interests
The authors declare that they have no competing
interests.
References
|
1
|
Hawthorn L, Luce J, Stein L and Rothschild
J: Integration of transcript expression, copy number and LOH
analysis of infiltrating ductal carcinoma of the breast. BMC
Cancer. 10:4602010. View Article : Google Scholar : PubMed/NCBI
|
|
2
|
Rakha EA, Reis-Filho JS, Baehner F, Dabbs
DJ, Decker T, Eusebi V, Fox SB, Ichihara S, Jacquemier J, Lakhani
SR, et al: Breast cancer prognostic classification in the molecular
era: The role of histological grade. Breast Cancer Res. 12:2072010.
View Article : Google Scholar : PubMed/NCBI
|
|
3
|
Wirapati P, Sotiriou C, Kunkel S, Farmer
P, Pradervand S, Haibe-Kains B, Desmedt C, Ignatiadis M, Sengstag
T, Schütz F, et al: Meta-analysis of gene expression profiles in
breast cancer: Toward a unified understanding of breast cancer
subtyping and prognosis signatures. Breast Cancer Res. 10:R652008.
View Article : Google Scholar : PubMed/NCBI
|
|
4
|
Sundquist M, Thorstenson S, Brudin L,
Nordenskjold B and Nordenskjöld B: Applying the nottingham
prognostic index to a Swedish breast cancer population. South East
Swedish Breast Cancer Study Group. Breast Cancer Res Treat. 53:1–8.
1999. View Article : Google Scholar : PubMed/NCBI
|
|
5
|
Elston CW and Ellis IO: Pathological
prognostic factors in breast cancer. I. The value of histological
grade in breast cancer: Experience from a large study with
long-term follow-up. Histopathology. 19:403–410. 1991. View Article : Google Scholar : PubMed/NCBI
|
|
6
|
Trudeau ME, Pritchard KI, Chapman JA,
Hanna WM, Kahn HJ, Murray D, Sawka CA, Mobbs BG, Andrulis I,
McCready DR and Lickley HL: Prognostic factors affecting the
natural history of node-negative breast cancer. Breast Cancer Res
Treat. 89:35–45. 2005. View Article : Google Scholar : PubMed/NCBI
|
|
7
|
Guo Y, Cai YQ, Cai ZL, Gao YG, An NY, Ma
L, Mahankali S and Gao JH: Differentiation of clinically benign and
malignant breast lesions using diffusion-weighted imaging. J Magn
Reson Imaging. 16:172–178. 2002. View Article : Google Scholar : PubMed/NCBI
|
|
8
|
Bammer R: Basic principles of
diffusion-weighted imaging. Eur J Radiol. 45:169–184. 2003.
View Article : Google Scholar : PubMed/NCBI
|
|
9
|
Sinha S, Lucas-Quesada FA, Sinha U,
DeBruhl N and Bassett LW: In vivo diffusion-weighted MRI of the
breast: Potential for lesion characterization. J Magn Reson
Imaging. 15:693–704. 2002. View Article : Google Scholar : PubMed/NCBI
|
|
10
|
Hosseinzadeh K and Schwarz SD: Endorectal
diffusion-weighted imaging in prostate cancer to differentiate
malignant and benign peripheral zone tissue. J Magn Reson Imaging.
20:654–661. 2004. View Article : Google Scholar : PubMed/NCBI
|
|
11
|
Zhao J, Guan H, Li M, Gu H, Qin J and Wu
X: Significance of the ADC ratio in the differential diagnosis of
breast lesions. Acta Radiol. 57:422–429. 2016. View Article : Google Scholar : PubMed/NCBI
|
|
12
|
Çabuk G, Puce Nass M, Özgür A, Apaydın FD,
Polat A and Orekici G: The diagnostic value of diffusion-weighted
imaging and the apparent diffusion coefficient values in the
differentiation of benign and malignant breast lesions. J Med
Imaging Radiat Oncol. 59:141–148. 2015. View Article : Google Scholar : PubMed/NCBI
|
|
13
|
Costantini M, Belli P, Rinaldi P, Bufi E,
Giardina G, Franceschini G, Petrone G and Bonomo L:
Diffusion-weighted imaging in breast cancer: Relationship between
apparent diffusion coefficient and tumour aggressiveness. Clin
Radio. 65:1005–1012. 2010. View Article : Google Scholar
|
|
14
|
Razek AA, Gaballa G, Denewer A and Nada N:
Invasive ductal carcinoma: Correlation of apparent diffusion
coefficient value with pathological prognostic factors. NMR Biomed.
23:619–623. 2010. View
Article : Google Scholar : PubMed/NCBI
|
|
15
|
Belli P, Costantini M, Bufi E, Giardina
GG, Rinaldi P, Franceschini G and Bonomo L: Diffusion magnetic
resonance imaging in breast cancer characterization: Correlations
between the apparent diffusion coefficient and major prognostic
factors. Radiol Med. 120:268–276. 2015. View Article : Google Scholar : PubMed/NCBI
|
|
16
|
Cipolla V, Santucci D, Guerrieri D, Drudi
FM, Meggiorini ML and de Felice C: Correlation between 3T apparent
diffusion coefficient values and grading of invasive breast
carcinoma. Eur J Radio. 183:2144–2150. 2014. View Article : Google Scholar
|
|
17
|
Park SH, Choi HY and Hahn SY: Correlations
between apparent diffusion coefficient and invasive ductal
carcinoma and pathologic factors on diffusion-weighted imaging MRI
at 3.0 Tesla. J Magn Reson Imaging. 41:175–182. 2015. View Article : Google Scholar : PubMed/NCBI
|
|
18
|
Durando M, Gennaro L, Cho GY, Giri DD,
Gnanasigamani MM, Patil S, Sutton EJ, Deasy JO, Morris EA and
Thakur SB: Quantitative apparent diffusion coefficient measurement
obtained by 3.0 Tesla MRI as a potential noninvasive marker of
tumor aggressiveness in breast cancer. Eur J Radiol. 85:1651–1658.
2016. View Article : Google Scholar : PubMed/NCBI
|
|
19
|
Park EK, Cho KR, Seo BK, Woo OH, Cho SB
and Bae JW: Additional value of diffusion-weighted imaging to
evaluate prognostic factors of breast cancer: Correlation with the
apparent diffusion coefficient. Iran J Radiol. 13:e331332016.
View Article : Google Scholar : PubMed/NCBI
|
|
20
|
Shin HJ, Kim SH, Lee HJ, Gong G, Baek S,
Chae EY, Choi WJ, Cha JH and Kim HH: Tumor apparent diffusion
coefficient as an imaging biomarker to predict tumor aggressiveness
in patients with estrogen-receptor-positive breast cancer. NMR
Biomed. 29:1070–1078. 2016. View Article : Google Scholar : PubMed/NCBI
|
|
21
|
Hirano M, Satake H, Ishigaki S, Ikeda M,
Kawai H and Naganawa S: Diffusion-weighted imaging of breast
masses: Comparison of diagnostic performance using various apparent
diffusion coefficient parameters. AJR Am J Roentgenol. 198:717–722.
2012. View Article : Google Scholar : PubMed/NCBI
|
|
22
|
Elston CW: Classification and grading of
invasive breast carcinoma. Verh Dtsch Ges Pathol. 89:35–44.
2005.PubMed/NCBI
|
|
23
|
Bellip P, Costantini M, Bufi E,
Magistrelli A, La Torre G and Bonomo L: Diffusion-weighted imaging
in breast lesion evaluation. Radiol Med. 115:51–69. 2010.(In
English, Italian). View Article : Google Scholar : PubMed/NCBI
|
|
24
|
Woodhams R, Matsunaga K, Kan S, Hata H,
Ozaki M, Iwabuchi K, Kuranami M, Watanabe M and Hayakawa K: ADC
mapping of benign and malignant breast tumors. Magn Reson Med Sci.
4:35–42. 2005. View Article : Google Scholar : PubMed/NCBI
|
|
25
|
Mori N, Ota H, Mugikura S, Takasawa C,
Tominaga J, Ishida T, Watanabe M, Takase K and Takahashi S:
Detection of invasive components in cases of breast ductal
carcinoma in situ on biopsy by using apparent diffusion coefficient
MR parameters. Eur Radiol. 23:2705–2712. 2013. View Article : Google Scholar : PubMed/NCBI
|
|
26
|
Kato F, Kudo K, Yamashita H, Wang J,
Hosoda M, Hatanaka KC, Mimura R, Oyama-Manabe N and Shirato H:
Differences in morphological features and minimum apparent
diffusion coefficient values among breast cancer subtypes using
3-tesla MRI. Eur J Radio. 185:96–102. 2016. View Article : Google Scholar
|
|
27
|
Byun BH, Noh WC, Lim I, Lee SS, Cho AR,
Park JA, Kim KM, Kim HA, Kim EK, Kim BI, et al: A new method for
apparent diffusion coefficient measurement using sequential
18F-FDG PET and MRI: Correlation with histological grade
of invasive ductal carcinoma of the breast. Ann Nucl Med.
27:720–728. 2013. View Article : Google Scholar : PubMed/NCBI
|
|
28
|
Marini C, Iacconi C, Giannelli M, Cilotti
A, Moretti M and Bartolozzi C: Quantitative diffusion-weighted MR
imaging in the differential diagnosis of breast lesion. Eur Radiol.
17:2646–2655. 2007. View Article : Google Scholar : PubMed/NCBI
|
|
29
|
Tamura T, Murakami S, Naito K, Yamada T,
Fujimoto T and Kikkawa T: Investigation of the optimal b-value to
detect breast tumors with diffusion weighted imaging by 1.5-T MRI.
Cancer Imaging. 14:112014.PubMed/NCBI
|