Introduction
Hepatocellular carcinoma (HCC) is the most common
type of liver cancer globally (1). It
is also the sixth most frequently diagnosed type of neoplasm and
the third most common cause of cancer associated-mortality globally
(2). The late diagnosis of HCC at
advanced stages of the disease (3,4), the
heterogeneous background of HCC cells (5) and high resistance of HCC cells to
conventional chemotherapeutic agents (3,6,7) are considered to be the primary reasons
for the high mortality rates observed in patients with HCC.
At present, two drugs (sorafenib and regorafenib)
are approved by the US Food and Drug Administration (FDA) for
treatment of HCC (8,9). Sorafenib and regorafenib are
multi-kinase targeting drugs, exhibiting only a moderate effect on
HCC cells (5,8). However, the initial approval of
sorafenib by the FDA attracted attention to the development of
novel targeted molecular therapies for the effective treatment of
HCC (3,5,10). Thus
far, the development of other systematic chemotherapeutic
treatments for HCC has largely been unsuccessful (11,12). The
primary reason for this failure is a lack of comprehensive
knowledge on the underlying molecular mechanisms responsible for
drug sensitivity and the resistance of HCC cells to
chemotherapeutic drugs. Thus, understanding of the underlying
molecular mechanisms of the high resistance of advanced stage HCC
cells, or the partial sensitivity of early-stage HCC cells to these
drugs, requires resolution prior to development of successful novel
chemotherapeutic treatments for HCC.
Previous developments in systematic high-throughput
drug screening and genomic and transcriptomic profiling studies on
cancer cell lines and patient tumor samples have provided a number
of publicly available processed and unprocessed datasets, which are
accessible through online databases (13–15).
Analysis of these datasets may reveal previously unidentified
effective small molecules and molecular targets, which may aid the
development of novel strategies for cancer treatment. Integration
of these separate datasets also enhances understanding of these
pathways and mechanisms by revealing novel biological associations
via systems biology approaches.
The purpose of the present study was to analyze
publicly available drug screening results, genetic and gene
expression datasets of in vitro HCC cell lines and to
integrate the obtained data to define molecular players of drug
sensitivity and resistance in HCC cells. Systematic drug treatment
results, genomic alteration data and transcriptomic differences of
14 different HCC cell lines were analyzed, and the obtained results
were integrated into a biological network. These analyses revealed
that there were two sub-groups of HCC cells, which each responded
differently to drug treatments. The results also provided more
comprehensive data regarding drug sensitivity- and
resistance-associated molecular targets in HCC cells, enabling the
development of effective chemotherapeutic strategies.
Materials and methods
Cell lines and drug treatment
results
The Z-score values of 225 different small molecule
treatments on 14 HCC cell lines, 7 epithelial-like and 7
mesenchymal-like cell lines (Table
I), were downloaded from Genomics of Drug Sensitivity in Cancer
(GDSC) database (http://www.cancerrxgene.org/downloads; date of access,
July 2016) (14). Each normalized
Z-score value of a drug indicates the sensitivity (near to −2) or
resistance (near to +2) of HCC cell lines to applied drug
treatment.
 | Table I.HCC cell lines analyzed in the
present study. |
Table I.
HCC cell lines analyzed in the
present study.
| Cell line
number | Cell line name | HCC sub-type | (Refs.) |
|---|
| 1 | HEP3B | E/W | (72–74) |
| 2 | HUH-7 | E/W | (72–75) |
| 3 | HUH-1 | E/W | (75) |
| 4 | HLE | E/U | (72,75,76) |
| 5 | JHH-4 | E/W | (74,75) |
| 6 | JHH-6 | E/W | (75) |
| 7 | JHH-7 | E/W | (75) |
| 8 | JHH-2 | M/P | (75) |
| 9 | SNU-475 | M/P | (73,74) |
| 10 | SNU-182 | M/P | (73,74) |
| 11 | SNU-398 | M/P | (73,74) |
| 12 | SNU-387 | M/P | (73,74) |
| 13 | SNU-423 | M/P | (73,74) |
| 14 | SNU-449 | M/P | (73,74) |
Cluster analyses
The results of drug treatments were used during
cluster analyses. Cluster analyses were performed using an
unsupervised hierarchical average linkage clustering method with
Cluster software (version 3.0) (16).
Obtained results were visualized using Java Tree View software
(version 1.1) (17).
Drug sets and Gene Set Enrichment
Analysis (GSEA) experiments
Data used in the cluster analyses were re-processed
for GSEA studies. Data from 18 small molecule treatments that were
missing values for ≥25% of the samples (4 cell lines) were
discarded to achieve true statistical results. The remaining 207
small molecule treatment datasets were utilized for GSEA studies.
All small molecules used in the cluster analyses were grouped
according to their known molecular targets to generate drug sets
and run GSEA. A total of 33 drug sets, which include data
concerning ≥3 small molecules targeting the same biological
molecule were generated and utilized during GSEA experiments
(Table II). Drug treatment responses
of Group A and Group B cells, which were divided by cluster
analysis, were compared using generated drug sets and GSEA desktop
software (version 2.2.3) with the Diff_of_Classes metric ranking
method (18). P-values and false
discovery rate (FDR) values for each drug set were generated using
the GSEA software.
| Table II.List of drug sets. |
Table II.
List of drug sets.
| Drug set
name/molecular targets | Size | Small molecules of
drug sets |
|---|
| PI3K | 10 | AS605240,
AZD6482_1, AZD6482_2, BEZ235, CAL-101, GDC0941, GSK2126458, PI-103,
PIK-93, ZSTK474 |
| HDAC | 9 | AR-42, Belinostat,
CAY10603, CUDC-101, JQ12, LAQ824, Tubastatin_A, VNLG/124,
Vorinostat |
| EGFR | 7 | Afatinib_1,
Afatinib_2, Cetuximab, CUDC-101, EKB-569, Gefitinib, OSI-930 |
| KIT | 7 | AMG-706, Axitinib,
Masitinib, Midostaurin, OSI-930, Pazopanib, XL-184 |
| CDK9 | 6 | AT-7519, JNK-9L,
KIN001-270, NG-25, THZ-2-49, TL-1-85 |
| MEK1-2–5 | 6 | BIX02189,
PD-0325901, RDEA119_1, Selumetinib_1, Selumetinib_2,
Trametinib |
| VEGFR | 6 | AMG-706, Axitinib,
OSI-930, Pazopanib, Tivozanib, XL-184 |
| JAK1-2–3 | 5 | CEP-701,
KIN001-055, QL-X-138, Ruxolitinib, TG101348 |
| PARP1-2 | 5 | AG-014699,
Olaparib_1, Olaparib_2, Talazoparib, Veliparib |
| PDGFR | 5 | AMG-706, Axitinib,
MP470, OSI-930, Pazopanib |
| AKT | 4 | AKT_inhibitor_VIII,
GSK690693, KIN001-102, MK-2206 |
| BRAF | 4 | Dabrafenib,
PLX4720_1, PLX4720_2, SB590885 |
| BRD2-3–4 | 4 | I-BET-762, JQ1_1,
JQ1_2, PFI-1 |
| CDK1-4-6-7-pan | 4 | PD-0332991,
PHA-793887, RO-3306, THZ-2-102-1 |
| FLT1-3–4 | 4 | AC220, CEP-701,
WZ3105, XL-184 |
| HSP70-90 | 4 | 17-AAG, AUY922,
Elesclomol, SNX-2112 |
| IGF1R | 4 | BMS-536924,
BMS-754807, GSK1904529A, Lisitinib |
| IKK | 4 | BMS345541, BX-795,
KIN001-260, TPCA-1 |
| Microtubules | 4 | Docetaxel,
Epothilone_B, Vinblastine, Vinorelbine |
| ALK | 3 | CH5424802,
SB505124, SB52334 |
| AURK | 3 | BX-795,
Genentech_Cpd_10, GSK1070916 |
| BCL2-XL-W | 3 | Navitoclax,
Obatoclax_Mesylate, TW-37 |
| BTK | 3 | LFM-A13, QL-X-138,
QL-XII-47 |
| DNA-PK | 3 | NU-7441, PI-103,
QL-X-138 |
| ERBB2 | 3 | Afatinib_1,
Afatinib_2, CP724714 |
| JNK | 3 | AS601245, JNK-9L,
JNK_Inhibitor_VIII |
| MDM2 | 3 | JNJ-26854165,
NSC-207895, Nutlin-3a (−) |
| mTOR | 3 | GSK2126458,
QL-X-138, Temsirolimus |
| mTORC1-2 | 3 | AZD8055, BEZ235,
OSI-027 |
| PDK1 | 3 | BX-912, KIN001-244,
OSU-03012 |
| RET | 3 | AMG-706, CEP-701,
XL-184 |
| ROCK1-2 | 3 | GSK269962A,
GSK429286A, Y-39983 |
| TOP1-2 | 3 | Camptothecin,
Etoposide, SN-38 |
Determination of small molecule
treatment sensitivity-associated somatic mutations
Lists of genes that are associated with the
determined molecular targets [epidermal growth factor receptor
(EGFR), mechanistic target of rapamycin (mTOR), DNA-dependent
protein kinase (DNA-PK), aurora kinases (AURK), Bruton's tyrosine
kinase (BTK) and phosphoinositide 3-kinase (PI3K); Table III] in different cellular pathways
were downloaded from the Molecular Signatures Database (MSigDB;
version 6.1; http://software.broadinstitute.org/gsea/msigdb; date
of access, December 2017) (19). A
total of 553 unique genes were determined. Somatic mutations to
these genes in 14 HCC cell lines were screened using the Catalogue
of Somatic Mutations in Cancer (COSMIC) database (versions 77 and
78; http://cancer.sanger.ac.uk/cosmic;
date of access, September 2016) (15). Somatic mutation data for selected
genes that were mutated exclusively in >50% of a group are
presented in Table IV.
| Table III.List of significantly enriched drug
sets. |
Table III.
List of significantly enriched drug
sets.
| Rank | Name | Size | ES | NOM P-value | FDR q-value |
|---|
| 1 | EGFR | 7 | 0.869 | 0.007 | 0.151 |
| 2 | mTOR | 3 | 0.957 | 0.013 | 0.118 |
| 3 | DNA-PK | 3 | 0.957 | 0.016 | 0.136 |
| 4 | AURK | 3 | 0.952 | 0.016 | 0.164 |
| 5 | BTK | 3 | 0.902 | 0.039 | 0.173 |
| 6 | PI3K | 10 | 0.829 | 0.046 | 0.218 |
| Table IV.Somatic mutations, possibly
associated with drug response profiles of hepatocellular carcinoma
cell lines and Groups. |
Table IV.
Somatic mutations, possibly
associated with drug response profiles of hepatocellular carcinoma
cell lines and Groups.
| Gene | Mutant cell lines,
n | Cell line | Group | AA mutation | Transcript ID | CDS mutation | Zygosity | Val. | Mut. type |
|---|
| ITPR2 | 4 | HUH-7 | A | p.L1859L |
ENST00000381340 | c.5577A>G | Het. | U. | S.-C. |
|
|
| JHH-6 | A | p.T969I |
ENST00000381340 | c.2906C>T | Het. | V. | S.-M. |
|
|
| JHH-7 | A |
p.E1614_M1621>V |
ENST00000381340 |
c.4841_4861del21 | Het. | V. | Comp. |
|
|
| HEP3B | A | p.T728N |
ENST00000381340 | c.2183C>A | Het. | U. | S.-M. |
|
|
| HEP3B | A | p.V1508I |
ENST00000381340 | c.4522G>A | Het. | U. | S.-M. |
| PIK3R4 | 4 | JHH-2 | B | p.D473V |
ENST00000356763 | c.1418A>T | Het. | V. | S.-M. |
|
|
| SNU-182 | B | p.R1033S |
ENST00000356763 | c.3099A>T | Het. | V. | S.-M. |
|
|
| SNU-387 | B | p.R495R |
ENST00000356763 | c.1483A>C | Het. | U. | S.-C. |
|
|
| SNU-423 | B | p.V345F |
ENST00000356763 | c.1033G>T | Het. | V. | S.-M. |
Gene expression values of HCC cell
lines
Whole transcriptome datasets from 14 HCC cell lines,
which were generated by the Cancer Cell Line Encyclopedia (20) using Affymetrix Human Genome U133 Plus
2.0 gene chip arrays, were downloaded from Gene Expression Omnibus
database (GSE36133 data series; https://www.ncbi.nlm.nih.gov/geo/query/acc.cgi?acc=GSE36133)
(13). Raw data were normalized using
BRB Array Tools software (version 4.5.1) using a Robust Multi-Array
Average quantile normalization method (21). Gene expression values of the
aforementioned 553 genes, which were analyzed using the COSMIC
database (15), were determined.
Genes that exhibited ≥1.5-fold and statistically significant
(P<0.05) differential expression between Group A and Group B HCC
cells were determined using the class comparison tool of the BRB
Array Tools software, with default parameters (Table V).
| Table V.List of 13 differentially expressed
genes between Group A and Group B HCC cells. |
Table V.
List of 13 differentially expressed
genes between Group A and Group B HCC cells.
| Rank | ProbeSet | Gene symbol | Group A | Group B | Fold change | P-value | FDR |
|---|
| 1 | 226213_at | ERBB3 |
9.39 |
5.54 |
3.85 | 0.002 | 0.12 |
| 2 | 228912_at | VIL1 |
7.33 |
4.15 |
3.19 | 0.015 | 0.22 |
| 3 | 228716_at | THRB |
8.79 |
6.77 |
2.03 | 0.001 | 0.07 |
| 4 | 232530_at | PLD1 |
7.90 |
6.07 |
1.83 | 0.001 | 0.11 |
| 5 | 238441_at | PRKAA2 |
7.84 |
6.13 |
1.72 | 0.001 | 0.07 |
| 6 | 202609_at | EPS8 | 11.37 |
9.83 |
1.54 | 0.014 | 0.22 |
| 7 | 38037_at | HBEGF |
6.00 |
7.60 | −1.61 | 0.005 | 0.14 |
| 8 | 219383_at | PRR5L |
5.04 |
6.69 | −1.65 | 0.009 | 0.18 |
| 9 | 202742_s_at | PRKACB |
7.67 |
9.38 | −1.71 | 0.001 | 0.10 |
| 10 | 203085_s_at | TGFB1 |
7.97 |
9.75 | −1.78 | 0.014 | 0.22 |
| 11 | 212912_at | RPS6KA2 |
3.68 |
6.08 | −2.40 | 0.006 | 0.14 |
| 12 | 1556499_s_at | COL1A1 |
7.10 | 11.85 | −4.76 | 0.006 | 0.14 |
| 13 | 201842_s_at | EFEMP1 |
6.14 | 10.94 | −4.81 | 0.005 | 0.14 |
Integrated pathway analysis
Pathway visualization analyses were performed using
PathVisio Software (version 3.2.3) (22). Known molecular interactions of the
differentially expressed and mutant genes were retrieved from
Wikipathways (23), Consensus Path
(24) and Kyoto Encyclopedia of genes
and genomes databases (date of access, December 2016) (25); and integrated using PathVisio
software. Visualization of the differentially expressed genes was
performed based on the microarray gene expression results.
Results
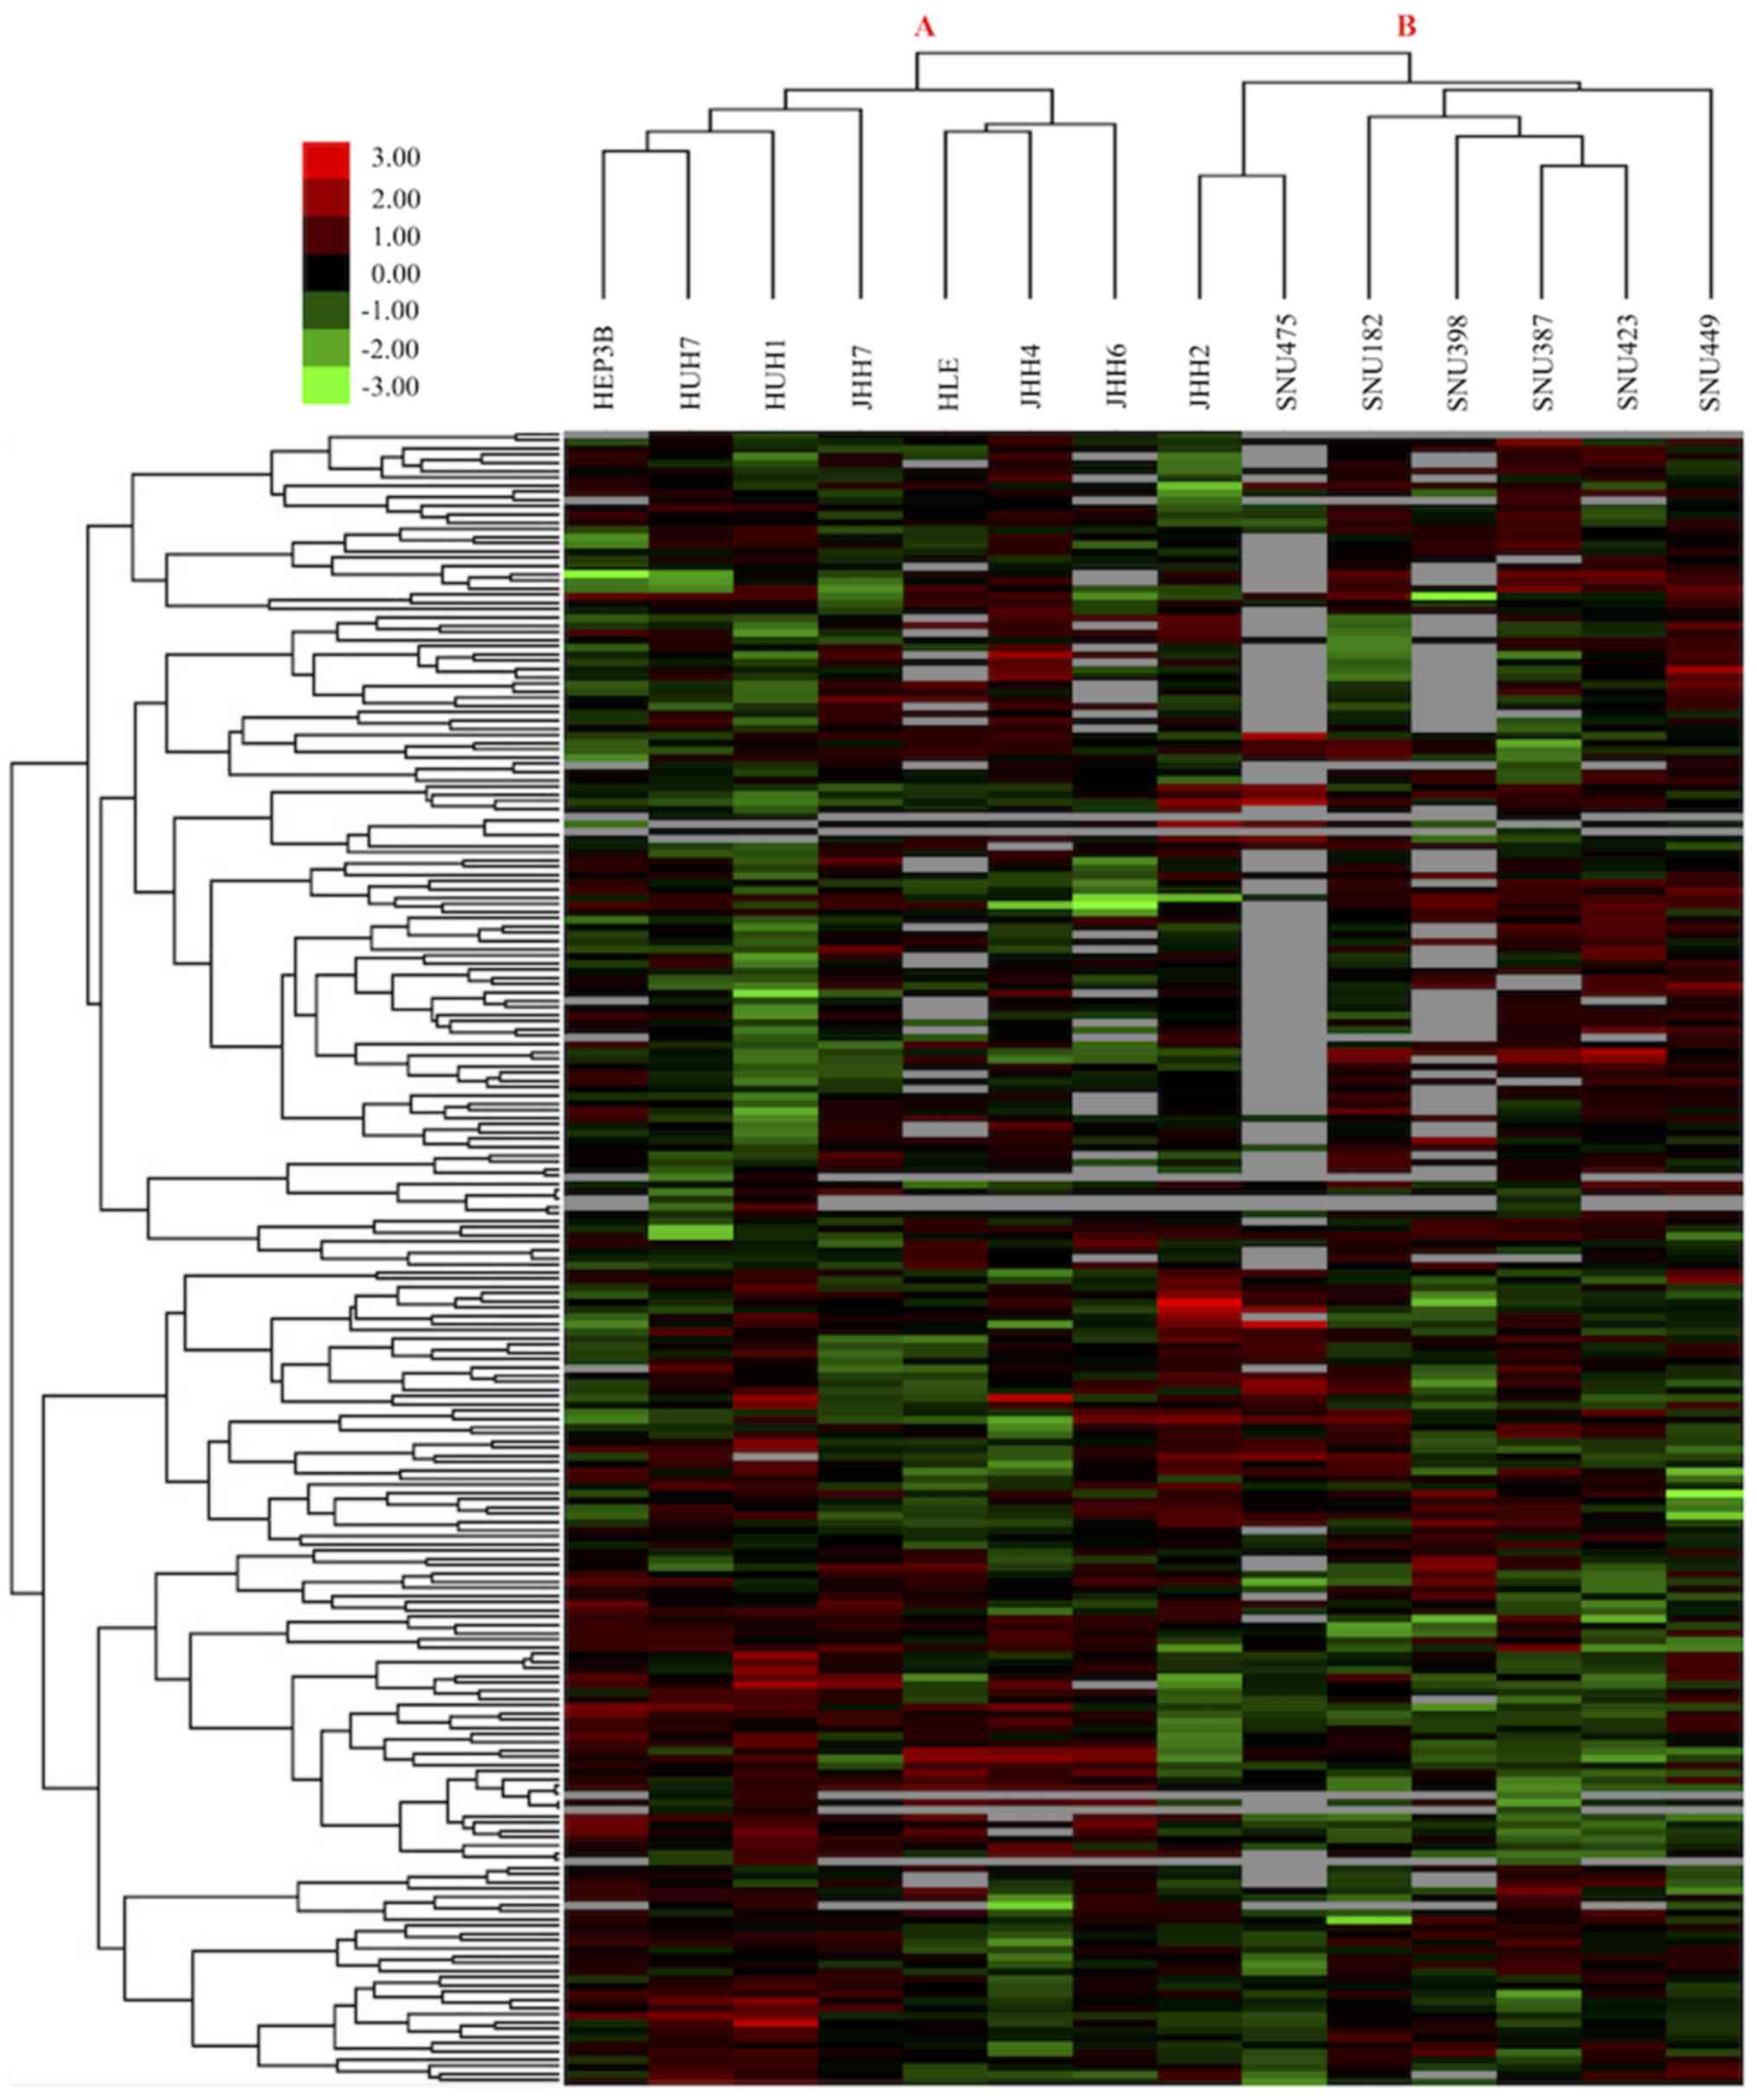
HCC cell lines consist of two groups
according to their drug response profiles
To identify drug treatment response characteristics
of HCC cell lines and determine effective drugs and molecular
targets for the treatment of HCC, small molecule treatment Z-score
values of 14 HCC cell lines were downloaded from the GDSC database
(14). Results of 225 treatments on
14 HCC cell lines were analyzed using the aforementioned clustering
method to determine the global treatment response profiles of HCC
cells. Unsupervised hierarchical clustering analysis revealed two
main groups of HCC cell lines according to their sensitivity to
drug treatments (Fig. 1). The first
group of HCC cells, Group A cells, was comprised of 7
epithelial-like HCC cell lines; whereas the second group, Group B
cells, was comprised of 7 mesenchymal-like HCC cells (Table I). This result indicates that although
all cells analyzed were HCC cells, epithelial-like and
mesenchymal-like HCC cells responded differently to the same drug
treatments.
Effective molecular targets of
drug-sensitive Group A epithelial-like HCC cells were
identified
To determine the list of molecular targets, which
are associated with the treatment response characteristics of Group
A and Group B cells, GSEA studies were performed. Since GSEA
compares two sample groups and determines statistically
significantly enriched sets in each group, 33 drug sets that
included ≥3 different small molecules with the same biological
target were generated using the data downloaded from GDSC (Table II). GSEA results revealed that 28/33
drug sets (85%) were enriched (effective) on Group A cells, and
that 6 of them (18%) were significantly enriched (P<0.05;
Table III); whereas the remaining 5
drug sets (15%) were enriched in Group B cells; however, none of
them were statistically significant. The significantly
drug-sensitive molecular targets in Group A HCC cells were; EGFR,
mTOR, DNA-PK, AURK, BTK and PI3K (Table
III). Therefore, GSEA results identified molecular targets and
drugs associated with drug sensitivity in epithelial-like Group A
HCC cells.
Somatic mutations associated with
treatment response profiles of Group A and Group B HCC cells were
determined
To identify genetic factors that were possibly
associated with drug sensitivity in Group A cells and drug
resistance of Group B cells, genetic variation data (somatic
mutations, fusions, breakpoints) of all genes biologically function
with the determined 6 molecular targets were analyzed. First, a
list of all biologically functioning genes with 6 determined
molecular targets was retrieved from MSigDB. A total of 553 unique
genes, which directly or indirectly interact with the determined
molecular target in at least one signaling pathway, were
identified. Genetic variation data of all 553 genes in 14 HCC cell
lines were assessed using the COSMIC database. The two genes that
were exclusively mutated in >50% of a group were considered to
be potentially associated with the drug response profile of HCC
cell lines and groups (Table IV).
The inositol 1,4,5-trisphosphate receptor type 2 (ITPR2) gene
exhibited 5 distinct mutations in 4 Group A HCC cell lines (HUH-7,
JHH-6, JHH-7 and HEP3B); whereas phosphoinositide-3-kinase
regulatory subunit 4 (PIK3R4) gene exhibited 4 distinct mutations
in 4 Group B HCC cell lines (JHH-2, SNU-182, SNU-387, SNU-423;
Table IV). As a result, 553 genes
that function with the 6 determined molecular targets were
identified; and 2 genes with somatic mutations possibly associated
with small molecule treatment responses of Group A and Group B HCC
cells were identified.
Molecular targets and highly
differentially expressed genes were determined
To identify differentially expressed genes that had
potential functions in sensitivity and resistance responses of
Group A and Group B HCC cells, respectively, when the determined 6
molecules were targeted, whole genome transcriptomics data of the
same 14 HCC cell lines were downloaded and analyzed. Gene
expression profiles of the aforementioned 553 genes were determined
for Group A and Group B HCC cells, and 13 genes that exhibited
≥1.5-fold and statistically significant (P<0.05) differential
expression between the two groups were selected (Table V). Among the 13 selected genes, 6
genes were upregulated in Group A HCC cells, and 7 genes were
upregulated in Group B HCC cells (Table
V). In conclusion, gene expression profiles of untreated Group
A and Group B HCC cells were determined and 13 differentially
expressed genes associated with previously defined molecular
targets were identified.
Integrated multi-omics results of
Group A HCC cells revealed a drug-sensitive molecular network of
HCC
To identify a simple molecular interaction network
of drug-sensitive molecular targets for Group A HCC cells, the
determined pharmacogenomics and transcriptomic results were
integrated into one molecular pathway. Enriched drug targets and
drugs (Table III), mutant genes
(Table IV) and differentially
expressed genes (Table V) results for
drug-sensitive Group A HCC cell lines were integrated into one
pathway and visualized based on their known interactions in pathway
databases (23–25) (Fig. 2).
The integration of multi-omics data of Group A HCC cells revealed
the molecular network of drug-sensitive HCC cells (Fig. 2).
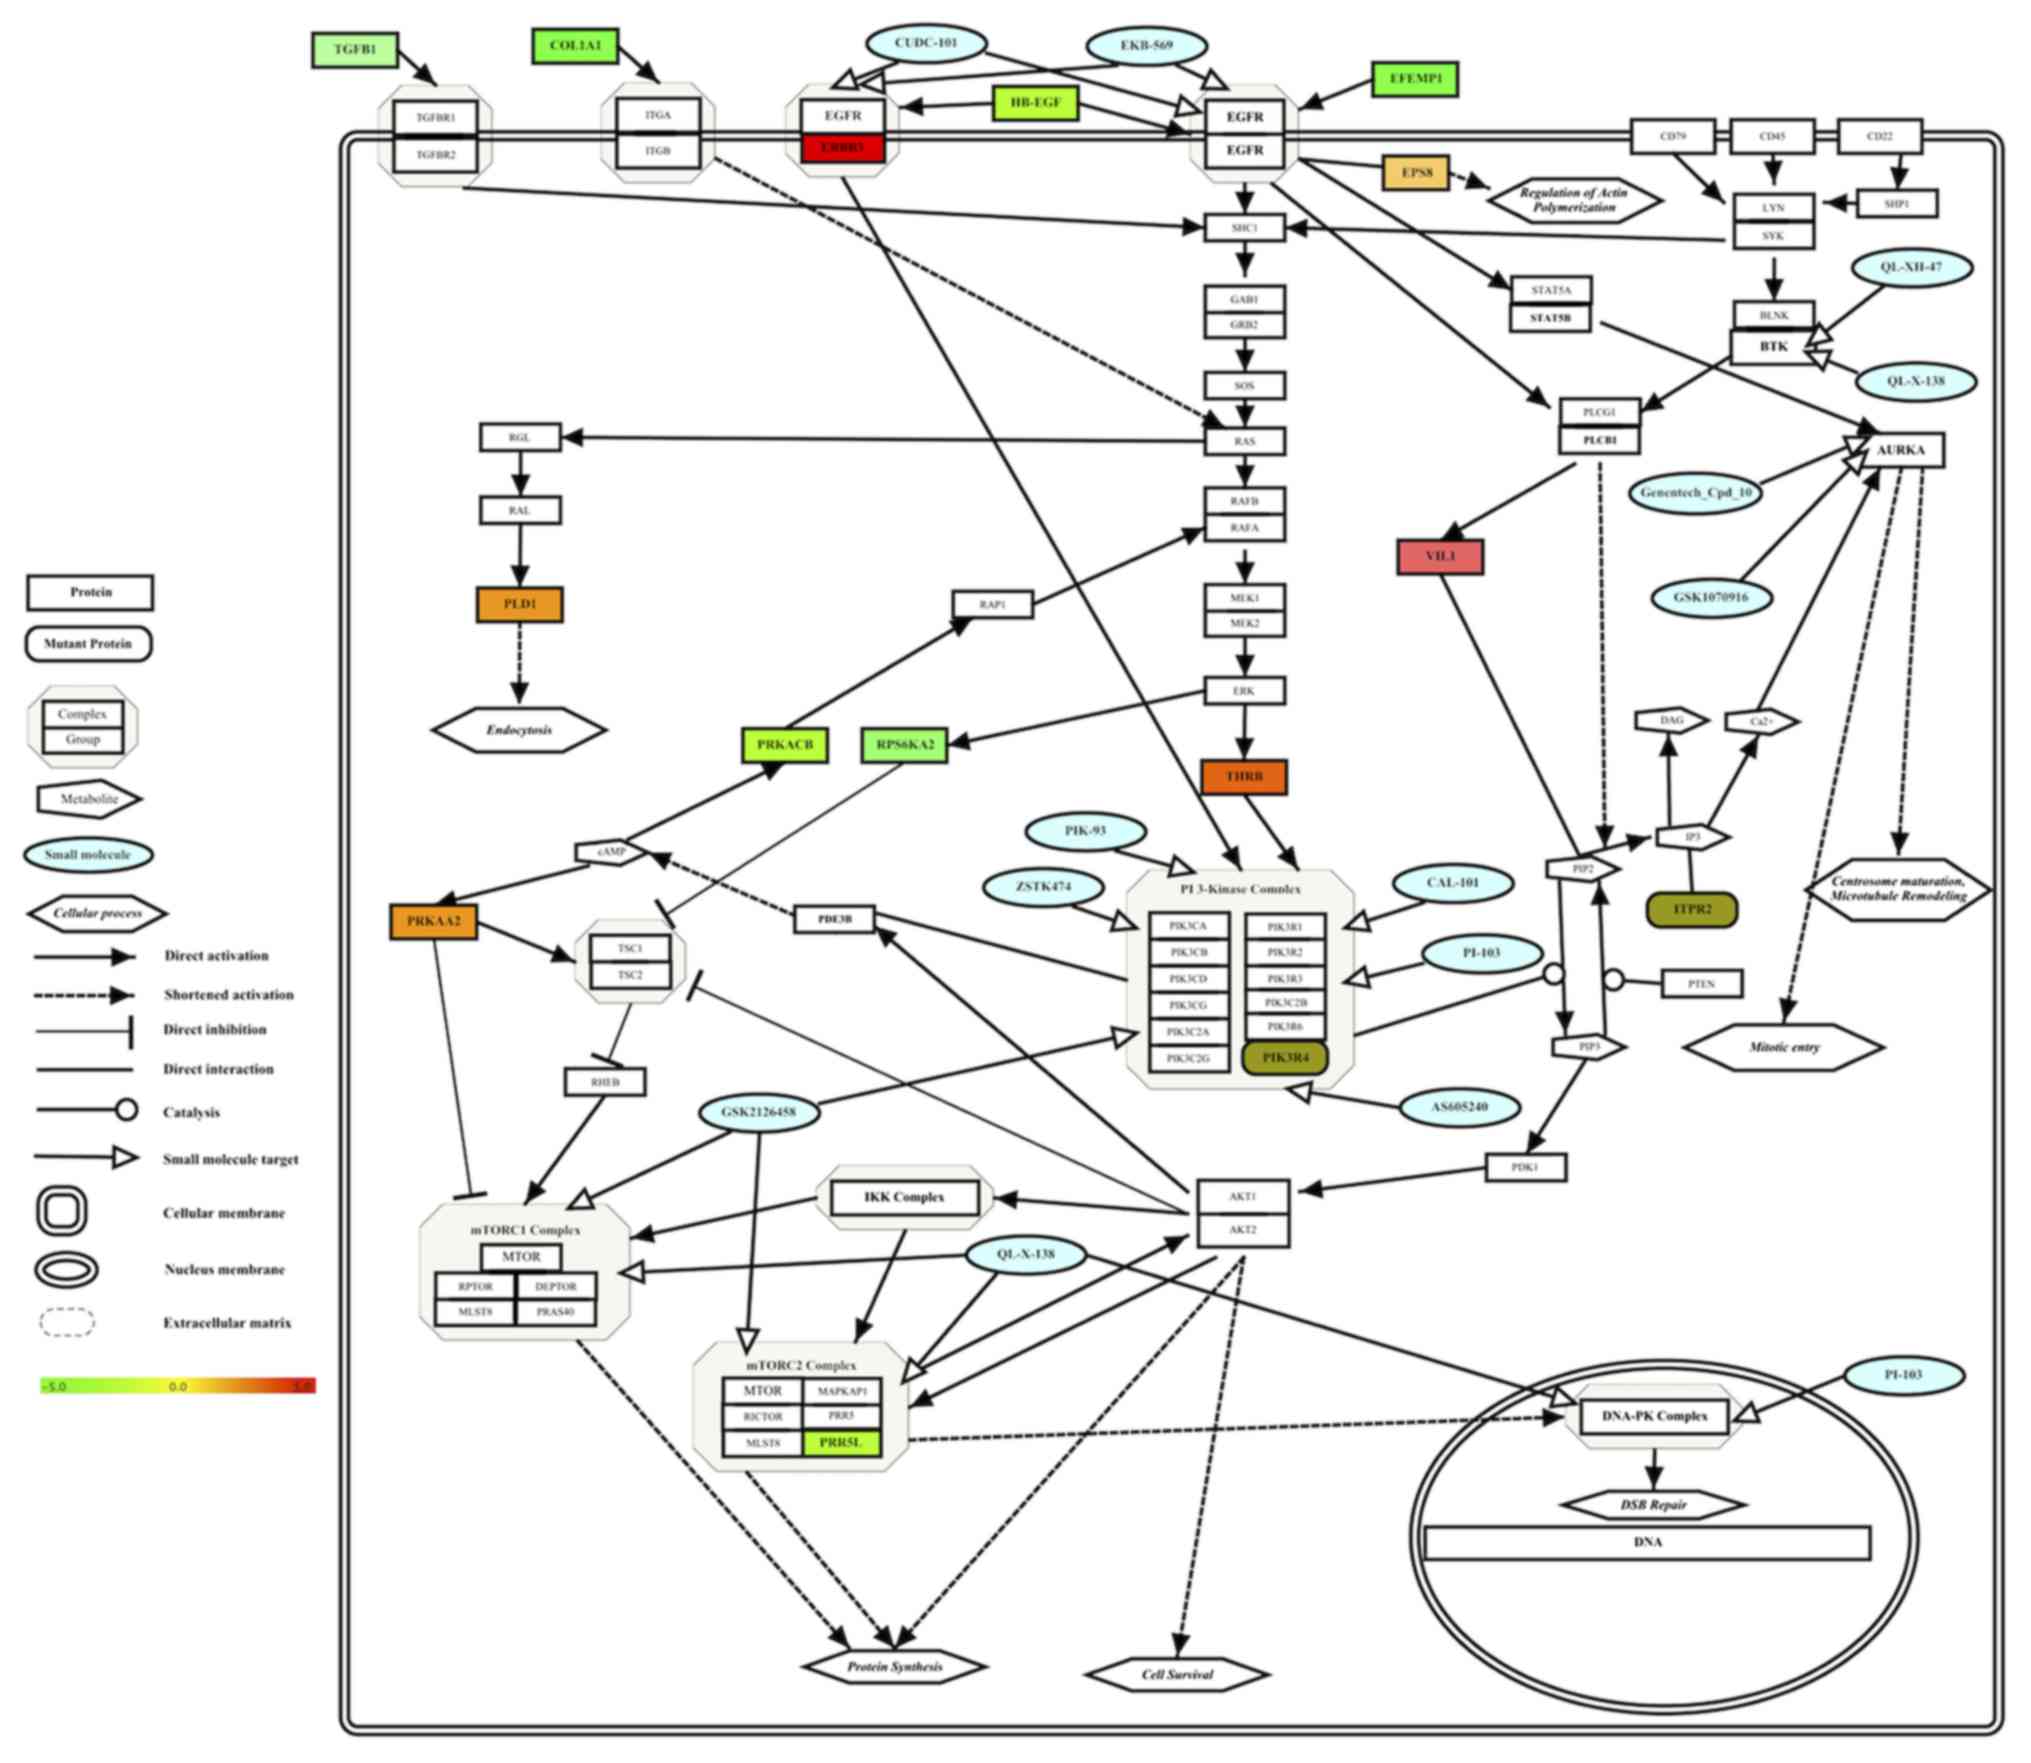 | Figure 2.Integrated molecular pathway of small
molecule sensitivity in Group A HCC cell lines. Effective drugs (in
blue color), enriched drug targets (Table III), target-associated somatically
mutant genes (Table IV) and
differentially expressed genes (Table
V) in HCC cell lines were integrated into one pathway and
visualized. Gene expression levels are depicted in a color gradient
between −5 (downregulated, color) and +5 (upregulated, red) by the
software, as indicated by the color bar. Gene Symbols were
retrieved from Human Genome Organisation Gene Nomenclature
Committee (71) using the software.
PIP3, phosphatidylinositol (3,4,5)-trisphosphate; PIP2, phosphatidylinositol
(4,5)-bisphosphate; IP3, inositol trisphosphate;
DAG, diacylglycerol; cAMP, cyclic adenosine monophosphate; ER,
endoplasmic reticulum; HCC, hepatocellular carcinoma. |
Discussion
The FDA approval of the multi-kinase inhibitor
sorafenib for the treatment of HCC led to an acceleration in the
search for effective molecular targets and molecularly targeted
chemotherapeutic drugs against HCC. Thus far, only one additional
drug, regorafenib, has been approved for HCC treatment by the FDA.
The complex and heterogeneous characteristics of HCC cells are
considered to be among the main obstacles to identification of
effective drugs for use against HCC (26). The present study determined that there
were two main subgroups of HCC cells in terms of drug treatment
response profiles (Fig. 1). The first
group (Group A) consisted of epithelial-like HCC cells, and the
second group (Group B) consisted of mesenchymal-like HCC cells
(Fig. 1; Table I). Mesenchymal-like HCC cells emerge
following epithelial-to-mesenchymal transition, and their presence
corresponds to an advanced stage of HCC (27). In contrast, the epithelial-like HCC
cells retain the original hepatocyte epithelial morphology. These
two groups of HCC cells exhibited distinct sensitivities to
identical drug treatments. There was no drug that was effective on
all HCC cell types among the 225 small molecules analyzed.
A comparison of drug treatment responses of the two
groups via GSEA revealed the molecular targets sensitive to drug
treatment in the two groups of HCC cells (Table III). GSEA results demonstrated that
Group A cells, which are comprised of early-stage HCC cells, are
more sensitive than Group B cells, which are comprised of
advanced-stage HCC cells, to small molecule treatments that target
six molecules (Table III). Thus,
targeting these molecules with the analyzed drugs cannot yield
successful results in advanced-stage HCC cells, but it may be a
useful strategy for the treatment of early-stage HCC cells. Since
the majority of the identified treatment-sensitive molecular
targets in the present study have been studied previously as
potential treatment targets for HCC and other types of cancer
(10,11,28), it is
known that they are ineffective targets in HCC cells, although
drugs targeting these molecules are effective in other types of
cancer, (5,26). In addition, the results of the present
study indicated that early-stage HCC cells are more sensitive to
drug treatments that advanced-stage HCC cells. Thus, the
identification of altered molecular mechanisms and novel molecules
responsible for the observed differences between the two groups of
HCC cells is required to improve treatment outcomes. The results of
GSEA in the present study provide valuable information to further
analyze and understand the underlying molecular mechanisms of drug
sensitivity and resistance in HCC cells. Therefore, molecules that
cooperate with the defined molecular targets and genes that are
somatically mutated (Table IV) and
differentially expressed were determined (Table V).
The PI3K/RAC serine/threonine-protein kinase
(AKT)/mTOR signaling pathway serves a function in cell growth,
proliferation, angiogenesis, metabolism and mechanisms of
anti-apoptosis in hepatocytes (29–31). The
data in the present study revealed that mTOR and PI3K are effective
molecular targets for the treatment of epithelial-like (early) HCC
cells, but not for mesenchymal-like (advanced) HCC cells. PI3K may
be activated following the activation of certain receptors,
including the insulin receptor and EGFR, which is another target
molecule identified in the present study (32,33).
Active PI3K catalyzes the generation of phosphatidylinositol
(3,4,5)-trisphosphate (PIP3) from
phosphatidylinositol (4,5)-bisphosphate (PIP2) and causes the
activation of AKT (34–36). Activated AKT phosphorylates and
activates several molecules, including mTOR (29,35).
Active mTOR increases cell proliferation, survival and angiogenesis
as a component of mTOR complex 1 (mTORC1) and mTORC2 (36,37). This
signaling pathway is negatively regulated by phosphatase and tensin
homolog (35,38). The PI3K/AKT/mTOR pathway is activated
in 15–41% of HCCs, and inhibitors of this signaling pathway
exhibited anti-neoplastic activities in experimental HCC models
(11). The results of the present
study identified that the EGFR/PI3K/AKT/mTOR signaling pathway
serves a central function in the regulation of drug sensitivity and
resistance in HCC cells (Fig. 2;
Table III).
BTK is a non-receptor intracellular kinase that is
mainly expressed in B-lymphocytes. BTK functions via B-cell
receptor (BCR) signaling and the PI3K/AKT pathway. Antigen-bound
BCRs bind to Lck/Yes novel kinase and spleen tyrosine kinase, and
phosphorylate and activate PI3K, which converts PIP2 to PIP3, to
which BTK and AKT proteins bind. Numerous BTK inhibitors have
exhibited promising therapeutic activities in hematological
malignancies; however, further studies are required to identify the
roles of BTK in HCC (39).
Aurora kinases (AURKA, AURKB and AURKC) are
serine/threonine kinases that control cell division. These kinases
serve a pivotal function during the mitotic phase of the cell cycle
and are targeted by small molecule inhibitors. AURKC is expressed
in the testes, whereas AURKA and AURKB may serve functions in
different sub-cellular compartments. However, all three Aurora
proteins perform crucial functions during chromosomal arrangement
and the control processes of mitotic spindle apparatus formation
(40). In addition, all three
proteins are overexpressed in numerous types of cancer (41). In cancer cells, including HCC, Aurora
kinases inhibit apoptosis and promote cellular proliferation and
metastasis (42). AURKA is directly
associated with the EGFR/PI3K/Akt/mTOR pathway, since active EGFR
signaling is able to upregulate expression of AURKA through the
FR/PI3K/Akt/mTOR signaling axis (43).
DNA-PK is a multi-protein complex that is primarily
comprised of Ku70 [encoded by X-ray repair cross complementing 6
(XRCC6)], Ku80 (encoded by XRCC5) and the catalytic subunit DNA-PK
catalytic subunit (DNA-PKcs), which is encoded by protein kinase
DNA-activated catalytic polypeptide (44). DNA-PKcs may be activated following DNA
damage (44–46); it serves a pivotal function in the
non-homologous end-joining mechanism of DNA double-strand break
repair (47,48). It has been identified that DNA-PK
serves a function in the initiation and progression of cancer, and
the therapeutic resistance of multiple types of cancer, including
HCC (49–52). DNA-PK directly interacts with AKT and
increases its activity (53,54). Therefore, DNA-PK may function
independently as a member of the PI3K-AKT-mTOR axis. In conclusion,
all 6 drug sensitivity-associated targets identified via GSEA study
are biologically functional together in the EGFR-PI3K-mTOR-DNAPK
signaling axis, and targeting this axis renders early-stage Group A
HCC cells sensitive to drug treatments, but not advanced-stage
Group B HCC cells.
Following identification of the central signaling
axis, known genomic variants of the same 14 HCC cells associated
with the drug response profiles of Group A and Group B cells were
analyzed. Following analysis of genomic variation using the COSMIC
database, somatic mutations to 2 genes were determined as possibly
biologically associated, since ITPR2 and PIK3R4 genes are
exclusively mutated in Group A and Group B cells, respectively
(Table IV).
The ITPR2 gene, which encodes a receptor of IP3, is
mutated in 4 Group A cell lines (HUH-7, JHH-6, JHH-7 and HEP3B;
P=0.039; Table IV). Upregulated
ITPR2 expression is a biomarker of poor prognosis in patients with
acute myeloid leukemia (55). ITPR2
was also identified as a susceptibility gene for Kashin-Beck
disease (56). ITPR2 may cause an
increase of cytoplasmic calcium following binding to IP3 (57); it also serves functions in
oncogene-induced senescence and replicative senescence by
regulating calcium levels, and the loss of ITPR2 causes escape from
cellular senescence (57). Since
cellular senescence is a mechanism of hepatocellular carcinogenesis
(58), the effect of the identified
ITPR2 mutation on HCC cells should be further investigated.
PIK3R4, which encodes the serine/threonine-protein
kinase VPS15, exhibited 4 distinct mutations in 4 Group B HCC cell
lines (JHH-2, SNU-182, SNU-387, SNU-423; P=0.039; Table IV). PIK3R4 functions with protein
kinase AMP-activated catalytic subunit α2 (PRKAA2; one of the genes
upregulated in Group A HCC cells) in the autophagy pathway
(25), indicating that it may serve a
role in the drug sensitivity of Group A HCC cells. PIK3R4 is also a
member of the PI3K complex, and serves a function in autophagy as a
member of the class III PI3K complex (59). The over-expression of the PIK3R4 gene
in patients with chronic lymphocytic leukemia (CML) has been
associated with the prognosis of CML (60). This gene has also been identified to
be mutated in certain thymic epithelial tumors and metastatic
melanoma samples (61,62). Copy number aberrations of PIK3R4 have
been associated with decreased survival rates of patients with
ovarian cancer (63). The
statistically significant presence of mutated PIK3R4 in the
treatment-resistant Group B cells indicates the possible function
served by PIK3R4 mutations in the drug response profiles of HCC
cells.
Transcriptomics analyses on HCC cells revealed that
six genes are significantly upregulated and seven genes are
downregulated in Group A cells (Table
V). Roles of the transcriptionally deregulated genes in drug
sensitivity of Group A cells require further study. Supporting this
hypothesis, the activation of PRKAA2 protein sensitizes HCC cells
to a number of drug treatments (64–67). Thus,
the upregulation of PRKAA2 in drug-sensitive HCC cells may serve a
central function in the observed response to treatment. For the
other genes differentially upregulated in Group A HCC cells, there
is a limited amount of available data concerning the effects of
their transcriptional upregulation in HCC. Upregulated expression
of villin 1 was identified as a predictive factor for the
recurrence of high serum α-fetoprotein-associated HCC following
hepatectomy (68). Erb-B2 receptor
tyrosine kinase 3 (ERBB3) mRNA was upregulated in 52% of HCC tumors
(69), and secreted ERBB3 isoforms
were identified as serum markers for early hepatoma in patients
with chronic hepatitis and cirrhosis (70). Therefore, the roles of these genes in
drug sensitivity and resistance mechanisms of HCC cells should be
studied further.
Since all the treatment-sensitive molecular targets
identified possess biological functions, and the mutated and
differentially expressed genes are also associated with these
molecules, the results of multi-omics data analysis were integrated
into a simple molecular interaction network to analyze the
treatment sensitivity-associated molecular mechanisms of HCC cells
better (Fig. 2). This shortened, drug
treatment sensitivity-associated molecular network of HCC cells can
be used to generate novel hypotheses for further experimentation to
reveal the underlying molecular mechanisms of drug sensitivity and
resistance in HCC cells. For example, since the integrated
molecular network identifies the molecular pathway of Group A HCC
cells (Fig. 2), which are sensitive
to treatments with drugs depicted in green, it may be of interest
to examine whether activation of the EGFR-PI3K-mTOR-DNAPK axis via
external or constitutively active internal signals in Group B HCC
cells renders them sensitive to the same drugs. This approach may
provide valuable information, enabling the development of novel
combined drug treatment approaches against advanced-stage HCC
cells.
In conclusion, the results of high-throughput drug
treatment experiments on HCC cells analyzed in the present study
indicate that molecular targeted, personalized chemotherapeutic
approaches should be developed for the treatment of HCC, since
distinct HCC cell types respond differently to the same drug
treatments. Novel molecular targets and their biological
associations identified in the present study should be further
investigated to develop targeted molecular drug therapies against
HCC.
Acknowledgements
Not applicable.
Funding
No funding was received.
Availability of data and materials
All datasets analyzed during the present study are
available in cited public databases. All data analyzed during the
present study are included in the published article.
Authors' contributions
GY analyzed the data and wrote the manuscript.
Ethics approval and consent to
participate
Not applicable.
Consent for publication
Not applicable.
Conflict of interest
The author declares that there are no competing
interests.
References
|
1
|
McGlynn KA, Petrick JL and London WT:
Global epidemiology of hepatocellular carcinoma: An emphasis on
demographic and regional variability. Clin Liver Dis. 19:223–238.
2015. View Article : Google Scholar : PubMed/NCBI
|
|
2
|
Torre LA, Bray F, Siegel RL, Ferlay J,
Lortet-Tieulent J and Jemal A: Global cancer statistics, 2012. CA
Cancer J Clin. 65:87–108. 2015. View Article : Google Scholar : PubMed/NCBI
|
|
3
|
Shin JW and Chung YH: Molecular targeted
therapy for hepatocellular carcinoma: Current and future. World J
Gastroenterol. 19:6144–6155. 2013. View Article : Google Scholar : PubMed/NCBI
|
|
4
|
Balogh J, Victor D III, Asham EH,
Burroughs SG, Boktour M, Saharia A, Li X, Ghobrial RM and Monsour
HP Jr: Hepatocellular carcinoma: A review. J Hepatocell Carcinoma.
3:41–53. 2016. View Article : Google Scholar : PubMed/NCBI
|
|
5
|
Colagrande S, Inghilesi AL, Aburas S,
Taliani GG, Nardi C and Marra F: Challenges of advanced
hepatocellular carcinoma. World J Gastroenterol. 22:7645–7659.
2016. View Article : Google Scholar : PubMed/NCBI
|
|
6
|
Barranco SC, Haenelt BR and Gee EL:
Differential sensitivities of five rat hepatoma cell lines to
anticancer drugs. Cancer Res. 38:656–660. 1978.PubMed/NCBI
|
|
7
|
Ferroudj S, Yildiz G, Bouras M, Iscan E,
Ekin U and Ozturk M: Role of fanconi anemia/BRCA pathway genes in
hepatocellular carcinoma chemoresistance. Hepatol Res.
46:1264–1274. 2016. View Article : Google Scholar : PubMed/NCBI
|
|
8
|
Llovet JM, Ricci S, Mazzaferro V, Hilgard
P, Gane E, Blanc JF, de Oliveira AC, Santoro A, Raoul JL, Forner A,
et al: Sorafenib in advanced hepatocellular carcinoma. N Engl J
Med. 359:378–390. 2008. View Article : Google Scholar : PubMed/NCBI
|
|
9
|
Bruix J, Qin S, Merle P, Granito A, Huang
YH, Bodoky G, Pracht M, Yokosuka O, Rosmorduc O, Breder V, et al:
Regorafenib for patients with hepatocellular carcinoma who
progressed on sorafenib treatment (RESORCE): A randomised,
double-blind, placebo-controlled, phase 3 trial. Lancet. 389:56–66.
2017. View Article : Google Scholar : PubMed/NCBI
|
|
10
|
Chacko S and Samanta S: Hepatocellular
carcinoma: A life-threatening disease. Biomed Pharmacother.
84:1679–1688. 2016. View Article : Google Scholar : PubMed/NCBI
|
|
11
|
Montella L, Palmieri G, Addeo R and Del
Prete S: Hepatocellular carcinoma: Will novel targeted drugs really
impact the next future? World J Gastroenterol. 22:6114–6126. 2016.
View Article : Google Scholar : PubMed/NCBI
|
|
12
|
Villanueva A, Hernandez-Gea V and Llovet
JM: Medical therapies for hepatocellular carcinoma: A critical view
of the evidence. Nat Rev Gastroenterol Hepatol. 10:34–42. 2013.
View Article : Google Scholar : PubMed/NCBI
|
|
13
|
Barrett T, Wilhite SE, Ledoux P,
Evangelista C, Kim IF, Tomashevsky M, Marshall KA, Phillippy KH,
Sherman PM, Holko M, et al: NCBI GEO: Archive for functional
genomics data sets-update. Nucleic Acids Res. 41:(Database Issue).
D991–D995. 2013. View Article : Google Scholar : PubMed/NCBI
|
|
14
|
Yang W, Soares J, Greninger P, Edelman EJ,
Lightfoot H, Forbes S, Bindal N, Beare D, Smith JA, Thompson IR, et
al: Genomics of Drug sensitivity in cancer (GDSC): A resource for
therapeutic biomarker discovery in cancer cells. Nucleic Acids Res.
41:(Database Issue). D955–D961. 2013. View Article : Google Scholar : PubMed/NCBI
|
|
15
|
Forbes SA, Beare D, Gunasekaran P, Leung
K, Bindal N, Boutselakis H, Ding M, Bamford S, Cole C, Ward S, et
al: COSMIC: Exploring the world's knowledge of somatic mutations in
human cancer. Nucleic Acids Res. 43:(Database Issue). D805–D811.
2015. View Article : Google Scholar : PubMed/NCBI
|
|
16
|
de Hoo MJ, Imoto S, Nolan J and Miyano S:
Open source clustering software. Bioinformatics. 20:1453–1454.
2004. View Article : Google Scholar : PubMed/NCBI
|
|
17
|
Saldanha AJ: Java Treeview-extensible
visualization of microarray data. Bioinformatics. 20:3246–3248.
2004. View Article : Google Scholar : PubMed/NCBI
|
|
18
|
Subramanian A, Tamayo P, Mootha VK,
Mukherjee S, Ebert BL, Gillette MA, Paulovich A, Pomeroy SL, Golub
TR, Lander ES and Mesirov JP: Gene set enrichment analysis: A
knowledge-based approach for interpreting genome-wide expression
profiles. Proc Natl Acad Sci USA. 102:15545–15550. 2005. View Article : Google Scholar : PubMed/NCBI
|
|
19
|
Liberzon A, Subramanian A, Pinchback R,
Thorvaldsdóttir H, Tamayo P and Mesirov JP: Molecular signatures
database (MSigDB) 3.0. Bioinformatics. 27:1739–6140. 2011.
View Article : Google Scholar : PubMed/NCBI
|
|
20
|
Barretina J, Caponigro G, Stransky N,
Venkatesan K, Margolin AA, Kim S, Wilson CJ, Lehár J, Kryukov GV,
Sonkin D, et al: The cancer cell line encyclopedia enables
predictive modelling of anticancer drug sensitivity. Nature.
483:603–607. 2012. View Article : Google Scholar : PubMed/NCBI
|
|
21
|
Simon R, Lam A, Li MC, Ngan M, Menenzes S
and Zhao Y: Analysis of gene expression data using BRB-ArrayTools.
Cancer Inform. 3:11–17. 2007. View Article : Google Scholar : PubMed/NCBI
|
|
22
|
Kutmon M, van Iersel MP, Bohler A, Kelder
T, Nunes N, Pico AR and Evelo CT: PathVisio 3: An extendable
pathway analysis toolbox. PLoS Comput Biol. 11:e10040852015.
View Article : Google Scholar : PubMed/NCBI
|
|
23
|
Kutmon M, Riutta A, Nunes N, Hanspers K,
Willighagen EL, Bohler A, Mélius J, Waagmeester A, Sinha SR, Miller
R, et al: WikiPathways: Capturing the full diversity of pathway
knowledge. Nucleic Acids Res. 44:D488–D494. 2016. View Article : Google Scholar : PubMed/NCBI
|
|
24
|
Kamburov A, Stelzl U, Lehrach H and Herwig
R: The ConsensusPathDB interaction database: 2013 update. Nucleic
Acids Res. 41:(Database Issue). D793–D800. 2013. View Article : Google Scholar : PubMed/NCBI
|
|
25
|
Kanehisa M and Goto S: KEGG: Kyoto
encyclopedia of genes and genomes. Nucleic Acids Res. 28:27–30.
2000. View Article : Google Scholar : PubMed/NCBI
|
|
26
|
Chen C and Wang G: Mechanisms of
hepatocellular carcinoma and challenges and opportunities for
molecular targeted therapy. World J Hepatol. 7:1964–1970. 2015.
View Article : Google Scholar : PubMed/NCBI
|
|
27
|
Kojiro M: Histopathology of liver cancers.
Best Pract Res Clin Gastroenterol. 19:39–62. 2005. View Article : Google Scholar : PubMed/NCBI
|
|
28
|
Lachenmayer A, Alsinet C, Chang CY and
Llovet JM: Molecular approaches to treatment of hepatocellular
carcinoma. Dig Liver Dis. 42 Suppl 3:S264–S272. 2010. View Article : Google Scholar : PubMed/NCBI
|
|
29
|
Zhou Q, Lui VW and Yeo W: Targeting the
PI3K/Akt/mTOR pathway in hepatocellular carcinoma. Future Oncol.
7:1149–1167. 2011. View Article : Google Scholar : PubMed/NCBI
|
|
30
|
Sieghart W, Fuereder T, Schmid K, Cejka D,
Werzowa J, Wrba F, Wang X, Gruber D, Rasoul-Rockenschaub S,
Peck-Radosavljevic M and Wacheck V: Mammalian target of rapamycin
pathway activity in hepatocellular carcinomas of patients
undergoing liver transplantation. Transplantation. 83:425–432.
2007. View Article : Google Scholar : PubMed/NCBI
|
|
31
|
Villanueva A, Chiang DY, Newell P, Peix J,
Thung S, Alsinet C, Tovar V, Roayaie S, Minguez B, Sole M, et al:
Pivotal role of mTOR signaling in hepatocellular carcinoma.
Gastroenterology. 135:1972–1983. 2008. View Article : Google Scholar : PubMed/NCBI
|
|
32
|
Huynh H: Molecularly targeted therapy in
hepatocellular carcinoma. Biochem Pharmacol. 80:550–560. 2010.
View Article : Google Scholar : PubMed/NCBI
|
|
33
|
Wysocki PJ: Targeted therapy of
hepatocellular cancer. Expert Opin Investig Drugs. 19:265–274.
2010. View Article : Google Scholar : PubMed/NCBI
|
|
34
|
Thorpe LM, Yuzugullu H and Zhao JJ: PI3K
in cancer: Divergent roles of isoforms, modes of activation and
therapeutic targeting. Nat Rev Cancer. 15:7–24. 2015. View Article : Google Scholar : PubMed/NCBI
|
|
35
|
Dibble CC and Cantley LC: Regulation of
mTORC1 by PI3K signaling. Trends Cell Biol. 25:545–55. 2015.
View Article : Google Scholar : PubMed/NCBI
|
|
36
|
Zoncu R, Efeyan A and Sabatini DM: mTOR:
From growth signal integration to cancer, diabetes and ageing. Nat
Rev Mol Cell Biol. 12:21–35. 2011. View Article : Google Scholar : PubMed/NCBI
|
|
37
|
Laplante M and Sabatini DM: mTOR signaling
in growth control and disease. Cell. 149:274–293. 2012. View Article : Google Scholar : PubMed/NCBI
|
|
38
|
Vanhaesebroeck B, Stephens L and Hawkins
P: PI3K signalling: The path to discovery and understanding. Nat
Rev Mol Cell Biol. 13:195–203. 2012. View Article : Google Scholar : PubMed/NCBI
|
|
39
|
Molina-Cerrillo J, Alonso-Gordoa T, Gajate
P and Grande E: Bruton's tyrosine kinase (BTK) as a promising
target in solid tumors. Cancer Treat Rev. 58:41–50. 2017.
View Article : Google Scholar : PubMed/NCBI
|
|
40
|
Borisa AC and Bhatt HG: A comprehensive
review on Aurora kinase: Small molecule inhibitors and clinical
trial studies. Eur J Med Chem. 140:1–19. 2017. View Article : Google Scholar : PubMed/NCBI
|
|
41
|
Damodaran AP, Vaufrey L, Gavard O and
Prigent C: Aurora a kinase is a priority pharmaceutical target for
the treatment of cancers. Trends Pharmacol Sci. 38:687–700. 2017.
View Article : Google Scholar : PubMed/NCBI
|
|
42
|
Liu F, Wang G, Wang X, Che Z, Dong W, Guo
X, Wang Z, Chen P, Hou D, Zhang Q, et al: Targeting high Aurora
kinases expression as an innovative therapy for hepatocellular
carcinoma. Oncotarget. 8:27953–27965. 2017.PubMed/NCBI
|
|
43
|
Lai CH, Tseng JT, Lee YC, Chen YJ, Lee JC,
Lin BW, Huang TC, Liu YW, Leu TH, Liu YW, et al: Translational
up-regulation of Aurora-A in EGFR-overexpressed cancer. J Cell Mol
Med. 14:1520–1531. 2010. View Article : Google Scholar : PubMed/NCBI
|
|
44
|
Chen BP, Chan DW, Kobayashi J, Burma S,
Asaithamby A, Morotomi-Yano K, Botvinick E, Qin J and Chen DJ: Cell
cycle dependence of DNA-dependent protein kinase phosphorylation in
response to DNA double strand breaks. J Biol Chem. 280:14709–14715.
2005. View Article : Google Scholar : PubMed/NCBI
|
|
45
|
Falck J, Coates J and Jackson SP:
Conserved modes of recruitment of ATM, ATR and DNA-PKcs to sites of
DNA damage. Nature. 434:605–611. 2005. View Article : Google Scholar : PubMed/NCBI
|
|
46
|
Yajima H, Lee KJ, Zhang S, Kobayashi J and
Chen BP: DNA double-strand break formation upon UV-induced
replication stress activates ATM and DNA-PKcs kinases. J Mol Biol.
385:800–810. 2009. View Article : Google Scholar : PubMed/NCBI
|
|
47
|
Weterings E and Chen DJ: The endless tale
of non-homologous end-joining. Cell Res. 18:114–124. 2008.
View Article : Google Scholar : PubMed/NCBI
|
|
48
|
Hsu FM, Zhang S and Chen BP: Role of
DNA-dependent protein kinase catalytic subunit in cancer
development and treatment. Transl Cancer Res. 1:22–34.
2012.PubMed/NCBI
|
|
49
|
Munck JM, Batey MA, Zhao Y, Jenkins H,
Richardson CJ, Cano C, Tavecchio M, Barbeau J, Bardos J, Cornell L,
et al: Chemosensitization of cancer cells by KU-0060648, a dual
inhibitor of DNA-PK and PI-3K. Mol Cancer Ther. 11:1789–1798. 2012.
View Article : Google Scholar : PubMed/NCBI
|
|
50
|
Chen MB, Zhou ZT, Yang L, Wei MX, Tang M,
Ruan TY, Xu JY, Zhou XZ, Chen G and Lu PH: KU-0060648 inhibits
hepatocellular carcinoma cells through DNA-PKcs-dependent and
DNA-PKcs-independent mechanisms. Oncotarget. 7:17047–17059.
2016.PubMed/NCBI
|
|
51
|
Evert M, Frau M, Tomasi ML, Latte G,
Simile MM, Seddaiu MA, Zimmerman A, Ladu S, Stansca T, Brozzetti S,
et al: Deregulation of DNA-dependent protein kinase catalytic
subunit contributes to human hepatocarcinogenesis development and
has a putative prognostic value. Br J Cancer. 109:2654–2664. 2013.
View Article : Google Scholar : PubMed/NCBI
|
|
52
|
Cornell L, Munck JM, Alsinet C, Villanueva
A, Ogle L, Willoughby CE, Televantou D, Thomas HD, Jackson J, Burt
AD, et al: DNA-PK-A candidate driver of hepatocarcinogenesis and
tissue biomarker that predicts response to treatment and survival.
Clin Cancer Res. 21:925–933. 2015. View Article : Google Scholar : PubMed/NCBI
|
|
53
|
Tu Y, Ji C, Yang B, Yang Z, Gu H, Lu CC,
Wang R, Su ZL, Chen B, Sun WL, et al: DNA-dependent protein kinase
catalytic subunit (DNA-PKcs)-SIN1 association mediates ultraviolet
B (UVB)-induced Akt Ser-473 phosphorylation and skin cell survival.
Mol Cancer. 12:1722013. View Article : Google Scholar : PubMed/NCBI
|
|
54
|
Li Y, Wang X, Yue P, Tao H, Ramalingam SS,
Owonikoko TK, Deng X, Wang Y, Fu H, Khuri FR and Sun SY: Protein
phosphatase 2A and DNA-dependent protein kinase are involved in
mediating rapamycin-induced Akt phosphorylation. J Biol Chem.
288:13215–13224. 2013. View Article : Google Scholar : PubMed/NCBI
|
|
55
|
Shi JL, Fu L and Wang WD: High expression
of inositol 1,4,5-trisphosphate receptor, type 2 (ITPR2) as a novel
biomarker for worse prognosis in cytogenetically normal acute
myeloid leukemia. Oncotarget. 6:5299–5309. 2015. View Article : Google Scholar : PubMed/NCBI
|
|
56
|
Zhang F, Wen Y, Guo X, Zhang Y, Wang X,
Yang T, Shen H, Chen X, Tian Q and Deng HW: Genome-wide association
study identifies ITPR2 as a susceptibility gene for Kashin-Beck
disease in Han Chinese. Arthritis Rheumatol. 67:176–181. 2015.
View Article : Google Scholar : PubMed/NCBI
|
|
57
|
Wiel C, Lallet-Daher H, Gitenay D, Gras B,
Le Calvé B, Augert A, Ferrand M, Prevarskaya N, Simonnet H,
Vindrieux D and Bernard D: Endoplasmic reticulum calcium release
through ITPR2 channels leads to mitochondrial calcium accumulation
and senescence. Nat Commun. 5:37922014. View Article : Google Scholar : PubMed/NCBI
|
|
58
|
Yildiz G, Arslan-Ergul A, Bagislar S, Konu
O, Yuzugullu H, Gursoy-Yuzugullu O, Ozturk N, Ozen C, Ozdag H,
Erdal E, et al: Genome-wide transcriptional reorganization
associated with senescence-to-immortality switch during human
hepatocellular carcinogenesis. PLoS One. 8:e640162013. View Article : Google Scholar : PubMed/NCBI
|
|
59
|
Thoresen SB, Pedersen NM, Liestøl K and
Stenmark H: A phosphatidylinositol 3-kinase class III sub-complex
containing VPS15, VPS34, Beclin 1, UVRAG and BIF-1 regulates
cytokinesis and degradative endocytic traffic. Exp Cell Res.
316:3368–3378. 2010. View Article : Google Scholar : PubMed/NCBI
|
|
60
|
Kristensen L, Kristensen T, Abildgaard N,
Thomassen M, Frederiksen M, Mouritis-Andersen T and Møller MB: High
expression of PI3K core complex genes is associated with poor
prognosis in chronic lymphocytic leukemia. Leuk Res. 39:555–560.
2015. View Article : Google Scholar : PubMed/NCBI
|
|
61
|
Alberobello AT, Wang Y, Beerkens FJ,
Conforti F, McCutcheon JN, Rao G, Raffeld M, Liu J, Rahhal R, Zhang
YW and Giaccone G: PI3K as a potential therapeutic target in thymic
epithelial tumors. J Thorac Oncol. 11:1345–1356. 2016. View Article : Google Scholar : PubMed/NCBI
|
|
62
|
Shull AY, Latham-Schwark A, Ramasamy P,
Leskoske K, Oroian D, Birtwistle MR and Buckhaults PJ: Novel
somatic mutations to PI3K pathway genes in metastatic melanoma.
PLoS One. 7:e433692012. View Article : Google Scholar : PubMed/NCBI
|
|
63
|
Huang J, Zhang L, Greshock J, Colligon TA,
Wang Y, Ward R, Katsaros D, Lassus H, Butzow R, Godwin AK, et al:
Frequent genetic abnormalities of the PI3K/AKT pathway in primary
ovarian cancer predict patient outcome. Genes Chromosomes Cancer.
50:606–618. 2011. View Article : Google Scholar : PubMed/NCBI
|
|
64
|
Zheng YS, Zhang JY and Zhang DH:
Fatsioside A-induced apoptotic death of HepG2 cells requires
activation of AMP-activated protein kinase. Mol Med Rep.
12:5679–5684. 2015. View Article : Google Scholar : PubMed/NCBI
|
|
65
|
Ishijima N, Kanki K, Shimizu H and Shiota
G: Activation of AMP-activated protein kinase by retinoic acid
sensitizes hepatocellular carcinoma cells to apoptosis induced by
sorafenib. Cancer Sci. 106:567–575. 2015. View Article : Google Scholar : PubMed/NCBI
|
|
66
|
Yie Y, Zhao S, Tang Q, Zheng F, Wu J, Yang
L, Deng S and Hann SS: Ursolic acid inhibited growth of
hepatocellular carcinoma HepG2 cells through AMPKα-mediated
reduction of DNA methyltransferase 1. Mol Cell Biochem. 402:63–74.
2015. View Article : Google Scholar : PubMed/NCBI
|
|
67
|
Zhang H, Li N, Wu J, Su L, Chen X, Lin B
and Luo H: Galangin inhibits proliferation of HepG2 cells by
activating AMPK via increasing the AMP/TAN ratio in a
LKB1-independent manner. Eur J Pharmacol. 718:235–244. 2013.
View Article : Google Scholar : PubMed/NCBI
|
|
68
|
Xieraili M, Yasen M, Mogushi K, Obulhasim
G, Mayinuer A, Aihara A, Tanaka S, Mizushima H, Tanaka H and Arii
S: Villin 1 is a predictive factor for the recurrence of high serum
alpha-fetoprotein-associated hepatocellular carcinoma after
hepatectomy. Cancer Sci. 103:1493–1501. 2012. View Article : Google Scholar : PubMed/NCBI
|
|
69
|
Buta C, Benabou E, Lequoy M, Régnault H,
Wendum D, Meratbene F, Chettouh H, Aoudjehane L, Conti F, Chrétien
Y, et al: Heregulin-1ß and HER3 in hepatocellular carcinoma: Status
and regulation by insulin. J Exp Clin Cancer Res. 35:1262016.
View Article : Google Scholar : PubMed/NCBI
|
|
70
|
Hsieh SY, He JR, Yu MC, Lee WC, Chen TC,
Lo SJ, Bera R, Sung CM and Chiu CT: Secreted ERBB3 isoforms are
serum markers for early hepatoma in patients with chronic hepatitis
and cirrhosis. J Proteome Res. 10:4715–4724. 2011. View Article : Google Scholar : PubMed/NCBI
|
|
71
|
Gray KA, Yates B, Seal RL, Wright MW and
Bruford EA: Genenames.org: The HGNC resources in 2015. Nucleic
Acids Res. 43:(Database Issue). D1079–D1085. 2015. View Article : Google Scholar : PubMed/NCBI
|
|
72
|
Hay R, Park JG and Gazdar A: Atlas of
human tumor cell lines. Academic Press Inc.; California: pp.
185–212. 1994
|
|
73
|
Yuzugullu H, Benhaj K, Ozturk N, Senturk
S, Celik E, Toylu A, Tasdemir N, Yilmaz M, Erdal E, Akcali KC, et
al: Canonical Wnt signaling is antagonized by noncanonical Wnt5a in
hepatocellular carcinoma cells. Mol Cancer. 8:902009. View Article : Google Scholar : PubMed/NCBI
|
|
74
|
Cevik D, Yildiz G and Ozturk M: Common
telomerase reverse transcriptase promoter mutations in
hepatocellular carcinomas from different geographical locations.
World J Gastroenterol. 21:311–317. 2015. View Article : Google Scholar : PubMed/NCBI
|
|
75
|
Zhao H, Desai V, Wang J, Epstein DM,
Miglarese M and Buck E: Epithelial-mesenchymal transition predicts
sensitivity to the dual IGF-1R/IR inhibitor OSI-906 in
hepatocellular carcinoma cell lines. Mol Cancer Ther. 11:503–513.
2012. View Article : Google Scholar : PubMed/NCBI
|
|
76
|
Nozaki I, Tsuji T, Sakaguchi M, Inoue Y,
Hirai R, Andou A, Miyazaki M, Shimizu N and Namba M: Establishment
of a human hepatoma cell line, HLE/2E1, suitable for detection of
p450 2E1-related cytotoxicity. In Vitro Cell Dev Biol Anim.
36:566–570. 2000. View Article : Google Scholar : PubMed/NCBI
|