Introduction
Colon cancer together with lung, prostate and breast
cancer constitute a threat to human health worldwide (1). Notably, previous findings showed that
surgery had minimal adverse reaction in stage 2 patients (2). In addition, some treatment strategies
such as adjuvant chemotherapy, were found to be effective,
especially for stage 3 colon cancer (3). Thereby, the known critical genes in
different stages of colon cancer was necessary for the diagnosis
and treatment of this disease.
Various studies have been previously performed to
investigate the molecular mechanism of colon cancer. For example,
Yu et al found that methylated TBX5 may be a functional
tumor suppressor gene for the diagnosis of malignancy of colon
cancer (4). Moreover, the
metachronous distant metastasis of colon cancer was ensured to be
correlated with the downregulation of SASH1 (SAM- and SH3-domain
containing 1) expression (5).
Schepeler et al showed that the expression level of miR-320
and miR-498 was closely related to the recurrence-free survival of
colon cancer (6). miR-21 was also
confirmed to be upregulated in stage 2 colon cancer by
participating in the immune process (7). In addition, transforming growth factor
β1 could prevent an organized hyperplasia in the early transition,
and further suppress colon cancer (8). Although these genes, miRNAs and pathways
were identified, differentially expressed genes (DEGs) in different
staging and their potential mechanism remain to be determined.
In order to investigate more colon cancer-related
genes in different stages, DEGs in four stages compared with
controls were identified in this study, and series test of clusters
were processed. In addition, functional and pathway enrichment
analysis was used for these DEGs. Finally, various networks
including a pathway relation network, gene signal network and gene
co-expression network were constructed.
Materials and methods
Microarray data
The gene expression profile E-GEOD-62932 was
extracted from the ArrayExpress Archive, including 64 colon cancer
tissues and 4 healthy control samples (9). The 64 colon cancer tissues included 12
samples in stage 1, 17 in stage 2, 20 in stage 3, and 15 in stage
4. Platform information of this profile was GPL570 [HG-U133_Plus_2]
Affymetrix Human Genome U133 Plus 2.0 Array.
Data preprocessing and DEGs
screening
The obtained probe sets were converted into
expression value matrix and background correction, normalization
and summarizing were performed using the Robust Multi-chip Average
algorithm. Based on the information of Affymetrix
(*.transcript.csv), the probe sets were annotated. The annotated
data were screened with the threshold of >0.8 median (normalized
unscaled standard errors) <1.2 and >0.25 median (relative log
expression) <0.25.
DEGs between colon cancer in various stages and
normal tissues were identified by significance analysis of
microarrays method with the cut-off criteria of P<0.05 (10).
Series test of clusters
The gene expression profiles were always changed
with tumor development. In the present study, series test of
cluster (STC) analysis was used to obtain the significant trending
models related to tumor stage and their involved DEGs (11). Clusters with P<0.05 were regarded
as statistically significant.
Functional and pathway enrichment
analysis
Gene Ontology (GO) is a cross-species and
comprehensive database, which was constructed by the GO Consortium
(12). Similarly, the Kyoto
Encyclopedia of Genes and Genomes (KEGG) is a powerful tool for
analysis of biological metabolism and metabolic network (13). Based on the abovementioned databases,
GO functional and KEGG pathway enrichment analysis were processed
for identified DEGs with the threshold of P<0.05. The Fisher's
exact test and multiple comparisons were used to calculate the
significance of GO terms and pathways, and false discovery rate
(FDR) was the adjusted P-value.
Construction of pathway relation
network
The pathway relation network was constructed based
on information from the KEGG database. From this network, a signal
transduction relationship was obtained. In addition, upstream
regulatory pathways and downstream effective pathways were
identified.
Gene signal and gene co-expression
network construction for common DEGs
DEGs in GO terms and KEGG pathways were inserted
based on the same symbol. The obtained DEGs were regarded as common
DEGs. Gene signal information was collected from the KEGG database.
The common DEGs were mapped into the whole network and the gene
signal network of common DEGs in colon cancer was generated.
Additionally, the gene co-expression network was a weighted network
that was constructed based on gene expression value and their
correlation indexes. The two networks were visualized by Cytoscape
(14).
Results
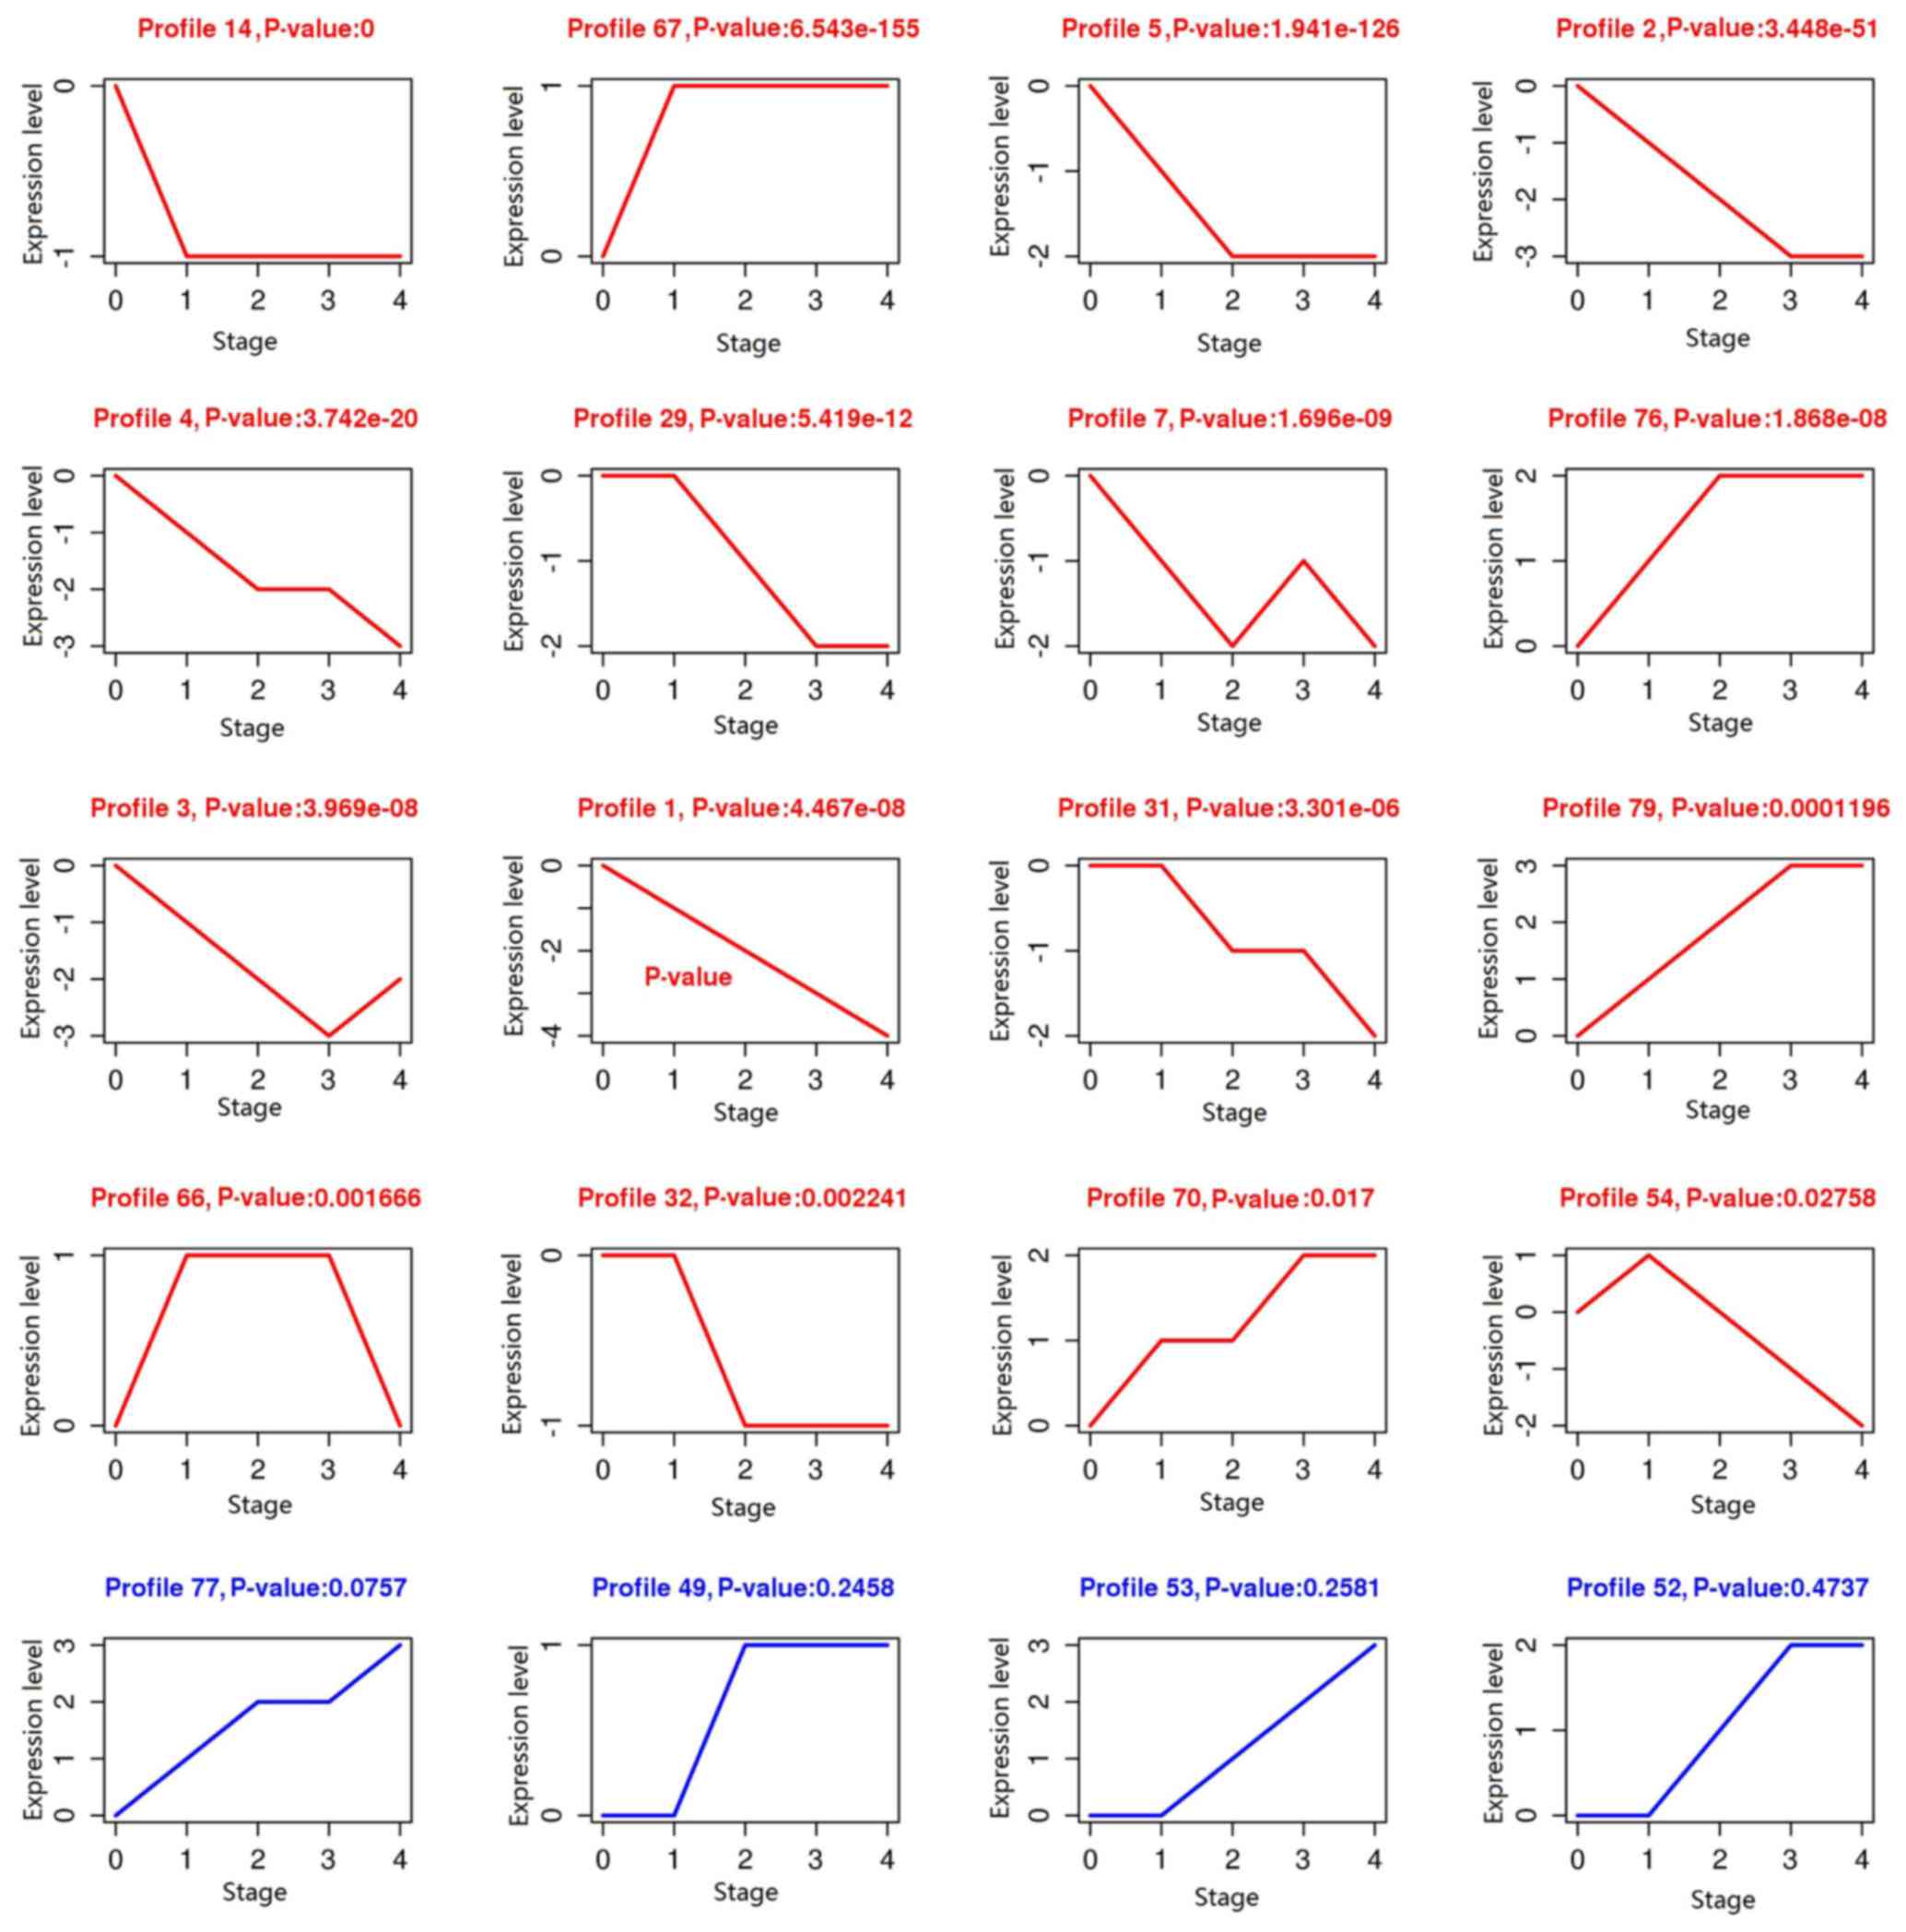
DEG screening and series test of
cluster
Based on the threshold of DEGs, 1,543 DEGs were
screened to be associated with colon tumor development compared
with control samples. Then, the DEGs with the same trend were
clustered. A total of 16 clusters with statistical significance
were obtained, including profile 14, 67, 5 and 2 (Fig. 1).
Functional and KEGG pathway
enrichment
The screened DEGs were enriched into various GO
terms, such as small molecule metabolic process (FDR=1.57E-36),
cell division (FDR=1.00E-29) and mitotic cell cycle (FDR=9.07E-28)
(Table I). In addition, the DEGs were
gathered into different pathways including metabolic pathways
(FDR=1.57E-21), cell cycle (FDR=8.23E-12) and progesterone-mediated
oocyte maturation (FDR=3.56E-09) (Table
II).
 | Table I.Top 5 GO terms of differentially
expressed genes. |
Table I.
Top 5 GO terms of differentially
expressed genes.
| GO ID | GO Name | Diff gene counts in
GO | Enrichment Score | P-value | FDR |
|---|
| GO:0044281 | Small molecule
metabolic process | 129 | 3.905874858 | 5.67E-40 | 1.57E-36 |
| GO:0051301 | Cell division | 56 | 7.834124719 | 7.24E-33 | 1.00E-29 |
| GO:0000278 | Mitotic cell
cycle | 59 | 6.707641713 | 9.84E-31 | 9.07E-28 |
| GO:0000236 | Mitotic
prometaphase | 28 | 11.55533396 | 7.75E-22 | 5.36E-19 |
| GO:0000087 | M phase of mitotic
cell cycle | 35 | 7.295034066 | 7.28E-20 | 4.02E-17 |
| Table II.The top 5 pathways of differently
expressed genes. |
Table II.
The top 5 pathways of differently
expressed genes.
| Pathway ID | Pathway name | Diff gene counts in
pathway | Enrichment score | P-value | FDR |
|---|
| 1,100 | Metabolic
pathways | 95 | 3.297358904 | 6.37E-24 | 1.57E-21 |
| 4,110 | Cell cycle | 23 | 7.654743119 | 6.66E-14 | 8.23E-12 |
| 4,914 | Progesterone-mediated
oocyte maturation | 17 | 8.157835437 | 5.00E-11 | 3.56E-09 |
| 4,114 | Oocyte meiosis | 19 | 7.00099953 | 5.76E-11 | 3.56E-09 |
| 5,200 | Pathways in
cancer | 29 | 3.659946318 | 5.29E-09 | 2.61E-07 |
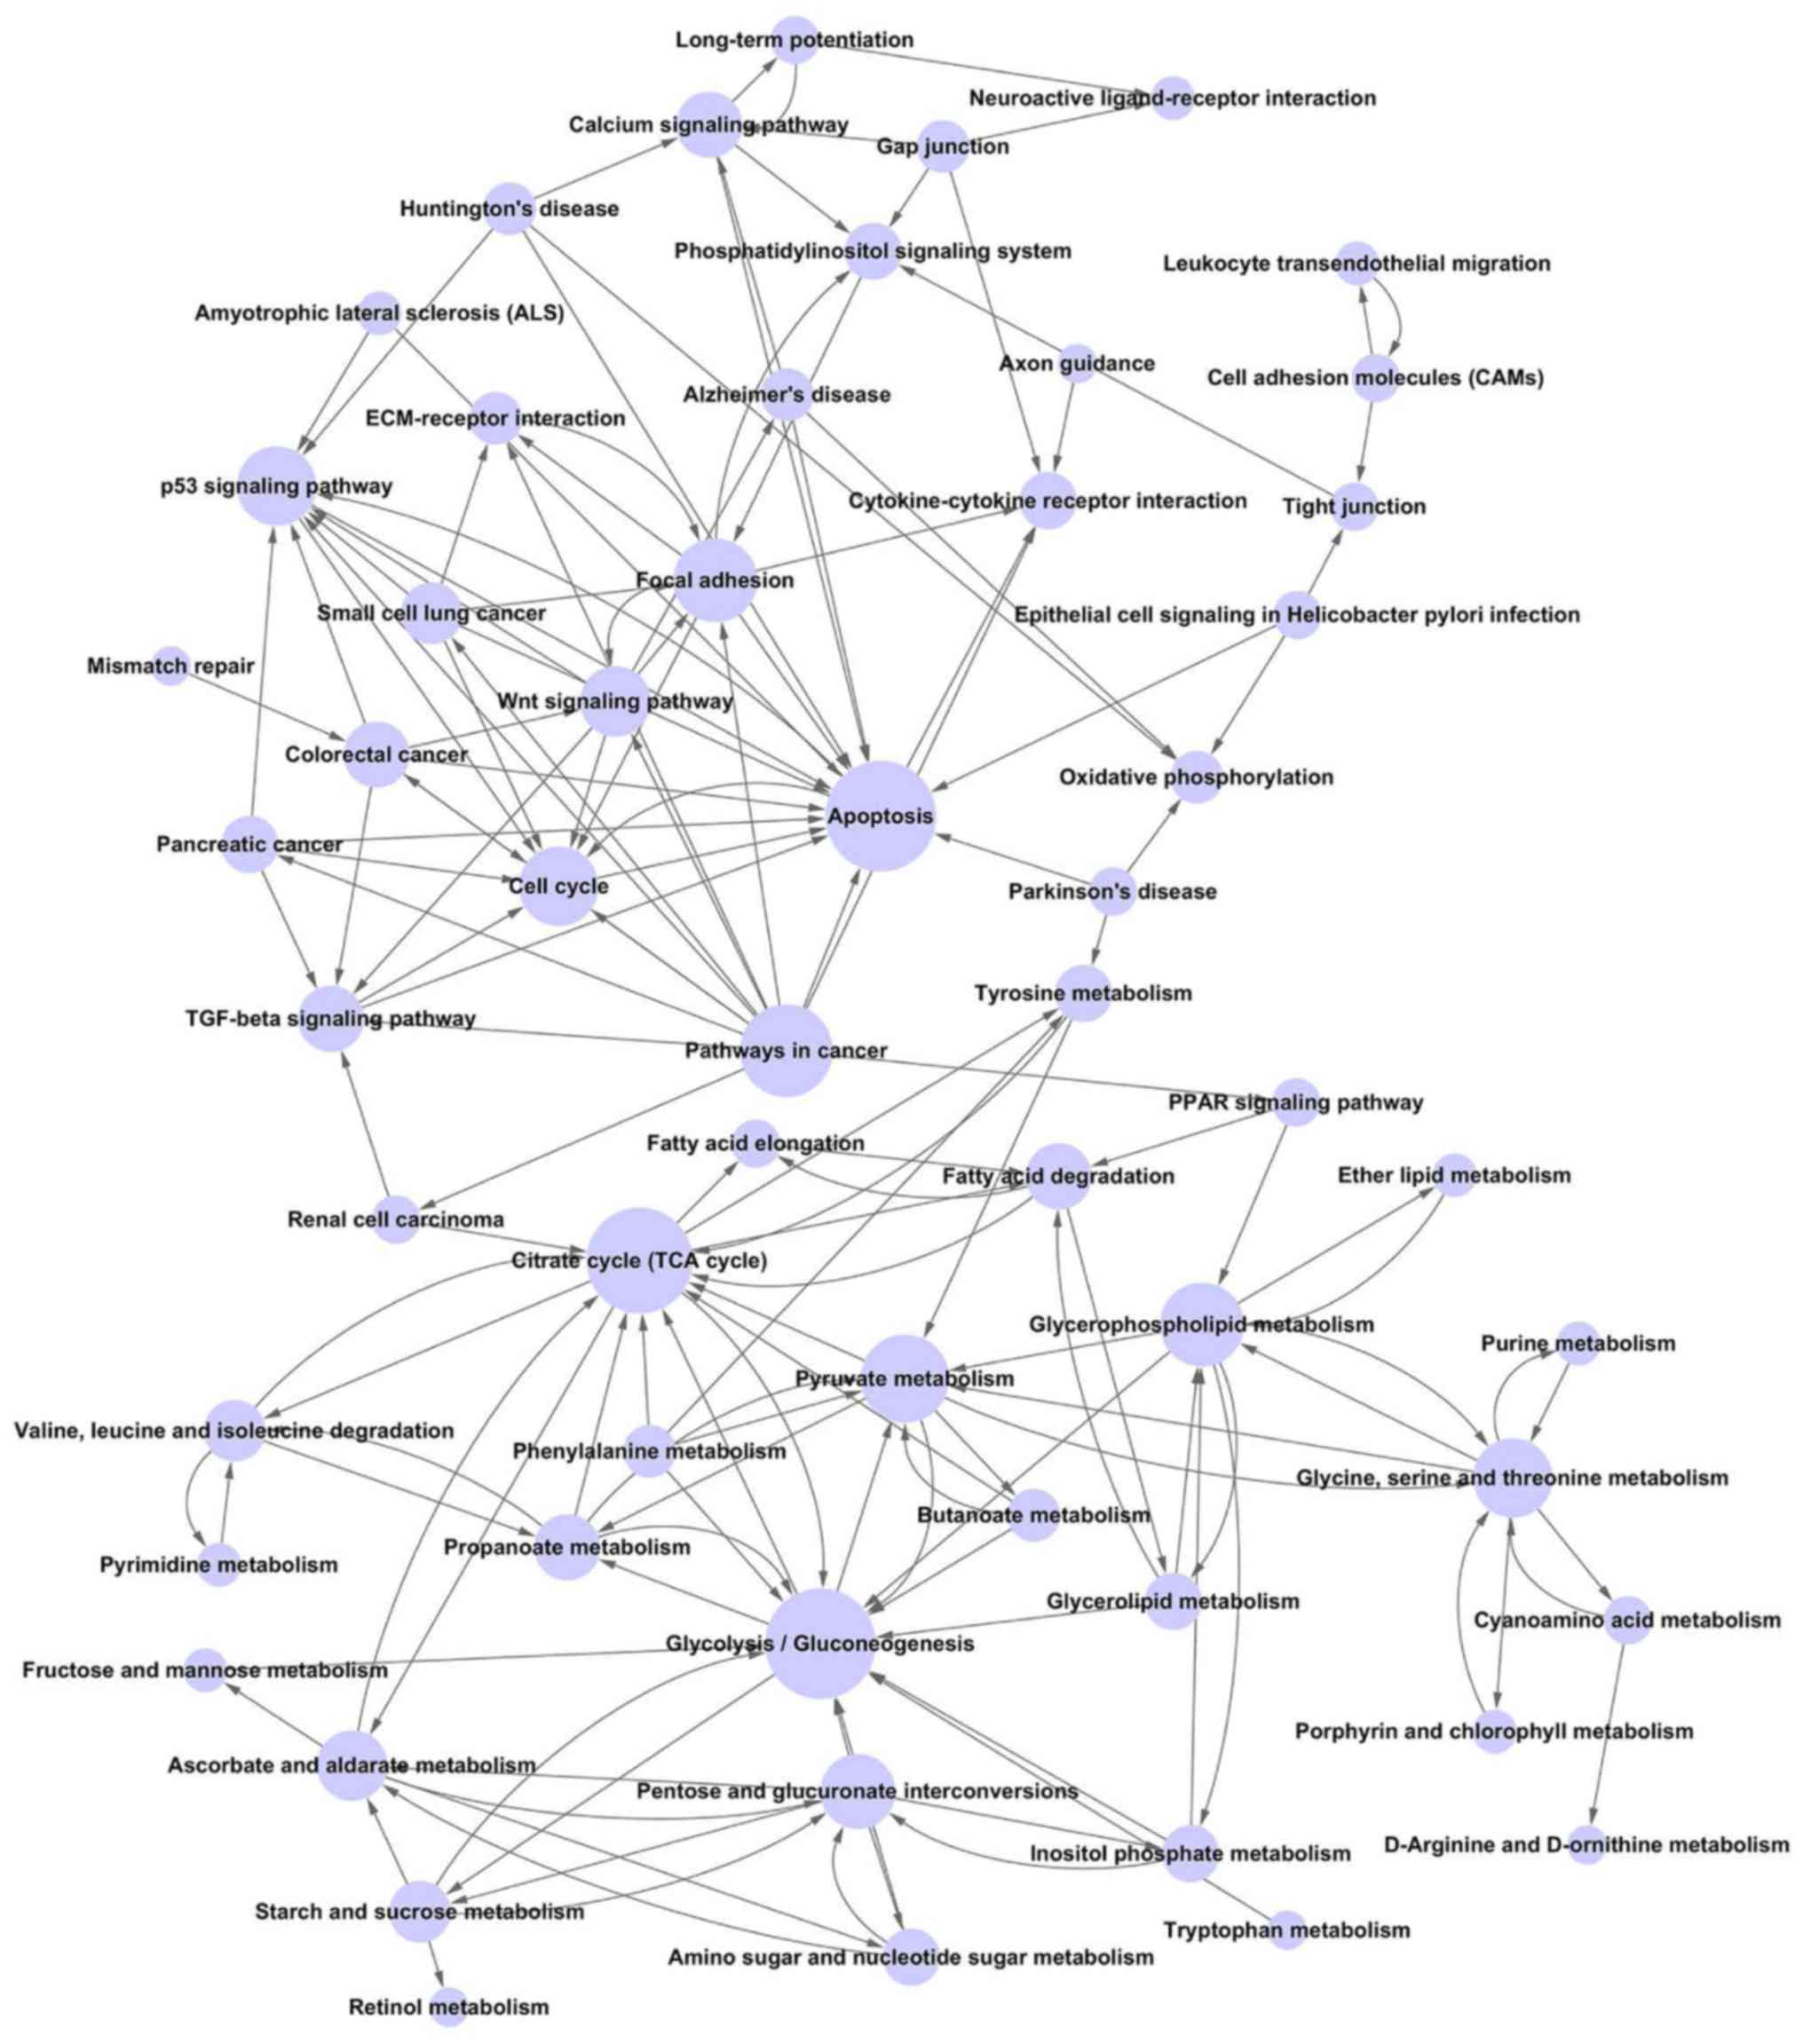
Construction of the pathway relation
network
The pathway relation network was constructed with 57
nodes and 158 edges. The hub nodes were glycolysis/gluconeogenesis
(Degree=17), apoptosis (Degree=17), citrate cycle (TCA cycle)
(Degree=16) and pathways in cancer (Degree=13). Notably, pathways
in cancer (Outdegree=13), phenylalanine metabolism (Outdegree=4)
and gap junction (Outdegree=4) were upstream pathways, while
cytokine-cytokine receptor interaction (Indegree=5) and oxidative
phosphorylation (Indegree=4) were downstream pathways (Fig. 2).
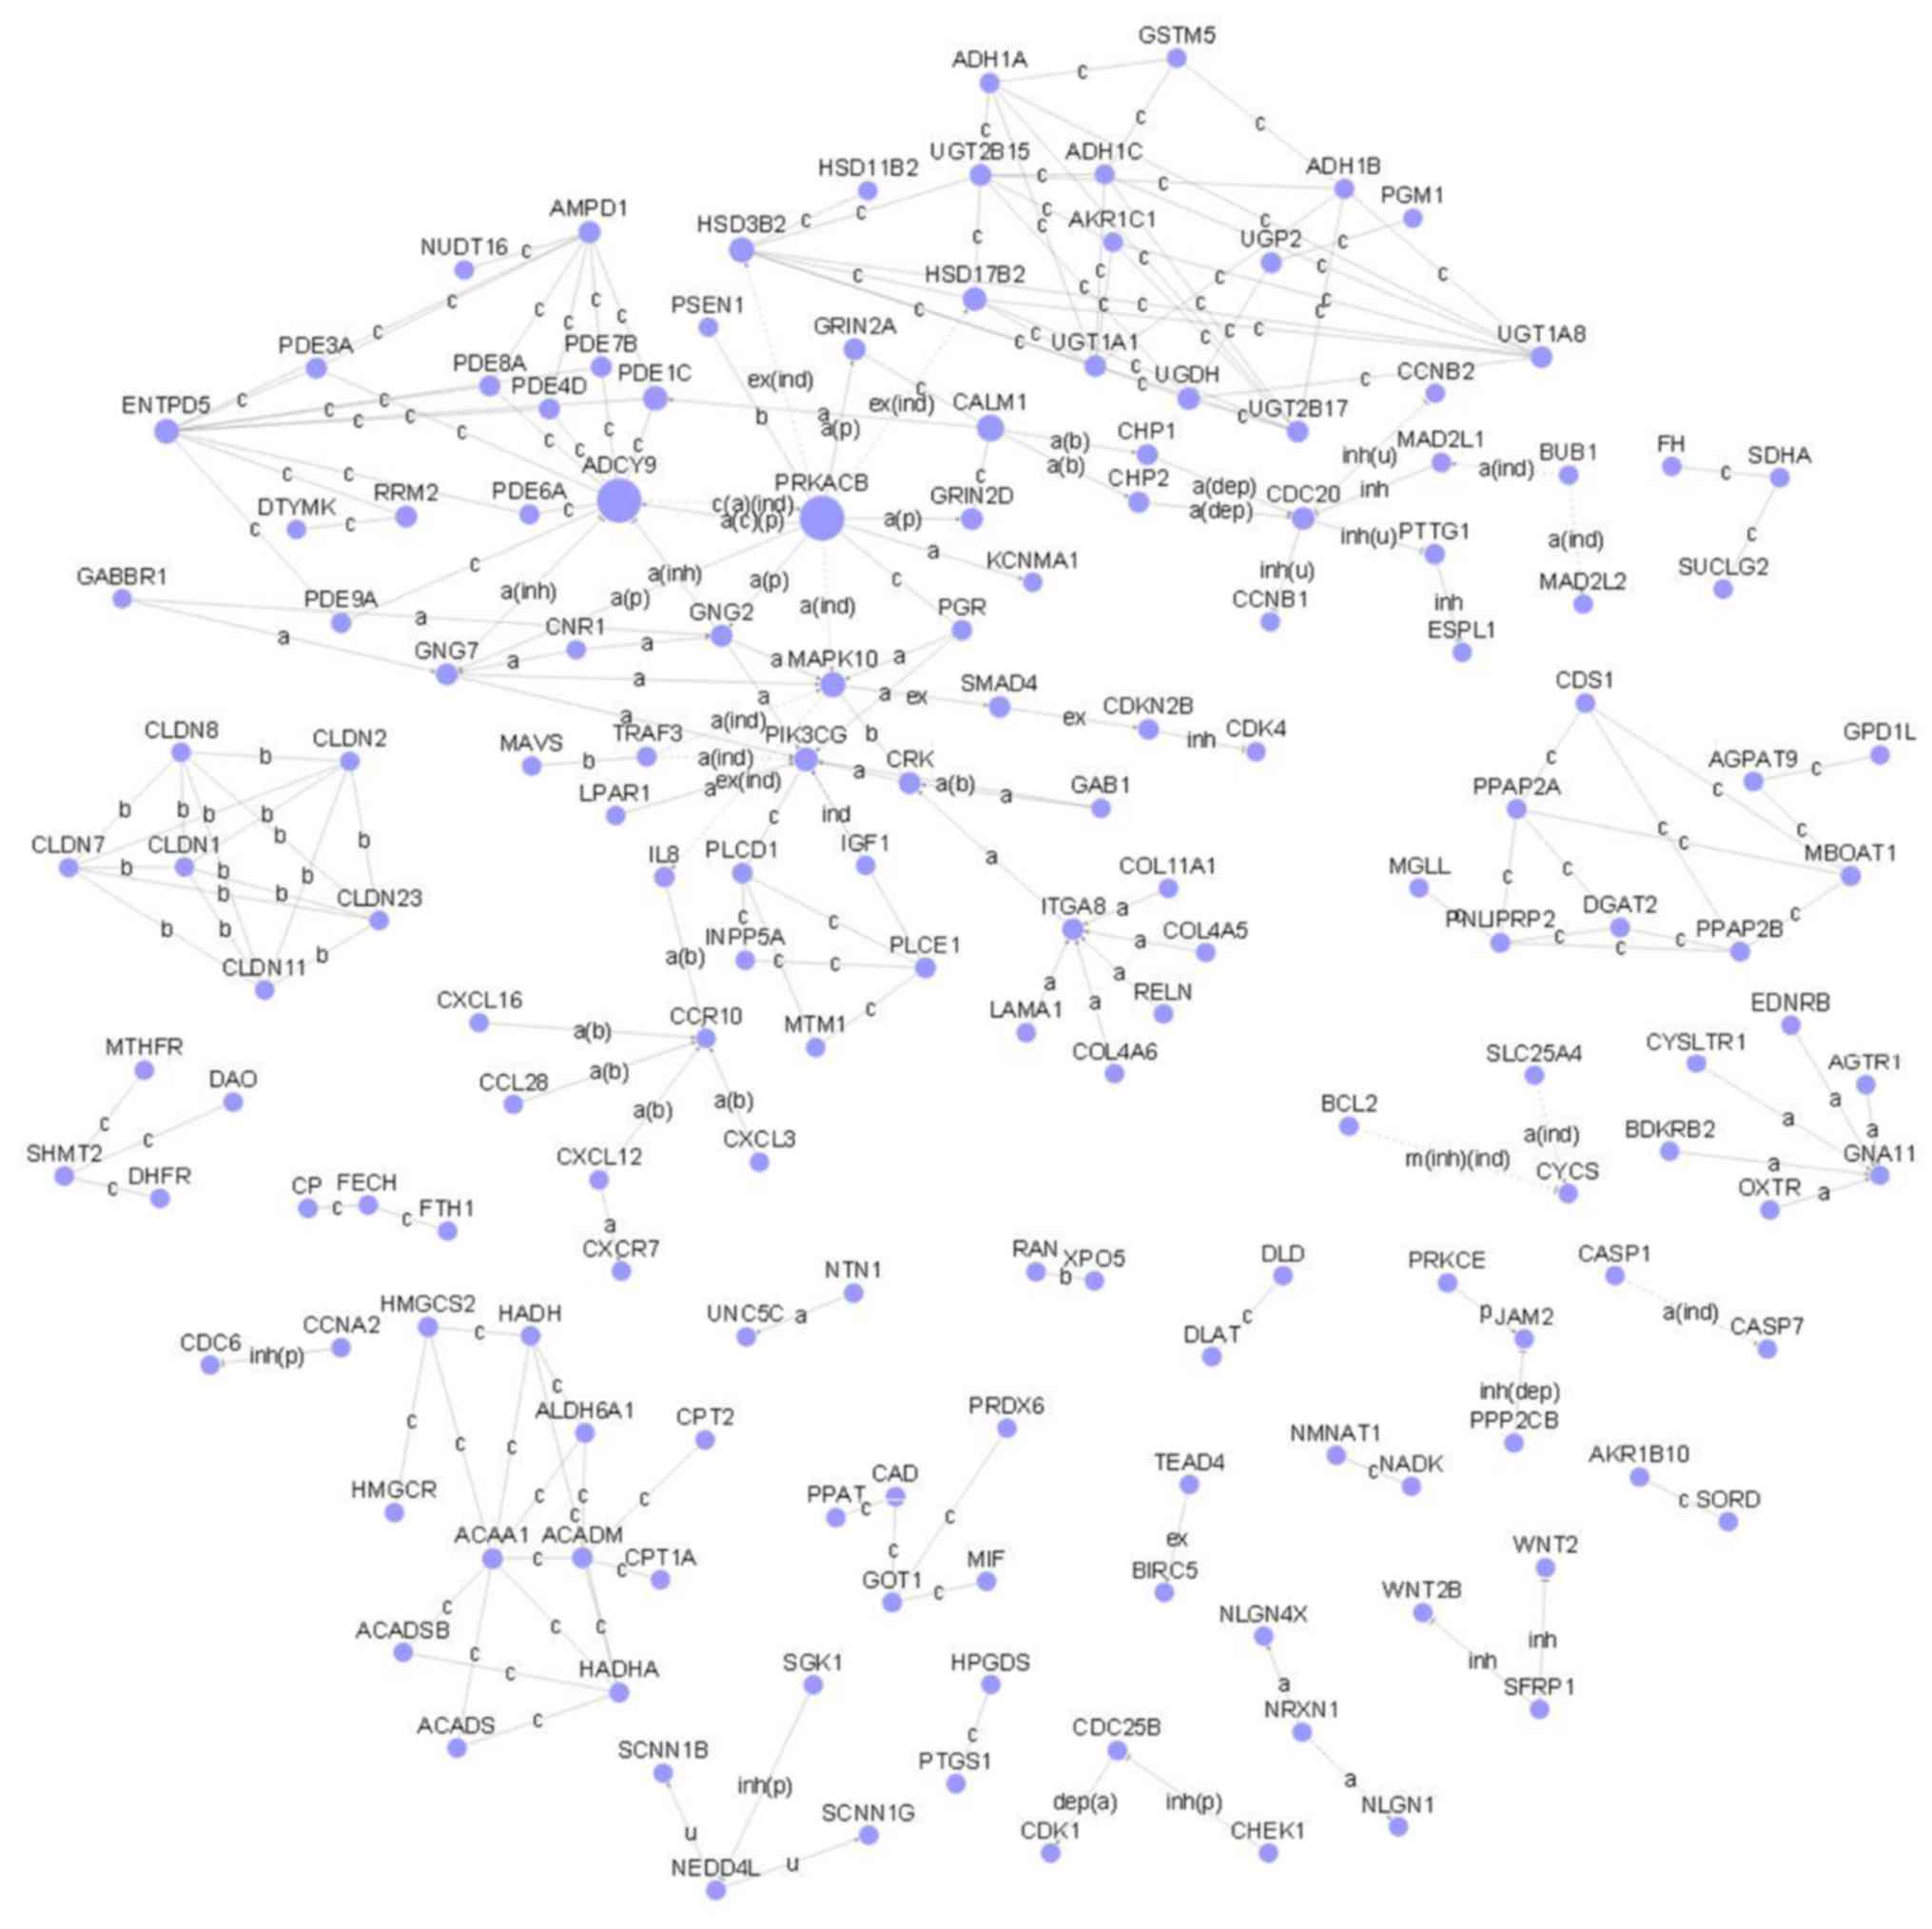
Gene signal network and gene
co-expression network construction for common DEGs
Based on the same gene symbol, a total of 328 common
DEGs were obtained, such as adenosylhomocysteinase-like 2, oxytocin
receptor, aquaporin 8 and hedgehog interacting protein. As shown in
Fig. 3, the gene signal network was
constructed with 71 nodes and 146 edges. The hub nodes were
adenylate cyclase 9 (Degree=18), ectonucleoside triphosphate
diphosphohydrolase 5 (Degree=18) and protein kinase,
cAMP-dependent, catalytic, β (Degree=14).
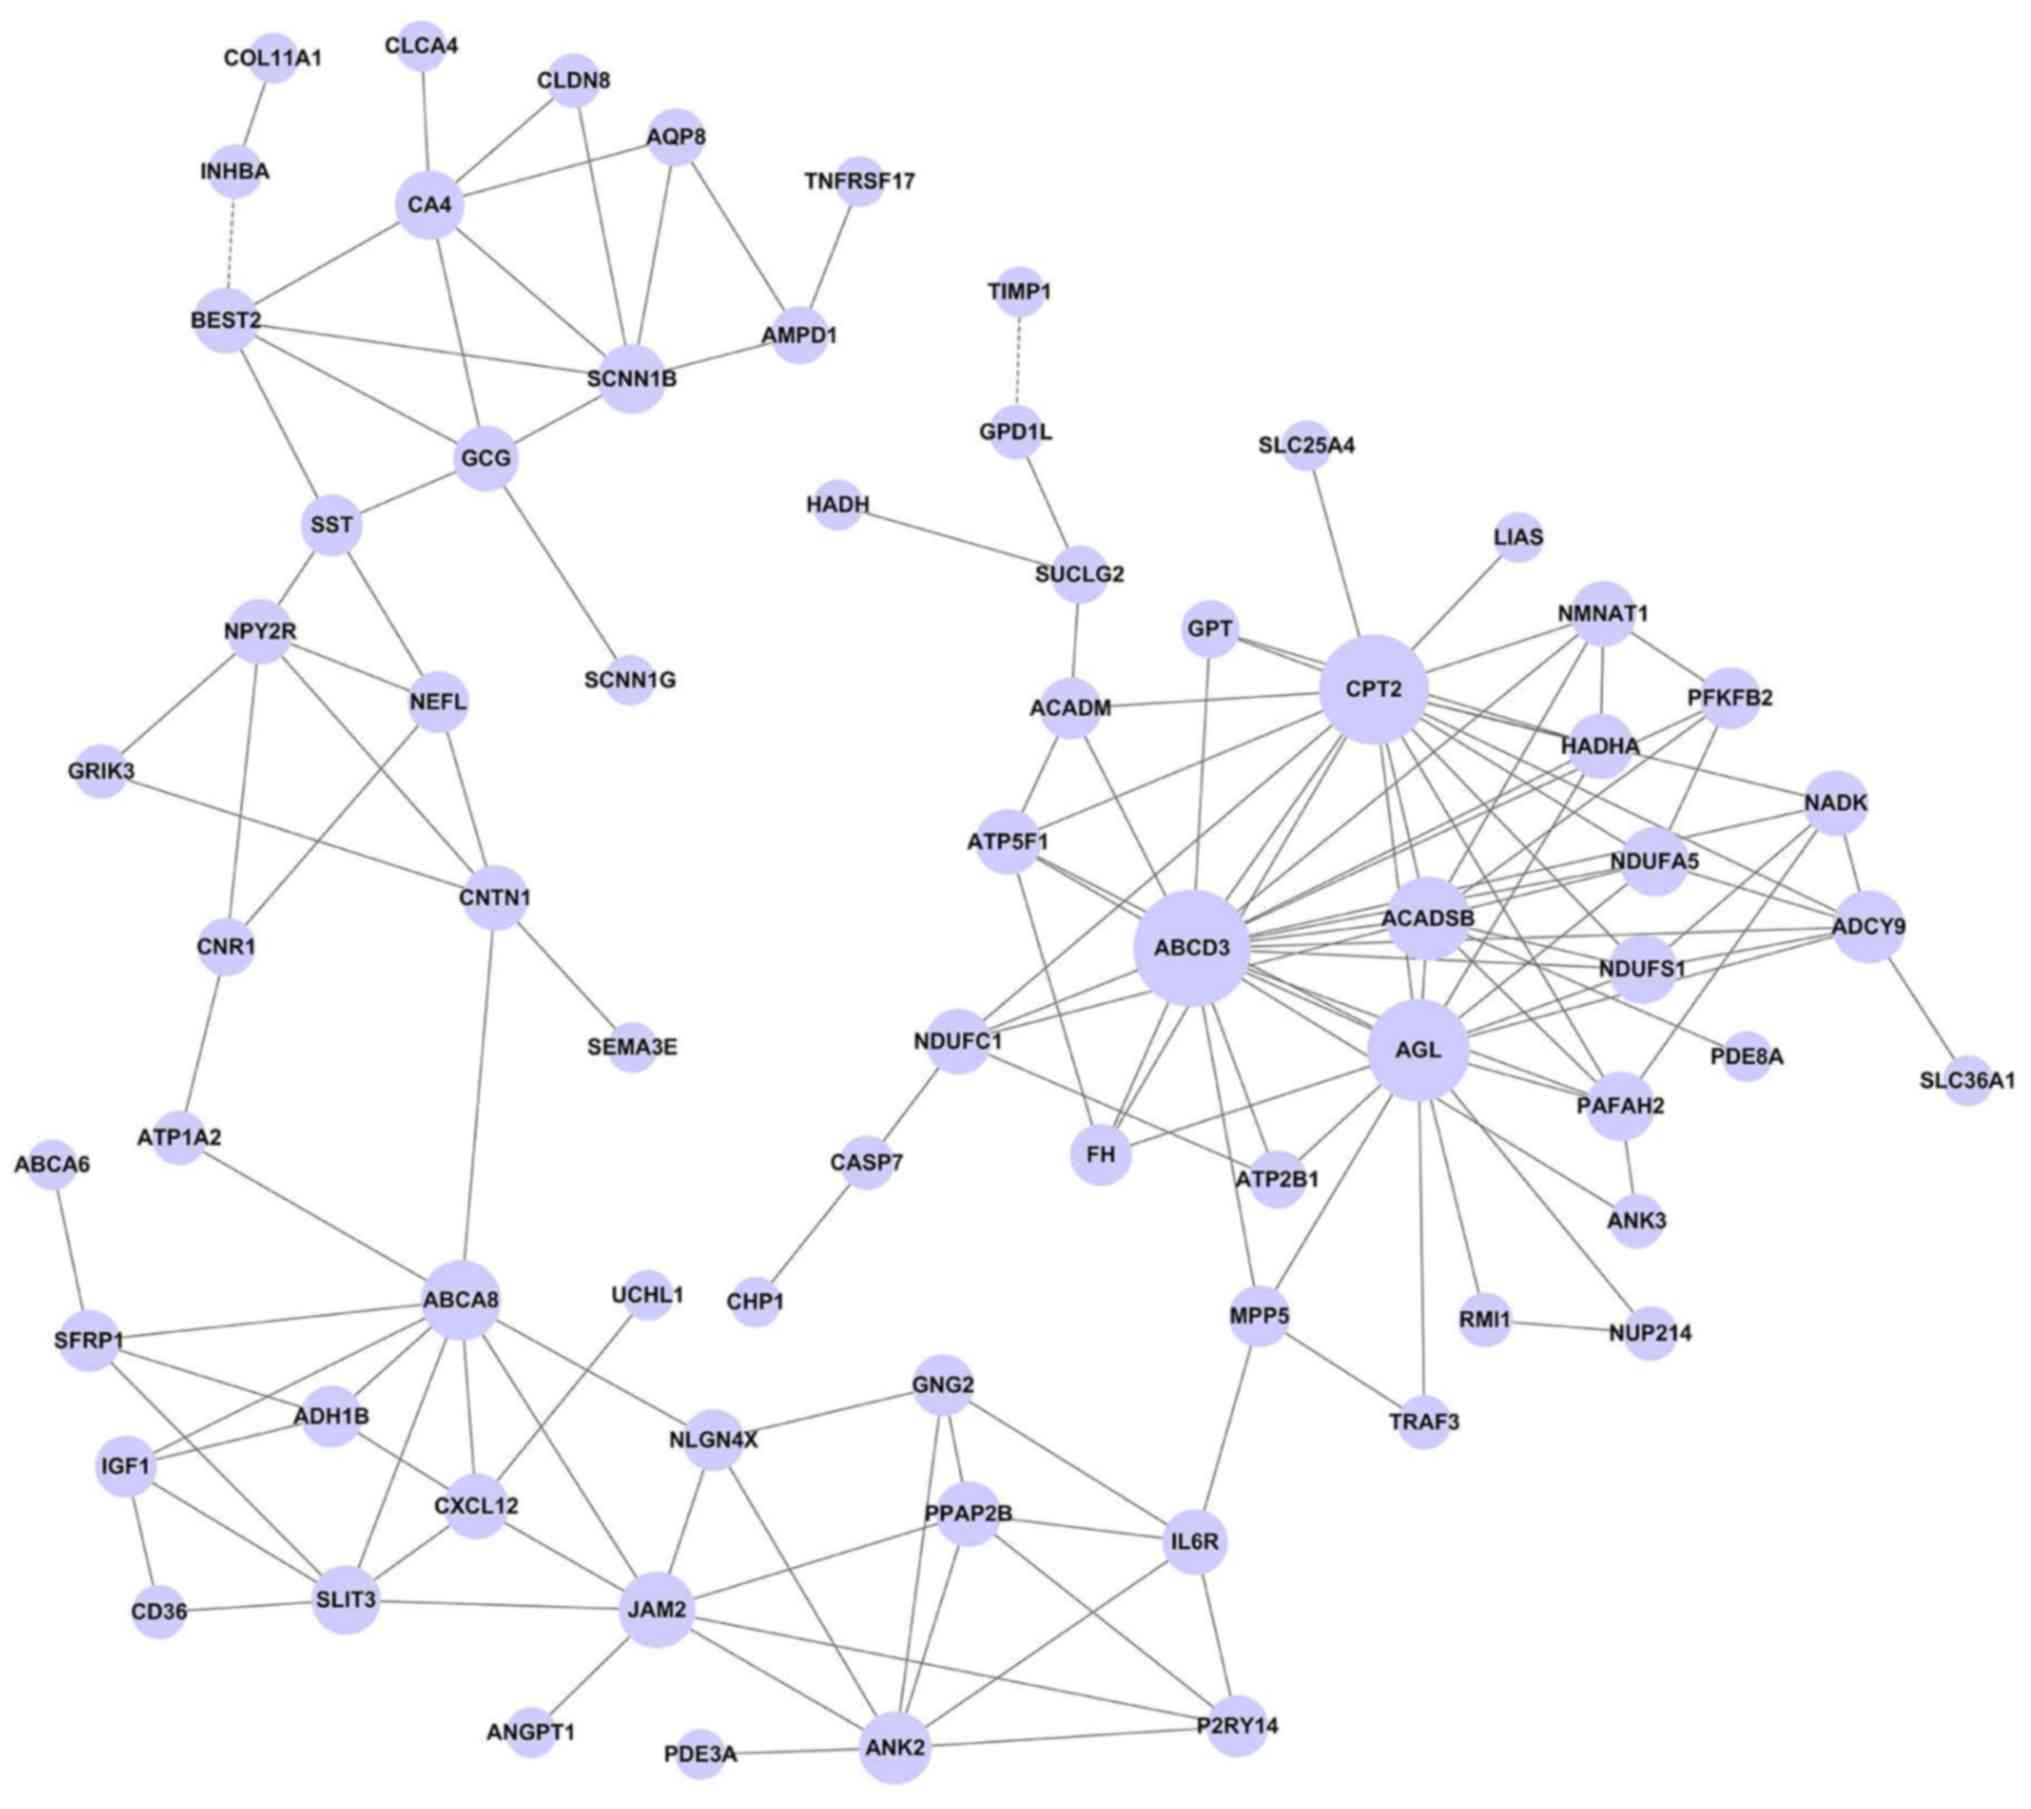
The gene co-expression network was constructed with
161 nodes and 211 edges (Fig. 4). In
this network, the hub nodes with a higher degree were ATP-binding
cassette, sub-family D, member 3 (ABCD3, Degree=19), carnitine
palmitoyltransferase 2 (CPT2, Degree=17) and amylo-α-1,
6-glucosidase, 4-α-glucanotransferase (AGL, Degree=15). Moreover,
this network showed that ABCD3 has a positive relationship with
various DEGs, including ankyrin 3, adenylate cyclase 9 and acyl-coA
dehydrogenase, and short/branched chain.
Discussion
Over 75% of colon cancer occurs in individuals with
little or no genetic risk (15).
However, various gene expressions and their related functions and
pathways were altered with the increasing of grade of the tumor.
These genes provided the biomarkers for colon cancer of each stage
and also suggest effective treatment targets. In the present study,
several significant DEGs were screened and resulted in
participation in the pathogenesis of colon cancer, including ABCD3,
CPT2, AGL and (Junctional adhesion molecule B) JAM2.
ABCD3 encoded a protein of a member of ATP-binding
cassette (ABC) transporters, which is involved in peroxisomal
import of fatty acids or fatty acyl-CoAs in the organelle (16). Previous findings showed by targeting
the expression of the multidrug resistance (MDR)-related ABC
transporters, that reversal of MDR could be realized and MDR in
cancer could be solved (17). Various
ABC transporters such as Ped3p, were confirmed to provide
substrates for fatty acid β-oxidation (18). In addition, there was evidence that
colorectal cancer cells could be induced to apoptosis by the
inhibition of fatty acid oxidation (19,20).
Similar to the results in this study, ABCD3 was found to
participate in ABC transporters, transmembrane transport, fatty
acid β-oxidation and ATP catabolic process. In addition, the
results in this study have shown that ABCD3 belonged to profile 5
in series test of cluster. The expression of this gene was
significantly decreased in stage 1 and 2 of colon cancer samples.
Thus, we inferred that ABCD3 may be used as a biomarker for the
early detection of colon cancer.
Moreover, CPT2 was a key DEG in profile 5, which was
involved in small molecule metabolic process, cellular lipid
metabolic process, carnitine shuttle, fatty acid degradation and
peroxisome proliferator-activated receptor (PPAR) signaling pathway
in the present study. As known, this gene mainly existed in
mitochondrion and nucleus and was closely associated with
mitochondrial long-chain fatty-acid oxidation disorders (21). In tumor-bearing rat models, Seelaender
et al found that the expression of mitochondrial
inner-membrane CPT2 was markedly decreased (22). Additionally, previous bioinformatic
findings showed that the pathway of fatty acid metabolism involved
various altered expressed genes and was confirmed to have a close
link with colorectal carcinogenesis (23). Furthermore, Wang and Dubois found that
the PPAR signaling pathway could promote the emergence of chronic
colonic inflammation and colitis-related tumors (24). Of note, the results in the present
study showed that the PPAR signaling pathway was the upstream
pathway of fatty acid degradation. The abovementioned information
shows that CPT2 is a potentially critical biomarker for colon
cancer by participating in the fatty acid metabolic process and
PPAR signaling pathway.
Another critical DEG, AGL was found to have a
positive relationship with CPT2 in the present study. AGL encodes
the glycogen debrancher enzyme, which is involved in glycogen
degradation (25). In bladder tumor,
AGL was confirmed to participate in the induction of hyaluronic
acid synthesis and further regulate tumor growth (26). To the best of our knowledge, there is
currently no correlative literature showing the relevance between
AGL and colon. However, AGL was significantly altered and involved
in the carbohydrate metabolic process, response to glucocorticoid
stimulus and glucose metabolic process. In 1984, Holroyde et
al showed that diverse abnormalities of the carbohydrate
metabolic process often occurred in cancer cachexia, such as
colorectal cancer (27). In addition,
aerobic glycolysis was ensured to be a metabolic adaptation that
promotes the proliferation of colorectal cancer cells (28). Based on the abovementioned
information, we hypothesized that AGL was a potential biomarker for
the diagnosis of colon cancer.
JAM2 encodes a type I membrane protein that
functions as an adhesive ligand for interacting with the number of
immune cell types (29). The findings
of a previous study revealed that JAM2 played an important role in
motility and its adhesion process of colon cancer cells (30). In addition, Royse et al found
that JAM2 altered the expression in early- and late-stage colon
tumors, and is also closely associated with PTEN, which is a tumor
suppressor (31). In the present
study, JAM2 was gathered into tight junction, cell adhesion
molecules and in blood coagulation. Consistent with previous
studies, the indexes of blood coagulation were closely associated
with the progression of colon cancer (32). Moreover, various blood coagulation
inhibitors were found to be beneficial for colon cancer patients
(33). Thus, JAM2 may be involved in
the pathogenesis of colon cancer by participating in cell adhesion
molecules and blood coagulation.
In summary, the identified DEGs including ABCD3,
CPT2, AGL and JAM2 constitute potential biomarkers for the
diagnosis of colon cancer by participating in various functions and
pathways. The validation of these biomarkers identified is to be
conducted in future studies.
Competing interests
Authors declare they have no competing
interests.
References
|
1
|
Li QC, Liang Y, Tian Y and Hu GR:
Arctigenin induces apoptosis in colon cancer cells through
ROS/p38MAPK pathway. J BUON. 21:87–94. 2016.PubMed/NCBI
|
|
2
|
Gao XY and Wang XL: An adoptive T cell
immunotherapy targeting cancer stem cells in a colon cancer model.
J BUON. 20:1456–1463. 2015.PubMed/NCBI
|
|
3
|
Gatzidou E, Mantzourani M, Giaginis C,
Giagini A, Patsouris E, Kouraklis G and Theocharis S: Augmenter of
liver regeneration gene expression in human colon cancer cell lines
and clinical tissue samples. J BUON. 20:84–91. 2015.PubMed/NCBI
|
|
4
|
Yu J, Ma X, Cheung KF, Li X, Tian L, Wang
S, Wu CW, Wu WK, He M, Wang M, et al: Epigenetic inactivation of
T-box transcription factor 5, a novel tumor suppressor gene, is
associated with colon cancer. Oncogene. 29:6464–6474. 2010.
View Article : Google Scholar : PubMed/NCBI
|
|
5
|
Rimkus C, Martini M, Friederichs J,
Rosenberg R, Doll D, Siewert JR, Holzmann B and Janssen KP:
Prognostic significance of downregulated expression of the
candidate tumour suppressor gene SASH1 in colon cancer. Br J
Cancer. 95:1419–1423. 2006. View Article : Google Scholar : PubMed/NCBI
|
|
6
|
Schepeler T, Reinert JT, Ostenfeld MS,
Christensen LL, Silahtaroglu AN, Dyrskjøt L, Wiuf C, Sørensen FJ,
Kruhøffer M, Laurberg S, et al: Diagnostic and prognostic microRNAs
in stage II colon cancer. Cancer Res. 68:6416–6424. 2008.
View Article : Google Scholar : PubMed/NCBI
|
|
7
|
Nielsen BS, Jørgensen S, Fog JU, Søkilde
R, Christensen IJ, Hansen U, Brünner N, Baker A, Møller S and
Nielsen HJ: High levels of microRNA-21 in the stroma of colorectal
cancers predict short disease-free survival in stage II colon
cancer patients. Clin Exp Metastasis. 28:27–38. 2011. View Article : Google Scholar : PubMed/NCBI
|
|
8
|
Engle SJ, Hoying JB, Boivin GP, Ormsby I,
Gartside PS and Doetschman T: Transforming growth factor beta1
suppresses nonmetastatic colon cancer at an early stage of
tumorigenesis. Cancer Res. 59:3379–3386. 1999.PubMed/NCBI
|
|
9
|
Chen X, Deane NG, Lewis KB, Li J, Zhu J,
Washington MK and Beauchamp RD: Comparison of nanostring
ncounter® data on FFPE colon cancer samples and
affymetrix microarray data on matched frozen tissues. PLoS One.
11:e01537842016. View Article : Google Scholar : PubMed/NCBI
|
|
10
|
Larsson O, Wahlestedt C and Timmons JA:
Considerations when using the significance analysis of microarrays
(SAM) algorithm. BMC Bioinformatics. 6:1292005. View Article : Google Scholar : PubMed/NCBI
|
|
11
|
Wang F, Xiao J, Cong W, Li A, Wei F, Xu J,
Zhang C, Fan Z, He J and Wang S: Stage-specific differential gene
expression profiling and functional network analysis during
morphogenesis of diphyodont dentition in miniature pigs, Sus
Scrofa. BMC Genomics. 15:1032014. View Article : Google Scholar : PubMed/NCBI
|
|
12
|
Ashburner M, Ball CA, Blake JA, Botstein
D, Butler H, Cherry JM, Davis AP, Dolinski K, Dwight SS, Eppig JT,
et al: The gene ontology consortium: Gene ontology: Tool for the
unification of biology. Nat Genet. 25:25–29. 2000. View Article : Google Scholar : PubMed/NCBI
|
|
13
|
Wixon J and Kell D: The Kyoto Encyclopedia
of Genes and Genomes-KEGG. Yeast. 17:48–55. 2000.PubMed/NCBI
|
|
14
|
Shannon P, Markiel A, Ozier O, Baliga NS,
Wang JT, Ramage D, Amin N, Schwikowski B and Ideker T: Cytoscape: A
software environment for integrated models of biomolecular
interaction networks. Genome Res. 13:2498–2504. 2003. View Article : Google Scholar : PubMed/NCBI
|
|
15
|
Patricia Rios-Ibarra C, Rodriguez-Silva
Janeth C, Lopez-Chuken Alonso Y, Ortiz-Lopez R, Fernandez-Castillo
E, Del Toro Runzer Beatriz C, Armenta-Perez Paul V,
Flores-Gutierrez JP, Quintanilla-Guzman A, Salinas-Santander M, et
al: Thymidylate synthase polymorphism in Mexican patients with
colon cancer treated with 5-fluorouracil. J BUON. 21:935–940.
2016.PubMed/NCBI
|
|
16
|
Kawaguchi K and Morita M: ABC Transporter
Subfamily D: Distinct differences in behavior between ABCD1-3 and
ABCD4 in subcellular localization, function, and human disease.
Biomed Res Int. 2016:67862452016. View Article : Google Scholar : PubMed/NCBI
|
|
17
|
Stein U and Walther W: Reversal of ABC
transporter-dependent multidrug resistance in cancer. Am J Cancer.
5:285–297. 2006. View Article : Google Scholar
|
|
18
|
Hayashi M, Nito K, Takei-Hoshi R, Yagi M,
Kondo M, Suenaga A, Yamaya T and Nishimura M: Ped3p is a
peroxisomal ATP-binding cassette transporter that might supply
substrates for fatty acid beta-oxidation. Plant Cell Physiol.
43:1–11. 2002. View Article : Google Scholar : PubMed/NCBI
|
|
19
|
Hernlund E, Ihrlund LS, Khan O, Ates YO,
Linder S, Panaretakis T and Shoshan MC: Potentiation of
chemotherapeutic drugs by energy metabolism inhibitors
2-deoxyglucose and etomoxir. Int J Cancer. 123:476–483. 2008.
View Article : Google Scholar : PubMed/NCBI
|
|
20
|
Holla VR, Wu H, Shi Q, Menter DG and
DuBois RN: Nuclear orphan receptor NR4A2 modulates fatty acid
oxidation pathways in colorectal cancer. J Biol Chem.
286:30003–30009. 2011. View Article : Google Scholar : PubMed/NCBI
|
|
21
|
Ellis JM, Hasek LY, Yurovich EJ, Harris KL
and Goergen CJ: Mouse carnitine palmitoyltransferase 2 (CPT2) is
required to sustain cardiac function. J FASEB. 30:684–688.
2016.
|
|
22
|
Seelaender MCL, Curi R, Colquhoun A,
Williams JF and Zammitt VA: Carnitine palmitoyltransferase II
activity is decreased in liver mitochondria of cachectic rats
bearing the Walker 256 carcinosarcoma: Effect of indomethacin
treatment. Biochem Mol Biol Int. 44:185–193. 1998.PubMed/NCBI
|
|
23
|
Yeh CS, Wang JY, Cheng TL, Juan CH, Wu CH
and Lin SR: Fatty acid metabolism pathway play an important role in
carcinogenesis of human colorectal cancers by
Microarray-Bioinformatics analysis. Cancer Lett. 233:297–308. 2006.
View Article : Google Scholar : PubMed/NCBI
|
|
24
|
Wang D and Dubois RN: PPARδ and
PGE2 signaling pathways communicate and connect
inflammation to colorectal cancer. Inflamm Cell Signal. 1:102014.
View Article : Google Scholar
|
|
25
|
Crushell E, Treacy EP, Dawe J, Durkie M
and Beauchamp NJ: Glycogen storage disease type III in the Irish
population. J Inherit Metab Dis. 33 Suppl 3:S215–S218. 2010.
View Article : Google Scholar : PubMed/NCBI
|
|
26
|
Guin S, Ru Y, Agarwal N, Lew CR, Owens C,
Comi GP and Theodorescu D: Loss of glycogen debranching enzyme AGL
drives bladder tumor growth via induction of hyaluronic acid
synthesis. Clin Cancer Res. 1:1274–1283. 2016. View Article : Google Scholar
|
|
27
|
Holroyde CP, Skutches CL, Boden G and
Reichard GA: Glucose metabolism in cachectic patients with
colorectal cancer. Cancer Res. 44:5910–5913. 1984.PubMed/NCBI
|
|
28
|
Straus DS: TNFα and IL-17 cooperatively
stimulate glucose metabolism and growth factor production in human
colorectal cancer cells. Mol Cancer. 12:782013. View Article : Google Scholar : PubMed/NCBI
|
|
29
|
Liang TW, Chiu HH, Gurney A, Sidle A,
Tumas DB, Schow P, Foster J, Klassen T, Dennis K, DeMarco RA, et
al: Vascular endothelial-junctional adhesion molecule (VE-JAM)/JAM
2 interacts with T, NK, and dendritic cells through JAM 3. J
Immunol. 168:1618–1626. 2002. View Article : Google Scholar : PubMed/NCBI
|
|
30
|
Lian S, Meng L, Xing X, Yang Y, Qu L and
Shou C: PRL-3 promotes cell adhesion by interacting with JAM2 in
colon cancer. Oncol Lett. 12:1661–1666. 2016. View Article : Google Scholar : PubMed/NCBI
|
|
31
|
Royse KE, Liang C, Uriostegui J, Ittmann
M, Graham DY, Hashem ES and Jiao L: Abstract 4591: Differential
expression of tight junction polarity genes in human colon cancer.
Cancer Res. 75:4591. 2015. View Article : Google Scholar
|
|
32
|
Lee S, Huh SJ, Oh SY, Koh MS, Kim SH, Lee
JH, Han JY, Choi HJ, Kim SJ and Kim HJ: Clinical significance of
coagulation factors in operable colorectal cancer. Oncol Lett.
13:4669–4674. 2017. View Article : Google Scholar : PubMed/NCBI
|
|
33
|
Im JH, Fu W, Wang H, Bhatia SK, Hammer DA,
Kowalska MA and Muschel RJ: Coagulation facilitates tumor cell
spreading in the pulmonary vasculature during early metastatic
colony formation. Cancer Res. 64:8613–8619. 2004. View Article : Google Scholar : PubMed/NCBI
|