Introduction
Esophageal cancer (EC) is the seventh most common
type of cancer and the sixth leading cause of cancer-related
mortality in males worldwide (1).
There were an estimated 455,800 new cases of EC and 400,200
mortalities as a result of EC in 2012 worldwide, with the highest
rates being found in Eastern Asia, and in Eastern and Southern
Africa (1). There are two main types
of EC, squamous cell carcinoma (ESCC) and adenocarcinoma. In China,
ESCC is rather common. It was previously reported that 88.84% of
cases of EC were esophageal squamous cell carcinoma (2). Patients with EC are almost always
diagnosed at advanced stages, and as a result the overall 5-year
survival rate was 17.5% in 2004 globally (3). By contrast, the survival rate is >80%
if patients are diagnosed at an early stage when the disease is
confined to the mucosa or submucosa and there is no metastasis to
the lymph nodes (4). Routine tests,
including endoscopic screening, imaging examinations and biopsies,
have greatly improved the diagnosis of patients with EC; however,
taking into account the traumatic or radiological injuries and the
cost perspective, these are not feasible on a population scale
(5–8).
The identification of blood biomarkers could therefore constitute a
significant advance in the diagnosis, prognosis and response to
therapy for patients with EC (9).
MicroRNAs (miRNAs/miRs) are a class of
single-stranded, well-conserved, small non-coding RNAs that are
20–24 nucleotides in length (10,11). The
latest miRBase (12) release (version
21, June 2014) contained 28,645 miRNA loci from 223 species,
processed to produce 35,828 mature miRNAs. miRNAs have been shown
to exhibit a promising role through their function as oncogenes or
tumor suppressors (10,13–15).
miRNAs possess the capacity to regulate target genes by binding to
the 3′-untranslated region of target mRNA to repress their
translation or regulate degradation (16,17).
Previously, it has been demonstrated that miRNAs are present in the
circulating blood plasma, where they are protected from degradation
in a stable, cell-free form by inclusion into lipid or lipoprotein
complexes (18). Furthermore, miRNA
profiles in the serum or plasma have been identified as having
unique characteristic changes in certain types of solid tumor
(19–21). These changes in miRNA profiles suggest
that miRNAs could be ideal candidates as novel blood biomarkers in
the clinical setting (21,22).
Materials and methods
miRNAs
The expression profile of miRNAs in EC has been
reported numerous times (9,23,24). The
present study chose several widely reported miRNAs from the
published academic literature to investigate their expression
levels in serum. The selected miRNAs in the present study were
hsa-miR-21-5p (miR-21), hsa-miR-25-3p (miR-25), hsa-miR-145-5p
(miR-145) and hsa-miR-203a-3p (miR-203) (Table I). The most widely reported miRNAs
were selected from the three cited reviews and verified against the
reports. Based on the different tumor-regulating functions
expressed by the miRNA, the four miRNAs that were studied were
finally selected. All searches were from English literature.
 | Table I.Sequences of miRNAs and internal
reference. |
Table I.
Sequences of miRNAs and internal
reference.
| miRNA/gene | Sequence |
|---|
| miR-21 |
UAGCUUAUCAGACUGAUGUUGA |
| miR-25 |
CAUUGCACUUGUCUCGGUCUGA |
| miR-145 |
GUCCAGUUUUCCCAGGAAUCCCU |
| miR-203 |
GUGAAAUGUUUAGGACCACUAG |
| U6 |
GTGCTCGCTTCGGCAGCACATATA |
|
|
CTAAAATTGGAACGATACAGAGAA |
|
|
GATTAGCATGGCCCCTGCGCAAGG |
|
|
ATGACACGCAAATTCGTGAAGCGT |
|
| TCCATATTTT |
Serum collection
Whole blood samples were derived from patients at
Peking University Cancer Hospital (Beijing, China) in January 2014.
All diagnoses were confirmed using biopsy and endoscopic screening.
The present study included 31 patients with untreated ESCC prior to
definitive surgical intervention and/or adjuvant therapy (EC-UT
group; 8 women and 23 men), 35 patients with ESCC following
treatment (EC-T group; 8 surgery, 11 chemotherapy, 13 surgery and
chemotherapy, and 3 radiotherapy; 9 women and 26 men) confirmed in
an inactive period subsequent to outpatient review, and 33 patients
with esophageal benign diseases (benign group; 17 reflux
esophagitis, 12 gastroesophageal reflux disease and 4 erosive
esophagitis; 12 women and 21 men). Disease staging was performed in
accordance to the American Joint Committee on Cancer/Union for
International Cancer Control stage classification (7th edition)
(25). The characteristics of the
subjects are summarized in Table II.
A total of 32 serum samples from healthy individuals (healthy
group; 13 women and 19 men) were used as controls. None of them had
been previously diagnosed with malignancy. Ethical permission and
informed consent was obtained for the use of all samples. Blood
samples were centrifuged at 900 × g for 10 min at 4°C to completely
remove all cellular components, and the supernatant (serum) was
collected. The sera were immediately frozen at −80°C until use.
| Table II.Clinical characteristics of serum
samples. |
Table II.
Clinical characteristics of serum
samples.
| Characteristic | Healthy | Benign | EC-UT | EC-T |
|---|
| No. of
patients | 32 | 33 | 31 | 35 |
| Age, years |
|
|
|
|
| Mean
(range) | 53 (34–72) | 51 (27–83) | 58 (44–75) | 60 (48–76) |
|
<55 | 19 | 17 | 11 | 10 |
|
≥55 | 13 | 16 | 20 | 25 |
| Sex |
|
|
|
|
|
Male | 19 | 19 | 21 | 24 |
|
Female | 13 | 14 | 10 | 11 |
| Clinical stage |
|
|
|
|
|
I–II | – | – | 9 | 11 |
|
III–IV |
|
| 22 | 24 |
| Treatment |
|
|
|
|
|
Surgery | 0 | 0 | 0 | 8 |
|
Chemotherapy | 0 | 0 | 0 | 11 |
| Surgery
and chemotherapy | 0 | 0 | 0 | 13 |
|
Radiotherapy | 0 | 0 | 0 | 3 |
All patients and healthy individuals provided
informed consent. All study procedures were performed in accordance
with the Helsinki Declaration, and the study was approved by the
Ethics Committee of Peking University Cancer Hospital and Institute
(Beijing, China).
RNA isolation
RNA was extracted from 350 µl serum using TRIzol LS
Reagent (Ambion; Thermo Fisher Scientific, Inc., Waltham, MA, USA)
according to the manufacturer's protocol. Briefly, 1.0 ml TRIzol LS
reagent was added to the serum sample, and the mixture was
incubated for 5 min at room temperature. Next, 200 µl chloroform
was added and the tube was vigorously agitated for 15 sec, and
incubated at room temperature for 15 min. Subsequent to
centrifugation at 12,000 × g for 15 min at 4°C, the supernatant was
transferred to a fresh tube, and an equal volume of isopropanol was
added. Following incubation at −20°C for 30 min, the mixture was
centrifuged at 12,000 × g for 10 min at 4°C to discard the
supernatant, and the RNA pellet was washed with 75% ethanol.
Subsequent to the removal of ethanol by centrifugation at 7,500 × g
for 5 min at 4°C, RNA was air dried for 10 min and then dissolved
in 50 µl RNase-free water and stored at −80°C until further
processing.
Reverse transcription-quantitative
polymerase chain reaction (RT-qPCR) of miRNAs
TaqMan® MicroRNA Reverse Transcription
kit (Applied Biosystems; Thermo Fisher Scientific, Inc.) was used
to perform 15-µl reverse transcription reactions that contained 5
µl purified serum RNA, 0.15 µl 100 mM dNTPs (with dTTP), 1 µl 50
U/µl MultiScribe™ Reverse Transcriptase, 1.5 µl 10X reverse
transcription buffer, and 0.19 µl 20 U/µl RNase inhibitor, 4.16 µl
nuclease-free water and 3 µl of 5X stem-loop RT primer
(TaqMan® MicroRNA Assays; Thermo Fisher Scientific,
Inc.). The mixture was incubated at 16°C for 30 min, 42°C for 30
min and 85°C for 5 min. RNase-free water was used as reverse
transcription negative controls.
Subsequently, real-time quantification was performed
using the LightCycler 480 Real-Time PCR system (Roche Molecular
Diagnostics, Pleasanton, CA, USA) with TaqMan® Universal
PCR Master Mix II, no UNG (Applied Biosystems; Thermo Fisher
Scientific, Inc.). The 15-µl PCR contained 4.5 µl RT product, 7.5
µl 2X TaqMan® Universal PCR Master Mix II, 0.75 µl 20X
primer and probe (TaqMan® MicroRNA assays; Thermo Fisher
Scientific, Inc.) and 2.25 µl nuclease-free water. The reactions
were incubated in a 96-well optical plate at 95°C for 10 min,
followed by 50 cycles of 95°C for 15 sec and 60°C for 1 min. All
reactions were run in triplicate, including blank controls without
complementary DNA (cDNA).
Relative quantification of serum
miRNAs
The cycle threshold (Cq) was defined as the number
of cycles required for the fluorescent signal to cross the
threshold in qPCR. Following reactions, the Cq data were determined
using default threshold settings, and the means of the Cq were
obtained from the triplicate PCRs. The purpose of the internal
reference gene is to normalize the PCRs for the amount of RNA added
to the reactions. As there is no current consensus on the use of
house-keeping genes or miRNAs for qPCR analysis, based on
previously published results, the present study used RNU6-1 (U6) as
the internal reference for quantification (Table I) (26,27). The
relative amount of miRNA was normalized to U6. The fold-change for
miRNAs from 4 groups of samples relative to the calibrator was
calculated using the 2−ΔΔCq method where ∆∆Cq=∆Cq
(sample)-∆Cq (calibrator) and ∆Cq=Cq (miRNA)-Cq (U6) (28).
Choice of calibrator
Firstly, a serum pool of 50 healthy donors was
packed into 500-µl Eppendorf tubes and stored at −80°C (20). One tube was then taken as a candidate
for the calibrator sample (termed ‘serum pool’). EC-109 is a type
of ESCC cell line cultured in vitro, which was provided by
the Cell Resource Center, Institute of Biomedical Science, Chinese
Academy of Medical Sciences/Peking Union Medical College (Beijing,
China). Following recovery, EC-109 cells were grown in RPMI-1640
medium (Gibco; Thermo Fisher Scientific, Inc.) supplemented with
10% fetal bovine serum (Gibco; Thermo Fisher Scientific, Inc.) and
100 U/ml penicillin-streptomycin at 37°C in a humidified atmosphere
containing 5% CO2. The cells were cultured for 8
successive generations, and collected from the fourth to the eighth
generation together. Cells were then packed into 1 ml tubes and
stored in liquid nitrogen, and this was taken as another candidate
for the calibrator sample (EC-109). Secondly, 15 serum samples were
chosen from patients with ESCC at random, and the expression levels
of serum miRNAs were detected and calculated in accordance with the
aforementioned process using two candidate calibrators (serum pool
and EC-109). Next, one calibrator was selected by comparing the two
groups of data.
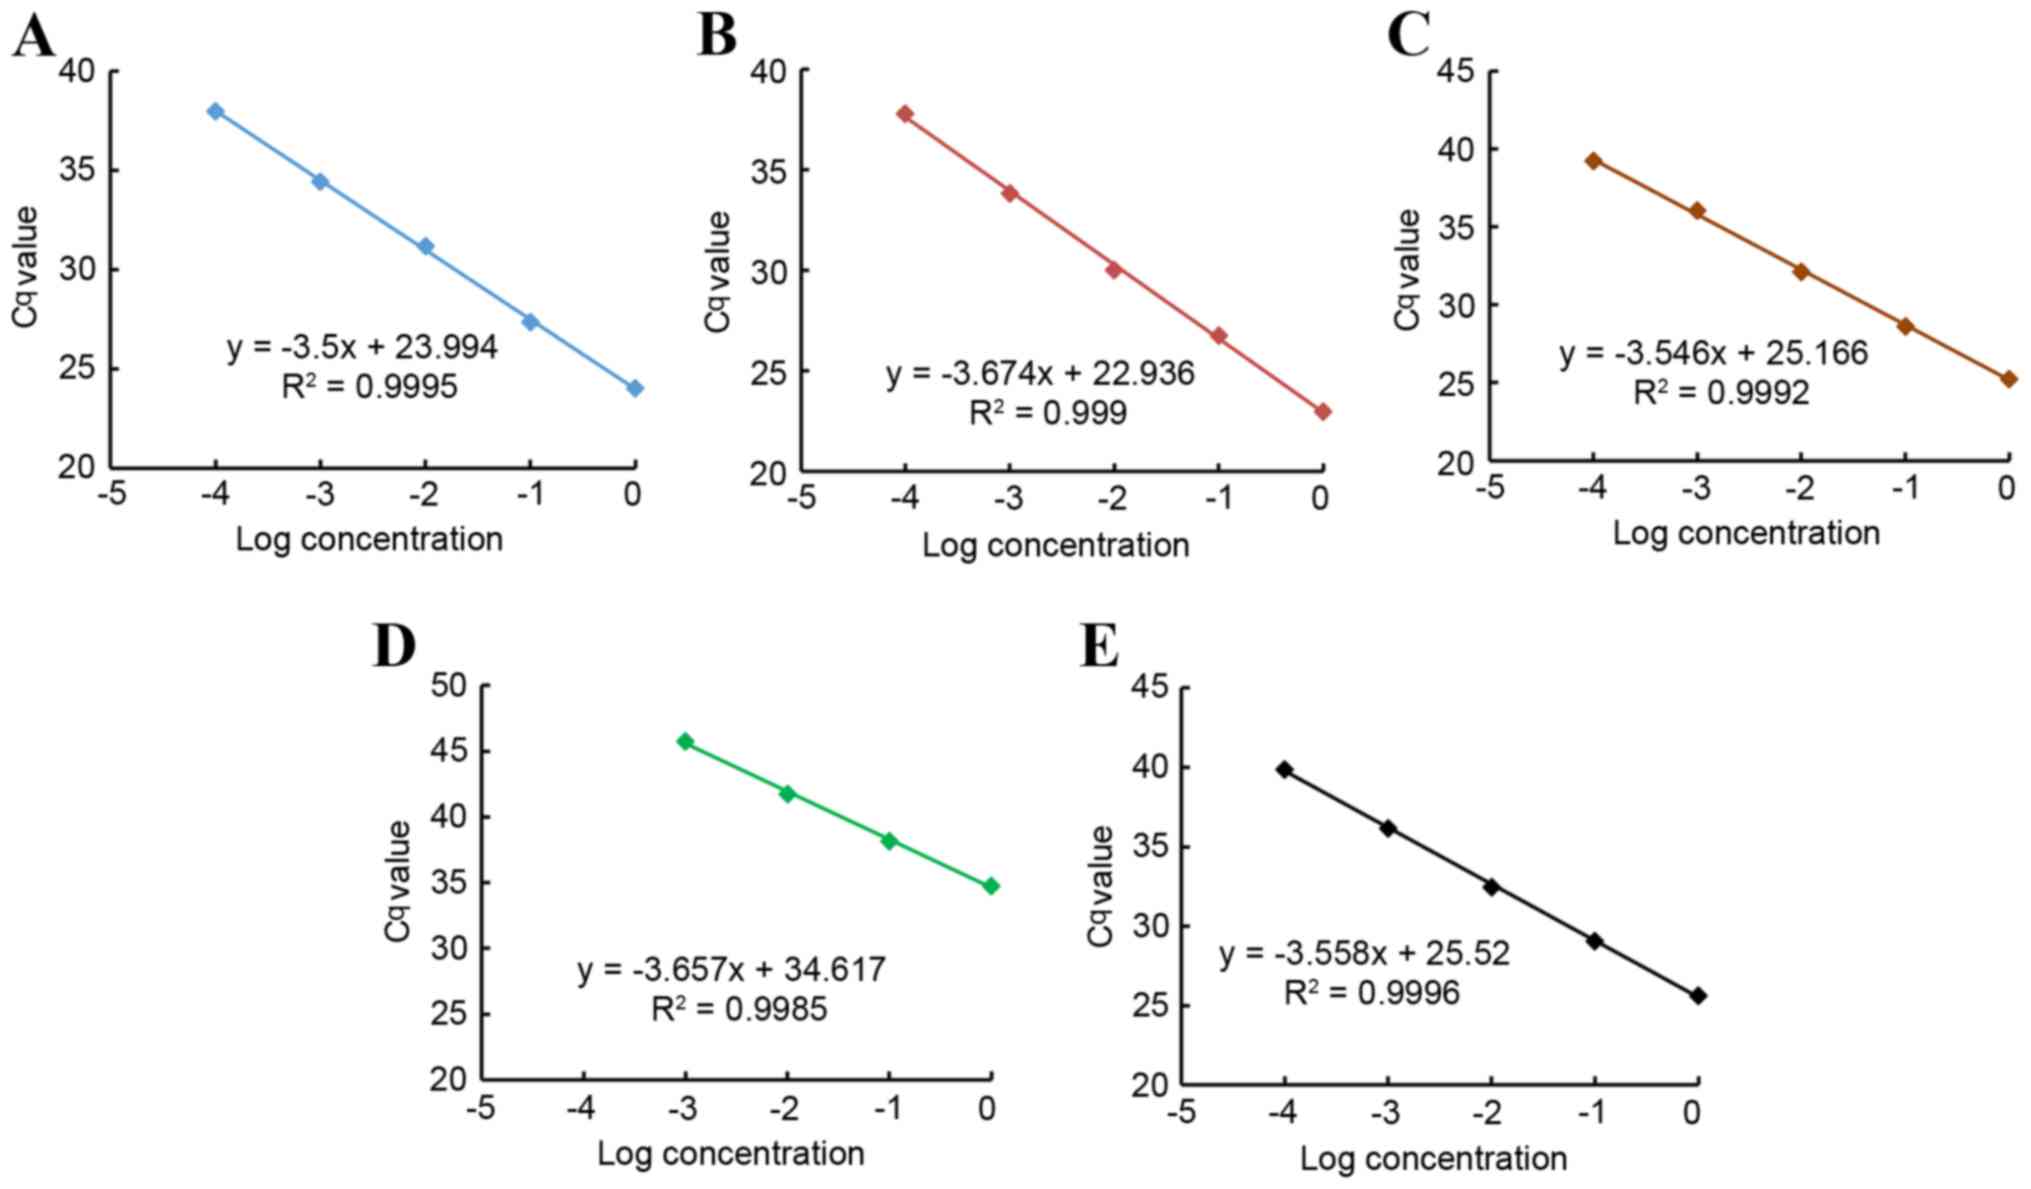
Amplification efficiency and Pearson's
correlation coefficient
Briefly, a 10-fold dilution series of cDNA
containing the tested miRNAs and the reference U6 gene were used as
the template for qPCR to generate a plot of log concentration of
the tested miRNA at different dilutions vs. the corresponding Cq
(29). The slope of the linear plot
is defined as -(1/log E), where E is the amplification efficiency,
and its value should approach 2 if the efficiency reaches the
maximum (28,29).
Correlation is a technique for investigating the
association between two quantitative, continuous variables
(21,30). The nearer the scatter of points is to
a straight line, the higher the strength of association between the
variables (21,30). The Pearson's correlation coefficient
(R) may take any value between −1 and +1 (20,21).
Statistical analysis
Statistical analyses were performed using SPSS 19.0
software (IBM SPSS, Armonk, NY, USA). Data shown are presented as
the mean ± standard error, and the differences between miRNA
expression levels and groups were determined by non-parametric
tests (Kruskal Wallis test). Receiver operating characteristic
(ROC) curves and the area under the ROC curve were used to assess
the feasibility of using serum miRNAs as a diagnostic tool in
discriminating patients with ESCC from negative controls (31). The present study used the Youden index
for the identification of the optimal cut-off point (32,33). All
P-values were two-sided, and P<0.05 was considered to indicate a
statistically significant difference.
Results
qPCR amplification efficiency and
linearity
The qPCR amplification efficiencies (E) in the
exponential phase were calculated according to the following
equation (28):
E=10-(1slope)
The results revealed that the amplification
efficiencies of miRNAs and U6 (miR-21, 1.93; miR-25, 1.87; miR-145,
1.91; miR-203, 1.88; and U6, 1.91) approached the maximum value,
and the difference among them was <5%. The best fit line also
demonstrated the strong linearity between the input of miRNAs and
the Cq values for RT-qPCR, and also between the input of U6 and the
Cq values (Pearson's correlation coefficient, r>0.99) (Fig. 1).
Intra- and inter-assay variation
To confirm the accuracy and reproducibility of qPCR,
the intra-assay precision was determined in 6 repeats within one
lightcycler run. Inter-assay variation was investigated in all
experimental runs performed on different days. Variability of
target genes, miRNAs and U6, was low in inter-test experiments
(miR-21, 0.22%; miR-25, 0.21%; miR-145, 0.21%; miR-203, 0.64%; and
U6, 0.26%, respectively) and in intra-test experiments (miR-21,
1.55%; miR-25, 1.61%; miR-145, 1.92%; miR-203, 1.76%; and U6,
1.39%, respectively) (Table III).
These data confirmed that the present study had good repeatability
and reliability.
| Table III.Intra-assay and inter-assay variation
of quantitative polymerase chain reaction. |
Table III.
Intra-assay and inter-assay variation
of quantitative polymerase chain reaction.
| Assay
statistics | miR-21 | miR-25 | miR-145 | miR-203 | U6 |
|---|
| Inter-assay |
|
|
|
|
|
| Mean ±
SE | 23.986±0.019 | 23.458±0.017 | 25.201±0.019 | 35.520±0.080 | 26.281±0.024 |
| CV,
% | 0.22 | 0.21 | 0.21 | 0.64 | 0.26 |
| Intra-assay |
|
|
|
|
|
| Mean ±
SE | 24.419±0.143 | 22.998±0.140 | 25.713±0.187 | 34.791±0.232 | 25.829±0.136 |
| CV,
% | 1.55 | 1.61 | 1.92 | 1.76 | 1.39 |
Comparison of calibrators
The 2−ΔΔCq method ensured that data from
two different candidates for calibration had the same coefficient
of variation (28). Therefore, the
standard deviation and range were more suitable to evaluate them.
The data is shown in Table IV.
| Table IV.Discrete description of the two
calibrators. |
Table IV.
Discrete description of the two
calibrators.
| Calibrators | Minimum | Maximum | Mean | Range | Standard
deviation | CV, % |
|---|
| EC-109 |
|
|
|
|
|
|
|
miR-21 | 16.00 | 831.75 | 184.08 | 815.75 | 237.22 | 128.87 |
|
miR-25 | 1871.53 | 33923.56 | 11261.79 | 32052.03 | 8770.17 | 77.88 |
|
miR-145 | 87076.75 | 2511294.86 | 771032.59 | 2424218.11 | 680663.2 | 88.28 |
|
miR-203 | 0.08 | 14.12 | 4.20 | 14.05 | 4.69 | 111.79 |
| Serum pool |
|
|
|
|
|
|
|
miR-21 | 0.76 | 39.67 | 8.78 | 38.91 | 11.31 | 128.87 |
|
miR-25 | 0.53 | 9.58 | 3.18 | 9.05 | 2.48 | 77.88 |
|
miR-145 | 0.44 | 12.55 | 3.85 | 12.12 | 3.40 | 88.28 |
|
miR-203 | 0.18 | 32.67 | 9.71 | 32.50 | 10.85 | 111.79 |
The results revealed that the serum pool exhibited
significantly smaller standard deviations and ranges in 3 miRNAs
and similar values in another miRNA, so the serum pool was selected
as the calibrator.
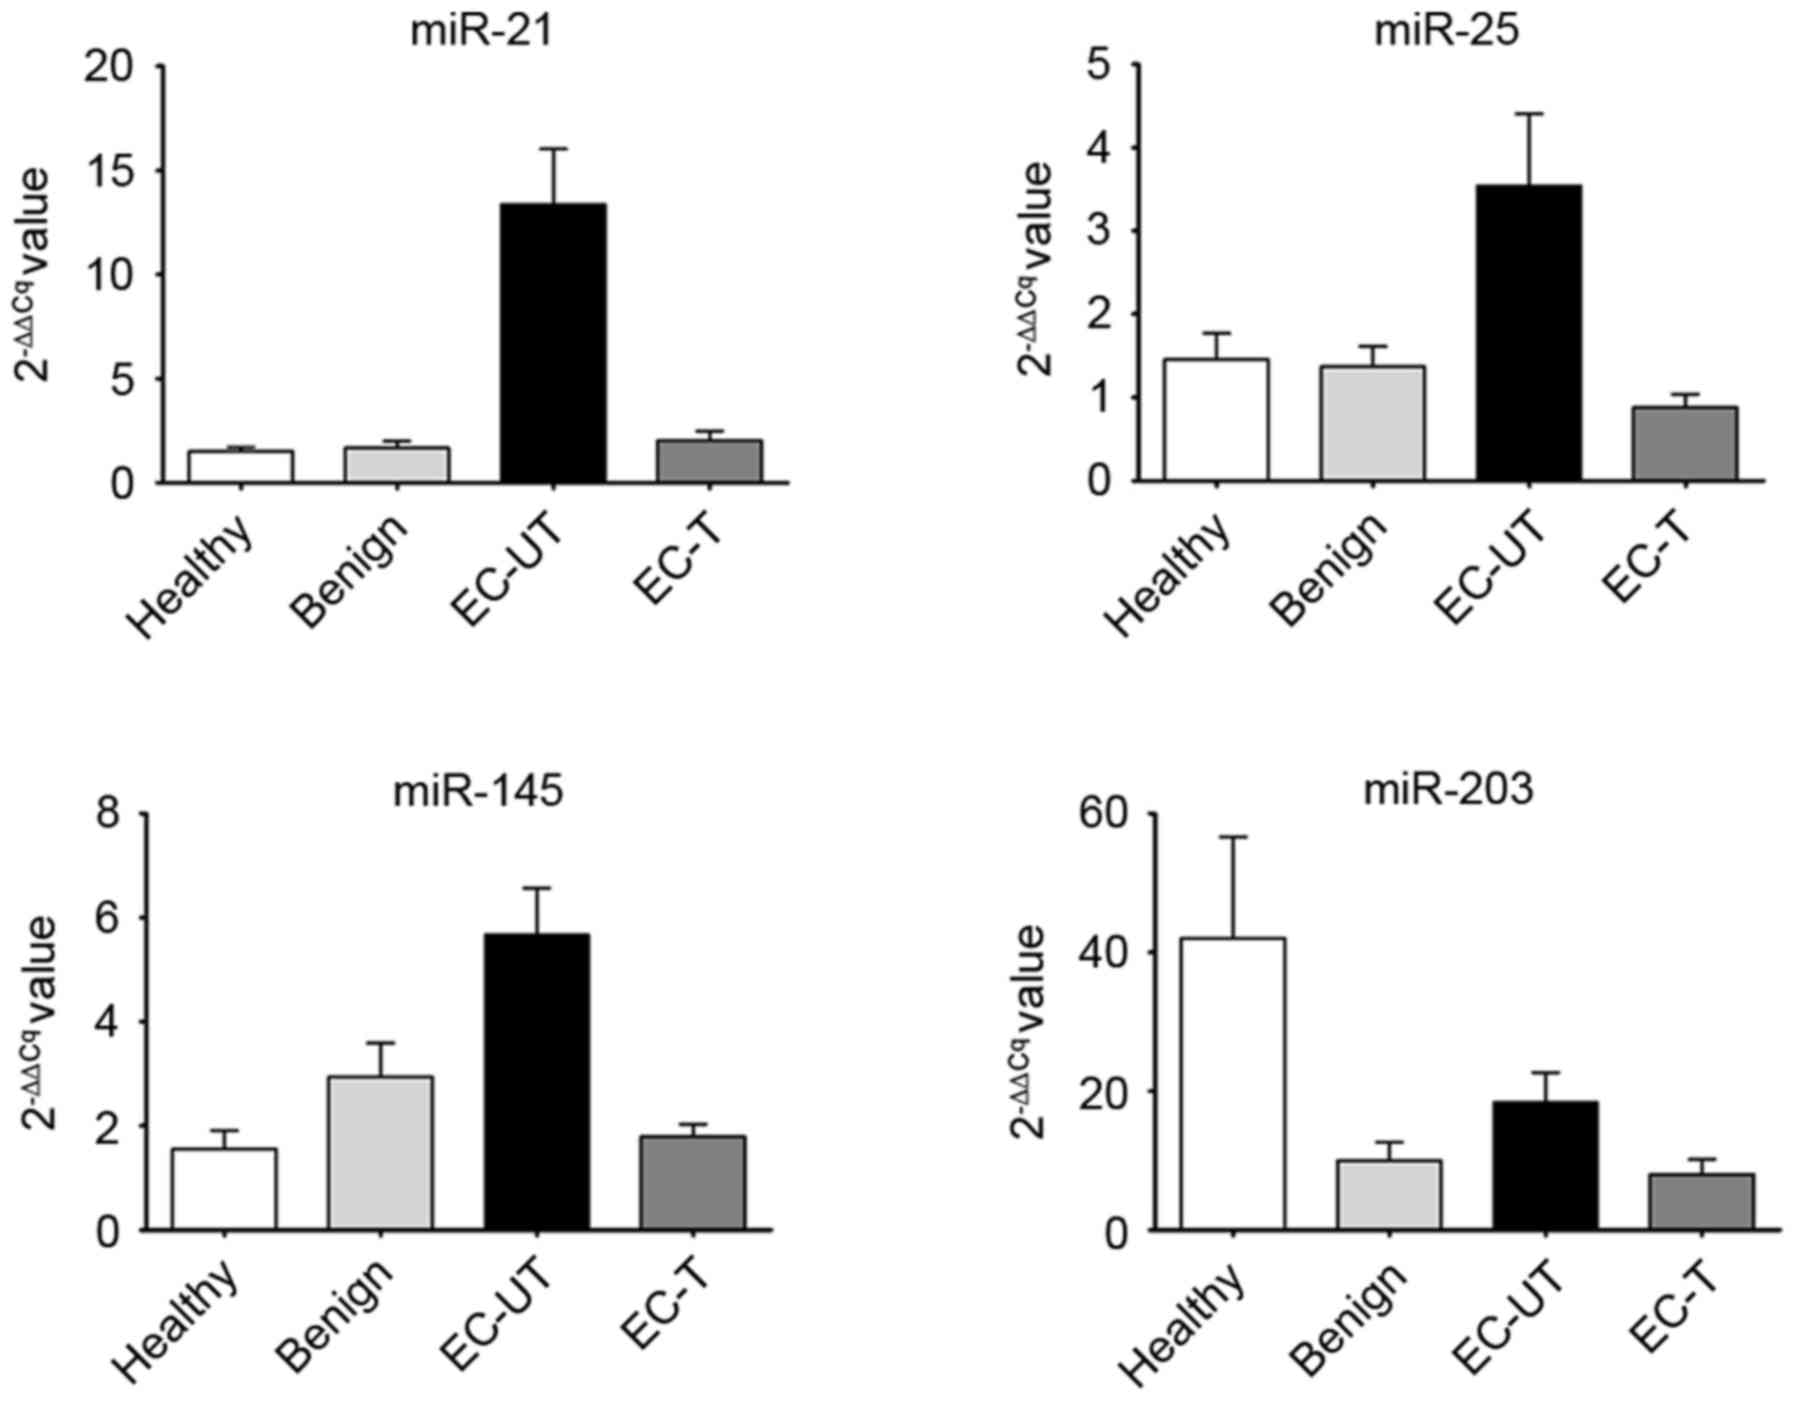
Expression levels of serum miRNAs
The present study first analyzed the expression of 4
miRNAs, respectively, in the 4 groups, and compared the results
with the expression of the different miRNAs among these groups. The
mean levels of serum miR-21, miR-25 and miR-145 in EC-UT were
significantly higher than in the other groups (all P<0.001;
Fig. 2). However, the level of serum
miR-203 in EC-UT was higher than in the benign and EC-T groups, but
lower than in the healthy group (all P>0.05; Fig. 2). Subsequently, the present study
evaluated whether there was a correlation between the level of
miRNA and the clinical characteristics of the samples. The results
revealed that expression of all 4 miRNAs exhibited no statistical
correlation with sex, age or clinical stage (all P>0.05; data
not shown).
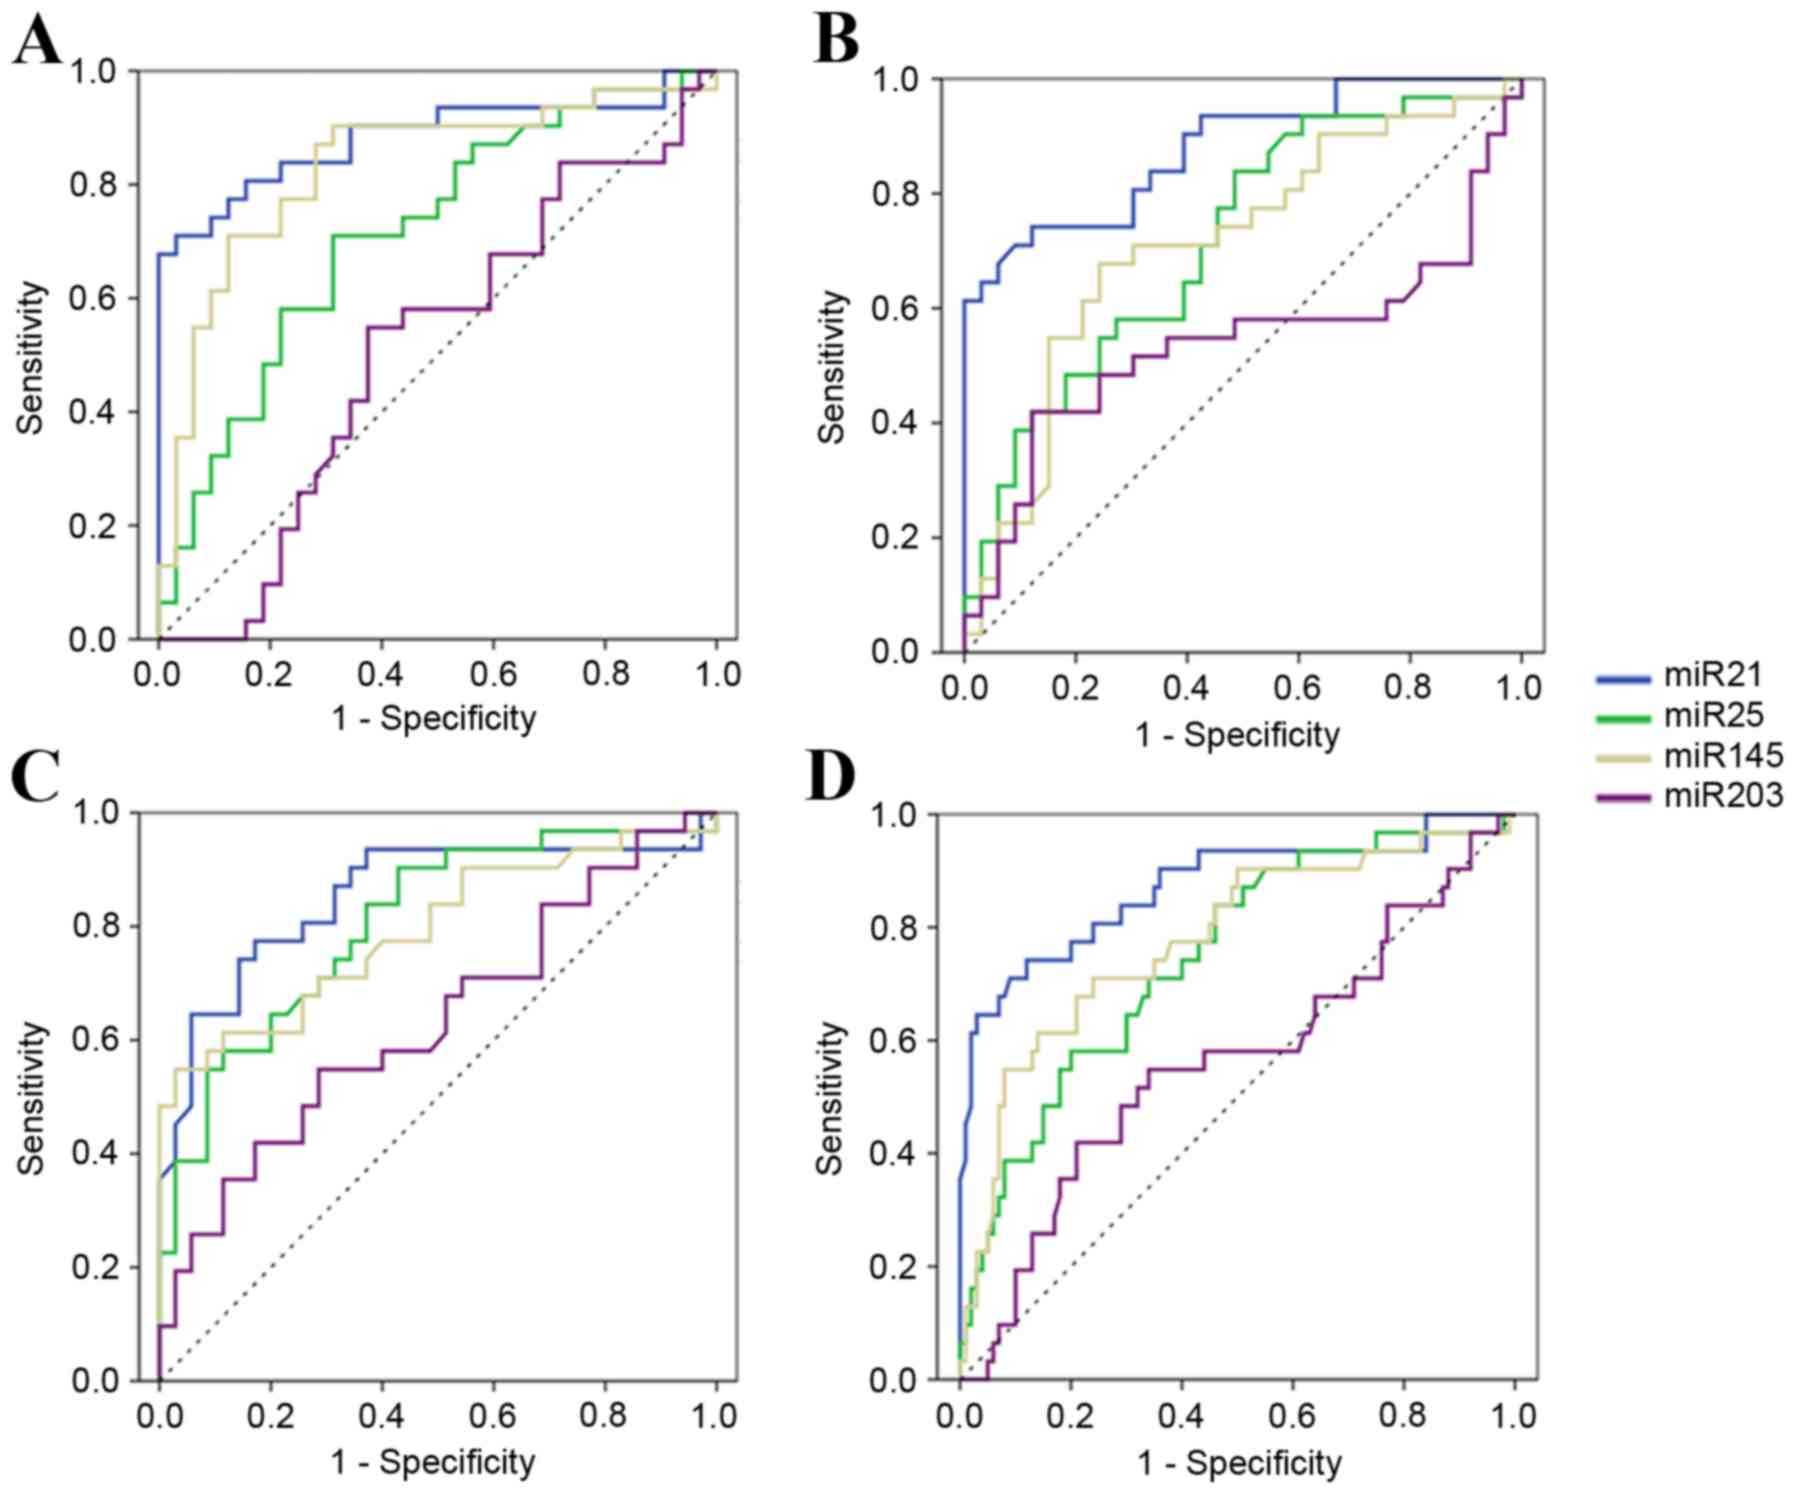
Evaluation of each serum miRNA as a
potential marker
The present study performed ROC curve analyses to
evaluate whether the serum miRNAs can be used as potential
diagnostic markers for EC. Firstly, expression levels of 4 miRNAs
were compared between the EC-UT group and the healthy group. The
ROC curve areas were 0.88 (95% CI, 0.80–0.97) for miR-21, 0.72 (95%
CI, 0.59–0.84) for miR-25, 0.83 (95% CI, 0.73–0.94) for miR-145 and
0.51 (95% CI, 0.37–0.66) for miR-203. At the cut-off values of
4.37, 1.20, 1.16 and 6.32, sensitivity and specificity in EC
diagnosis were 71.0 and 96.9% for miR-21, 71.0 and 68.8% for
miR-25, 90.3 and 68.8% for miR-145, and 54.8 and 62.5% for miR-203
(Fig. 3A). It was revealed that the
levels of serum miR-21, miR-25 and miR-145 were potential markers
for discriminating patients with EC-UT from healthy donors. As
there was no significant difference in the expression level of
serum miR-203 among different groups, miR-203 was no longer
considered as a potential marker.
Secondly, the EC-UT group and the benign group were
compared. The ROC curve areas were 0.88 (95% CI, 0.80–0.96) for
miR-21, 0.72 (95% CI, 0.59–0.84) for miR-25, 0.71 (95% CI,
0.58–0.84) for miR-145 and 0.54 (95% CI, 0.38–0.69) for miR-203. At
the cut-off values of 3.68, 0.79, 2.79 and 13.75, sensitivity and
specificity were 74.2 and 87.9% for miR-21, 83.9 and 51.5% for
miR-25, 67.7 and 75.8% for miR-145, and 41.9 and 87.9% for miR-203
(Fig. 3B). Therefore, the levels of 3
serum miRNAs (miR-21, miR-25 and miR-145) could serve as potential
markers to discriminate patients with EC-UT from benign
patients.
To additionally discriminate the EC-UT group from
the EC-T group, the ROC curve areas were 0.85 (95% CI, 0.75–0.95)
for miR-21, 0.80 (95% CI, 0.70–0.91) for miR-25, 0.79 (95% CI,
0.68–0.91) for miR-145 and 0.63 (95% CI, 0.50–0.77) for miR-203. At
the cut-off values of 2.77, 0.64, 4.61 and 6.92, sensitivity and
specificity were 77.4 and 82.9% for miR-21, 90.3 and 57.1% for
miR-25, 54.8 and 97.1% for miR-145, and 54.8 and 71.4% for miR-203
(Fig. 3C).
These results suggest that serum miR-21, miR-25 and
miR-145 could be promising biomarkers for diagnosis, differential
diagnosis between benign disease and ESCC, and evaluation of
therapeutic efficiency.
In addition, the present study also analyzed the
expression of the 4 miRNAs among healthy, benign and EC-T groups,
and identified no significant difference (all P>0.05; Fig. 2). Therefore, these 3 groups were set
as one negative control (termed ‘all others’), and discriminated
from EC-UT patients, with ROC curve areas of 0.87 (95% CI,
0.79–0.95) for miR-21, 0.75 (95% CI, 0.65–0.85) for miR-25, 0.78
(95% CI, 0.68–0.88) for miR-145 and 0.56 (95% CI, 0.44–0.69) for
miR-203, respectively. At the cut-off values of 3.68, 1.98, 3.58
and 13.749, sensitivity and specificity were 74.2 and 88.0% for
miR-21, 58.1 and 80.0% for miR-25, 61.3 and 86.0% for miR-145, and
41.9 and 79.0% for miR-203 (Fig.
3D).
Therefore, the results also suggest that serum
miR-21, miR-25 and miR-145 could be potential biomarkers of ESCC
for population screening.
Evaluation of combined application of
serum miRNAs as potential markers
The 3 selected serum miRNAs (miR-21, miR-25 and
miR-145) were divided into 4 different combinations, and then
evaluated to determine whether each of the new combinations could
be used as a single tumor marker for discriminating EC-UT patients
from other groups by using two methods (series connection and
parallel connection). The 4 combinations were as follows: miR-21
and miR-25; miR-21 and miR-145; miR-25 and miR-145; and miR-21,
miR-25 and miR-145, respectively. First, in terms of the series
connection method, when all serum miRNAs of one sample were in
excess of their cut-off values, this was defined as a positive
sample; on the contrary, this was defined as negative in any other
statuses. Subsequently, in terms of the parallel connection method,
the sample was defined as positive if any serum miRNA of one sample
was in excess of its cut-off value, while others were defined as
negative. Sensitivity and specificity are shown in Table V. The results revealed that
sensitivity and specificity of certain combinations, particularly
miR-21 and miR-145, were significantly high. When comparing EC-UT
with the healthy, benign, EC-T and all others groups, the
sensitivity and specificity of miR-21 and miR-145 were 71.0 and
96.9% (series connection), 90.9 and 72.7% (parallel connection),
97.1 and 82.9% (parallel connection), and 80.6 and 80.0% (parallel
connection), respectively.
| Table V.Sensitivity and specificity of
combined application of serum miRNAs as potential markers for
distinguishing EC patients from other groups. |
Table V.
Sensitivity and specificity of
combined application of serum miRNAs as potential markers for
distinguishing EC patients from other groups.
|
| Healthy vs. EC-UT,
% | Benign vs. EC-UT,
% | EC-T vs. EC-UT,
% | All others vs.
EC-UT, % |
|---|
|
|
|
|
|
|
|---|
| Connection | a | b | c | d | a | b | c | d | a | b | c | d | a | b | c | d |
|---|
| Series
connection |
|
|
|
|
|
|
|
|
|
|
|
|
|
|
|
|
|
Sensitivity | 67.7 | 71.0 | 71.0 | 61.3 | 68.0 | 61.0 | 62.0 | 58.0 | 74.2 | 48.4 | 51.6 | 45.2 | 51.6 | 54.8 | 45.2 | 41.9 |
|
Specificity | 93.8 | 96.9 | 75.0 | 96.9 | 90.0 | 81.0 | 87.0 | 90.0 | 93.5 | 83.9 | 93.5 | 93.5 | 93.0 | 94.0 | 90.0 | 96.0 |
| Parallel
connection |
|
|
|
|
|
|
|
|
|
|
|
|
|
|
|
|
|
Sensitivity | 90.3 | 90.3 | 90.3 | 90.3 | 87.9 | 90.9 | 75.8 | 90.9 | 82.9 | 97.1 | 97.1 | 97.1 | 80.6 | 80.6 | 74.2 | 83.9 |
|
Specificity | 40.6 | 68.8 | 62.5 | 62.5 | 51.5 | 72.7 | 51.5 | 51.5 | 57.1 | 82.9 | 57.1 | 57.1 | 75.0 | 80.0 | 76.0 | 73.0 |
Discussion
The study for novel tumor markers is a rapidly
growing area, however, a gap exists between laboratory studies and
clinical practice. With additional investigation, it is generally
considered that miRNAs could provide an important breakthrough in
the study of tumor markers in clinical practice.
Specificity and reliability in the present study
were guaranteed with the use of a stem-loop RT primer and TaqMan
probe. Due to the advantage of the high specificity of the
stem-loop RT primer, it was used to perform the reverse
transcription of miRNA (34,35). The TaqMan probe was utilized in the
PCR process since the accuracy of TaqMan RT-qPCR is significantly
higher than when using SYBR-Green in PCR analysis (36,37).
The serum pool was chosen as the calibrator rather
than EC-109 for two reasons. First, the data calculated using the
2−ΔΔCq relative quantitative method was used to
calculate the miRNAs expression levels relative to the calibrator
(28). In theory, the value obtained
can be used for the comparison of miRNA levels among different
groups, if utilizing the identical calibrator. When EC-109 is used
as the calibrator, the value represents the increase or decrease of
miRNAs between serum and ESCC cells, which is more convenient to
compare the expression levels of miRNAs between the present study
and in tissues and/or cells reported previously. However, in
contrast to EC-109, the discrete tendency of the data when using
the serum pool as the calibrator was statistically lower. Secondly,
when the serum pool was set as the calibrator, miRNAs in the
calibrator and sample serum were all derived from the whole blood,
therefore, the inherent interference factors of the calibrator and
sample serum in the experimental process, including protoheme, are
also similar. The experimental error of serum miRNAs can be
corrected with the use of the 2−ΔΔCq method by
calibration.
The present study highlighted the potential
application of serum miRNAs as biomarkers of ESCC in the clinical
practice. There are currently no specific tumor markers for EC in
clinical practice; therefore, it is hoped that the routine tumor
markers, including carcinoembryonic antigens and novel miRNAs
markers, were detected in only one tube of serum sample. According
to the requirement of experimental procedure and the limitations of
clinical application, the present study determined that the number
of selected miRNAs is four. By performing the 2−ΔΔCq
method to calculate the fold change as the expression of 4 types of
miRNAs among 4 separate groups (EC-UT, EC-T, benign and healthy),
the present study systematically evaluated the feasibility of these
miRNAs as tumor markers for ESCC. The present results suggested
that serum miR-21, miR-25 and miR-145, particularly miR-21, could
be ideal tumor markers with high and stable sensitivity and
specificity for diagnostic and prognostic monitoring. Additionally,
with series connection or parallel connection methods, these 3
miRNAs were divided into 4 different combinations with 2 or 3
miRNAs; consequently, the sensitivity and/or specificity of
combinations, particularly miR-21 and miR-25 will be further
improved.
miR-145, as a tumor suppressor, differing from
miR-21 and miR-25 with their oncogenic function (20,38–42), is
significantly downregulated in ESCC tissues, which can inhibit cell
motility in squamous cell carcinoma-derived cell lines (23,43).
However, the present study identified that there was a certain
degree of upregulation in the expression of peripheral blood serum
miR-145 in patients with ESCC. A similar trend was also identified
in the detection of miR-203, which inhibits cell proliferation in
squamous cell carcinoma-derived cell lines (44,45). Serum
miR-203 in EC-UT patients was much higher than that in EC-T and
benign patients, but lower than that in healthy patients, although
the difference was not significant. For this phenomenon, first of
all, it was assumed that it may be associated with circulating
tumor cells (CTCs). Subsequent to blood flowing through the solid
tumor, a large number of CTCs migrate into the blood (46). For instance, the quantity of CTCs
detected in the pulmonary venous blood of patients with primary
lung cancer was up to 10,034 per 7.5 ml blood (mean, 1,195)
(47). By contrast, the quantity of
CTCs in the peripheral blood is almost always zero, although
occasionally it is 1–3 cells per 7.5 ml (47,48). This
reduction of CTCs in the blood circulation may be a result of the
cells being broken due to various reasons. The cells may be broken,
however, the tumor suppressor miRNAs in the cells do not disappear;
instead, they enter the blood.
In other words, although the amount of tumor
suppressor miRNAs in a single cell is reduced, the number of CTCs
is significantly increased, which ultimately results in an increase
of serum tumor suppressor miRNAs. Secondly, the present study also
assumed that the degree of downregulation of miRNAs in a single
tumor cell may affect the abundance of these serum miRNAs, and so
differences exist between miR-145 and miR-203, although the two are
tumor suppressors (20,38–42).
Furthermore, the number of tumor cells migrating into the blood
varies among different patients, which also affects the separation
degree of expression of miRNAs in the peripheral blood serum and in
individual cells. Finally, miRNA has the advantage of having a
stable existence and the ability to reflect the activity of genes
compared with mRNA, protein and DNA. Therefore, it was assumed that
miRNA could more accurately reflect the situation of the tumor
cells in the blood circulatory system, and could therefore be more
efficiently performed to evaluate tumor metastasis with the
quantity of peripheral blood CTCs. However, additional studies are
required to prove this assumption.
Inevitably, there were limitations to the present
study. First, long-term follow-up data was not collected. The size
of samples was also relatively small, and a larger sample size is
required to have a beneficial effect on the discovery of the
differences of serum miRNAs among clinical stages (49). The selected 4 types of miRNA with a
similar dysregulation status may also exist in other tumors at the
same time (24,38,39,42,44).
Therefore, if the miRNAs selected are regulatory miRNAs of definite
driver genes of EC, the study of these miRNAs and driver genes may
improve the discriminability of ESCC with other cancer types
(15,50). Nevertheless, the feature of
multiple-targets of miRNAs may remain an obstacle for finding this
type of miRNA and driver genes with target associations (9,14,51).
The present study revealed that 3 miRNAs (miR-21,
miR-25 and miR-145) in serum had higher expression levels in
untreated patients with ESCC compared with healthy patients, and
had the ability to distinguish, to a certain degree, untreated
patients with ESCC from negative controls. Additional studies are
required to validate whether these or other miRNAs may be utilized
clinically as screening biomarkers for the early detection,
prognosis and evaluation of the therapeutic efficiency of ESCC.
Additional improvements are also required to apply the results of
fundamental studies such as these to routine clinical
applications.
Acknowledgements
Not applicable.
Funding
The present study was supported by grants from the
National High Technology Research and Development Program of China
(863 program; grant no. 2012AA02A204-B04).
Availability of data and materials
All data generated or analyzed during the present
study are included in this published article.
Authors' contributions
QZ and KW conceived and designed the study. KW, DC,
YM and JX performed the experiments. KW and DC wrote the paper. QZ
and KW reviewed and edited the manuscript. All authors read and
approved the manuscript and agreed to be accountable for all
aspects of the research in ensuring that the accuracy or integrity
of any part of the study was appropriately investigated and
resolved.
Ethics approval and consent to
participate
The present study was approved by the Ethics
Committee of Peking University Cancer Hospital and Institute
(Beijing, China).
Consent for publication
The patients have provided written informed consent
for the publication of associated data. All identifying information
has been removed.
Competing interests
The authors declare that they have no competing
interests.
References
|
1
|
Torre LA, Bray F, Siegel RL, Ferlay J,
Lortet-Tieulent J and Jemal A: Global cancer statistics, 2012. CA
Cancer J Clin. 65:87–108. 2015. View Article : Google Scholar : PubMed/NCBI
|
|
2
|
Zeng H, Zheng R, Zhang S, Zuo T, Xia C,
Zou X and Chen W: Esophageal cancer statistics in China, 2011:
Estimates based on 177 cancer registries. Thorac Cancer. 7:232–237.
2016. View Article : Google Scholar : PubMed/NCBI
|
|
3
|
Howlader N, Noone AM, Krapcho M, Garshell
J, Miller D, Altekruse SF, Kosary CL, Yu M, Ruhl J, Tatalovich Z,
et al: SEER Cancer Statistics Review, 1975–20112014; National
Cancer Institute. Bethesda, MD: http://seer.cancer.gov/csr/1975_2011/based on
November 2013 SEER data submission, posted to the SEER web site.
April. 2014 View Article : Google Scholar
|
|
4
|
Barbour AP, Jones M, Brown I, Gotley DC,
Martin I, Thomas J, Clouston A and Smithers BM: Risk stratification
for early esophageal adenocarcinoma: Analysis of lymphatic spread
and prognostic factors. Ann Surg Oncol. 17:2494–2502. 2010.
View Article : Google Scholar : PubMed/NCBI
|
|
5
|
Ajani JA, D'Amico TA, Almhanna K, Bentrem
DJ, Besh S, Chao J, Das P, Denlinger C, Fanta P, Fuchs CS, et al:
Esophageal and esophagogastric junction cancers, version 1.2015. J
Nati Compr Canc Netw. 13:194–227. 2015. View Article : Google Scholar
|
|
6
|
Zuccaro G Jr, Rice TW, Goldblum J,
Medendorp SV, Becker M, Pimentel R, Gitlin L and Adelstein DJ:
Endoscopic ultrasound cannot determine suitability for
esophagectomy after aggressive chemoradiotherapy for esophageal
cancer. Am J Gastroenterol. 94:906–912. 1999. View Article : Google Scholar : PubMed/NCBI
|
|
7
|
Tomizawa Y and Wang KK: Screening,
surveillance, and prevention for esophageal cancer. Gastroenterol
Clin North Am. 38(59–73): viii2009.
|
|
8
|
Kato H, Kuwano H, Nakajima M, Miyazaki T,
Yoshikawa M, Ojima H, Tsukada K, Oriuchi N, Inoue T and Endo K:
Comparison between positron emission tomography and computed
tomography in the use of the assessment of esophageal carcinoma.
Cancer. 94:921–928. 2002. View Article : Google Scholar : PubMed/NCBI
|
|
9
|
Sakai NS, Samia-Aly E, Barbera M and
Fitzgerald RC: A review of the current understanding and clinical
utility of miRNAs in esophageal cancer. Semin Cancer Biol.
23:512–521. 2013. View Article : Google Scholar : PubMed/NCBI
|
|
10
|
Calin GA and Croce CM: MicroRNA signatures
in human cancers. Nat Rev Cancer. 6:857–866. 2006. View Article : Google Scholar : PubMed/NCBI
|
|
11
|
Yates LA, Norbury CJ and Gilbert RJ: The
long and short of microRNA. Cell. 153:516–519. 2013. View Article : Google Scholar : PubMed/NCBI
|
|
12
|
Kozomara A and Griffiths-Jones S: miRBase:
Annotating high confidence microRNAs using deep sequencing data.
Nucleic Acids Res. 42:(Database Issue). D68–D73. 2014. View Article : Google Scholar : PubMed/NCBI
|
|
13
|
Calin GA, Sevignani C, Dumitru CD, Hyslop
T, Noch E, Yendamuri S, Shimizu M, Rattan S, Bullrich F, Negrini M
and Croce CM: Human microRNA genes are frequently located at
fragile sites and genomic regions involved in cancers. Proc Natl
Acad Sci USA. 101:2999–3004. 2004. View Article : Google Scholar : PubMed/NCBI
|
|
14
|
Krol J, Loedige I and Filipowicz W: The
widespread regulation of microRNA biogenesis, function and decay.
Nat Rev Genet. 11:597–610. 2010. View
Article : Google Scholar : PubMed/NCBI
|
|
15
|
Volinia S, Calin GA, Liu CG, Ambs S,
Cimmino A, Petrocca F, Visone R, Iorio M, Roldo C, Ferracin M, et
al: A microRNA expression signature of human solid tumors defines
cancer gene targets. Proc Natl Acad Sci USA. 103:2257–2261. 2006.
View Article : Google Scholar : PubMed/NCBI
|
|
16
|
Bartel DP: MicroRNAs: Genomics,
biogenesis, mechanism, and function. Cell. 116:281–297. 2004.
View Article : Google Scholar : PubMed/NCBI
|
|
17
|
Griffiths-Jones S, Grocock RJ, van Dongen
S, Bateman A and Enright AJ: miRBase: microRNA sequences, targets
and gene nomenclature. Nucleic Acids Res. 34:(Database Issue).
D140–D144. 2006. View Article : Google Scholar : PubMed/NCBI
|
|
18
|
Kroh EM, Parkin RK, Mitchell PS and Tewari
M: Analysis of circulating microRNA biomarkers in plasma and serum
using quantitative reverse transcription-PCR (qRT-PCR). Methods.
50:298–301. 2010. View Article : Google Scholar : PubMed/NCBI
|
|
19
|
Ali S, Almhanna K, Chen W, Philip PA and
Sarkar FH: Differentially expressed miRNAs in the plasma may
provide a molecular signature for aggressive pancreatic cancer. Am
J Transl Res. 3:28–47. 2010.PubMed/NCBI
|
|
20
|
Wang B and Zhang Q: The expression and
clinical significance of circulating microRNA-21 in serum of five
solid tumors. J Cancer Res Clin Oncol. 138:1659–1666. 2012.
View Article : Google Scholar : PubMed/NCBI
|
|
21
|
Chen X, Ba Y, Ma L, Cai X, Yin Y, Wang K,
Guo J, Zhang Y, Chen J, Guo X, et al: Characterization of microRNAs
in serum: A novel class of biomarkers for diagnosis of cancer and
other diseases. Cell Res. 18:997–1006. 2008. View Article : Google Scholar : PubMed/NCBI
|
|
22
|
Lu J, Getz G, Miska EA, Alvarez-Saavedra
E, Lamb J, Peck D, Sweet-Cordero A, Ebert BL, Mak RH, Ferrando AA,
et al: MicroRNA expression profiles classify human cancers. Nature.
435:834–838. 2005. View Article : Google Scholar : PubMed/NCBI
|
|
23
|
Fassan M, Baffa R, Kiss A, Zaninotto G and
Rugge M: MicroRNA dysregulation in esophageal neoplasia: The
biological rationale for novel therapeutic options. Curr Pharm Des.
19:1236–1241. 2013. View Article : Google Scholar : PubMed/NCBI
|
|
24
|
Redova M, Sana J and Slaby O: Circulating
miRNAs as new blood-based biomarkers for solid cancers. Future
Oncol. 9:387–402. 2013. View Article : Google Scholar : PubMed/NCBI
|
|
25
|
Edge SB and Compton CC: The American Joint
Committee on Cancer: The 7th edition of the AJCC cancer staging
manual and the future of TNM. Ann Surg Oncol. 17:1471–1474. 2010.
View Article : Google Scholar : PubMed/NCBI
|
|
26
|
Liu SG, Qin XG, Zhao BS, Qi B, Yao WJ,
Wang TY, Li HC and Wu XN: Differential expression of miRNAs in
esophageal cancer tissue. Oncol Lett. 5:1639–1642. 2013. View Article : Google Scholar : PubMed/NCBI
|
|
27
|
Gilson PR and McFadden GI: The
miniaturized nuclear genome of a eukaryotic endosymbiont contains
genes that overlap, genes that are cotranscribed, and the smallest
known spliceosomal introns. Proc Natl Acad Sci USA. 93:7737–7742.
1996. View Article : Google Scholar : PubMed/NCBI
|
|
28
|
Livak KJ and Schmittgen TD: Analysis of
relative gene expression data using real-time quantitative PCR and
the 2(-Delta Delta C(T)) method. Methods. 25:402–408. 2001.
View Article : Google Scholar : PubMed/NCBI
|
|
29
|
Schmittgen TD, Jiang J, Liu Q and Yang L:
A high-throughput method to monitor the expression of microRNA
precursors. Nucleic Acids Res. 32:e432004. View Article : Google Scholar : PubMed/NCBI
|
|
30
|
MacCallum RC, Zhang S, Preacher KJ and
Rucker DD: On the practice of dichotomization of quantitative
variables. Psychol Methods. 7:19–40. 2002. View Article : Google Scholar : PubMed/NCBI
|
|
31
|
Hand DJ and Till RJ: A simple
generalisation of the area under the ROC curve for multiple class
classification problems. Mach Learn. 45:171–186. 2001. View Article : Google Scholar
|
|
32
|
Schisterman EF, Perkins NJ, Liu A and
Bondell H: Optimal cut-point and its corresponding Youden Index to
discriminate individuals using pooled blood samples. Epidemiology.
16:73–81. 2005. View Article : Google Scholar : PubMed/NCBI
|
|
33
|
Akobeng AK: Understanding diagnostic tests
3: Receiver operating characteristic curves. Acta Paediatr.
96:644–647. 2007. View Article : Google Scholar : PubMed/NCBI
|
|
34
|
Yang LH, Wang SL, Tang LL, Liu B, Ye WL,
Wang LL, Wang ZY, Zhou MT and Chen BC: Universal stem-loop primer
method for screening and quantification of microRNA. PLoS One.
9:e1152932014. View Article : Google Scholar : PubMed/NCBI
|
|
35
|
Chen C, Ridzon DA, Broomer AJ, Zhou Z, Lee
DH, Nguyen JT, Barbisin M, Xu NL, Mahuvakar VR, Andersen MR, et al:
Real-time quantification of microRNAs by stem-loop RT-PCR. Nucleic
Acids Res. 33:e1792005. View Article : Google Scholar : PubMed/NCBI
|
|
36
|
Schmittgen TD, Zakrajsek BA, Mills AG,
Gorn V, Singer MJ and Reed MW: Quantitative reverse
transcription-polymerase chain reaction to study mRNA decay:
Comparison of endpoint and real-time methods. Anal Biochem.
285:194–204. 2000. View Article : Google Scholar : PubMed/NCBI
|
|
37
|
Yin JL, Shackel NA, Zekry A, McGuinness
PH, Richards C, Putten KV, McCaughan GW, Eris JM and Bishop GA:
Real-time reverse transcriptase-polymerase chain reaction (RT-PCR)
for measurement of cytokine and growth factor mRNA expression with
fluorogenic probes or SYBR Green I. Immunol Cell Biol. 79:213–221.
2001. View Article : Google Scholar : PubMed/NCBI
|
|
38
|
Asangani IA, Rasheed SA, Nikolova DA,
Leupold JH, Colburn NH, Post S and Allgayer H: MicroRNA-21 (miR-21)
post-transcriptionally downregulates tumor suppressor Pdcd4 and
stimulates invasion, intravasation and metastasis in colorectal
cancer. Oncogene. 27:2128–2136. 2008. View Article : Google Scholar : PubMed/NCBI
|
|
39
|
Meng F, Henson R, Wehbe-Janek H, Ghoshal
K, Jacob ST and Patel T: MicroRNA-21 regulates expression of the
PTEN tumor suppressor gene in human hepatocellular cancer.
Gastroenterology. 133:647–658. 2007. View Article : Google Scholar : PubMed/NCBI
|
|
40
|
Zhu S, Si ML, Wu H and Mo YY: MicroRNA-21
targets the tumor suppressor gene tropomyosin 1 (TPM1). J Biol
Chem. 282:14328–14336. 2007. View Article : Google Scholar : PubMed/NCBI
|
|
41
|
Kuhn AR, Schlauch K, Lao R, Halayko AJ,
Gerthoffer WT and Singer CA: MicroRNA expression in human airway
smooth muscle cells: Role of miR-25 in regulation of airway smooth
muscle phenotype. Am J Respir Cell Mol Biol. 42:506–513. 2010.
View Article : Google Scholar : PubMed/NCBI
|
|
42
|
Zhang H, Zuo Z, Lu X, Wang L, Wang H and
Zhu Z: MiR-25 regulates apoptosis by targeting Bim in human ovarian
cancer. Oncol Rep. 27:594–598. 2012.PubMed/NCBI
|
|
43
|
Liu R, Liao J, Yang M, Sheng J, Yang H,
Wang Y, Pan E, Guo W, Pu Y, Kim SJ and Yin L: The cluster of
miR-143 and miR-145 affects the risk for esophageal squamous cell
carcinoma through co-regulating fascin homolog 1. PLoS One.
7:e339872012. View Article : Google Scholar : PubMed/NCBI
|
|
44
|
Furuta M, Kozaki KI, Tanaka S, Arii S,
Imoto I and Inazawa J: miR-124 and miR-203 are epigenetically
silenced tumor-suppressive microRNAs in hepatocellular carcinoma.
Carcinogenesis. 31:766–776. 2010. View Article : Google Scholar : PubMed/NCBI
|
|
45
|
Yuan Y, Zeng ZY, Liu XH, Gong DJ, Tao J,
Cheng HZ and Huang SD: MicroRNA-203 inhibits cell proliferation by
repressing ΔNp63 expression in human esophageal squamous cell
carcinoma. BMC Cancer. 11:572011. View Article : Google Scholar : PubMed/NCBI
|
|
46
|
Engell HC: CCancer cells in the
circulating blood; a clinical study on the occurrence of cancer
cells in the peripheral blood and in venous blood draining the
tumour area at operation. Acta Chir Scand Suppl. 201:1–70.
1955.PubMed/NCBI
|
|
47
|
Okumura Y, Tanaka F, Yoneda K, Hashimoto
M, Takuwa T, Kondo N and Hasegawa S: Circulating tumor cells in
pulmonary venous blood of primary lung cancer patients. Ann Thorac
Surg. 87:1669–1675. 2009. View Article : Google Scholar : PubMed/NCBI
|
|
48
|
Cristofanilli M, Budd GT, Ellis MJ,
Stopeck A, Matera J, Miller MC, Reuben JM, Doyle GV, Allard WJ,
Terstappen LW and Hayes DF: Circulating tumor cells, disease
progression, and survival in metastatic breast cancer. N Engl J
Med. 351:781–791. 2004. View Article : Google Scholar : PubMed/NCBI
|
|
49
|
Zhuang LP and Meng ZQ: Serum miR-224
reflects stage of hepatocellular carcinoma and predicts survival.
Biomed Res Int. 2015:7317812015. View Article : Google Scholar : PubMed/NCBI
|
|
50
|
Agrawal N, Jiao Y, Bettegowda C, Hutfless
SM, Wang Y, David S, Cheng Y, Twaddell WS, Latt NL, Shin EJ, et al:
Comparative genomic analysis of esophageal adenocarcinoma and
squamous cell carcinoma. Cancer Discov. 2:899–905. 2012. View Article : Google Scholar : PubMed/NCBI
|
|
51
|
Barbash S, Shifman S and Soreq H: Global
coevolution of human microRNAs and their target genes. Mol Biol
Evol. 31:1237–1247. 2014. View Article : Google Scholar : PubMed/NCBI
|