Introduction
Non-Hodgkin's lymphoma (NHL) is a malignancy with an
incidence rate that varies according to geographical region.
Overall, the global incidence is 4.3/100,000 individuals; however,
the incidence is higher (≤12.8-fold) in developed countries
compared with a 2.8-fold reduced incidence in less developed
countries, and NHL is the 12th leading cause of mortality among
different types of cancer (1).
Lymphomas comprise a heterogeneous group of hematological
malignancies classified according to their clinical and
anatomicopathological features and, more recently, their
cytogenetic markers. Diffuse large B cell lymphoma (DLBCL) is the
most common of all aggressive types of lymphoma (2).
At present, the standard therapy for DLBCL includes
administration of the anti-cluster of differentiation 20 monoclonal
antibody, rituximab, which is typically added to chemotherapy with
cyclophosphamide, doxorubicin, vincristine and prednisone (R-CHOP),
or other drugs in infusion with etoposide, prednisone, vincristine
and cyclophosphamide (R-EPOCH) (2).
However, first-line treatment fails in 20–40% of patients (3). At present, clinical scores, including
the International Prognostic Index (IPI) (4) and the revised-IPI (5) are used in order to assist in the
prediction of patient outcome, to provide information for patients
who are at risk of early relapse or progression and to aid in
developing risk stratification tools. However, these scores were
developed prior to the introduction of rituximab and therefore may
not be applicable for the current therapies that incorporate
rituximab. 18Fluorodeoxyglucose positron emission
tomography (18F-FDG PET/CT) is now widely used in the
staging of the majority of lymphomas and is accepted as a tool for
the assessment of therapeutic response (6). Among the numerous 18F-FDG
PET/CT parameters, the most frequently studied is the standardized
uptake value (SUV). Recently, Park et al (7) reported that interim 18F-FDG
PET/CT scans may be able to predict the outcome of patients with
DLBCL using interpretation based on SUVmax-liver.
Although this comparison (changes in SUVmax-liver)
increased the utility of this tool, this value is a
semi-quantitative index as it cannot reflect tumor dimensions or
volume. However, the metabolic tumor volume (MTV) is a parameter
that integrates tumor activity and volume (7).
The present study aimed to evaluate the clinical
implications of interim 18F-FDG PET/CT scans in
combination with clinical parameters as an early prognostic
indicator of complete response (CR) and overall survival (OS) in
patients with DLBCL.
Materials and methods
Patients
The present study was a prospective, non-randomized,
non-comparative and observational trial. Patients with a diagnosis
of DLBCL who had attended the National Cancer Institute (Mexico
City, Mexico) between January 2013 and June 2014 were invited to
participate. The inclusion criteria were as follows: Untreated
patients, >18 years of age, with a histopathological diagnosis
of DLBCL. The exclusion criteria were as follows: Patients
presenting with any active infection, including hepatitis B,
hepatitis C and human immunodeficiency virus, uncontrolled diabetes
mellitus, pregnancy or lactation. In total, 60 patients with a
histological diagnosis of DLBCL who fulfilled the inclusion
criteria were invited to participate in the present study; 52
patients accepted and provided written informed consent. In total,
2 patients presented with severe disease progression prior to the
initiation of treatment and were therefore excluded from the study.
The study protocol was approved by the Institutional Review Board
of National Cancer Institute in Mexico City (register no.
013/006/ICI; Mexico City, Mexico), and all patients provided
written informed consent prior to participation in the study.
Patient clinical parameters that were analyzed
included sex, age, clinical stage, Eastern Cooperative Oncology
Group (ECOG) performance status (8),
clinical stage [Lugano classification (9)], baseline levels of lactic dehydrogenase
(LDH), β2 microglobulin, blood hemoglobin and serum albumin,
absolute leukocyte and lymphocyte counts, International Prognostic
Index (IPI) score, date of diagnosis, date of relapse, date of
mortality and last hospital visit (8,9).
All patients were treated with the rituximab,
cyclophosphamide, doxorubicin, vincristine and prednisone (R-CHOP)
regimen [intravenous (IV) rituximab, 375 mg/m2 on day 1;
IV cyclophosphamide, 750 mg/m2 on day 1; IV doxorubicin,
50 mg/m2 on day 1; IV vincristine, 1.4 mg/m2,
with capping at 2 mg, on day 1; and oral prednisone, 100 mg daily
on days 1–5]. Patients with localized disease (stages I–II) and
advanced-stage disease (stages III–IV) were treated with 6 and 8
cycles of the R-CHOP regimen, respectively.
18F-FDG PET/CT
An 18F-FDG PET/CT scan was performed at
the time of diagnosis. The interim 18F-FDG PET/CT scan
was performed 15 days after the third cycle of treatment and the
final response was assessed by a third 18F-FDG PET/CT
performed six weeks after the end of treatment. All
18F-FDG PET/CT scans were performed using the Biograph
16 PET-CT scanner (Siemens AG, Munich, Germany). Patients fasted
for at least 6 h prior to the intravenous (IV) administration of
18F-FDG (5.5 MBq/kg body weight) to ensure a serum
glucose level of <10 mmol/l.
A whole-body CT scan was performed 50–70 min
following IV administration of a dose of 5.5 MBq/kg (150 µCi/kg)
18F-FDG, and transmission data were acquired using
low-dose CT [120 kV, automated from 100–130 MA, 512×512 matrix, 50
cm field of view (FOV), 3.75 mm slice thickness and a rotation time
of 0.8 sec], extending from the base of the skull to the proximal
thighs. Immediately following CT acquisition, a whole-body
18F-FDG PET scan was acquired in 3D (matrix 168×168).
For each bed position (16.2 cm with an overlapping scale of 4.2
cm), a 3 min acquisition time was used with a 15.5 cm FOV. The
emission data were corrected for randomness, scatter and decay.
Reconstruction was performed with an ordered subset expectation
maximization (OSEM) algorithm with 3 iterations/12 subsets. The
images were processed with a Gauss-filter, in order to normalize
the data, with a full width at half-maximum of the Gauss curve, at
6 mm. Attenuation correction was performed using the low-dose
non-enhanced CT.
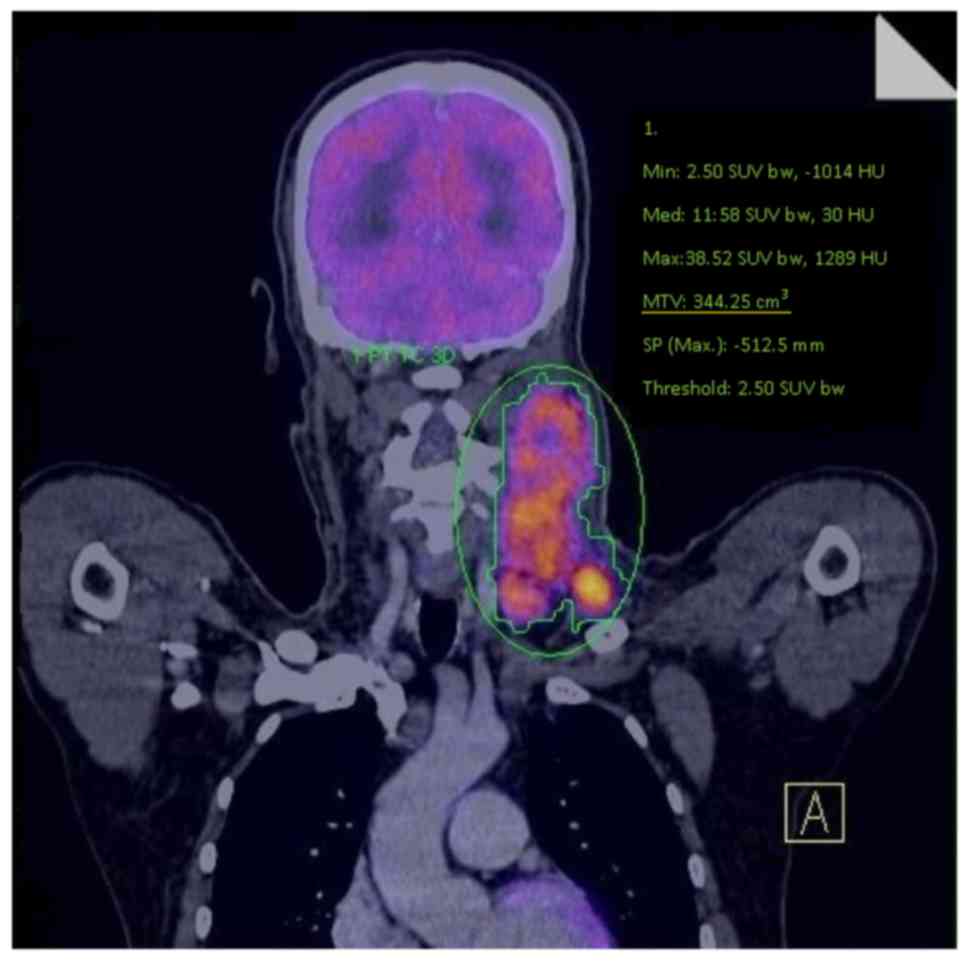
A workstation (Multimodality Workplace, Siemens AG),
providing multi-planar reformatted images, was also used for image
display and analysis. The MTV and SUVmax of whole-body
tumors were measured using the isocontour tool provided by TrueD
Syngo software, version VE36A (Siemens AG), with manual adjustment;
all adjustments were made to the isocontour threshold in order to
delimitate the metabolic activity site. MTV was measured from
FDG-PET/CT images using a SUV-based automated contouring program
(TrueD Syngo software, version VE36A (Siemens AG). The margins of
the tumor were drawn to incorporate each target lesion in the
axial, coronal and sagittal 18F-FDG PET/CT images. The
contour around the target lesions inside the limits was
automatically produced using manual adjustment. A fixed threshold
value of 40% SUVmax was used (Fig. 1).
Response evaluation
The response was evaluated according to the
Deauville criteria (10). The MTV was
measured for each lesion and was defined as the volume of tumor
tissue with increased 18F-FDG uptake. This represented
the quantity of highly metabolic tumor cells, thereby aiding in the
volumetric estimation of the active tumor burden.
For interim 18F-FDG PET/CT analysis of
the MTV, each lesion was evaluated, and the change in total MTV was
calculated. The total MTV was measured by summing the MTV of each
metabolic lesion. Patients were classified using quantitative
analysis of MTV changes based on the percentage change in the MTV
(ΔMTV) between baseline and interim 18F-FDG PET/CT
scans. This comparison was also performed for the final therapeutic
response assessment.
Statistical analysis
Following descriptive analysis, the diagnostic
accuracy was calculated using the ΔMTV as the proposed diagnostic
test. The complete response (CR) was determined using the final
18F-FDG PET/CT evaluation. The receiver operating
characteristic (ROC) curve analysis used different cut-off values
for the ΔMTV. The cut-off obtained to separate two groups; an MTV
decrease <94 vs. ≥94%.
A sample size of 50 patients was calculated, and the
model was assumed to have a sensitivity of 90% with regards to
correctly predicting CR, with a lower limit of 80% sensitivity
[with a confidence interval (CI) of 95%].
Bi- and multivariate analyses performed with an
analysis of variance and a logistic regression model, respectively,
were performed to evaluate factors associated with CR on the
assessment at final PET-CT. Factors analyzed included: Gender, B
symptoms, bulky disease, clinical stage, ECOG score, bone marrow
infiltration, biochemical parameters (increased LDH, increased
β2-microglobulin, basal creatinine, hemoglobin, albumin, leukocytes
and lymphocytes values), IPI score, and decrease in MTV. The
associations between various factors (including all clinical
factors, SUVmax, and the MTV observed in the baseline
and interim 18F-FDG PET/CT scans) and CR were evaluated
using the logistic regression model. The odds ratios (OR) and their
respective 95% CIs were calculated as a measure of association. A
final model was defined and interaction analysis was performed; no
significant interaction were identified. Subsequent to constructing
the final model, the predicted probability of achieving CR was
calculated for each case. Thereafter, along with ROC curve
analysis, two groups were defined according to this predicted
probability, with a cut-off of 0.69.
Overall survival (OS) was calculated using the
Kaplan-Meier method, followed by the log-rank test. Two-tailed
distributions were considered in all analyses, and P<0.05 was
considered to indicate a statistically significant difference.
Statistical analysis was performed using SPSS (version 20; IBM
Corp., Armonk, NY, USA).
Results
Patients
A total of 50 patients were included [19 women (38%)
and 31 men (62%)]. The mean age was 55 years (standard deviation,
11.38; range, 21–73 years). In total, 32 patients presented with
advanced disease (stages III/IV) 18 patients had early disease
(stages I/II), 72% exhibited B symptoms and 58% exhibited bulky
disease. Based on the IPI scores, 44% of the patients were within
the intermediate-high or high risk of relapse. The clinical
characteristics of the patients are summarized in Table I.
 | Table I.Clinical and demographical
characteristics of patients at the time of diagnosis (n=50). |
Table I.
Clinical and demographical
characteristics of patients at the time of diagnosis (n=50).
| Characteristic | Number of patients,
n (%)a |
|---|
| Age, years | 55±11.38
(21–73) |
| Male/female | 31 (62)/19
(38) |
| Lugano stage
classification, n (%) |
|
|
I–II | 18 (36) |
|
III–IV | 32 (64) |
| B symptoms present,
n (%) | 36 (72) |
| Bulky disease, n
(%) | 29 (58) |
| LDH level, n
(%) |
|
|
High | 28 (56) |
|
Normal | 22 (44) |
| B2M, n (%) |
|
|
High | 24 (48) |
|
Normal | 26 (52) |
| IPI, n (%) |
|
|
Low | 15 (30) |
|
Low-intermediate | 13 (26) |
|
High-intermediate | 15 (30) |
|
High | 7 (14) |
| Hematological
parameters |
|
| Mean
hemoglobin level, g/dl (range) [normal range] | 13.87±2.59
(8.5–19.50) [13-15] |
|
Leukocyte count,
1,000/mm3 | 8.02±2.39 (3.2–13)
[4.8–10-8] |
|
Lymphocyte count,
1,000/mm3 | 1.69±0.8 (0.6–4.1)
[1.4–3.4] |
|
Platelet count,
100/mm3 | 340.28±148.39
(94–788) [130-400] |
|
Creatinine, mg/dl | 0.86±0.19
(0.5–1.34) [0.5–1.2] |
| LDH,
UI/l | 421.7±843.9
(123–6136) [114-198] |
| B2M,
mg/l | 2.74±0.99
(1.27–5.68) [1.4–2.5] |
18F-FDG PET/CT
Baseline, interim and final 18F-FDG
PET/CT scans were performed in all cases. 18F-FDG PET/CT
scans performed at the time of diagnosis revealed that 16 patients
exhibited DLBCL at one site, 13 patients exhibited DLBCL at two
sites, 5 patients exhibited DLBCL at three sites, 7 patients
exhibited DLBCL at four sites and 9 patients exhibited DLBCL at
five or more sites. In total, 33 cases (66%) were located in the
neck and 17 cases (34%) were located in the abdomen. As
demonstrated in Table II, the median
total MTV was 1,205.34 cm3 (range, 1.74–9,597.45) at the
baseline 18F-FDG PET/CT. The median SUVmax
for lesions 1–5 and changes during and following treatment are
presented in Table II.
| Table II.18FDG PET/CT parameters at
baseline, interim and final assessments (n=50). |
Table II.
18FDG PET/CT parameters at
baseline, interim and final assessments (n=50).
| A, Baseline
18FDG PET/CT |
|
|---|
|
|
|---|
| Parameter | Value |
|---|
|
SUVsum | 707.54
(10–2,374)a |
|
SUVmax1 | 22.59
(1.12–141)a |
|
SUVmax2 | 10.26
(0–83)a |
|
SUVmax3 | 4.49
(0–38.7)a |
|
SUVmax4 | 2.44
(0–19.1)a |
|
SUVmax≥5 | 1.04
(0–23.40)a |
| Total MTV | 1,205.34
(1.74–9,597.45)a |
|
|
| B, Interim
18FDG PET/CT |
|
|
|
|
Parameter | Value |
|
|
| SUVsum,
median (range) | 8.52
(0–89)a |
| Total MTV | 61.74
(0–1,178)a |
| ΔMTV | −1,143.60
(0–9,552.26)a |
| Decrease in MTV
(%) | 93.64
(0–100)a |
| CR, n (%) | 30
(60)b |
| PR, n (%) | 19
(38)b |
| SD, n (%) | 0 (0)b |
| PD, n (%) | 1 (2)b |
|
|
| C, Final
18FDG PET/CT |
|
|
Parameter | Value |
|
|
|
SUVsum | 4.51
(0–42.94)a |
| Total MTV | 8.47
(0–146.72)a |
| CR | 38
(78)b |
| PR | 5 (10)b |
| SD | 0 (0)b |
| PD | 7 (14)b |
Clinical response
The baseline median MTV was 1,205.34 and 61.74 at
baseline and interim 18F-FDG PET/CT, respectively,
demonstrating a 93.64% decrease in total MTV. The baseline median
SUVmax sum was 707.54 and 8.52 for interim PET/CT
(range, 0–89). The interim 18F-FDG PET/CT scans also
identified CR in 30 (60%), partial response (PR) in 19 cases (38%)
and progressive disease (PD) in 1 case (2%).
At interim 18F-FDG PET/CT 30 patients
exhibited CR and 10 exhibited PR. However, at the end of treatment,
CR was identified in 38 patients, PR was identified in 5 patients
(all of whom had also achieved PR at interim 18F-FDG
PET/CT), and PD was identified in 7 cases (4 with PR, 2 with CR and
1 with PD at interim 18F-FDG PET/CT). Additionally, a
decrease of ≥94% in total MTV in the interim 18F-FDG
PET/CT achieved 86% sensitivity and 50% specificity for the
accurate prediction of CR.
Following bivariate analysis, only 4 factors were
statistically (P<0.05) associated with CR: An ECOG performance
status >2, elevated leukocyte and β2 microglobulin levels, and a
decreased in ΔMTV. Furthermore, all these were included in the
multivariate analysis, which demonstrated that an ECOG performance
status <2, decrease of SUVmax by >94%, the absence
of leukopenia and age <65 were independent prognostic indicators
of CR.
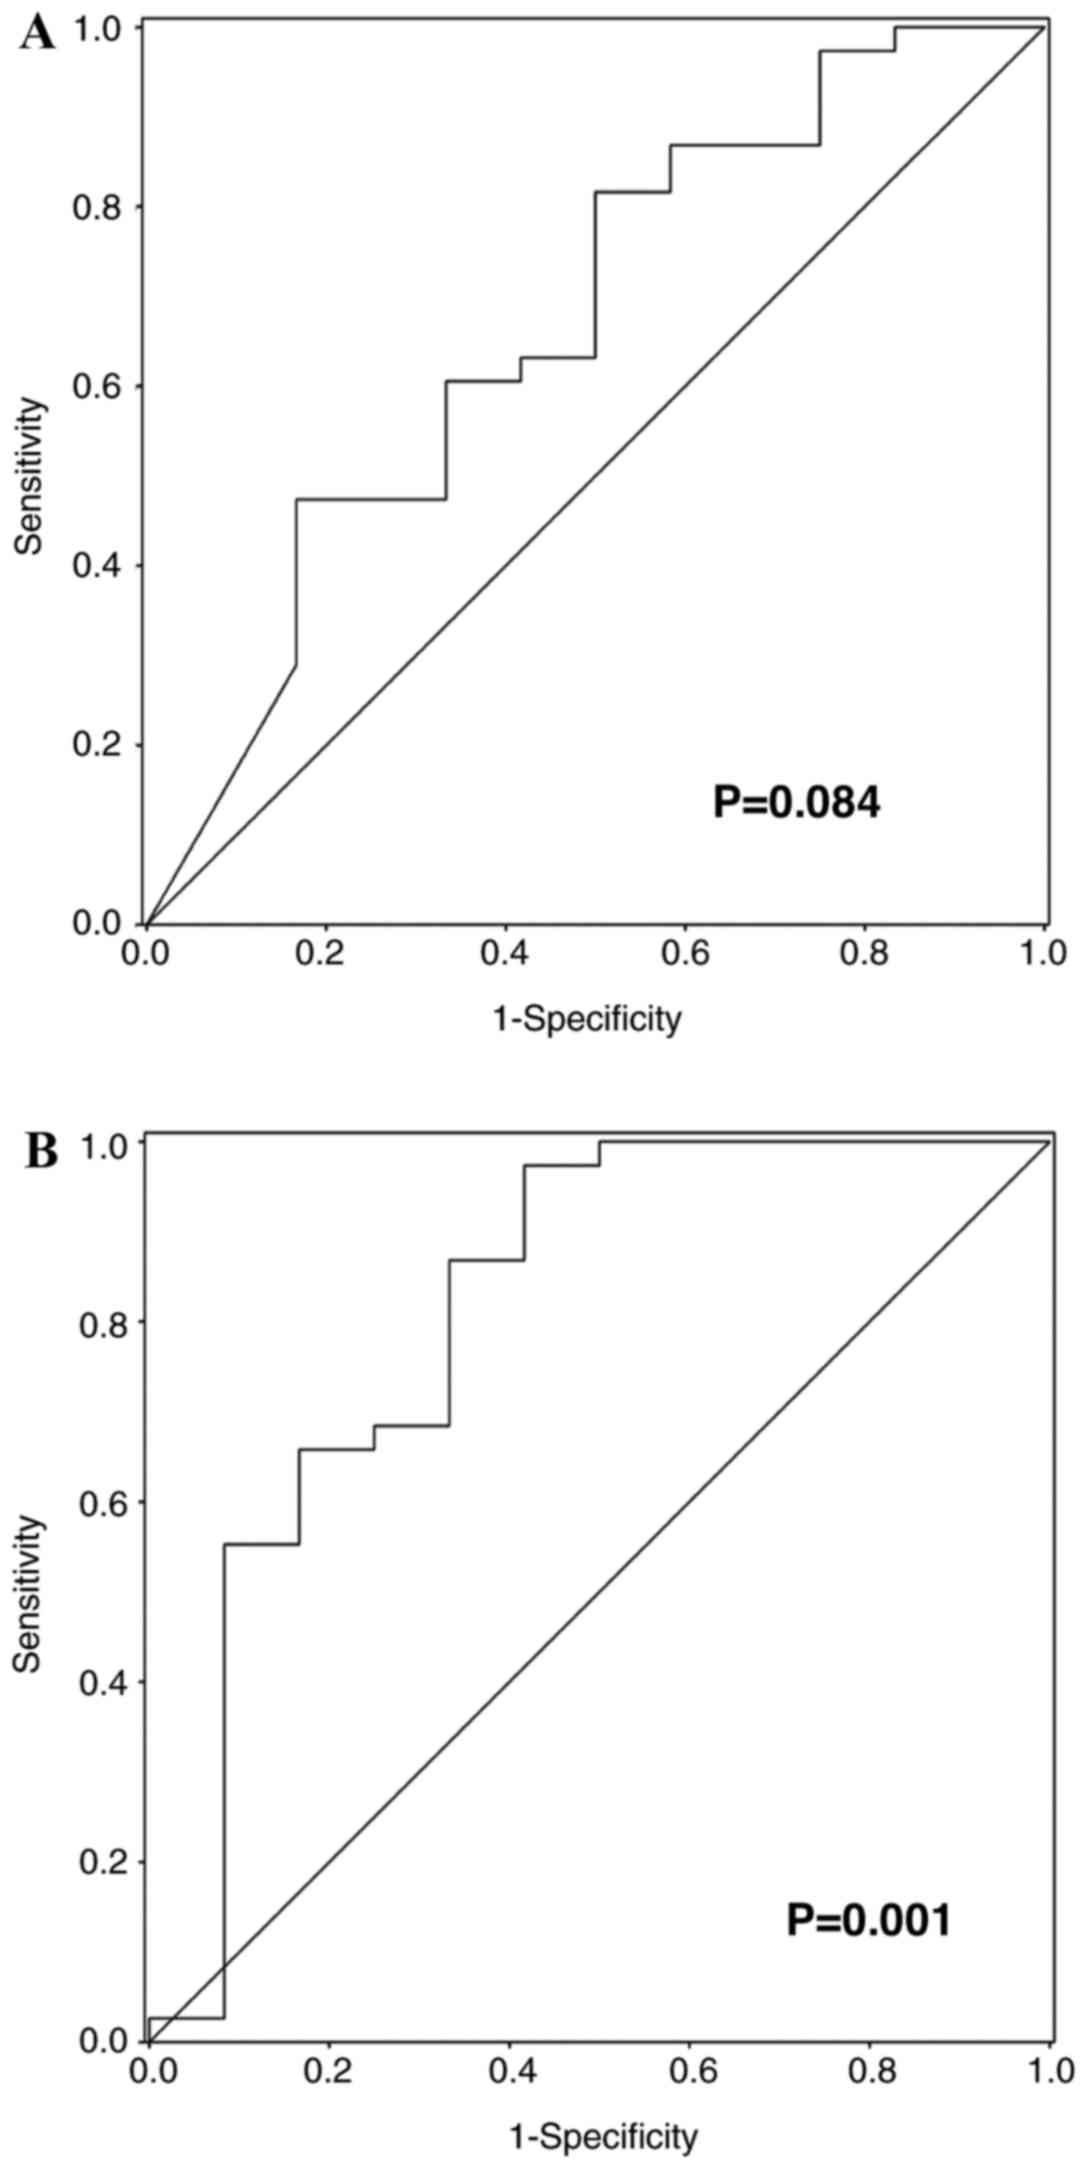
ROC curve analysis examined the ΔMTV between the
baseline and interim 18F-FDG PET/CT scans and observed
its role in predicting CR [Fig. 2A;
area under the ROC curve (AUC), 0.677; P=0.084]. Additionally,
Fig. 2B demonstrates the ROC curve
analysis performed on the prognostic indicators in the prediction
of CR identified by the multivariate analysis (Table III; AUC, 0.814; P=0.001).
| Table III.Analysis of factors associated with
complete response using logistic regression analysis (n=50). |
Table III.
Analysis of factors associated with
complete response using logistic regression analysis (n=50).
|
| Bivariate
analysis | Multivariate
analysis |
|---|
|
|
|
|
|---|
| Factor | OR | 95% CI | P-value | OR | 95% CI | P-value |
|---|
| Age | 1.032 | 0.977–1.091 | 0.257 | 1.082 | 1.001–1.17 | 0.048 |
| Sex | 1.304 | 0.333–5.108 | 0.703 |
|
|
|
| ECOG performance
status ≤2 | 5.83 | 1.084–31.377 | 0.04 | 7.996 | 0.918–69.61 | 0.06 |
| B symptoms | 0.722 | 0.165–3.156 | 0.665 |
|
|
|
| Bulky | 0.37 | 0.087–1.585 | 0.18 |
|
|
|
| Stage | 0.761 | 0.546–1.061 | 0.108 |
|
|
|
| LDH | 0.333 | 0.078–1.426 | 0.138 |
|
|
|
| B2M | 0.217 | 0.051–0.936 | 0.040 |
|
|
|
| Creatinine | 1.526 | 0.052–44.347 | 0.806 |
|
|
|
| Hemoglobin | 1.143 | 0.881–1.482 | 0.314 |
|
|
|
| Leucocyte
count | 1 | 1–1.0001 | 0.022 | 1 | 1.000–1.000 | 0.029 |
| Lymphocyte
count | 1.001 | 1–1.002 | 0.065 |
|
|
|
| Platelet count | 1 | 1–1.0001 | 0.423 |
|
|
|
| IPI | 0.765 | 0.408–1.434 | 0.404 |
|
|
|
| Decrease in total
MTV of ≥94% | 1.055 | 0.986–1.128 | 0.0121 | 1.097 | 1.011–1.192 | 0.027 |
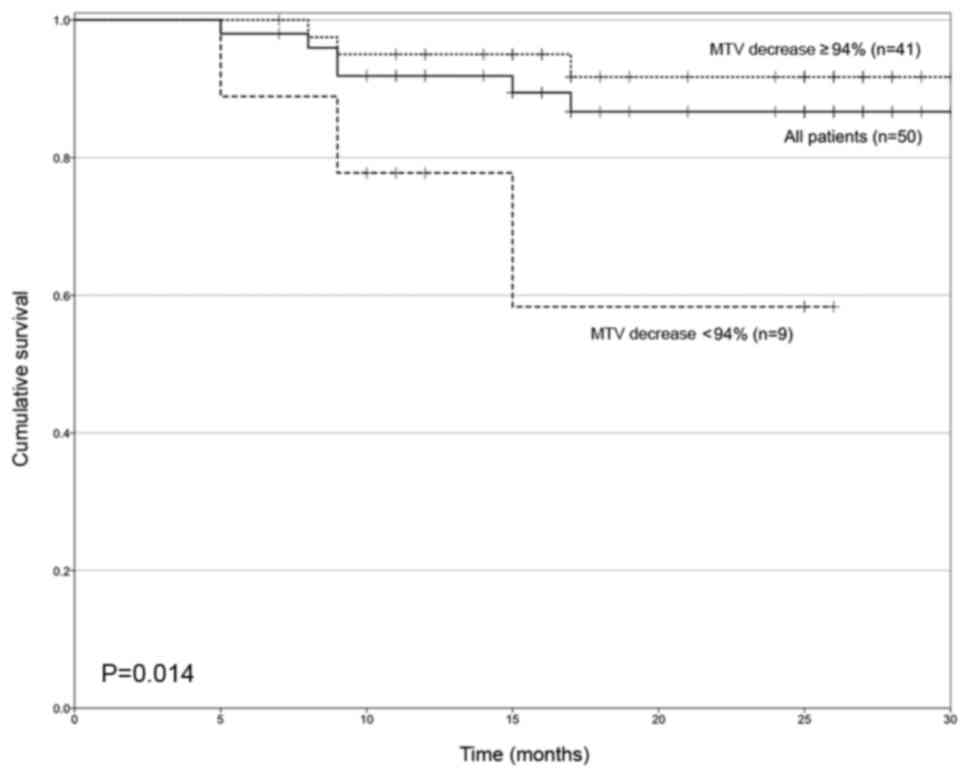
Patient survival
A total of 6 patients (12%) did not survive the
entire study period; 4 succumbed to lymphoma and two succumbed to
febrile neutropenia (following chemotherapy cycles 4 and 6,
respectively). The mean OS and disease-free survival rates were
28.33 months (95% CI, 26.91–29.75) and 25.9 months (95% CI,
23.5–27.2), respectively. Fig. 3
demonstrates the OS curves of patients based on ΔMTV following
interim 18F-FDG PET/CT, using 94% as the cut-off value.
The mean survival times of these groups ≥94 vs. <94% reduction
of MTV) were 29.4 months (95% CI, 27.6–31.1) and 19.6 months (95%
CI, 13.8–25.3), respectively (P=0.014).
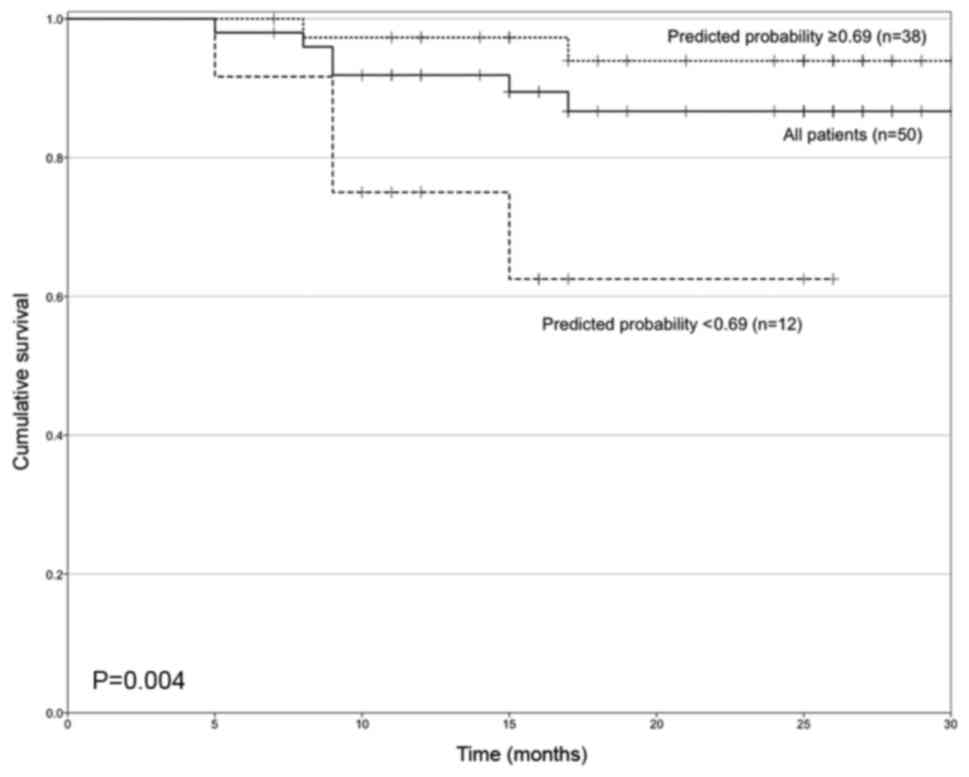
Two groups were defined based on the predicted
probability of recurrence obtained following the final multivariate
model, presented in Table III. A
cut-off value of 0.69 for the estimated probability. The OS curves
for patients depended on this probability value and are presented
in Fig. 4. The median survival times
for these groups were 29.9 months (95% CI, 28.4–31.3) and 20 months
(95% CI, 15.2–24.8), respectively (P=0.004).
Discussion
Current treatment approaches based on disease
staging are not satisfactory for DLBCL, as these systems rely on
data obtained prior to the current staging procedures, including
PET-CT (3). Prognostic factors,
including IPI score, have been evaluated in patients with
high-grade lymphomas since the 1990s (4,5). Despite
the revised IPI identifying three prognostic groups with different
outcomes: Very good [4-year progression-free survival (PFS) 94%,
and OS 94%], good (4-year PFS 80%, OS 79%), and poor (4-year PFS
53%, OS 55%) outcome, respectively (5), this system demonstrates inconsistency
for patients stratified with an intermediate score (10). Therefore, markers that identify an
early treatment failure are required for patients with DLBCL, in
order to allow them to access novel treatment modalities. The role
of 18F-FDG PET/CT in the diagnosis and the determination
of treatment efficacy in patients with DLBCL as a highly sensitive
method to diagnostic lymphoproliferative activity has been clearly
defined (2,11). However, the extent of
18F-FDG PET/CT and whether a standardized definition of
interim 18F-FDG PET/CT (SUVmax,
SUVmax-liver, MTV or other parameters that may improve
the utility of this tool) require further investigation (12). A qualitative three-point scoring (PS)
system and qualitative 5-PS methods, which designated lesions as
positive or negative, without a measure, were initially proposed
for assessment of CR (12). Since
then, other studies have proposed semi-quantitative methods, either
alone or in combination with clinical parameters, as prognostic
factors for the prediction of patient survival (13–20). Among
the 18F-FDG PET/CT parameters, ΔSUVmax
between baseline and interim 18F-FDG PET/CT scans is the
most commonly used semi-quantitative index for 18FDG
uptake. This validated measurement is confined to the detection of
the most hyper-metabolic tumor activity at a single site. In
contrast, the MTV and total lesion glycolysis reflect tumor
energetic turnover (13,15,20). The
present study evaluated the association between SUVmax
and total MTV for the assessment of CR in patients with DLBCL.
In the present study, a multivariate model was used
to identify patients who may not achieve CR at the end of
treatment. This model comprised various factors, including the IPI,
and the ΔMTV between the baseline and interim 18F-FDG
PET/CT scans.
In a prospective trial, Fuertes et al
(13) concluded that an optimal
ΔSUVmax cut-off value that was able to predict PFS and
OS in patients with DLBCL was 76% (95% CI, 62.7–89.2) and 75% (95%
CI, 54.6–95.4), respectively. The study also estimated that the
5-year PFS and OS rates were 78 and 92%, respectively, in patients
with an interim 18F-FDG PET/CT scan, demonstrating
uptake that was not greater compared with that of the liver. These
rates were significantly higher compared with the 50% (for OS and
PFS) in patients with uptake greater compared with that of the
liver (20). In the present study,
two groups were defined with 95 and 60% OS rates at 30 months, with
the cut-off point of a decrease in MTV of ≥94%. Safer et al
(18) observed similar OS rates of 88
and 62% at 3 years in patients with interim 18F-FDG
PET/CT scans negative and positive for cancer, respectively.
Recently, Kwon et al (21)
revealed that calculating SUVmax-SUVin liver
and using a cut-off value of 1.6 created two groups; those
considered as non-responders exhibited a 3-year OS rate of 33%
compared with 86% in patients who responded to therapy, at the same
follow-up (21). In this
aforementioned study, interim 18F-FDG PET/CT scans were
performed following two cycles of treatment, in contrast with the
present study in which scans were performed following three cycles.
Therefore, it is not possible to draw a reliable comparison between
the two trials.
Regarding the combination of clinical parameters
with 18F-FDG PET/CT results, Kwon et al (21) concluded that the IPI score was able to
predict the PFS of patients with an interim 18F-FDG PET
scan negative for cancer. Among these patients, those in the high
IPI group (4–5 points) were predicted to achieve a 20% PFS rate at
100 months. In the present study, only two cases with a CR at
interim 18F-FDG PET/CT experienced a relapse, one with a
high IPI score (4–5 points) and the other with a low-intermediate
IPI score (2 points).
In contrast with the results of a study undertaken
by Gallicchio et al (15),
which reported that SUVmax and LDH levels were
parameters capable of predicting response in patients with DLBCL,
SUVmax and LDH levels were not prognostic factors in the
present study, but a decrease in total MTV constituted a prognostic
factor influencing OS, as demonstrated in Fig. 3 and Table
III.
To the best of our knowledge, previous studies have
not reported a prognostic role of metabolic parameters evaluated by
interim 18F-FDG PET/CT scans in patients with DLBCL
(21–24). However, patients with higher
SUVmax and SUVsum values at interim
18F-FDG PET/CT exhibited a poorer PFS and OS, as
demonstrated by Park et al (7). A meta-analysis identified a sensitivity
of 0.78 and a specificity of 0.87 for interim 18F-FDG
PET/CT scans in patients with DLBCL (25). However, there were limitations to this
meta-analysis given that it included patients from 6 studies who
were treated with a variety of regimens with and without rituximab,
radiation and stem cell transplantation. In addition,
18F-FDG PET/CT scans were performed following 2, 3 or 4
cycles of therapy. The heterogeneity of these populations prevented
a reliable conclusion from being drawn. Although 18F-FDG
PET/CT is currently an essential part of the management of patients
with lymphoma, including Hodgkin's lymphoma, and has improved
patient outcome by reducing the requirement for chemotherapy and
selective radiotherapy (25), in
aggressive NHL, particularly DLBCL, the role of interim
18F-FDG PET/CT remains inconclusive. The low positive
prognostic value of this approach may the result of false-positive
18F-FDG PET/CT results associated with residual activity
due to inflammatory changes within the tumor bed secondary to
immunochemotherapy (26).
The present study included patients from a single
center, which explains the relatively small sample size. However,
the present study comprised a homogeneous population who received
standard immunochemotherapy over the same time period, and
baseline, interim and final 18F-FDG PET/CT
interpretations.
To conclude, the assessment of quantitative
parameters from interim 18F-FDG PET/CT scans combined
with clinical variables led to the generation of a model with four
variables (an ECOG performance status of <2, a decrease in total
MTV of >94%, the absence of leukopenia and age <65 years),
which predicted CR at the end of treatment. The presence of these
parameters also impacted the OS time of patients with DLBCL.
Acknowledgements
Not applicable.
Competing interests
The authors declare that they have no competing
interests.
References
|
1
|
Ferlay J, Soerjomataram I and Ervik M:
GLOBOCAN 2012 v1.0, Cancer Incidence and Mortality Worldwide: IARC
Cancer Base No. 11. International Agency for Research on Cancer.
Lyon, France; 2013
|
|
2
|
Zelenetz AD, Gordon LI, Wierda WG,
Abramson JS, Advani RH, Andreadis CB, Bartlett N, Byrd JC, Czuczman
MS, Fayad LE, et al: Non-Hodgkin's lymphomas, version 4.2014. J
Natl Compr Canc Netw. 12:1282–1303. 2014. View Article : Google Scholar : PubMed/NCBI
|
|
3
|
Candelaria M: Advances in diagnosis and
control of lymphomas. Salud Publica Mex. 58:296–301. 2016.
View Article : Google Scholar : PubMed/NCBI
|
|
4
|
International Non-Hodgkin's Lymphoma
Prognostic Factors Project: A predictive model for aggressive
non-Hodgkin's Lymphoma. N Engl J Med. 329:987–994. 1993. View Article : Google Scholar : PubMed/NCBI
|
|
5
|
Sehn LH, Berry B, Chhanabhai M, Fitzgerald
C, Gill K, Hoskins P, Klasa R, Savage KJ, Shenkier T, Sutherland J,
et al: The revised international prognostic index (R-IPI) is a
better predictor of outcome than the standard IPI for patients with
diffuse large B-cell lymphoma treated with R-CHOP. Blood.
109:1857–1861. 2007. View Article : Google Scholar : PubMed/NCBI
|
|
6
|
Cheson BD, Pfistner B, Juweid ME, Gascoyne
RD, Specht L, Horning SJ, Coiffier B, Fisher RI, Hagenbeek A, Zucca
E, et al: Revised response criteria for malignant lymphoma. J Clin
Oncol. 25:579–586. 2007. View Article : Google Scholar : PubMed/NCBI
|
|
7
|
Park S, Moon SH, Park LC, Hwang DW, Ji JH,
Maeng CH, Cho SH, Ahn HK, Lee JY, Kim SJ, et al: The impact of
baseline and interim PET/CT parameters on clinical outcome in
patients with diffuse large B cell lymphoma. Am J Hematol.
87:937–940. 2012. View Article : Google Scholar : PubMed/NCBI
|
|
8
|
Oken MM, Creech RH, Tormey DC, Horton J,
Davis TE, McFadden ET and Carbone PP: Toxicity and response
criteria of the Eastern Cooperative Oncology Group. Am J Clin
Oncol. 5:649–655. 1982. View Article : Google Scholar : PubMed/NCBI
|
|
9
|
Cheson BD, Fisher RI, Barrington SF,
Cavalli F, Schwartz LH, Zucca E, Lister TA; Alliance, Australasian
Leukaemia and Lymphoma Group; Eastern Cooperative Oncology Group;
European Mantle Cell Lymphoma Consortium; et al: Recommendations
for initial evaluation, staging, and response assessment of Hodgkin
and non-Hodgkin lymphoma: The Lugano classification. J Clin Oncol.
32:3059–3068. 2014. View Article : Google Scholar : PubMed/NCBI
|
|
10
|
Olszewski AJ, Winer ES and Castillo JJ:
Validation of clinical prognostic indices for diffuse large B-cell
lymphoma in the National Cancer Data Base. Cancer Causes Control.
26:1163–1172. 2015. View Article : Google Scholar : PubMed/NCBI
|
|
11
|
Meignan M, Gallamini A, Meignan M,
Gallamini A and Haioun C: Report of the first international
workshop on interim-PET-Scan in lymphoma. Leuk Lymphoma.
50:1257–1260. 2009. View Article : Google Scholar : PubMed/NCBI
|
|
12
|
Juweid ME, Stroobants S, Hoekstra OS,
Mottaghy FM, Dietlein M, Guermazi A, Wiseman GA, Kostakoglu L,
Scheidhauer K, Buck A, et al: Use of positron emission tomography
for response assessment of lymphoma: Consensus of the imaging
subcommittee of international harmonization project in lymphoma. J
Clin Oncol. 25:571–578. 2007. View Article : Google Scholar : PubMed/NCBI
|
|
13
|
Fuertes S, Setoain X, Lopez-Guillermo A,
Carrasco JL, Rodríguez S, Rovira J and Pons F: Interim FDG PET/CT
as a prognostic factor in diffuse large B-cell lymphoma. Eur J Nucl
Med Mol Imaging. 40:496–504. 2013. View Article : Google Scholar : PubMed/NCBI
|
|
14
|
Yang DH, Ahn JS, Byun BH, Min JJ, Kweon
SS, Chae YS, Sohn SK, Lee SW, Kim HW, Jung SH, et al: Interim
PET/CT-based prognostic model for the treatment of diffuse large
B-cell lymphoma in the post-rituximab era. Ann Hematol. 92:471–479.
2013. View Article : Google Scholar : PubMed/NCBI
|
|
15
|
Gallicchio R, Mansueto G, Simeon V,
Nardelli A, Guariglia R, Capacchione D, Soscia E, Pedicini P,
Gattozzi D, Musto P and Storto G: F-18 FDG PET/CT quantization
parameters as predictors of outcome in patients with diffuse large
B-cell lymphoma. Eur J Haematol. 92:382–389. 2014. View Article : Google Scholar : PubMed/NCBI
|
|
16
|
Itti E, Lin C, Dupuis J, Paone G,
Capacchione D, Rahmouni A, Haioun C and Meignan M: Prognostic value
of interim 18-FDG PET in patients with diffuse large B-cell
lymphoma: SUV-based assessment at 4 cycles of chemotherapy. J Nucl
Med. 50:527–533. 2009. View Article : Google Scholar : PubMed/NCBI
|
|
17
|
Dührsen U, Hüttmann A, Jöckel KH and
Müller S: Positron emission tomography guided therapy of aggressive
non-Hodgkin lymphoma- the PETAL trial. Leuk Lymphoma. 50:1757–1760.
2009. View Article : Google Scholar : PubMed/NCBI
|
|
18
|
Safer V, Dupus J, Itti E, Jardin F,
Fruchart C, Bardet S, Véra P, Copie-Bergman C, Rahmouni A, Tilly H,
et al: Interim [18F]Fluorodeoxyglucose positron emission tomography
scan in diffuse large B-cell lymphoma treated with
anthracycline-based chemotherapy plus rituximab. J Clin Oncol.
30:184–190. 2012. View Article : Google Scholar : PubMed/NCBI
|
|
19
|
Moskowitz CH, Schöder H, Teruya-Feldstein
J, Sima C, Iasonos A, Portlock CS, Straus D, Noy A, Palomba ML,
O'Connor OA, et al: Risk adapted dose-dense immunochemotherapy
determined by interim FDG-PET in advanced-stage diffuse large
B-cell lymphoma. J Clin Oncol. 28:1896–1903. 2010. View Article : Google Scholar : PubMed/NCBI
|
|
20
|
Itti E, Juweid ME, Haioiun C, Yedes I,
Hamza-Maaloul F, El Bez I, Evangelista E, Lin C, Dupuis J and
Meignan M: Improvement of early 18F-FDG PET interpretation in
diffuse large B-cell lymphoma: Importance of the reference
background. J Nucl Med. 51:1857–62. 2010. View Article : Google Scholar : PubMed/NCBI
|
|
21
|
Kwon SH, Kang DR, Kim J, Yoon JK, Lee SJ,
Jeong SH, Lee HW and An YS: Prognostic value of negative interim
2-[18F]-fluoro-2-deoxy-d-glucose PET/CT in diffuse large B-cell
lymphoma. Clin Radiol. 71:280–286. 2016. View Article : Google Scholar : PubMed/NCBI
|
|
22
|
Cox MC, Ambrogi V, Lanni V, Cavalieri E,
Pelliccia S, Scopinaro F, Monarca B, Marchetti P and Spiriti MA:
Use of interim [18F] fluorodeoxyglucose-positron emission
tomography is not justified in diffuse large B-cell lymphoma during
first-line immunochemotherapy. Leuk Lymphoma. 53:263–269. 2012.
View Article : Google Scholar : PubMed/NCBI
|
|
23
|
Cashen AF, Dehdashti F, Luo J, Homb A,
Siegel BA and Bartlett NL: 18F-FDG PET/CT for early response
assessment in diffuse large-B cell lymphoma: Poor predictive value
of international harmonization project interpretation. J Nucl Med.
52:386–392. 2011. View Article : Google Scholar : PubMed/NCBI
|
|
24
|
Teresawa T, Lau J, Bardet S, Couturier O,
Hotta T, Hutchings M, Nihashi T and Nagai H:
Fluorine-18-fluorodeoxyglucose positrón emission tomography for
interim response assessment of advance-stage Hodgkin lymphoma and
diffusse large B-cell lymphoma: A systematic review. J Clin Oncol.
27:1906–1914. 2009. View Article : Google Scholar : PubMed/NCBI
|
|
25
|
Spaepen K, Stroobants S, Dupont P, Bormans
G, Balzarini J, Verhoef G, Mortelmans L, Vandenberghe P and de
Wolf-Peeters C: [18]FDG PET monitoring of tumor response to
chemotherapy: [(18)F]FDG uptake correlate with the viable tumor
cell fraction? Eur J Nucl Med Mol Imaging. 30:682–688. 2003.
View Article : Google Scholar : PubMed/NCBI
|
|
26
|
Barrington SF and Johnson PWM: FDG-PET CT
in lymphoma: Has imaging-directed personalized medicine become a
reality? J Nucl Med. 58:1539–1544. 2017. View Article : Google Scholar : PubMed/NCBI
|