Introduction
MGMT promoter methylation is associated with
a favorable outcome after temozolomide chemotherapy in patients
with newly diagnosed glioblastoma (1). Furthermore, temozolomide rechallenge is
a treatment option for recurrent MGMT promoter-methylated
glioblastoma (2). Evaluation of
MGMT methylation status is thus important for treatment of
primary and recurrent glioma.
Gliomas are genetically and histopathologically
heterogeneous (3–5). A previous study has demonstrated
intratumoral heterogeneity in MGMT promoter methylation
status (6). Therefore, it is doubtful
that a single biopsy specimen can represent the molecular landscape
of the entire tumor.
MGMT promoter methylation status can change
between the first surgery for newly diagnosed glioblastoma and a
second surgery for recurrent disease (7,8). The
development of reduced methylation in the MGMT promoter
leads to acquired therapeutic resistance after temozolomide
treatment in glioblastomas (9).
Re-evaluation of MGMT promoter methylation status at the
time of recurrence is therefore important for selecting
treatment.
Attempts to assess gene mutations non-invasively by
imaging technology have been conducted in the past, but there are
few reports on image evaluation of glioma-related gene mutations
(10–15). However, among these,
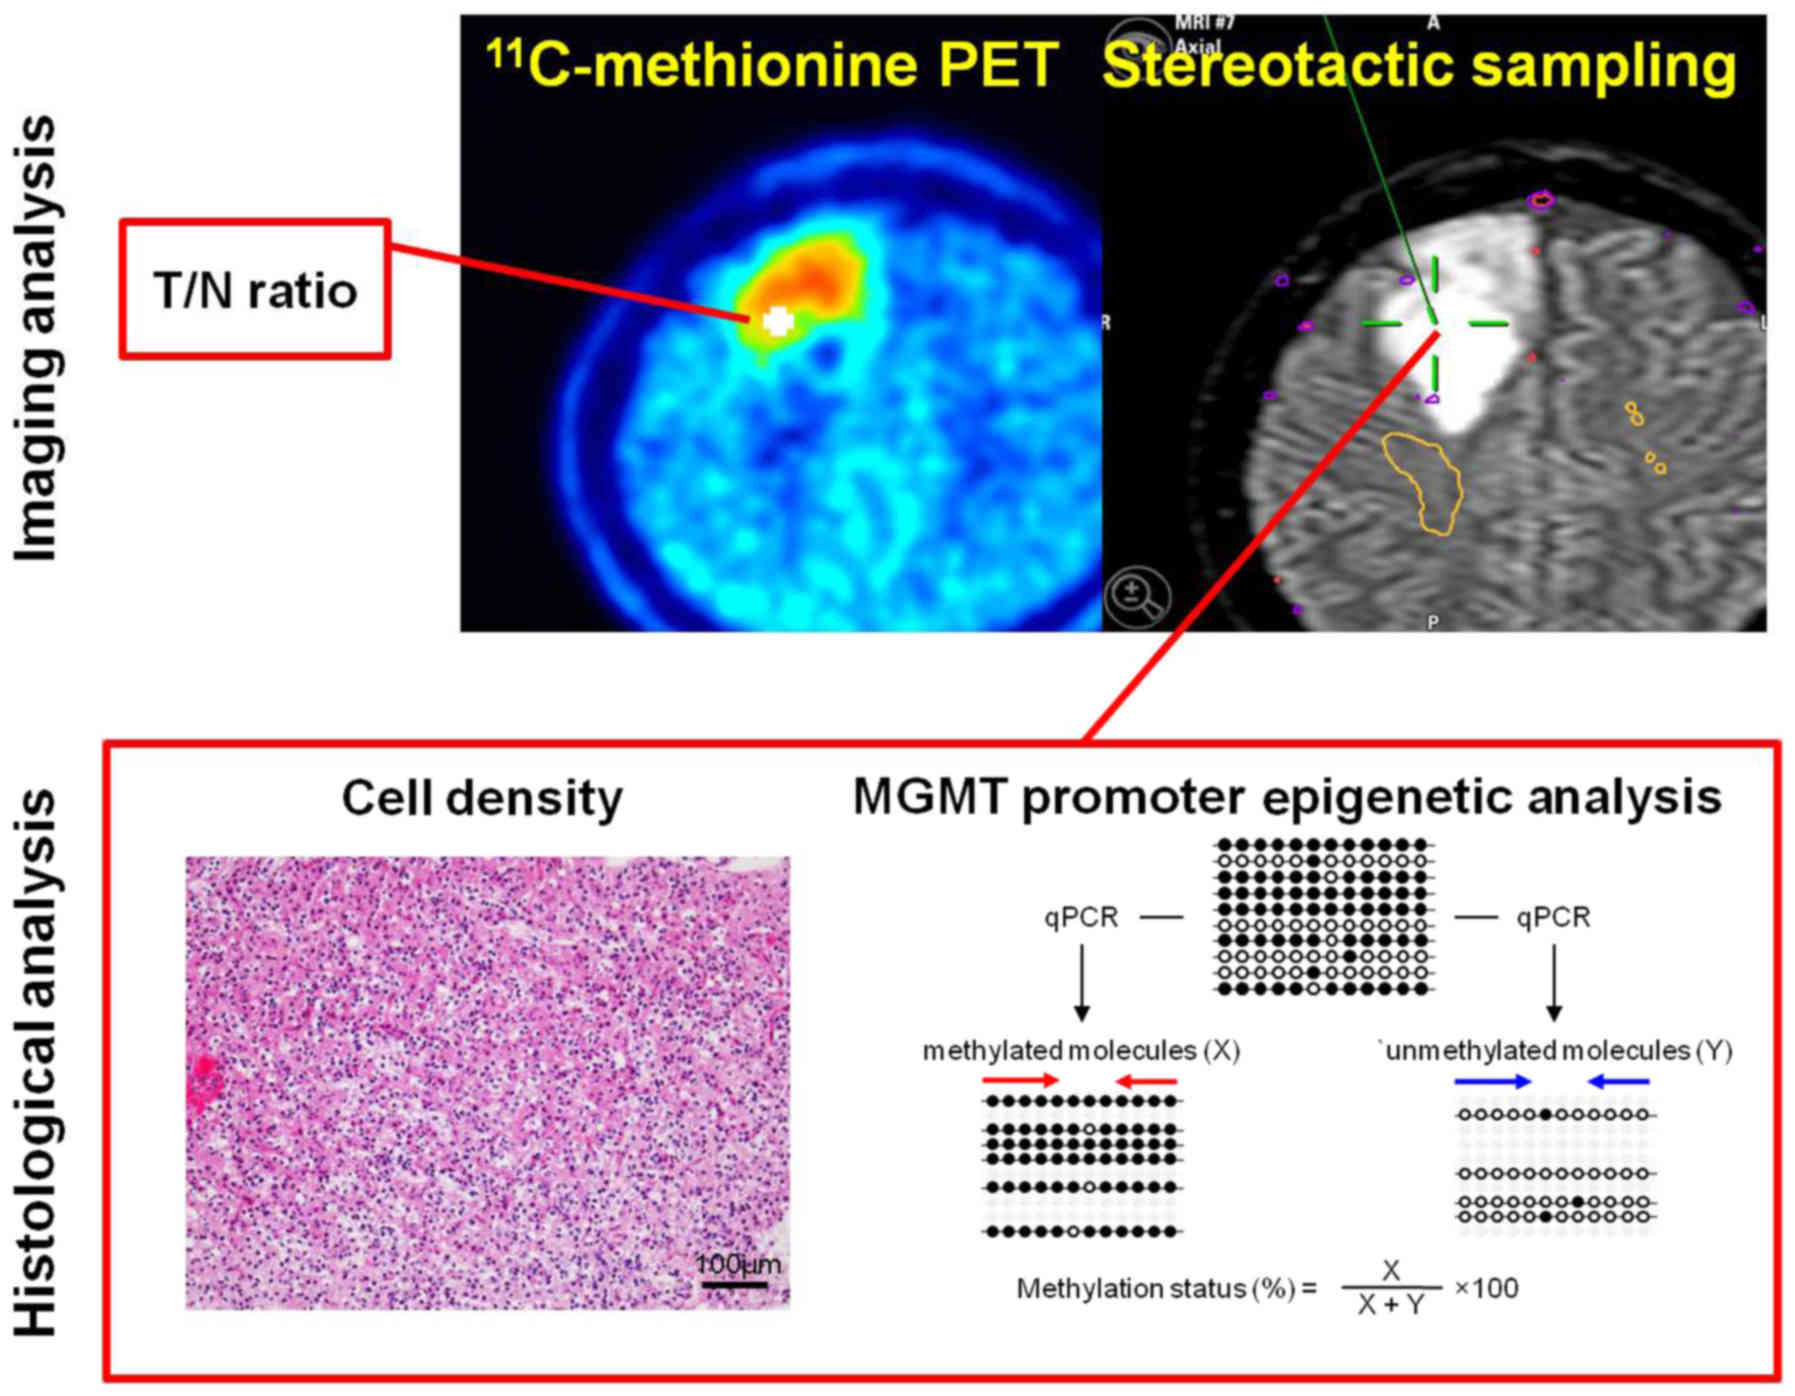
11C-methionine positron-emission tomography
(11C-methionine PET) has been proven to be a useful tool
for detecting MGMT promoter methylation in non-enhancing
glioma (12). Nevertheless, given the
heterogeneity of MGMT promoter methylation status in
gliomas, a non-stereotactic comparison of MGMT promoter
methylation and 11C-methionine uptake in PET images may
not be accurate.
In this study, the correlation between
11C-methionine PET and MGMT promoter methylation
status in non-enhancing gliomas was stereotactically verified.
Materials and methods
Subjects and glioma tumor samples
The present study was performed in accordance with
the principles of the Helsinki Declaration, and approval for this
study was obtained from the ethical committee of Osaka National
Hospital (no. 94, IRB no. 0713). All patients provided written
informed consent.
Clinical data were collected from 9 patients with
newly diagnosed glioma, who underwent both magnetic resonance
imaging (MRI) and 11C-methionine PET as part of their
pre-surgical examination, from 2014 to 2017. Clinical data were
also collected from 3 of 9 patients with newly diagnosed glioma
during surgery for recurrent disease. Recurrent cases received
chemotherapy or chemoradiotherapy prior to
11C-methionine PET examination. Tumor tissue specimens
were also obtained from each patient. Multiple tissue sites were
stereotactically sampled, and each sample was evenly divided. One
part of each sample was subjected to pathological examination and
the other was subjected to MGMT methylation status
analysis.
Histopathological analysis
A subset of the tumor samples was fixed in 10%
formalin and embedded in paraffin wax following standard
procedures. In each case, hematoxylin and eosin (H&E)-stained
sections were examined to classify the tumors according to the
World Health Organization (WHO) International Histological
Classification of Tumors. Cell counting was performed under a light
microscope (Olympus Corporation, Tokyo, Japan; ×200 magnification)
and data were recorded as the mean of 3 different locations within
the specimen according to the method used in our previous study
(16).
Genomic DNA Extraction
Tumor samples were immediately frozen in liquid
nitrogen and stored at −80°C. Genomic DNA was extracted using the
DNeasy Blood and Tissue kit (Qiagen, Inc., Valencia, CA, USA),
according to the manufacturer's protocol (12).
MGMT Promoter Methylation
Analysis
MGMT promoter methylation status was
determined by quantitative methylation-specific PCR (qMSP) as
described in our previous study (12). DNA extracted from tumor tissue was
subjected to bisulfite modification by an EZ DNA Methylation-Gold
kit (Zymo Research Corp., Irvine, CA, USA), according to the
manufacturer's instructions. Bisulfite-modified DNA was analyzed by
qMSP using the QuantStudio™ 12K Flex Real-Time PCR System (Thermo
Fisher Scientific, Inc., Waltham, MA, USA) with POWER
SYBR® Green PCR Master Mix (Thermo Fisher Scientific,
Inc.). Methylated and unmethylated DNA molecules were amplified
separately using specific primers (17). Quantification of methylated and
unmethylated sequences was performed by employing the standard
curve method, using serial dilutions of bisulfite-modified
EpiScope® Methylated HCT116 gDNA (Takara Bio, Inc.,
Shiga, Japan), which is highly methylated by CpG methylase, and
EpiScope® Unmethylated HCT116 DKO gDNA (Takara Bio,
Inc.), obtained from cells that genetically lack both DNA
methyltransferase 1 and DNA methyltransferase 3B. The percentages
of methylation and standard deviations (S.D.) were calculated from
triplicate PCRs.
11C-methionine PET
PET images were obtained using a SET-3000 GCT/X
scanner (Shimadzu Corp., Kyoto, Japan) with gadolinium
oxyorthosilicate crystals as emission detectors. The
11C-methionine tracer was synthesized in accordance with
the method described by Berger et al (18) and injected intravenously at a dose of
111-222 mBq (3–6 mCi). Tracer accumulation was recorded over 15 min
in 99 transaxial slices, spanning the entire brain. The summed
activity at 20-35 min after tracer injection was used for image
reconstruction. Images were stored in 256×256×99 anisotropic
voxels, with a voxel size of 1×1×2.6 mm. The tumor/normal tissue
(T/N) ratios were calculated stereotactically by dividing the
standard uptake value (SUV) for the tumor by the SUV of the
contralateral lesion in the same way as in our previous study
(16).
Magnetic resonance imaging
All patients were studied using a 1.5 T whole-body
MR system (Achieva; Philips Healthcare, Amsterdam, The Netherlands)
within a week before the operation. T1-weighted imaging with
gadolinium enhancement was used to select patients with
non-enhancing gliomas. T2-weighted (T2) or FLAIR images were
acquired in all cases for delineation of tumors.
Image fusion and registration
We used the Brainlab VectorVision compact
neuronavigation system (Brainlab, Munich, Germany). This
neuronavigation system is composed of a surgical planning
workstation with software tools for coregistration of multimodal
image sets. The PET image was registered on fluid-attenuated
inversion recovery (FLAIR) standard anatomical MRI images using the
Brainlab VectorVision compact neuronavigation system. These
registered images were transferred to the navigation system for
stereotactic surgery.
Surgery for stereotactic multiple
sampling evaluation
We used a stereotactic multiple sampling evaluation
for gliomas as previously described (16). The location for tumor biopsy was
preoperatively determined on FLAIR images and
11C-methionine PET. 3D gapless FLAIR images and PET
data, co-registered beforehand, were transferred to the Brainlab
VectorVision compact neuronavigation system and the biopsy target
for histopathological examination was planned (Fig. 1). Standard craniotomy was performed
under general anesthesia. Multiple sampling biopsy was performed in
non-enhancing tumor lesions targeted for resection by inserting a
catheter, aimed at the target, immediately after craniotomy, in
order to minimize the error caused by brain shifting. Although
multiple tissue sampling was performed in some cases, real-time
navigation was performed to confirm the position of each biopsy
site within the tumor.
Statistical analysis
All data are presented as the mean value unless
otherwise stated. Statistical analysis was performed using JMP
version 8 (SAS Institute, Inc., Cary, NC, USA). A linear regression
model, using the method for least squares, was used for modeling 2
or 3 independent variables. A P-value of <0.05 was considered
statistically significant.
Results
Patient characteristics
Detailed information on the 9 investigated patients
is listed in Table I. Tissue
specimens at 31 sampling sites were stereotactically obtained using
an intraoperative neuronavigation system. All patients had
non-enhancing lesions on MRI.
 | Table I.Caracteristics of patients with
non-enhancing glioma. |
Table I.
Caracteristics of patients with
non-enhancing glioma.
| Patient no. | Age (years) | Sex | Histologic
diagnosis | Primary or
recurrent | Treatment before
operation | Localization | No. of
specimens | T/N ratio | MGMT methylation
(%) | MGMT methylation
status (M: ≥3%, U:<3%) |
|---|
| 1–1 | 57 | F | Diffuse
astrocytoma | Primary | None | R frontal | 1 | 1.19 | 48.48 | M |
|
|
|
|
|
|
|
| 2 | 1.33 | 46.51 | M |
|
|
|
|
|
|
|
| 3 | 1.32 | 17.5 | M |
| 1–2 | 59 | F | Glioblastoma | First
recurrent | TMZ | L frontal | 1 | 1.11 | 2.77 | U |
|
|
|
|
|
|
|
| 2 | 1.45 | 12.91 | M |
| 2–1 | 79 | M | Diffuse
astrocytoma | Primary | None | R parietal | 1 | 1.24 | 0.06 | U |
|
|
|
|
|
|
|
| 2 | 1.06 | 0.03 | U |
|
|
|
|
|
|
|
| 3 | 2.23 | 0.17 | U |
| 2–2 | 81 | M | Anaplastic
astrocytoma | First
recurrent | TMZ | R temporal | 1 | 0.96 | 0.38 | U |
|
|
|
|
|
|
|
| 2 | 1.49 | 0.24 | U |
| 2–3 | 81 | M | Anaplastic
astrocytoma | Second
recurrent | RT + TMZ | L parietal | 1 | 1.82 | 0.24 | U |
|
|
|
|
|
|
|
| 2 | 1.52 | 0.2 | U |
| 3 | 66 | M |
Oligodendroglioma | Primary | None | L frontal | 1 | 1.01 | 19.77 | M |
|
|
|
|
|
|
|
| 2 | 1.34 | 8.16 | M |
| 4 | 43 | M |
Oligodendroglioma | Primary | None | L frontal | 1 | 1.38 | 2.56 | U |
|
|
|
|
|
|
|
| 2 | 1.22 | 2.29 | U |
|
|
|
|
|
|
|
| 3 | 1.29 | 2.61 | U |
| 5–1 | 46 | F |
Oligodendroglioma | Primary | None | R frontal | 1 | 1.96 | 47.93 | M |
|
|
|
|
|
|
|
| 2 | 2.45 | 84.67 | M |
| 5–2 | 42 | F | Anaplastic
oligodendroglioma | First
recurrent | TMZ | R frontal | 1 | 1.08 | 0.32 | U |
|
|
|
|
|
|
|
| 2 | 0.59 | 1.34 | U |
|
|
|
|
|
|
|
| 3 | 2.03 | 0.62 | U |
| 6 | 31 | F | Anaplastic
astrocytoma | Primary | None | R frontal | 1 | 1.03 | 1.6 | U |
|
|
|
|
|
|
|
| 2 | 1.39 | 4.75 | M |
|
|
|
|
|
|
|
| 3 | 0.95 | 1.39 | U |
| 7 | 38 | M | Anaplastic
astrocytoma | Primary | None | L frontal | 1 | 1.56 | 0.14 | U |
|
|
|
|
|
|
|
| 2 | 1.42 | 0.21 | U |
|
|
|
|
|
|
|
| 3 | 0.73 | 0.23 | U |
| 8 | 58 | F | Glioblastoma | Primary | None | L temporal | 1 | 1.25 | 0.21 | U |
| 9 | 50 | M | Glioblastoma | Primary | None | R occipital | 1 | 1.17 | 0.2 | U |
|
|
|
|
|
|
|
| 2 | 1.16 | 0.33 | U |
Intratumoral heterogeneity in MGMT
promoter methylation status
In our previous report, we evaluated the correlation
between T/N ratio and MGMT methylation in a non-stereotactic
manner, and found that a threshold T/N ratio value of 1.6
significantly correlated with a quantitative threshold MGMT
methylation status of 3% (12). Using
a positive methylation assay threshold of 3, 22.2% (2 of 9) of
cases in this study demonstrated intratumoral heterogeneity in
terms of methylation levels, with the percentage of methylation
varying up to 4.66-fold for each case (Table I).
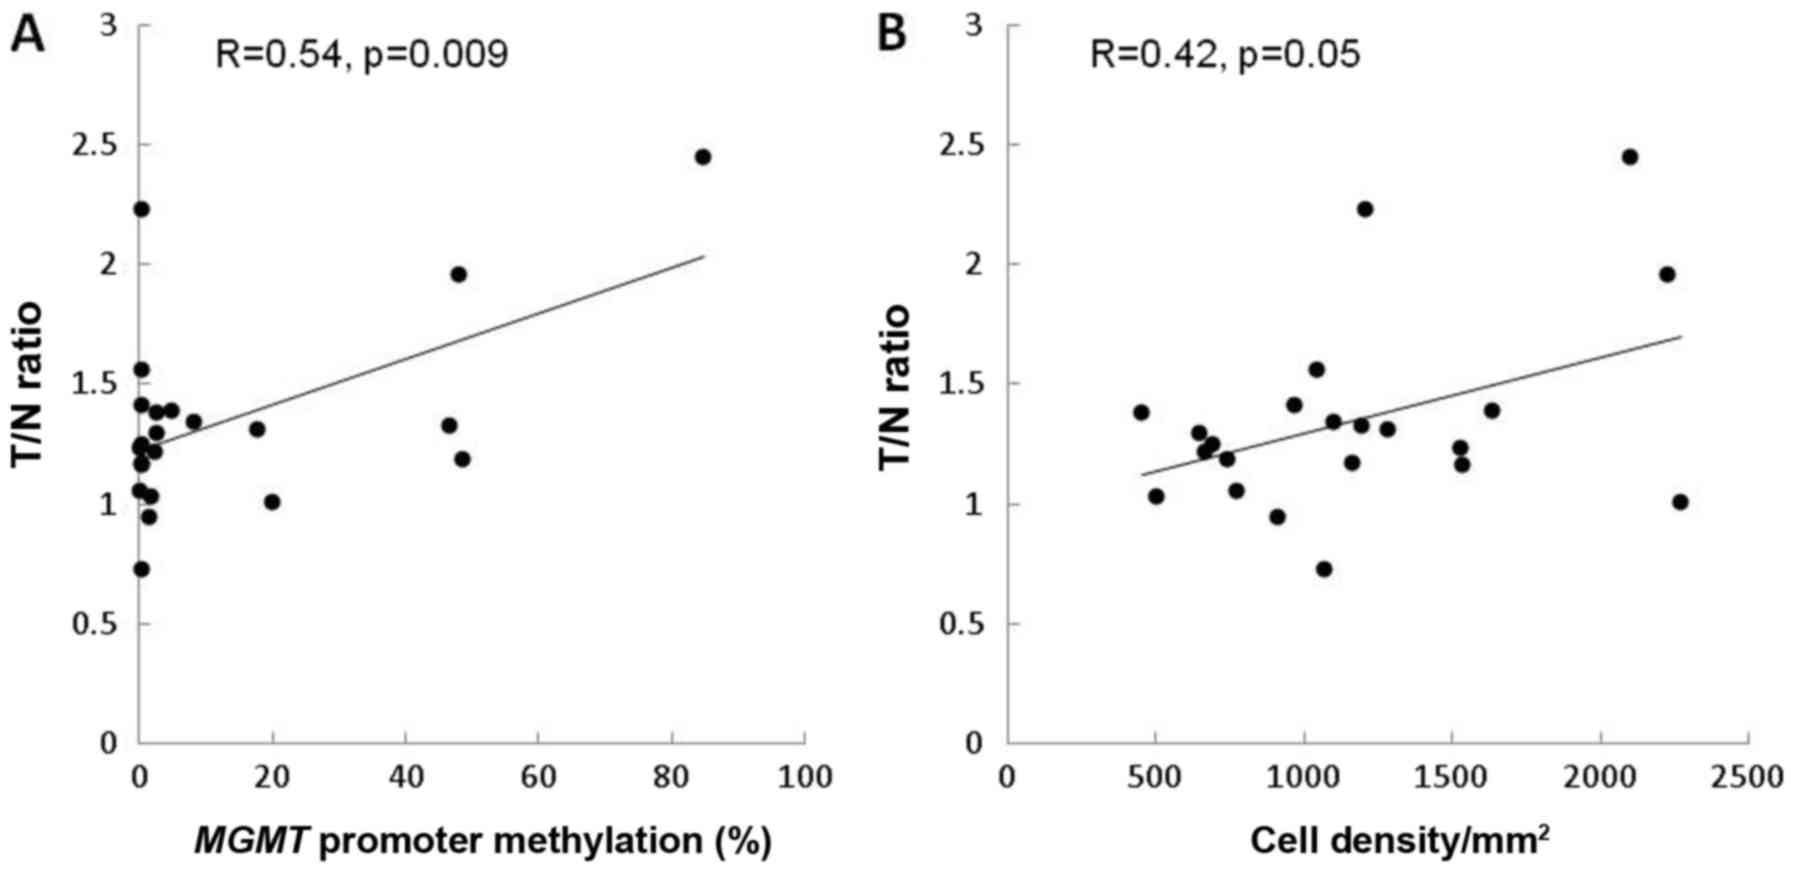
Correlation of PET T/N 11C-methionine
ratio with MGMT methylation and cell density in stereotactic
image-based histological comparisons. In newly diagnosed cases, the
T/N ratio correlated positively with MGMT methylation (R=0.54,
P=0.009) (Fig. 2A). In contrast, the
T/N ratio showed a marginal correlation with cell density (R=0.42,
P=0.05) (Fig. 2B).
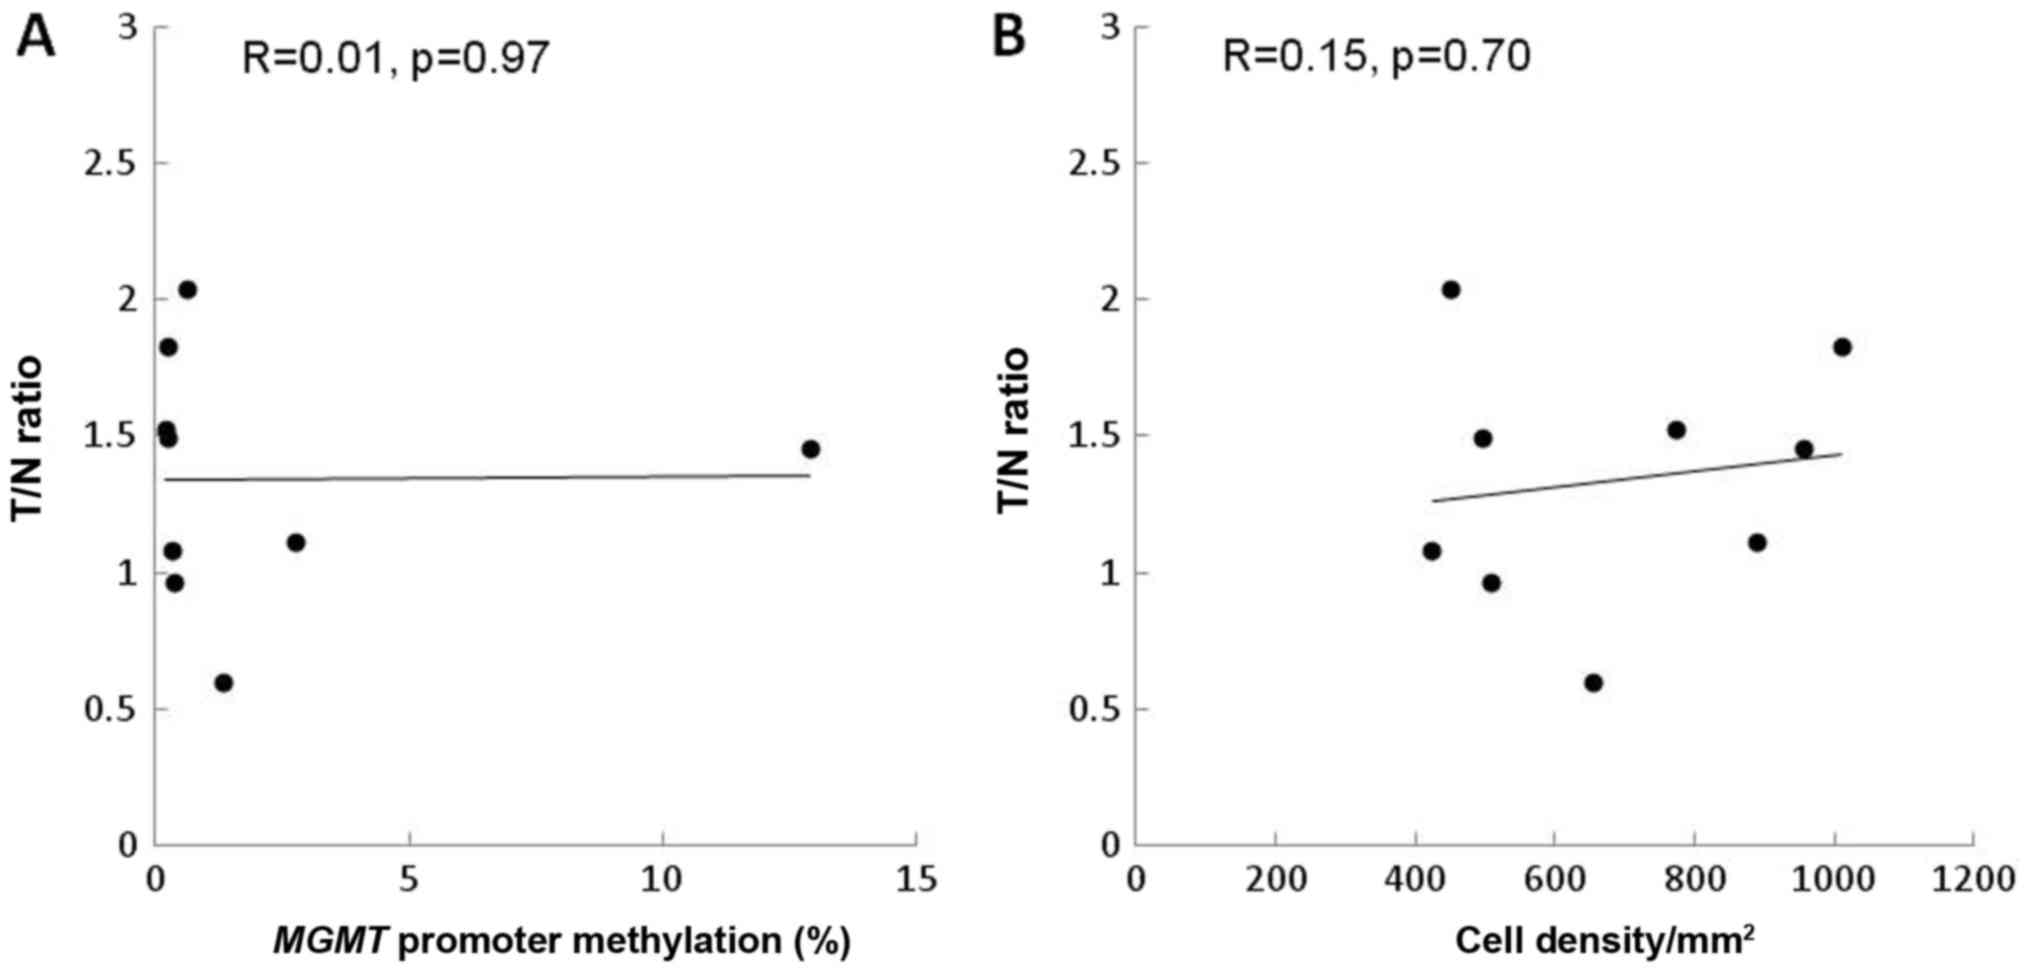
In recurrent cases, the T/N ratio did not correlate
with MGMT methylation (R=0.01, P=0.97) or with cell density
(R=0.15, P=0.70) (Fig. 3A and B).
Estimation of
11C-methionine PET with MGMT methylation and cell
density
We attempted to model the PET T/N ratio of
11C-methionine according to MGMT methylation and
cell density in newly diagnosed cases. A linear regression model
indicated the following equation, with an overall P-value of 0.025,
which was considered statistically significant for fit.
(T/Nr of 11C-methionie
PET)=0.0002×CD+0.004×MGMT+1.1,
where CD is the cell density (cells/mm2)
and MGMT indicates MGMT methylation (%). Multiple regression
analysis revealed that MGMT methylation tended to be
statistically significant for model construction (t=2.03,
P=0.057), but cell density was not (t=0.87, P=0.4).
Discussion
Previously, we evaluated the highest T/N ratio of
11C-methionine PET in non-enhancing gliomas, in a
non-stereotactic manner, and identified that a higher uptake of
11C-methionine in PET may reflect increased MGMT
promoter methylation (12). However,
gliomas are genetically and histopathologically heterogeneous
(3–5).
A previous report had demonstrated intratumoral heterogeneity in
MGMT promoter methylation status in 14% of cases, with the
percentage of methylation varying up to 4-fold within each case,
based on pyrosequencing results (6).
Thus, caution must be taken when interpreting the results of
genomic biomarker analyses based on a single biopsy specimen from a
given tumor. Therefore, in this study, we used stereotactic
image-based histological analysis and identified the correlation
between the T/N ratio and MGMT promoter methylation in
multiple, spatially distinct samples of primary gliomas. Using
qMSP, we found that 22.2% of cases demonstrated intratumoral
heterogeneity in methylation levels.
11C-methionine uptake is mainly
determined by a sodium-independent L-transporter system in the
luminal membrane of endothelial cells (19–21) and
correlates with the proliferation and microvessel density of tumors
(16,18,22,23).
Although the main metabolic pathway of 11C-methionine is
protein incorporation, the conversion of methionine to
S-adenosyl-L-methionine (SAM) is a minor pathway (24). In the brain, methionine is a precursor
of SAM (25) which plays an important
role in DNA methylation processes (26). The activation of methionine to SAM
apparently occurs very rapidly in the brain, as measured by the
conversion of administered 11C-methionine, and
11C-SAM uptake may reflect the enhanced transmethylation
processes in tumors (24,27). Methionine uptake in tumors may be
associated with MGMT promoter methylation by
transmethylation.
In this study, the T/N ratio correlated positively
with the MGMT methylation rate in primary gliomas, but not
in recurrent tumors. Various authors have assessed changes in
MGMT promoter methylation status in paired initial and
recurrent glioblastoma samples (7,8). Selective
survival of tumor cells with high MGMT expression during
alkylating agent therapy may lead to a change in MGMT status
at recurrence (7,21,28).
In our previous study, we suggested that cell
density in glioma tissue contributes to 11C-methionine
uptake in stereotactic analysis (16). Furthermore, in another series of
patients, including those with high grade gliomas, no statistically
significant difference in T/N 11C-methionine uptake
ratios were found between patients with and without MGMT
methylation (29,30). Methionine uptake in gliomas is
governed by changes in tracer influx across the blood-brain barrier
(BBB) (31). In previous studies
(16,29,30), the
enhancing gliomas and methionine uptake were affected by BBB
disruption and reflected the amino acid transport system and
proliferation. Our present results analyzed non-enhancing gliomas
and suggested that MGMT methylation tends to contribute
markedly more to 11C-methionine uptake than to cell
density in glioma tissue. However, the linear correlation of
MGMT methylation and 11C-methionine uptake mainly
arose from oligodendroglioma cases. An evaluation of the grading
and histological types of gliomas and biopsy sites should be
performed from this perspective.
This study was limited by its small sample size.
Moreover, it remains unclear whether our results will be useful for
prognosis and predicting response to therapy. Future large-scale
studies are required to validate the proposed correlation between
MGMT methylation and 11C-methionine uptake in a
stereotactic manner.
To the best of our knowledge, no previous study has
demonstrated stereotactic imaging of MGMT methylation status
in gliomas using the noninvasive 11C-methionine PET
imaging technique. When we investigated the correlation of the
11C-methionine T/N ratio in PET with quantitative
MGMT promoter methylation for non-enhancing gliomas in a
stereotactic image-based histological analysis, we found that the
T/N ratio correlated positively with the MGMT methylation
rate in primary gliomas. Our findings can contribute to
understanding of the local characteristics of MGMT
methylation status in primary and recurrent gliomas.
Acknowledgements
Not applicable.
Funding
This work was supported by the JSPS KAKENHI (grant
nos. JP15K15534 and 16K20033).
Availability of data and materials
All data generated or analyzed during this study are
included in this published article.
Authors' contributions
YO was responsible for the conception of the study
and its design. YO and MN acquired the data. YO, MK, TS, DK, EY,
YKo, MM and YKa, SN and TF analyzed and interpreted the data. YO
drafted the manuscript. All authors critically revised the
manuscript for important intellectual content and read and approved
the final manuscript.
Ethics approval and consent to
participate
The study was approved by the Ethical Committee of
Osaka National Hospital (approval no. 94; IRB no. 0713). All
patients provided written informed consent prior to their inclusion
within the study.
Consent for publication
Not applicable.
Competing interests
The authors declare that they have no competing
interests.
Glossary
Abbreviations
Abbreviations:
|
FLAIR
|
fluid-attenuated inversion
recovery
|
|
MRI
|
magnetic resonance imaging
|
|
PET
|
positron-emission tomography
|
|
qMSP
|
quantitative methylation-specific
PCR
|
|
SUV
|
standard uptake value
|
|
T/N ratio
|
tumor/normal tissue ratio
|
|
WHO
|
World Health Organization
|
References
|
1
|
Hegi ME, Diserens AC, Gorlia T, Hamou MF,
de Tribolet N, Weller M, Kros JM, Hainfellner JA, Mason W, Mariani
L, et al: MGMT gene silencing and benefit from temozolomide in
glioblastoma. N Engl J Med. 352:997–1003. 2005. View Article : Google Scholar : PubMed/NCBI
|
|
2
|
Weller M, Tabatabai G, Kästner B, Felsberg
J, Steinbach JP, Wick A, Schnell O, Hau P, Herrlinger U, Sabel MC,
et al: MGMT Promoter methylation is a strong prognostic biomarker
for benefit from dose-intensified temozolomide rechallenge in
progressive glioblastoma: The DIRECTOR trial. Clin Cancer Res.
21:2057–2064. 2015. View Article : Google Scholar : PubMed/NCBI
|
|
3
|
Aum DJ, Kim DH, Beaumont TL, Leuthardt EC,
Dunn GP and Kim AH: Molecular and cellular heterogeneity: The
hallmark of glioblastoma. Neurosurg Focus. 37:E112014. View Article : Google Scholar : PubMed/NCBI
|
|
4
|
Bonavia R, Inda MM, Cavenee WK and Furnari
FB: Heterogeneity maintenance in glioblastoma: A social network.
Cancer Res. 71:4055–4060. 2011. View Article : Google Scholar : PubMed/NCBI
|
|
5
|
Raja R, Sinha N, Saini J, Mahadevan A, Rao
KN and Swaminathan A: Assessment of tissue heterogeneity using
diffusion tensor and diffusion kurtosis imaging for grading
gliomas. Neuroradiology. 58:1217–1231. 2016. View Article : Google Scholar : PubMed/NCBI
|
|
6
|
Parker NR, Hudson AL, Khong P, Parkinson
JF, Dwight T, Ikin RJ, Zhu Y, Cheng ZJ, Vafaee F, Chen J, et al:
Intratumoral heterogeneity identified at the epigenetic, genetic
and transcriptional level in glioblastoma. Sci Rep. 6:224772016.
View Article : Google Scholar : PubMed/NCBI
|
|
7
|
Brandes AA, Franceschi E, Tosoni A,
Bartolini S, Bacci A, Agati R, Ghimenton C, Turazzi S, Talacchi A,
Skrap M, et al: O(6)-methylguanine DNA-methyltransferase
methylation status can change between first surgery for newly
diagnosed glioblastoma and second surgery for recurrence: Clinical
implications. Neuro Oncol. 12:283–288. 2010. View Article : Google Scholar : PubMed/NCBI
|
|
8
|
Parkinson JF, Wheeler HR, Clarkson A,
McKenzie CA, Biggs MT, Little NS, Cook RJ, Messina M, Robinson BG
and McDonald KL: Variation of O(6)-methylguanine-DNA
methyltransferase (MGMT) promoter methylation in serial samples in
glioblastoma. J Neurooncol. 87:71–78. 2008. View Article : Google Scholar : PubMed/NCBI
|
|
9
|
Park CK, Kim JE, Kim JY, Song SW, Kim JW,
Choi SH, Kim TM, Lee SH, Kim IH and Park SH: The changes in MGMT
promoter methylation status in initial and recurrent glioblastomas.
Transl Oncol. 5:393–397. 2012. View Article : Google Scholar : PubMed/NCBI
|
|
10
|
Andronesi OC, Kim GS, Gerstner E,
Batchelor T, Tzika AA, Fantin VR, Vander Heiden MG and Sorensen AG:
Detection of 2-hydroxyglutarate in IDH-mutated glioma patients by
in vivo spectral-editing and 2D correlation magnetic resonance
spectroscopy. Sci Transl Med. 4:116ra42012. View Article : Google Scholar : PubMed/NCBI
|
|
11
|
Choi C, Ganji SK, DeBerardinis RJ,
Hatanpaa KJ, Rakheja D, Kovacs Z, Yang XL, Mashimo T, Raisanen JM,
Marin-Valencia I, et al: 2-hydroxyglutarate detection by magnetic
resonance spectroscopy in IDH-mutated patients with gliomas. Nat
Med. 18:624–629. 2012. View
Article : Google Scholar : PubMed/NCBI
|
|
12
|
Okita Y, Nonaka M, Shofuda T, Kanematsu D,
Yoshioka E, Kodama Y, Mano M, Nakajima S and Kanemura Y:
(11)C-methinine uptake correlates with MGMT promoter methylation in
nonenhancing gliomas. Clin Neurol Neurosurg. 125:212–216. 2014.
View Article : Google Scholar : PubMed/NCBI
|
|
13
|
Pope WB, Prins RM, Albert Thomas M,
Nagarajan R, Yen KE, Bittinger MA, Salamon N, Chou AP, Yong WH,
Soto H, et al: Non-invasive detection of 2-hydroxyglutarate and
other metabolites in IDH1 mutant glioma patients using magnetic
resonance spectroscopy. J Neurooncol. 107:197–205. 2012. View Article : Google Scholar : PubMed/NCBI
|
|
14
|
Saito T, Maruyama T, Muragaki Y, Tanaka M,
Nitta M, Shinoda J, Aki T, Iseki H, Kurisu K and Okada Y:
11C-methionine uptake correlates with combined 1p and 19q loss of
heterozygosity in oligodendroglial tumors. AJNR Am J Neuroradiol.
34:85–91. 2013. View Article : Google Scholar : PubMed/NCBI
|
|
15
|
Shinozaki N, Uchino Y, Yoshikawa K,
Matsutani T, Hasegawa A, Saeki N and Iwadate Y: Discrimination
between low-grade oligodendrogliomas and diffuse astrocytoma with
the aid of 11C-methionine positron emission tomography. J
Neurosurg. 114:1640–1647. 2011. View Article : Google Scholar : PubMed/NCBI
|
|
16
|
Okita Y, Kinoshita M, Goto T, Kagawa N,
Kishima H, Shimosegawa E, Hatazawa J, Hashimoto N and Yoshimine T:
(11)C-methionine uptake correlates with tumor cell density rather
than with microvessel density in glioma: A stereotactic
image-histology comparison. Neuroimage. 49:2977–2982. 2010.
View Article : Google Scholar : PubMed/NCBI
|
|
17
|
Esteller M, Hamilton SR, Burger PC, Baylin
SB and Herman JG: Inactivation of the DNA repair gene
O6-methylguanine-DNA methyltransferase by promoter hypermethylation
is a common event in primary human neoplasia. Cancer Res.
59:793–797. 1999.PubMed/NCBI
|
|
18
|
Berger G, Maziere M, Knipper R, Prenant C
and Comar D: Automated synthesis of 11C-labelled
radiopharmaceuticals: Imipramine, chlorpromazine, nicotine and
methionine. Int J Appl Radiat Isot. 30:393–399. 1979. View Article : Google Scholar : PubMed/NCBI
|
|
19
|
Knudsen GM, Pettigrew KD, Patlak CS, Hertz
MM and Paulson OB: Asymmetrical transport of amino acids across the
blood-brain barrier in humans. J Cereb Blood Flow Metab.
10:698–706. 1990. View Article : Google Scholar : PubMed/NCBI
|
|
20
|
Souba WW and Pacitti AJ: How amino acids
get into cells: Mechanisms, models, menus, and mediators. JPEN J
Parenter Enteral Nutr. 16:569–578. 1992. View Article : Google Scholar : PubMed/NCBI
|
|
21
|
Christmann M, Nagel G, Horn S, Krahn U,
Wiewrodt D, Sommer C and Kaina B: MGMT activity, promoter
methylation and immunohistochemistry of pretreatment and recurrent
malignant gliomas: A comparative study on astrocytoma and
glioblastoma. Int J Cancer. 127:2106–2118. 2010. View Article : Google Scholar : PubMed/NCBI
|
|
22
|
Bergström M, Lundqvist H, Ericson K, Lilja
A, Johnström P, Långström B, von Holst H, Eriksson L and Blomqvist
G: Comparison of the accumulation kinetics of
L-(methyl-11C)-methionine and D-(methyl-11C)-methionine in brain
tumors studied with positron emission tomography. Acta Radiol.
28:225–229. 1987. View Article : Google Scholar : PubMed/NCBI
|
|
23
|
Kato T, Shinoda J, Nakayama N, Miwa K,
Okumura A, Yano H, Yoshimura S, Maruyama T, Muragaki Y and Iwama T:
Metabolic assessment of gliomas using 11C-methionine, [18F]
fluorodeoxyglucose and 11C-choline positron-emission tomography.
AJNR Am J Neuroradiol. 29:1176–1182. 2008. View Article : Google Scholar : PubMed/NCBI
|
|
24
|
Ishiwata K, Ido T, Abe Y, Matsuzawa T and
Iwata R: Tumor uptake studies of
S-adenosyl-L-[methyl-11C]methionine and L-[methyl-11C]methionine.
Int J Rad Appl Instrum B. 15:123–126. 1988. View Article : Google Scholar : PubMed/NCBI
|
|
25
|
Baldessarini RJ and Kopin IJ:
S-adenosylmethionine in brain and other tissues. J Neurochem.
13:769–777. 1966. View Article : Google Scholar : PubMed/NCBI
|
|
26
|
Andreoli VM, Agnoli A and Fazio C:
Transmethylations and the central nervous system. Springer-Verlag;
Berlin; 1978, View Article : Google Scholar
|
|
27
|
Ishiwata K, Vaalburg W, Elsinga PH, Paans
AM and Woldring MG: Comparison of L-[1-11C]methionine and
L-methyl-[11C]methionine for measuring in vivo protein synthesis
rates with PET. J Nucl Med. 29:1419–1427. 1988.PubMed/NCBI
|
|
28
|
Wiewrodt D, Nagel G, Dreimüller N,
Hundsberger T, Perneczky A and Kaina B: MGMT in primary and
recurrent human glioblastomas after radiation and chemotherapy and
comparison with p53 status and clinical outcome. Int J Cancer.
122:1391–1399. 2008. View Article : Google Scholar : PubMed/NCBI
|
|
29
|
Choi H, Bang JI, Cheon GJ, Kim YH, Park
CK, Park SH, Kang KW, Chung JK, Kim EE and Lee DS:
18F-fluorodeoxyglucose and11C-methionine
positron emission tomography in relation to methyl-guanine
methyltransferase promoter methylation in high-grade gliomas. Nucl
Med Commun. 36:211–218. 2015. View Article : Google Scholar : PubMed/NCBI
|
|
30
|
Lopci E, Riva M, Olivari L, Raneri F,
Soffietti R, Piccardo A, Bizzi A, Navarria P, Ascolese AM, Rudà R,
et al: Prognostic value of molecular and imaging biomarkers in
patients with supratentorial glioma. Eur J Nucl Med Mol Imaging.
44:1155–1164. 2017. View Article : Google Scholar : PubMed/NCBI
|
|
31
|
Roelcke U, Radü EW, von Ammon K, Hausmann
O, Maguire RP and Leenders KL: Alteration of blood-brain barrier in
human brain tumors: Comparison of [18F]fluorodeoxyglucose,
[11C]methionine and rubidium-82 using PET. J Neurol Sci. 132:20–27.
1995. View Article : Google Scholar : PubMed/NCBI
|