Introduction
Gastric carcinoma (GC), a serious threat to human
health, is one of the most common malignancies in China, and its
incidence and deaths rank first in the digestive system in 2015
(1). The occurrence of GC involves a
complex pathological process associated with polygenic interactions
and multi-phase evolution (2). The
majority of patients experience the typical stages of normal
gastric mucosa, chronic atrophic gastritis, precancerous lesions
(atypical hyperplasia of gastric mucosa and intestinal metaplasia),
early stages of gastric cancer, and advanced stage of disease
(3). However, at present, the
molecular mechanisms underlying the occurrence of GC remain
unclear.
The cross-talk that exists between tumor cells and
the microenvironment serves an important function in the occurrence
and development of tumors (4). Tumor
cells adapt to their microenvironment and exhibit corresponding
biological characteristics. The tumor microenvironment refers to
the internal environment in which the tumor grows, which is
primarily composed of various interstitial cells, blood vessels,
nerves, interstitial fluid and a small number of leucocytes
(5). Tumor cells are able to induce
mesenchymal cells to produce a variety of cytokines and growth
factors that promote tumorigenesis and development (6). According to previous studies (7), it is possible to target the formation
mechanism of the tumor microenvironment in order to prevent the
proliferation and metastasis of tumor cells. Knowledge of the
interaction between the microenvironment and tumor cells is
expected to provide a rich theoretical basis for the treatment of
tumors. The aim of the present study was to elucidate the molecular
mechanisms underlying the occurrence of GC by analyzing the protein
interactions in gastric mucosal atypical hyperplasia.
Materials and methods
Tissue samples
Matching specimens, including 20 cases of normal
gastric mucosa (NGM) tissue and gastric mucosa atypical hyperplasia
(GMAH) tissue, were collected from The First Affiliated Hospital of
University of South China between September 2016 and June 2017. The
Cancer Research Institute of University of South China and The
First Affiliated Hospital of University of South China are
cooperative relations. Researchers from Cancer Research Institute
are permitted to travel to the hospital and collect specimens with
the permission of the medical ethics committee of University of
South China. Specimens were collected from the stomach within 5 min
of resection, and the gastric mucosal surface was washed with
physiological saline prior to and following the incision. The
samples were immediately frozen in liquid nitrogen and stored at
−80°C. Table I presented the clinical
data including tumor stage determined by the eighth edition AJCC
cancer staging manual (8) of 20
patients with GC. Two senior professional pathologists from Cancer
Research Institute of University of South China were asked to
independently diagnose the collected tissue samples without knowing
any clinical or pathological data.
 | Table I.Clinicopathological features of
patients with gastric cancer. |
Table I.
Clinicopathological features of
patients with gastric cancer.
| No. | Sex | Age, years | Differentiation | Tumor stage (8) | Date of
collection |
|---|
| 1 | Male | 49 | Moderate | II | September 2016 |
| 2 | Female | 64 | Poor | IV | September 2016 |
| 3 | Female | 69 | Poor | IV | September 2016 |
| 4 | Male | 62 | Poor | II | October 2016 |
| 5 | Male | 44 | Moderate | II | October 2016 |
| 6 | Male | 60 | Poor | II | November 2016 |
| 7 | Male | 53 | Poor | II | November 2016 |
| 8 | Female | 40 | Poor | III | November 2016 |
| 9 | Male | 67 | Poor | II | December 2016 |
| 10 | Female | 81 | Poor | II | December 2016 |
| 11 | Female | 47 | High | II | January 2017 |
| 12 | Male | 63 | Poor | II | February 2017 |
| 13 | Male | 52 | Poor | IV | March 2017 |
| 14 | Male | 46 | Moderate | II | March 2017 |
| 15 | Male | 51 | Poor | II | March 2017 |
| 16 | Male | 60 | Moderate | II | March 2017 |
| 17 | Female | 66 | Poor | III | April 2017 |
| 18 | Male | 67 | Poor | II | April 2017 |
| 19 | Female | 68 | Poor | II | May 2017 |
| 20 | Female | 62 | Poor | III | June 2017 |
Ethics statement
The human GC tissue samples were collected from The
First Affiliated Hospital of University of South China according to
the institutional and governmental guidelines. All patients
involved in the present study provided written informed consent,
and the present study was approved by the medical ethics committee
of University of South China (Hengyang, China).
Preparation and staining of frozen
sections
The tissue samples were removed from liquid nitrogen
and placed on a cryostat device carrier (Leica Biosystems GmbH,
Wetzlar, Germany). Following the addition of optimal cutting
temperature compound (OCT) embedding agent (Leica Microsystems
GmbH), the samples were frozen at −25°C for 20 min. Next, the
samples were immobilized to the platform of the cryostat device,
and frozen sections were made at a thickness of 8 µm. The frozen
sections were affixed to film slides (Leica Microsystems GmbH)
pretreated with ultraviolet (UV) light. Finally, the slides were
fixed with 75% ethanol at 4°C for 60 sec, stained with 0.5% methyl
green (Sigma-Aldrich; Merck KGaA, Darmstadt, Germany) at 4°C for 30
sec and discolored with 95% ethanol at 4°C for 5 sec.
Laser capture microdissection
(LCM)
The frozen tissue sections stained with methyl green
were placed on an LCM apparatus (Leica LMD6, Leica Microsystems
GmbH) platform. The target tissue was outlined on the display, and
the laser automatically cut the target tissue in the slice.
Dissolved one tablet of protease inhibitor cocktail tablets (Roche
Diagnostics, Basel, Switzerland) in 50 ml ultrapure water to
prepare 5% working solutions. The tissues were collected in a tube
containing 2–3 µl protease inhibitor working solutions and were
frozen at −80°C for later use.
Protein extraction and isobaric tags
for relative and absolute quantitation (iTRAQ) isotope
labeling
The mesenchyma of the NGM and GMAH tissues were
extracted using a lysis buffer (10 mM PMSF, 65 mM dithiothreitol, 7
M urea and 2 M thiourea) (GE Healthcare Life Sciences, Little
Chalfont, UK) and centrifuged at 4°C, 12,000 × g for 30 min. The
supernatant included the total proteins of the NGM and GMAH
mesenchyma. The total proteins were extracted and quantified using
a bicinchonic acid protein assay kit (Beyotime Institute of
Biotechnology, Shanghai, China), according to the manufacturer's
protocol. The total proteins of the NGM mesenchyma were labeled
with iTRAQ reagent 114; total proteins of the GMAH mesenchyma were
labeled with iTRAQ reagent 118 (both Applied Biosystems; Thermo
Fisher Scientific, Inc., Waltham, MA, USA) according to the
manufacturer's protocol. A total of 100 µl ultrapure water was used
to end the reaction. All protein samples were homogenized and
lyophilized, and then the samples were dissolved in deionized water
containing 0.1% formic acid (FA; Tedia Company, Fairfield, OH,
USA). The marked samples were eluted twice with Sep-Pak
C18 1 cc Vac cartridges (Waters Corporation, Milford,
MA, USA) with deionized water containing 0.1% FA and then once with
50% acetonitrile (ACN) (Thermo Fisher Scientific, Inc.) containing
0.1% FA. The cleaning solution was collected and lyophilized.
Identification of differentially
expressed proteins
The samples marked with iTRAQ were dissolved in 1 ml
strong cation-exchange (SCX) buffer [25% (v/v) ACN and 10 mM
KH2PO4, pH 2.6] for SCX separation. The two
samples containing mesenchymal proteins of NGM and GMAH were mixed
and loaded into a polysulfoethyl column and segregated using a 20AD
high performance liquid chromatography (HPLC) system (Shimadzu
Corporation, Kyoto, Japan) with the following conditions: i) 10 mM
KH2PO4 and 25% ACN, pH 2.6; ii) 10 mM
KH2PO4, 350 mM KCl and 25% ACN, pH 2.6. The
following settings were used: UV detection wavelength: 214/280 nm;
flow rate: 200 µl/min for 60 min; salt gradient: from 5% i) at 5
min to 25% ii) at 40 min. Next, the products were concentrated by
vacuum centrifugation for reverse-phase HPLC-mass spectrometry (MS)
analysis. The samples were dissolved in 50 µl 5% ACN containing
0.1% FA and were loaded into a Zorbax 300SB-C18 column
(Agilent Technologies, Inc., Santa Clara, CA, USA). The conditions
were as follows: i) 5% ACN, 0.1% FA; ii) 95% ACN, 0.1% FA. Flow
rate: 300 nl/min for 90 min. Salt gradient: from 5% i) at 5 min to
35% ii) at 70 min. The data were analyzed using QSTAR-XL (Applied
Biosystems; Thermo Fisher Scientific, Inc.) and tandem MS (MS/MS).
Finally, the IPI human database (version 3.45; URL: http://www.ebi.ac.uk/IPI) was searched for protein
information, and the confidence level was set to be >95%, and
the ion peak areas of m/z 114 and 118 were integrated to perform
relative quantitative analysis of proteins.
Western blot analysis
The total NGM and GMAH mesenchymal proteins were
mixed with 5X loading buffer (Beyotime Institute of Biotechnology)
and boiled for 5 min. The proteins had been quantified using a
bicinchonic acid protein assay kit (Beyotime Institute of
Biotechnology). Next, the samples were separated using 10% gradient
SDS-PAGE gels at 30 µg per lane and transferred onto PVDF membranes
(Merck KGaA). The membranes were blotted with 5% fat-free milk
suspended in TBST at room temperature for 1 h, incubated at 4°C
overnight with S100 calcium-binding protein A6 (S100A6) antibody
(1:1,000) (sc-53950; Santa Cruz Biotechnology, Inc., Dallas, TX,
USA) and superoxide dismutase 3 (SOD3) antibody (1:1,000)
(sc-58427; Santa Cruz Biotechnology, Inc.), washed and then
incubated with goat anti-mouse IgG-HRP (1:2,000) (sc-2005; Santa
Cruz Biotechnology, Inc.) at room temperature for 2 h. Detection of
immunoreactivity was achieved using enhanced chemiluminescence (GE
Healthcare Life Sciences).
Immunohistochemistry
The present study used S-P immunohistochemical
staining kits (MXB Company, Fujian Province, China; URL: http://www.maxim.com.cn/). The NGM and GMAH tissues
were fixed with 10% formalin and embedded in paraffin. The
expression of S100A6 and SOD3 proteins were detected according to
the manufacturer's protocol. Briefly, 4-µm-thick sections were
prepared and mounted on poly-L-lysine-coated glass slides,
air-dried, deparaffinized with xylene and rehydrated in a
descending ethanol series. Following microwave treatment for 20
min, endogenous peroxidase activity was suppressed using 0.3%
hydrogen peroxide. The sections were treated with 5% normal goat
serum (SL038) (Solarbio Life Sciences, Tongzhou Dist. Beijing,
China) at room temperature for 15 min to block non-specific
binding. The sections were incubated with anti-S100A6 (1:100) or
anti-SOD3 (1:100) antibody overnight at 4°C, and then incubated
with goat anti-mouse IgG-FITC (1:200) (sc-2010; Santa Cruz
Biotechnology, Inc.) at room temperature for 60 min followed by
horseradish peroxidase-labeled streptavidin for 5 min at room
temperature. The sections were counterstained with 0.1% hematoxylin
at room temperature for 30 sec. The tissue staining was observed
under a light microscope at a magnification of ×40. The final
immunoreactive score was based on protein staining intensity and
the percentage of positive cells. Staining intensity was defined as
1 (negative), 2 (yellow) and 3 (brown). The percentage of positive
cells was defined as 1 (<10% positive cells), 2 (11–50% positive
cells) and 3 (>50% positive cells). The final immunoreactive
score was calculated as: Staining intensity × percentage of
positive cells. The classification of the final score was defined
as - (score 1), + (score 2–4) and +++ (score >4).
Protein signaling pathways and
interaction analysis
Visant software (version 3.91; URL: http://visant.bu.edu) was used to analyze the
interactions between proteins. Additionally, the network of direct
interactions between proteins was analyzed. The Clue Gene Ontology
(GO), Kyoto Encyclopedia of Genes and Genomes (KEGG) analysis of
protein signaling pathways was performed using Cytoscape software
(version 2.8.2; URL: http://www.cytoscape.org). GO_BP, GO_CC and GO_MF
analyses were executed with David Functional Annotation (URL:
http://david.abcc.ncifcrf.gov).
Statistical analysis
The data are reported as the mean ± standard
deviation. Statistical analysis was performed using SPSS
statistical package (version 18.0; SPSS, Inc., Chicago, IL, USA) as
follows: Comparison between individual subgroups was performed
using the Mann-Whitney U test, and correlation analysis between
groups was performed using Spearman's rank correlation test.
P<0.05 was considered to indicate a statistically significant
difference.
Results
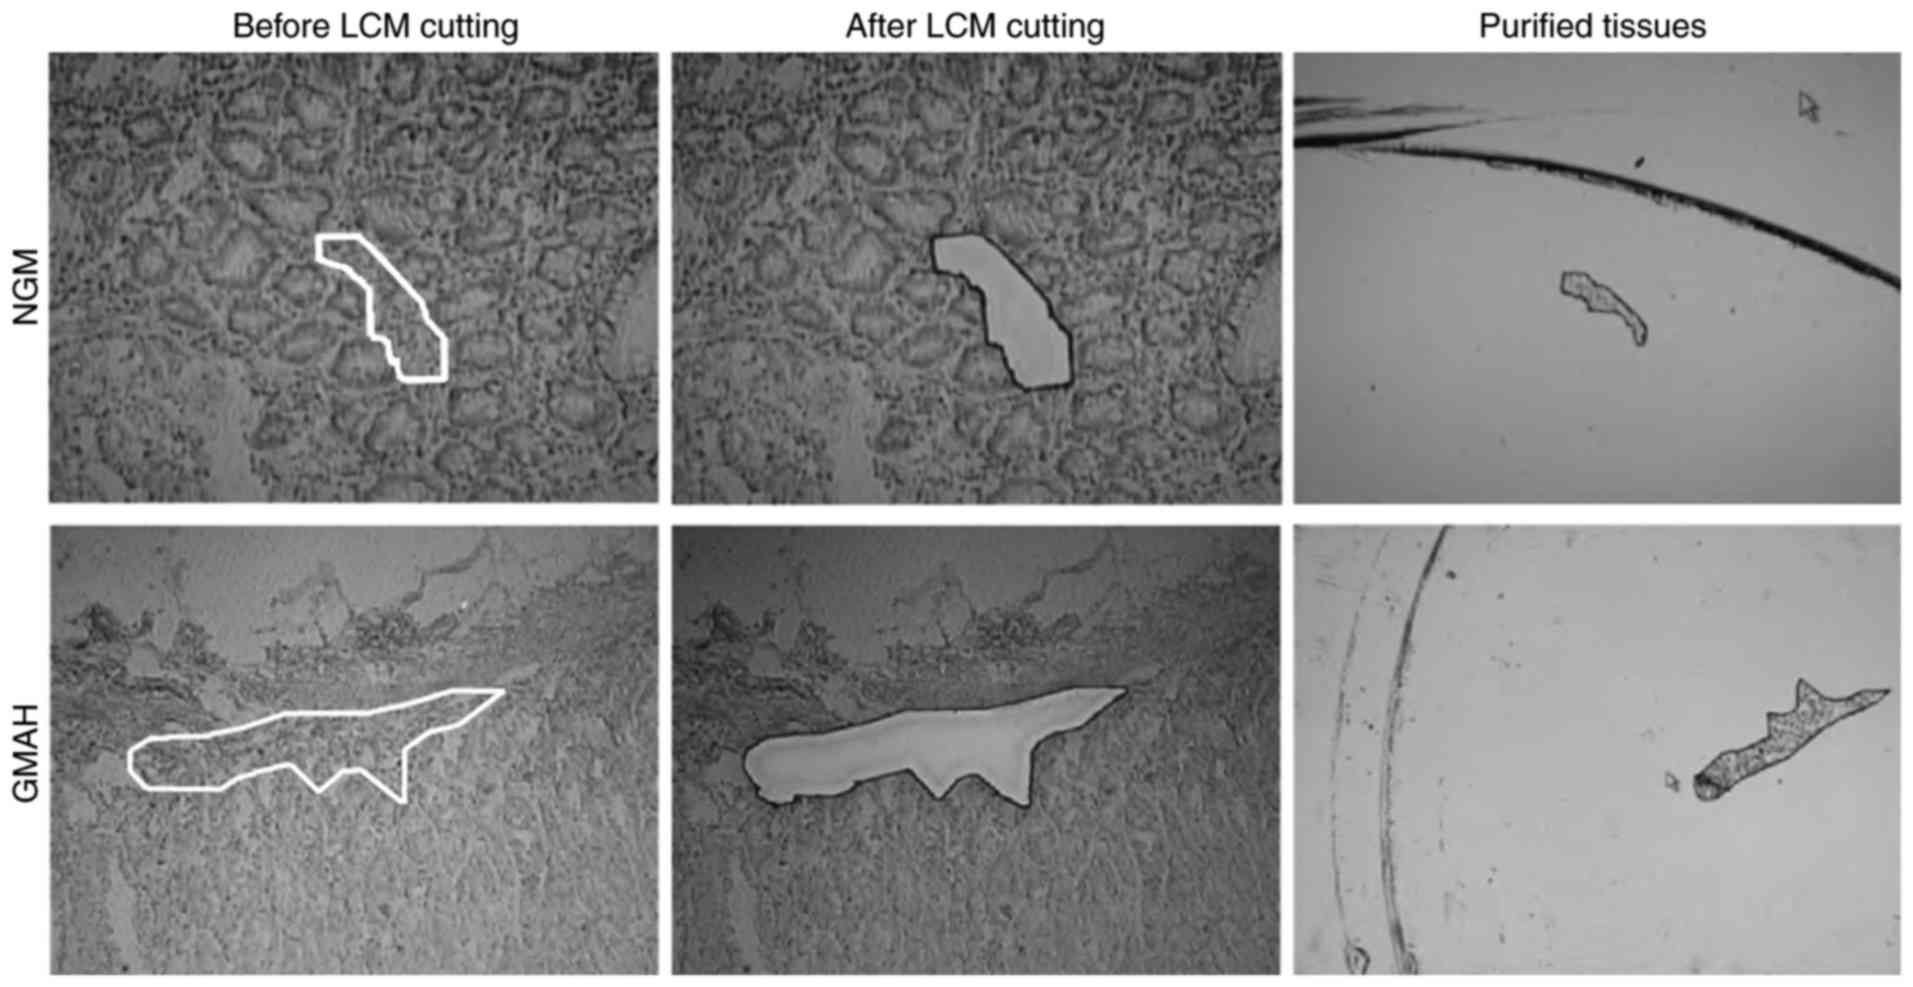
Purified mesenchyma of NGM and GMAH
tissues
The NGM and GMAH tissues were obtained from fresh
specimens of GC following surgical resection, and all tissues were
confirmed by pathology. The mesenchyma of NGM and GMAH tissues were
purified by LCM (Fig. 1). The purity
of objective groups was >95%.
Identification of differentially
expressed proteins
The NGM and GMAH mesenchyma proteins were divided
into solutions and marked using different isotopic iTRAQ. Next, the
NGM and GMAH proteins were separated using a 20AD HPLC system and
identified using QSTAR-XL MS/MS. A total of 165 differentially
expressed proteins between the NGM and GMAH mesenchyma were
identified (Table II). The G/N value
(NGM/GMAH tissue) was determined as the mean protein expression
level. In total, 99 proteins (G/N>1.5) were identified to be
upregulated and 66 proteins (G/N<0.667) were identified to be
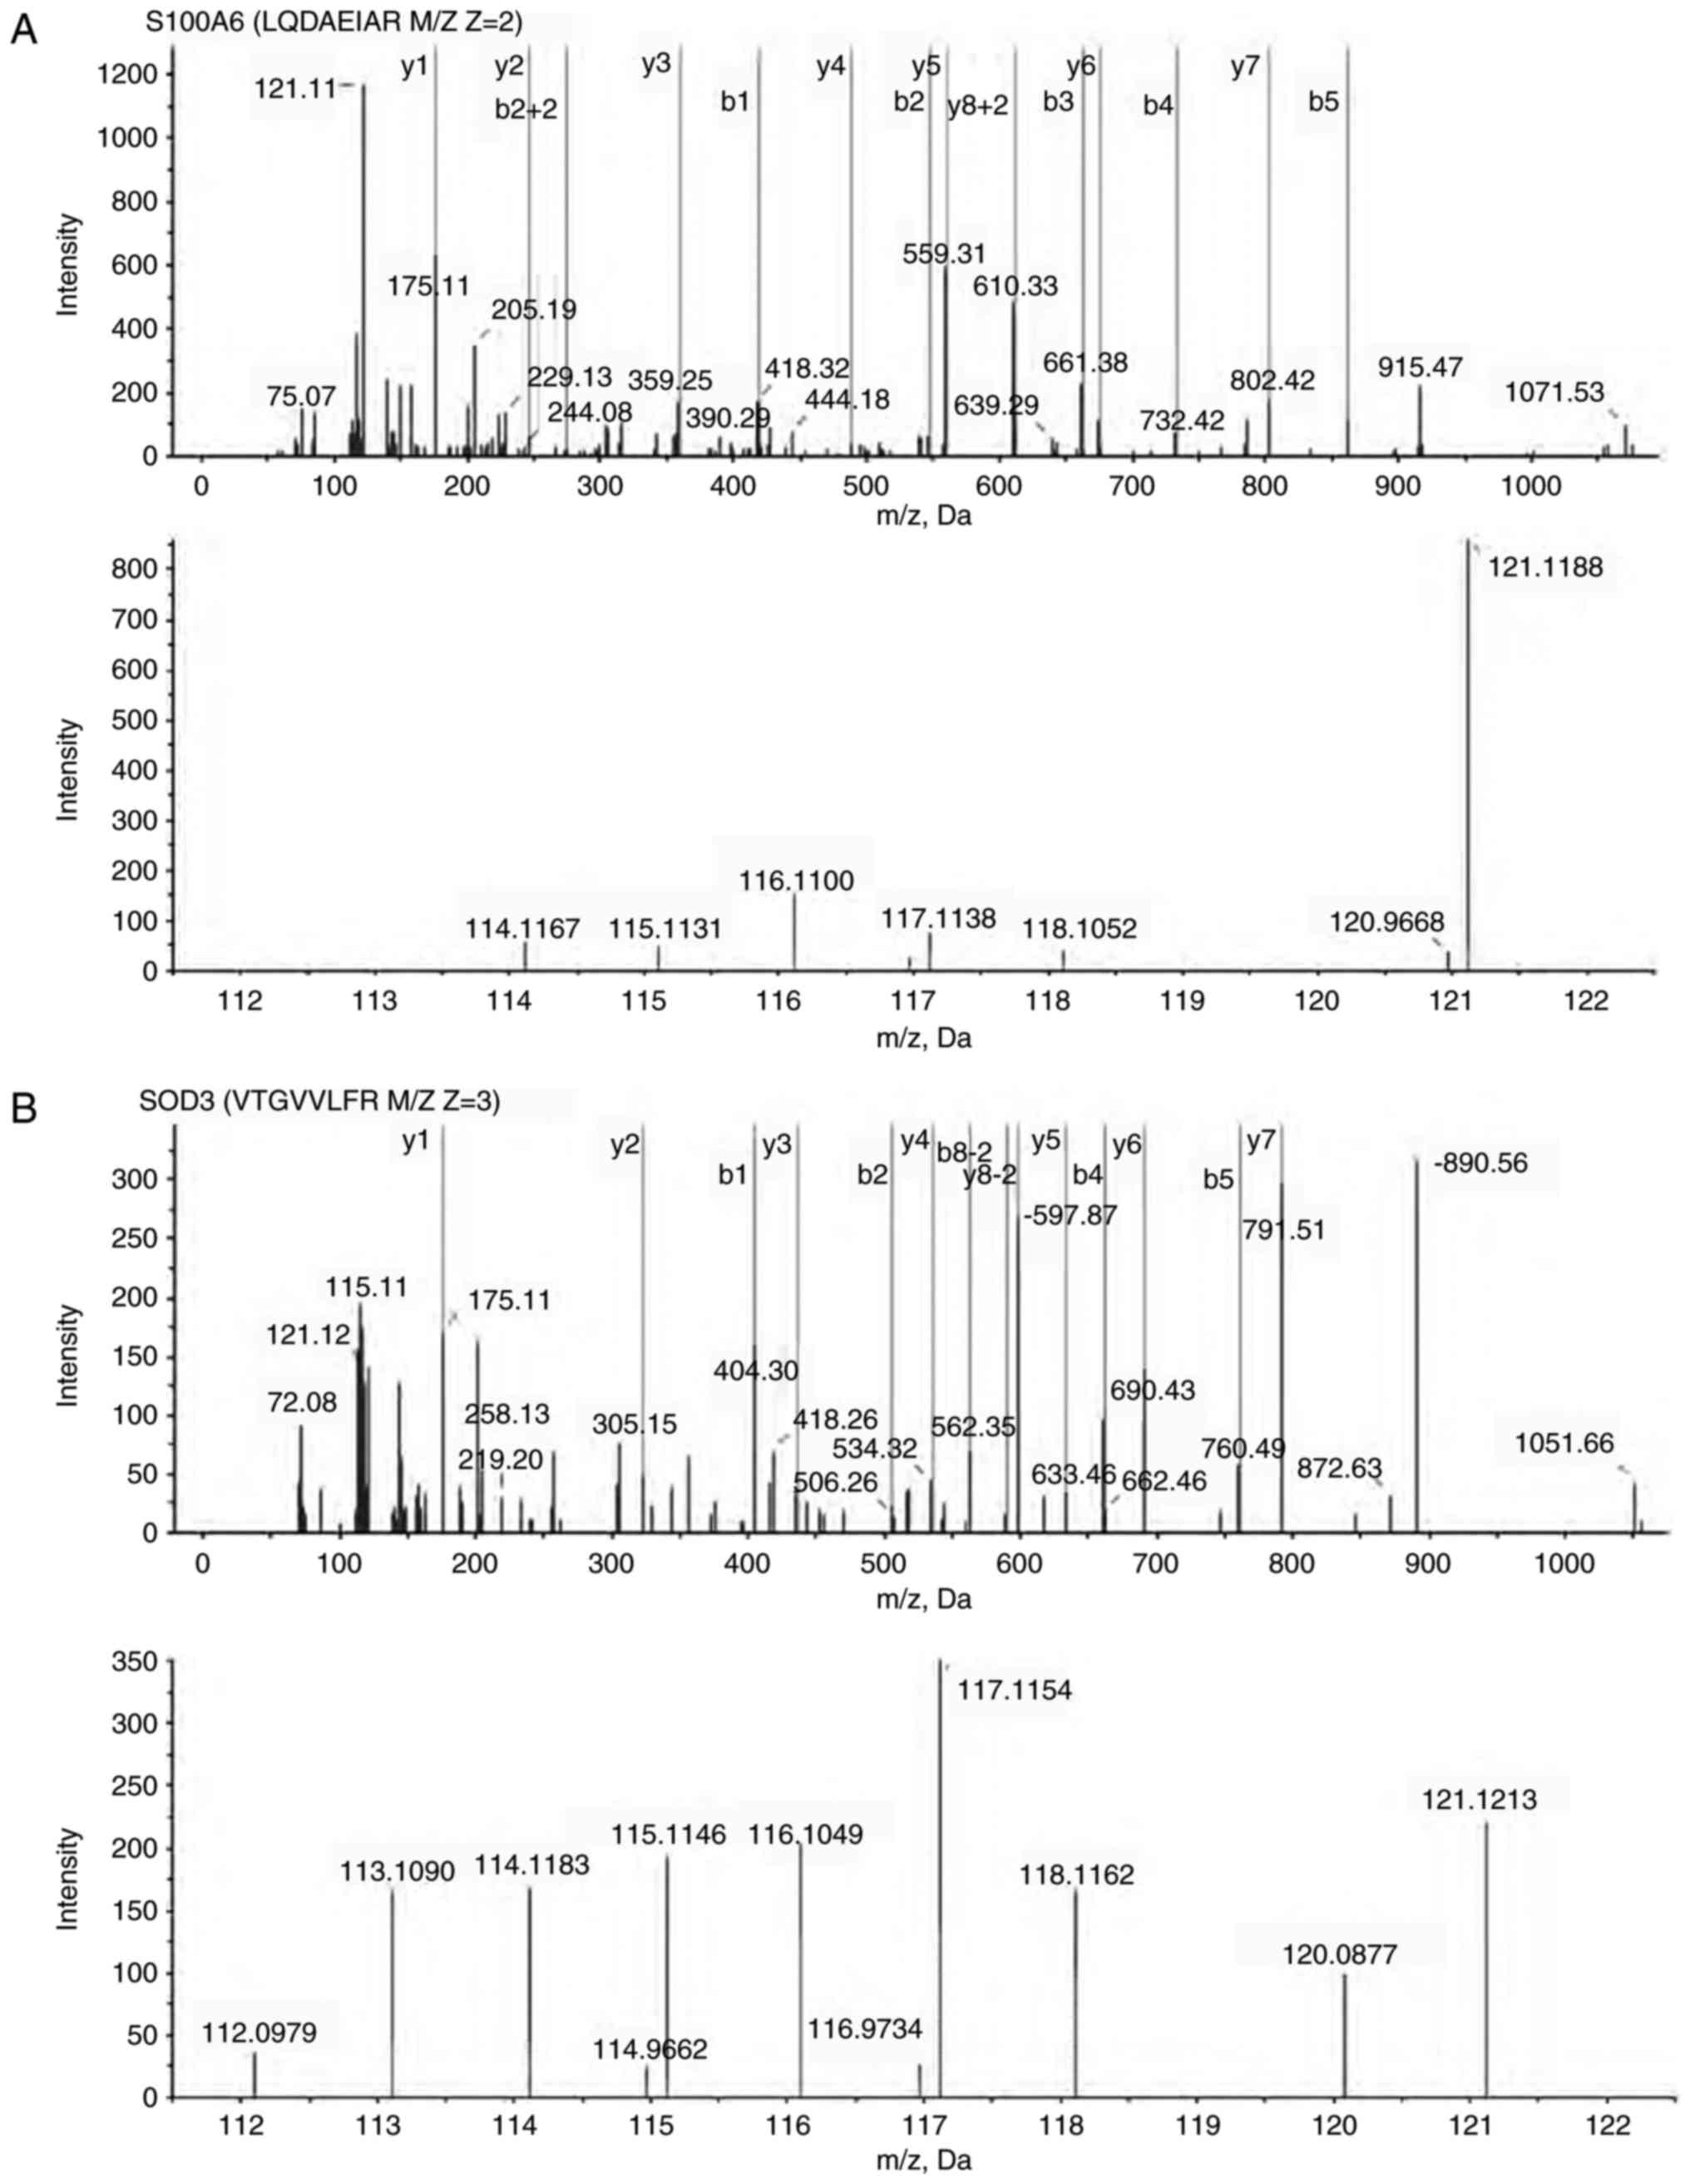
downregulated in the GMAH mesenchyma. The expression levels of the
S100A6 and SOD3 proteins were different in the mesenchyma of the
NGM and GMAH tissues, and were associated with tumorigenesis in
previous studies (9,10). Fig. 2
presents the MS results and the quantification of the S100A6
(Fig. 2A) and SOD3 proteins (Fig. 2B).
| Table II.Differentially expressed proteins
between the NGM and GMAH mesenchyma. |
Table II.
Differentially expressed proteins
between the NGM and GMAH mesenchyma.
| No. | Accession no. | Protein name | GMAH vs. NGM |
|---|
| 1 | IPI00872780.1 | ANXA4, annexin
A4 | ↑1.5704 |
| 2 | IPI00027230.3 | HSP90B1,
endoplasmin precursor | ↑1.5704 |
| 3 | IPI00024920.1 | ATP5D, ATP synthase
subunit δ | ↑1.5704 |
| 4 | IPI00013508.5 | ACTN1,
α-actinin-1 | ↑1.5848 |
| 5 | IPI00216135.1 | TPM1, isoform 3 of
tropomyosin α-1 chain | ↑1.5995 |
| 6 | IPI00788802.1 | TKT, transketolase
variant | ↑1.6292 |
| 7 | IPI00647915.1 | TAGLN2, 24 kDa
protein | ↑1.6292 |
| 8 | IPI00025874.2 | RPN1 | ↑1.6750 |
| 9 | IPI00020599.1 | CALR, calreticulin
precursor | ↑1.7062 |
| 10 | IPI00219219.3 | LGALS1,
galectin-1 | ↑1.7379 |
| 11 | IPI00218918.5 | ANXA1, annexin
A1 | ↑1.7379 |
| 12 | IPI00218733.6 | SOD1, superoxide
dismutase | ↑1.7864 |
| 13 | IPI00010796.1 | P4HB, protein
disulfide-isomerase precursor | ↑1.7864 |
| 14 | IPI00414283.5 | FN1, fibronectin 1
isoform 4 preproprotein | ↑1.8198 |
| 15 | IPI00298547.3 | PARK7, protein
DJ-1 | ↑1.8198 |
| 16 | IPI00794402.1 | ARHGDIA, 28 kDa
protein | ↑1.8365 |
| 17 | IPI00219446.5 | PEBP1,
phosphatidylethanolamine-binding protein 1 | ↑1.8879 |
| 18 | IPI00553177.1 | SERPINA1 | ↑1.9771 |
| 19 | IPI00029623.1 | PSMA6, proteasome
subunit α type-6 | ↑1.9952 |
| 20 | IPI00026314.1 | GSN, isoform 1 of
gelsolin precursor | ↑2.0137 |
| 21 | IPI00479186.5 | PKM2 | ↑2.0700 |
| 22 | IPI00033494.3 | MRLC2, myosin
regulatory light chain | ↑2.0700 |
| 23 | IPI00418471.6 | VIM, vimentin | ↑2.2492 |
| 24 | IPI00169383.3 | PGK1,
phosphoglycerate kinase 1 | ↑2.2492 |
| 25 | IPI00396321.1 | LRRC59,
leucine-rich repeat-containing protein 59 | ↑2.2696 |
| 26 | IPI00027947.6 | CTRL,
chymotrypsin-like protease | ↑2.2696 |
| 27 | IPI00884105.1 | LAMP1 | ↑2.3337 |
| 28 | IPI00789605.1 | MYL6 | ↑2.3770 |
| 29 | IPI00219018.7 | GAPDH,
glyceraldehyde-3-phosphate dehydrogenase | ↑2.3770 |
| 30 | IPI00021405.3 | LMNA, isoform A of
lamin-A/C | ↑2.3770 |
| 31 | IPI00654755.3 | HBB, hemoglobin
subunit β | ↑2.3987 |
| 32 | IPI00024284.4 | HSPG2 | ↑2.4661 |
| 33 | IPI00020987.1 | PRELP, prolargin
precursor | ↑2.4888 |
| 34 | IPI00871843.1 | TGM2, 81 kDa
protein | ↑2.5349 |
| 35 | IPI00418169.3 | ANXA2, annexin A2
isoform 1 | ↑2.5349 |
| 36 | IPI00291136.4 | COL6A1, collagen
α-1(VI) chain | ↑2.5349 |
| 37 | IPI00009771.6 | LMNB2,
lamin-B2 | ↑2.5349 |
| 38 | IPI00742225.1 | LOC646483,
DNA-binding protein TAXREB107 isoform 1 | ↑2.5589 |
| 39 | IPI00297084.7 | DDOST | ↑2.6062 |
| 40 | IPI00216138.6 | TAGLN,
transgelin | ↑2.6546 |
| 41 | IPI00025252.1 | PDIA3, protein
disulfide-isomerase A3 | ↑2.6788 |
| 42 | IPI00414676.6 | HSP90AB1,
heat-shock protein HSP 90-β | ↑2.8843 |
| 43 | IPI00009904.1 | PDIA4, protein
disulfide-isomerase A4 | ↑2.8843 |
| 44 | IPI00382696.1 | FLNB, isoform 2 of
filamin-B | ↑2.9104 |
| 45 | IPI00022200.2 | COL6A3, α3 type VI
collagen isoform 1 | ↑2.9922 |
| 46 | IPI00479145.2 | KRT19, type I
cytoskeletal 19 | ↑3.0202 |
| 47 | IPI00792191.1 | GATM, glycine
amidinotransferase | ↑3.0479 |
| 48 | IPI00872814.1 | Uncharacterized
protein MSN (fragment) | ↑3.1328 |
| 49 | IPI00008274.7 | CAP1, adenylate
cyclase-associated protein 1 | ↑3.1328 |
| 50 | IPI00887241.1 | LOC650788, 40S
ribosomal protein S28 | ↑3.2206 |
| 51 | IPI00829626.1 | IGL@ protein | ↑3.2206 |
| 52 | IPI00220278.5 | MYL9, myosin
regulatory light chain 2 | ↑3.2206 |
| 53 | IPI00021766.5 | RTN4, isoform 1 of
reticulon-4 | ↑3.2510 |
| 54 | IPI00871932.1 | SPTBN1, 276 kDa
protein | ↑3.3422 |
| 55 | IPI00465431.7 | LGALS3,
galectin-3 | ↑3.3422 |
| 56 | IPI00333541.6 | FLNA,
filamin-A | ↑3.4674 |
| 57 | IPI00221226.7 | ANXA6, annexin
A6 | ↑3.5323 |
| 58 | IPI00025465.1 | OGN, mimecan
precursor | ↑3.5323 |
| 59 | IPI00013296.3 | RPS18 | ↑3.5651 |
| 60 | IPI00299145.9 | KRT6C, type II
cytoskeletal 6C | ↑3.7665 |
| 61 | IPI00515087.2 | CTRB2,
chymotrypsinogen B2 | ↑4.0933 |
| 62 | IPI00450768.7 | KRT17, type I
cytoskeletal 17 | ↑4.0933 |
| 63 | IPI00745872.2 | ALB, isoform 1 of
serum albumin precursor | ↑4.2070 |
| 64 | IPI00218914.5 | ALDH1A1, retinal
dehydrogenase 1 | ↑4.8309 |
| 65 | IPI00027350.3 | PRDX2,
peroxiredoxin-2 | ↑4.8309 |
| 66 | IPI00000874.1 | PRDX1,
peroxiredoxin-1 | ↑4.8309 |
| 67 | IPI00887678.1 | LOC654188,
peptidylprolyl isomerase A-like | ↑5.1520 |
| 68 | IPI00848226.1 | GNB2L1 | ↑5.3937 |
| 69 | IPI00883857.1 | HNRNPU | ↑5.4945 |
| 70 | IPI00744153.2 | Uncharacterized
protein GCG | ↑5.8072 |
| 71 | IPI00020986.2 | LUM, lumican
precursor | ↑5.8617 |
| 72 | IPI00010471.5 | LCP1,
plastin-2 | ↑5.9172 |
| 73 | IPI00028030.3 | COMP, cartilage
oligomeric matrix protein | ↑6.1958 |
| 74 | IPI00220271.3 | AKR1A1, alcohol
dehydrogenase | ↑6.6050 |
| 75 | IPI00000690.1 | AIFM1, isoform 1 of
apoptosis-inducing factor 1 | ↑6.6050 |
| 76 | IPI00296099.6 | THBS1,
thrombospondin-1 precursor | ↑6.7935 |
| 77 | IPI00798430.1 | TF, transferrin
variant | ↑7.0472 |
| 78 | IPI00410241.2 | POSTN, periostin,
osteoblast specific factor | ↑7.1124 |
| 79 | IPI00646304.4 | PPIB,
peptidylprolyl isomerase B precursor | ↑7.3801 |
| 80 | IPI00022391.1 | APCS, serum amyloid
P-component precursor | ↑7.3801 |
| 81 | IPI00021263.3 | YWHAZ, 14-3-3
protein ζ/δ | ↑7.3801 |
| 82 | IPI00607708.3 | LDHA, isoform 2 of
L-lactate dehydrogenase A chain | ↑8.3963 |
| 83 | IPI00749250.2 | ACTR2 45 kDa
protein | ↑8.7108 |
| 84 | IPI00004457.3 | AOC3, membrane
copper amine oxidase | ↑10.2775 |
| 85 | IPI00027463.1 | S100A6, protein
S100 A6 | ↑10.3734 |
| 86 | IPI00215719.6 | RPL18, 60S
ribosomal protein L18 | ↑10.7643 |
| 87 | IPI00014361.1 | TSTA3, GDP-L-fucose
synthetase | ↑11.3766 |
| 88 | IPI00012750.3 | RPS25, 40S
ribosomal protein S25 | ↑12.2399 |
| 89 | IPI00010414.4 | PDLIM1, PDZ and LIM
domain protein 1 | ↑12.2399 |
| 90 | IPI00744375.1 | HLA-C | ↑12.7065 |
| 91 | IPI00399007.5 | IGHG2 | ↑13.5501 |
| 92 | IPI00291006.1 | MDH2 | ↑14.4509 |
| 93 | IPI00807428.1 | Putative
uncharacterized protein | ↑16.8919 |
| 94 | IPI00738499.2 | FTL, ferritin light
chain | ↑20.8768 |
| 95 | IPI00215965.2 | HNRNPA1 | ↑26.5252 |
| 96 | IPI00790262.1 | TTLL3 | ↑27.0270 |
| 97 | IPI00550991.3 | SERPINA3 | ↑32.4675 |
| 98 | IPI00015911.1 | DLD, dihydrolipoyl
dehydrogenase | ↑38.7597 |
| 99 | IPI00060715.1 | KCTD12 | ↑39.0625 |
| 100 | IPI00465084.6 | DES, desmin | ↓0.0406 |
| 101 | IPI00396378.3 | HNRNPA2B1 | ↓0.0855 |
| 102 | IPI00514669.1 | SH3BGRL | ↓0.0991 |
| 103 | IPI00027827.2 | SOD3 | ↓0.1057 |
| 104 | IPI00025476.1 | AMY1B, pancreatic
α-amylase precursor | ↓0.1086 |
| 105 | IPI00473011.3 | HBD, hemoglobin
subunit δ | ↓0.1127 |
| 106 | IPI00847342.1 | KRT7, keratin
7 | ↓0.1148 |
| 107 | IPI00877792.1 | FGG, 50 kDa
protein | ↓0.1259 |
| 108 | IPI00815665.1 | PRSS1, PRSS1
protein | ↓0.1259 |
| 109 | IPI00011654.2 | TUBB, tubulin β
chain | ↓0.1306 |
| 110 | IPI00021885.1 | FGA, isoform 1 of
fibrinogen α chain precursor | ↓0.1318 |
| 111 | IPI00009634.1 | SQRDL | ↓0.1803 |
| 112 | IPI00478003.1 | A2M,
α2-macroglobulin precursor | ↓0.2014 |
| 113 | IPI00867509.1 | CORO1C,
coronin-1C_i3 protein | ↓0.2291 |
| 114 | IPI00642455.2 | THBS2,
thrombospondin 2 | ↓0.2291 |
| 115 | IPI00000105.4 | MVP, major vault
protein | ↓0.2377 |
| 116 | IPI00027720.1 | PNLIP, pancreatic
triacylglycerol lipase precursor | ↓0.2421 |
| 117 | IPI00140420.4 | SND1 | ↓0.2805 |
| 118 | IPI00515061.3 | HIST1H2BJ, histone
H2B type 1-J | ↓0.2884 |
| 119 | IPI00410714.5 | HBA1, hemoglobin
subunit α | ↓0.2911 |
| 120 | IPI00295663.1 | ELA3A, elastase-3A
precursor | ↓0.2965 |
| 121 | IPI00298497.3 | FGB, fibrinogen β
chain precursor | ↓0.2992 |
| 122 | IPI00759832.1 | YWHAB, isoform
short of 14-3-3 protein β/α | ↓0.3020 |
| 123 | IPI00003527.5 | SLC9A3R1 | ↓0.3221 |
| 124 | IPI00788782.1 | ATP1A3,
Na+/K+-ATPase α3 subunit variant | ↓0.3404 |
| 125 | IPI00028908.3 | NID2, nidogen-2
precursor | ↓0.3532 |
| 126 | IPI00186290.6 | EEF2, elongation
factor 2 | ↓0.3698 |
| 127 | IPI00010779.4 | TPM4, isoform 1 of
tropomyosin α-4 chain | ↓0.3767 |
| 128 | IPI00873444.1 | UBC, RPS27A 79 kDa
protein | ↓0.3837 |
| 129 | IPI00156689.3 | VAT1 | ↓0.3945 |
| 130 | IPI00178926.2 | IGJ, immunoglobulin
J chain | ↓0.3981 |
| 131 | IPI00021827.3 | DEFA3, neutrophil
defensin 3 precursor | ↓0.3981 |
| 132 | IPI00337741.4 | APEH,
acylamino-acid-releasing enzyme | ↓0.4055 |
| 133 | IPI00292530.1 | ITIH1,
inter-α-trypsin inhibitor heavy chain H1 | ↓0.4169 |
| 134 | IPI00031522.2 | HADHA,
trifunctional enzyme subunit α | ↓0.4207 |
| 135 | IPI00426051.3 | Putative
uncharacterized protein DKFZp686C15213 | ↓0.4246 |
| 136 | IPI00009027.1 | REG1A,
lithostathine-1-α precursor | ↓0.4246 |
| 137 | IPI00300725.7 | KRT6A, type II
cytoskeletal 6A | ↓0.4365 |
| 138 | IPI00555744.6 | RPL14 protein | ↓0.4529 |
| 139 | IPI00465361.4 | RPL13, 60S
ribosomal protein L13 | ↓0.4571 |
| 140 | IPI00843810.2 | CEL, carboxyl ester
lipase | ↓0.4699 |
| 141 | IPI00024933.3 | RPL12, 60S
ribosomal protein L12 | ↓0.4966 |
| 142 | IPI00845263.1 | FN1, fibronectin 1
isoform 2 preproprotein | ↓0.5012 |
| 143 | IPI00449920.1 | IGHA1, highly
similar to Ig α-1 chain C region | ↓0.5105 |
| 144 | IPI00289862.3 | SCRN1,
secernin-1 | ↓0.5105 |
| 145 | IPI00002745.1 | CTSZ, cathepsin Z
precursor | ↓0.5152 |
| 146 | IPI00005924.4 | PNLIPRP2,
pancreatic lipase-related protein 2 | ↓0.5297 |
| 147 | IPI00873137.1 | COL1A2, 130 kDa
protein | ↓0.5346 |
| 148 | IPI00783512.1 | Reversed PTPRN2 110
kDa protein | ↓0.5346 |
| 149 | IPI00552768.1 | TXN,
thioredoxin | ↓0.5346 |
| 150 | IPI00294380.5 | PCK2 | ↓0.5395 |
| 151 | IPI00007765.5 | HSPA9, stress-70
protein, mitochondrial precursor | ↓0.5445 |
| 152 | IPI00472724.1 | EEF1AL3, elongation
factor 1-α-like 3 | ↓0.5495 |
| 153 | IPI00297646.4 | COL1A1, collagen
α-1(I) chain | ↓0.5495 |
| 154 | IPI00307162.2 | VCL, isoform 2 of
vinculin | ↓0.5649 |
| 155 | IPI00009826.2 | CPB1,
carboxypeptidase B precursor | ↓0.5649 |
| 156 | IPI00003362.2 | HSPA5 protein | ↓0.5649 |
| 157 | IPI00305461.2 | ITIH2,
inter-α-trypsin inhibitor heavy chain H2 | ↓0.5754 |
| 158 | IPI00027497.5 | GPI,
glucose-6-phosphate isomerase | ↓0.5971 |
| 159 | IPI00061005.4 | ERP27, endoplasmic
reticulum-resident protein ERp27 | ↓0.6138 |
| 160 | IPI00298994.6 | TLN1, talin-1 | ↓0.6194 |
| 161 | IPI00026302.3 | RPL31, 60S
ribosomal protein L31 | ↓0.6194 |
| 162 | IPI00856098.1 | p180/ribosome
receptor | ↓0.6252 |
| 163 | IPI00216134.3 | TPM1, tropomyosin 1
α chain isoform 7 | ↓0.6252 |
| 164 | IPI00009823.3 | CPA1,
carboxypeptidase A1 precursor | ↓0.6486 |
| 165 | IPI00009867.3 | KRT5, type II
cytoskeletal 5 | ↓0.6607 |
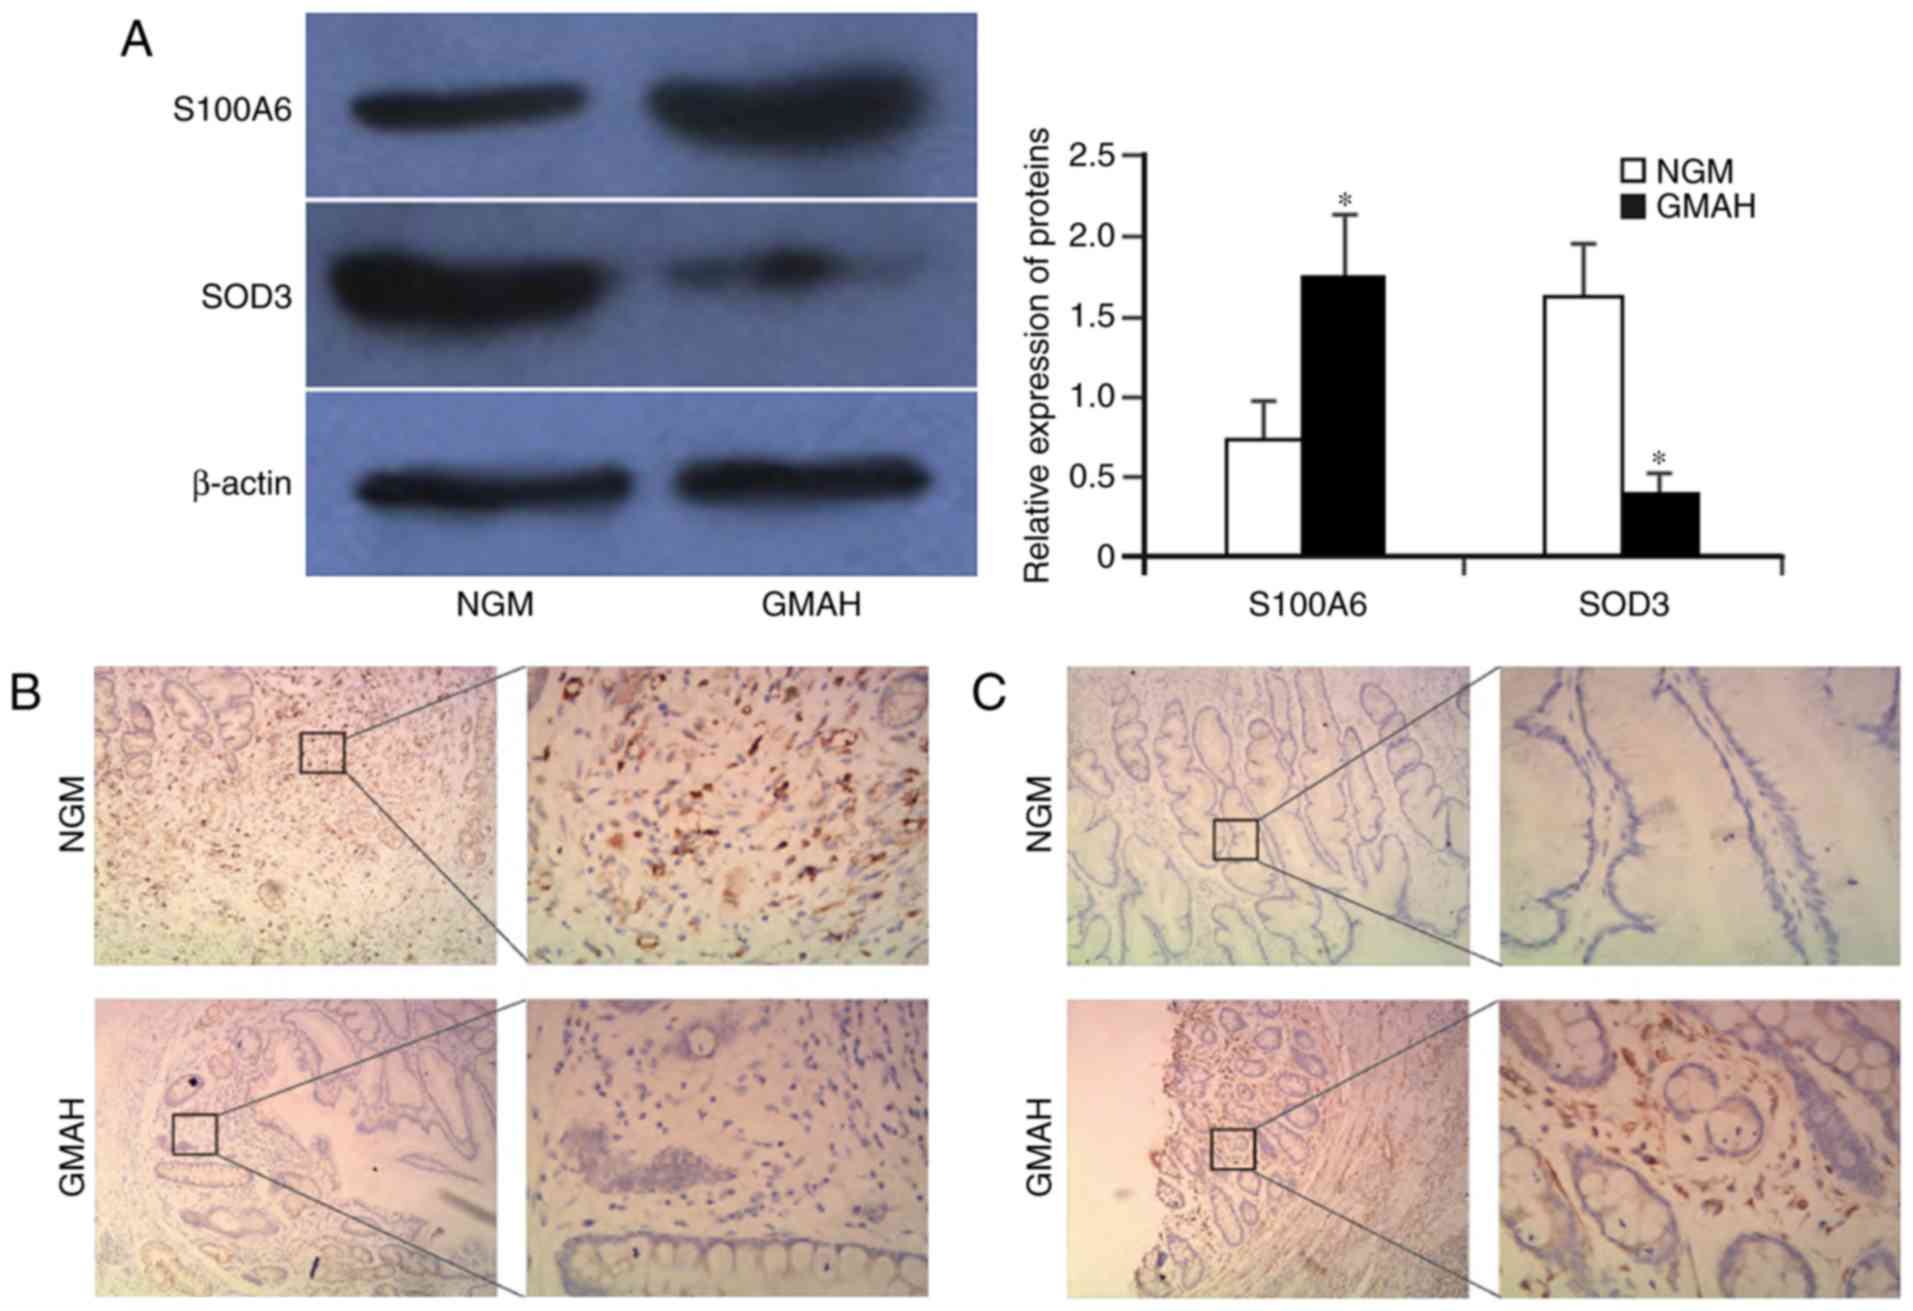
S100A6 is upregulated and SOD3 is
downregulated in GMAH mesenchymal tissue
The 20 samples of NGM and GMAH tissues were
collected and purified. Next, the tissues were sectioned. The
expression levels of the S100A6 and SOD3 proteins in NGM and GMAH
mesenchyma were detected using western blotting and
immunohistochemistry. The result of western blotting indicated that
the S100A6 protein was upregulated, but that the SOD3 protein was
significantly downregulated in the GMAH mesenchyma when compared
with the NGM tissue (P<0.01; Fig.
3A). Immunohistochemistry analysis demonstrated that S100A6 and
SOD3 proteins were expressed in the mesenchyma of NGM and GMAH
tissues; however, the staining intensity and expression levels of
the S100A6 protein in the GMAH tissue were increased compared with
those in the NGM tissue. The expression of the SOD3 protein was the
opposite (Fig. 3B and C). Therefore,
the S100A6 and SOD3 expression levels were significantly different
between the NGM and GMAH tissues (P<0.05; Table III). These results were consistent
with the results of quantitative proteomics in the present study
(Table II).
| Table III.Expression levels of S100A6 and SOD3
proteins in the NGM and GMAH tissues. |
Table III.
Expression levels of S100A6 and SOD3
proteins in the NGM and GMAH tissues.
|
|
| Score |
|
|---|
|
|
|
|
|
|---|
| Protein | n | Low (−) | Moderate (+) | High (+++) | Positive rate,
% |
|---|
| SOD3 |
|
|
|
|
|
|
NGM | 20 | 8 | 8 | 4 | 60.00 |
|
GMAH | 20 | 14 | 4 | 2 | 30.00a |
| S100A6 |
|
|
|
|
|
|
NGM | 20 | 13 | 4 | 3 | 35.00 |
|
GMAH | 20 | 7 | 11 | 2 | 65.00a |
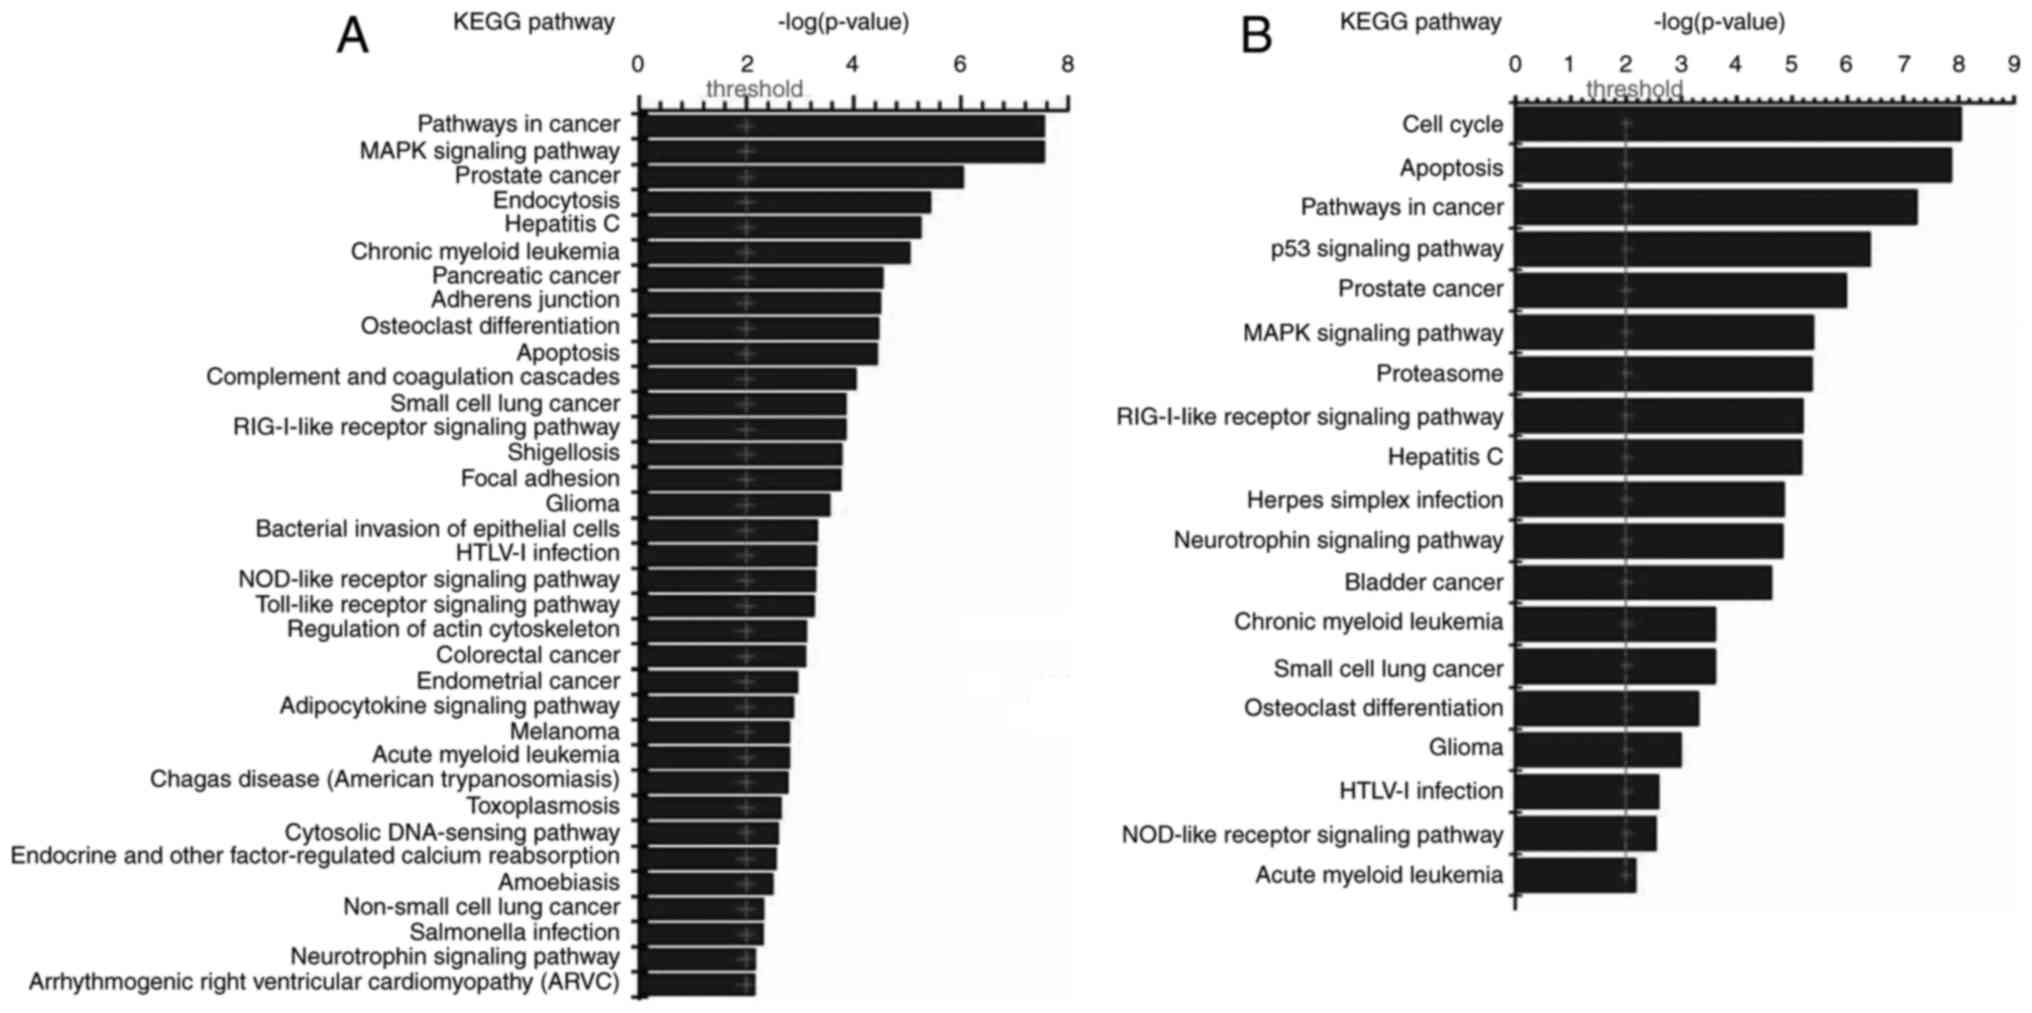
Interaction of differentially
expressed proteins and relevant signaling pathways analysis
The interaction between 165 differentially expressed
proteins in GMAH were analyzed using Visant software. It was
identified that 140 proteins acted as network nodes and interacted
with each other. The results of KEGG signal pathway analysis
demonstrated that the 165 proteins were involved in a number of
tumor signaling pathways, including the p53, mitogen-activated
protein kinase (MAPK), cell cycle, and apoptosis signaling pathways
(Fig. 4). Next, the biological
functions of the 165 proteins were analyzed with the David tool,
which indicated that the proteins were involved in cell growth,
proliferation, apoptosis and the humoral immune response (results
not shown).
Discussion
The microenvironment is composed of stromal cells,
immune cells and cytokines, and the tumor microenvironment has been
proven to determine the biological behavior of tumor cells
(11,12). It is hypothesized that the
interactions of protease, cytokines and receptors in the tumor
microenvironment affect the osmotic pressure and metabolism of the
tumor, which may result in immune escape and neoplasia (13,14). It is
important to monitor cell behavior and prevent cancer by
understanding changes in the microenvironment, which serve
important functions in tumor occurrence and development (4). In the present study, 165 proteins that
were differentially expressed between the NGM and GMAH tissue
microenvironments were screened. These proteins were demonstrated
to be involved in signaling pathways associated with cancer,
including the MAPK, VEGF and p53 signaling pathways, suggesting
that these proteins may regulate cell growth, proliferation,
apoptosis and the humoral immune response. However, the interaction
network should be further characterized in follow-up studies. In
the present study, the expression of S100A6 and SOD3 was analyzed
by western blotting and immunohistochemical staining techniques,
and was identified to be significantly different and associated
with tumorigenesis. These results were consistent with the results
of quantitative proteomics in the present study.
S100A6 is a member of the S100 protein family
(15). S100A6 has a number of
biological functions, including participating in the degradation
and ubiquitination of β-catenin, promoting apoptosis, interacting
with extracellular matrix proteins, enhancing cell metabolism and
skeleton depolymerization, participating in endocytosis and
exocytosis, adjusting enzyme activity, inhibiting protein kinase
C-mediated phosphorylation and participating in gene transcription
(16,17). A number of studies have demonstrated
that S100A6 is also associated with the occurrence and development
of tumors and is upregulated in several tumors, including ovarian
cancer, colorectal cancer, pancreatic cancer, liver cancer,
malignant melanoma and osteosarcoma (18,19).
According to the results of the present study, S100A6 is
upregulated in the GMAH stroma. This protein may contribute to the
malignant transformation of epithelial cells of gastric mucosa and
promote cell invasion and metastasis. The S100A6 protein may be a
potential biomarker for monitoring malignant cell
transformation.
Mammalian SODs have three subtypes, namely the
cytoplasmic SOD (CuZnSOD or SOD1), mitochondrial SOD (MnSOD or
SOD2) and extracellular SOD (EC-SOD or SOD3) (20). SOD3 serves an important function in
maintaining the oxidation balance that prevents nuclear DNA and
protein oxidative damage in the extracellular matrix and nucleus
(21). Previous studies have
identified that the level of SOD3 was decreased in a variety of
tumors, including lung, breast and thyroid cancer, and renal cell
carcinoma (10,22). SOD3 is widely expressed in normal
tissues; low or no expression of SOD3 causes an imbalance in the
extracellular redox environment and cancer occurs more frequently
in an imbalanced environment (23).
Therefore, a low or no expression of SOD3 may be a risk factor for
malignant cell transformation (24).
The results of the present study demonstrated that SOD3 was
downregulated in GMAH stroma, which resulted in DNA damage in
gastric mucosa epithelial cells and GC. Therefore, the early
detection of SOD3 may predict the occurrence of GC.
As the tumor microenvironment serves a critical
function in GC occurrence and development, it important to identify
the proteins present in the GMAH microenvironment. The present
study identified a total of 165 differentially expressed proteins
in GMAH stroma. These data will further clarify the molecular
mechanisms of GC occurrence as well as potentially serving as
prognostic markers for the early detection and diagnosis of GC.
Acknowledgements
The authors would like to thank Dr Qiang Zhao from
The First Affiliated Hospital of University of South China
(Hengyang, China) for his help in collecting specimens. The authors
would also like to thank Professor Zhao-Yang Luo and Professor
Xiu-Tian Zhou from the Cancer Research Institute of the University
of South China (Hengyang, China) for their assistance in the
diagnosis of specimens.
Funding
The present study was supported by the Hunan
Provincial Innovation Foundation For Postgraduates (grant no.
CX2016B478), the Doctoral Research Start-Up Fund of the University
of South China (grant no. 2016XQD21), the Hunan Provincial
Groundbreaking Platform Open Fund of the University of China (grant
no. 10K052, 12K094 and 13K083), the Hunan Provincial Education
Department Foundation of China (grant nos. 11C1112 and 12C0340),
the Hunan Provincial Health Department Foundation of China (grant
nos. B2013-048 and 2014–163) and the Construct Program of the Key
Discipline in Hunan Province of China (2011–76).
Availability of data and materials
All data generated or analyzed during this study are
included in this published article.
Authors' contributions
ZWZ and CYL conceived and designed the experiments.
HLZ, WM and CJL performed the experiments. LH and CSL analyzed the
data. HLZ and ZWZ wrote the paper. All authors read and approved
the manuscript.
Ethics approval and consent to
participate
All patients involved in this study provided written
informed consent, and the present study was approved by the Medical
Ethics Committee of University of South China. Written informed
consent was obtained from all participants.
Consent for publication
All patients provided their written informed consent
for the publication of their data.
Competing interests
The authors declare that they have no conflicts of
interest.
References
|
1
|
Chen W, Zheng R, Baade PD, Zhang S, Zeng
H, Bray F, Jemal A, Yu XQ and He J: Cancer statistics in China,
2015. CA Cancer J Clin. 66:115–132. 2016. View Article : Google Scholar : PubMed/NCBI
|
|
2
|
Lim B, Kim JH, Kim M and Kim SY: Genomic
and epigenomic heterogeneity in molecular subtypes of gastric
cancer. World J Gastroenterol. 22:1190–1201. 2016. View Article : Google Scholar : PubMed/NCBI
|
|
3
|
Correa P: Human gastric carcinogenesis: A
multistep and multifactorial process-First American Cancer Society
Award lecture on cancer epidemiology and prevention. Cancer Res.
52:6735–6740. 1992.PubMed/NCBI
|
|
4
|
Kohlhapp FJ, Mitra AK, Lengyel E and Peter
ME: MicroRNAs as mediators and communicators between cancer cells
and the tumor microenvironment. Oncogene. 34:5857–5868. 2015.
View Article : Google Scholar : PubMed/NCBI
|
|
5
|
Rodvold JJ and Zanetti M: Tumor
microenvironment on the move and the Aselli connection. Sci Signal.
9:fs132016. View Article : Google Scholar : PubMed/NCBI
|
|
6
|
Langley RR and Fidler IJ: The seed and
soil hypothesis revisited-the role of tumor-stroma interactions in
metastasis to different organs. Int J Cancer. 128:2527–2535. 2011.
View Article : Google Scholar : PubMed/NCBI
|
|
7
|
Chin AR and Wang SE: Cancer tills the
premetastatic field: Mechanistic basis and clinical implications.
Clin Cancer Res. 22:3725–3733. 2016. View Article : Google Scholar : PubMed/NCBI
|
|
8
|
Amin MB, Edge SB, Greene FL, Byrd DR,
Brookland RK, Washington MK, Gershenwald JE, Compton CC, Hess KR,
Sullivan DC, et al: AJCC cancer staging manual. 8th ed. New York:
Springer; pp. 203–220. 2016
|
|
9
|
Wang XH, Du H, Li L, Shao DF, Zhong XY, Hu
Y, Liu YQ, Xing XF, Cheng XJ, Guo T, et al: Increased expression of
S100A6 promotes cell proliferation in gastric cancer cells. Oncol
Lett. 13:222–230. 2017. View Article : Google Scholar : PubMed/NCBI
|
|
10
|
Kim J, Mizokami A, Shin M, Izumi K, Konaka
H, Kadono Y, Kitagawa Y, Keller ET, Zhang J and Namiki M: SOD3 acts
as a tumor suppressor in PC-3 prostate cancer cells via hydrogen
peroxide accumulation. Anticancer Res. 34:2821–2831.
2014.PubMed/NCBI
|
|
11
|
Yan M and Jurasz P: The role of platelets
in the tumor microenvironment: From solid tumors to leukemia.
Biochim Biophys Acta. 1863:392–400. 2016. View Article : Google Scholar : PubMed/NCBI
|
|
12
|
Justus CR, Sanderlin EJ and Yang LV:
Molecular connections between cancer cell metabolism and the tumor
microenvironment. Int J Mol Sci. 16:11055–11086. 2015. View Article : Google Scholar : PubMed/NCBI
|
|
13
|
Linton SS, Sherwood SG, Drews KC and
Kester M: Targeting cancer cells in the tumor microenvironment:
Opportunities and challenges in combinatorial nanomedicine. Wiley
Interdiscip Rev Nanomed Nanobiotechnol. 8:208–222. 2016. View Article : Google Scholar : PubMed/NCBI
|
|
14
|
Wu AA, Drake V, Huang HS, Chiu S and Zheng
L: Reprogramming the tumor microenvironment: Tumor-induced
immunosuppressive factors paralyze T cells. Oncoimmunology.
4:e10167002015. View Article : Google Scholar : PubMed/NCBI
|
|
15
|
Schneider G and Filipek A: S100A6 binding
protein and Siah-1 interacting protein (CacyBP/SIP): Spotlight on
properties and cellular function. Amino Acids. 41:773–780. 2011.
View Article : Google Scholar : PubMed/NCBI
|
|
16
|
Leśniak W, Słomnicki ŁP and Filipek A:
S100A6-new facts and features. Biochem Biophys Res Commun.
390:1087–1092. 2009. View Article : Google Scholar : PubMed/NCBI
|
|
17
|
Kasacka I, Piotrowska Ż, Filipek A and
Majewski M: Influence of doxazosin on biosynthesis of S100A6 and
atrial natriuretic factor peptides in the heart of spontaneously
hypertensive rats. Exp Biol Med (Maywood). 241:375–381. 2016.
View Article : Google Scholar : PubMed/NCBI
|
|
18
|
Zhang J, Zhang K, Jiang X and Zhang J:
S100A6 as a potential serum prognostic biomarker and therapeutic
target in gastric cancer. Dig Dis Sci. 59:2136–2144. 2014.
View Article : Google Scholar : PubMed/NCBI
|
|
19
|
Duan L, Wu R, Zou Z, Wang H, Ye L, Li H,
Yuan S, Li X, Zha H, Sun H, et al: S100A6 stimulates proliferation
and migration of colorectal carcinoma cells through activation of
the MAPK pathways. Int J Oncol. 44:781–790. 2014. View Article : Google Scholar : PubMed/NCBI
|
|
20
|
Che M, Wang R, Li X, Wang HY and Zheng
XFS: Expanding roles of superoxide dismutases in cell regulation
and cancer. Drug Discov Today. 21:143–149. 2016. View Article : Google Scholar : PubMed/NCBI
|
|
21
|
Wang YD, Chen WD, Li C, Guo C, Li Y, Qi H,
Shen H, Kong J, Long X, Yuan F, et al: Farnesoid X receptor
antagonizes JNK signaling pathway in liver carcinogenesis by
activating SOD3. Mol Endocrinol. 29:322–331. 2015. View Article : Google Scholar : PubMed/NCBI
|
|
22
|
Xu D, Li Y, Li X, Wei LL, Pan Z, Jiang TT,
Chen ZL, Wang C, Cao WM, Zhang X, et al: Serum protein S100A9,
SOD3, and MMP9 as new diagnostic biomarkers for pulmonary
tuberculosis by iTRAQ-coupled two-dimensional LC-MS/MS. Proteomics.
15:58–67. 2015. View Article : Google Scholar : PubMed/NCBI
|
|
23
|
Griess B, Tom E, Domann F and
Teoh-Fitzgerald M: Extracellular superoxide dismutase and its role
in cancer. Free Radic Biol Med. 112:464–479. 2017. View Article : Google Scholar : PubMed/NCBI
|
|
24
|
O'Leary BR, Fath MA, Bellizzi AM, Hrabe
JE, Button AM, Allen BG, Case AJ, Altekruse S, Wagner BA, Buettner
GR, et al: Loss of SOD3 (EcSOD) expression promotes an aggressive
phenotype in human pancreatic ductal adenocarcinoma. Clin Cancer
Res. 21:1741–1751. 2015. View Article : Google Scholar : PubMed/NCBI
|