Introduction
Due to increasingly sophisticated Molecular Biology
analytical methods, new groups of non-coding RNAs (ncRNAs) have
been described over the past few years (1). These molecules were revealed to be more
than simple inert sequences, emerging as functional regulatory
components, which play critical roles in modulating chromatin
architecture, transcription and RNA splicing, translation and
turnover (2). Due to their
biological relevance, these ncRNAs were also found to be involved
in different human diseases (3),
including cancer (4).
Long non-coding RNAs (lncRNAs) are noncoding
transcripts of around 200 nucleotides or more (5). The number of annotated sequences
greatly improved with third-generation sequencing methods (6), however, the functional characterization
of most of these lncRNAs is still lacking (7). Various functional mechanisms have been
described for lncRNAs including recruitment of transcription
factors for promoter regions, guiding chromatin modifiers to
specific genomic loci, allosteric modulation of transcriptional
regulatory proteins, alteration of nuclear domains, modulation of
translation or mRNA stability and working as a natural competing
endogenous RNAs (5,8,9).
The maternally expressed gene 3 (MEG3) was
the first lncRNA proposed to have a tumor suppressor function
(10,11). Using cDNA-representational difference
analysis, MEG3 expression was not detected in either
pituitary tumors, when compared to normal human pituitary tissue,
nor in several human cancer cell lines (10). Moreover, ectopic expression of
MEG3 RNA suppresses cell growth in different tumor cells
(12–14), further supporting the tumor
suppressor role of this gene.
Despite all the great advances in the field, breast
cancer remains to be the leading cause of cancer death among women
between 20 to 59 years old (15,16). The
most lethal type of breast cancer is the triple negative breast
cancer (TNBC), which lacks the expression of cell receptors for
estrogen, progesterone and do not show amplification of the human
epidermal growth factor receptor 2 (HER2) gene (17). These characteristics prevent the use
of conventional drug therapies and account for approximately 15% of
all diagnosed breast cancers (18),
highlighting the urgent need for well-defined molecular targets for
treatment of this type of cancer.
In silico analysis has suggested that
MEG3 could be a valuable prognostic factor and a potential
therapeutic target for breast cancer patients, with an impact on
disease-free survival, relapse-free survival and progression-free
survival (19–21). Consistently, functional studies have
shown that overexpression of MEG3 decreases breast cancer
cell lines growth rate, invasion capacity, and tumor angiogenesis
through downregulation of AKT signaling (22) and by enhancing p53 transcriptional
activity (23).
The CRISPR/Cas9 system provides a revolutionary
genome-editing tool for all areas of Molecular Biology (24–26).
Some techniques have been previously applied to achieve lncRNA
deletion, however, the CRISPR/Cas9 approach to target lncRNAs has
scarcely been explored in the literature (27–29).
Similarly to protein-coding genes, Cas9 nuclease may be used to
delete the entire lncRNA gene or to introduce RNA-destabilizing
elements into their loci, particularly in their promoter region.
Here, using a panel of seven breast cancer cell lines, which are
representative of tumor progression and aggressiveness in
vitro, we found that MEG3 has a discrepant expression in
the triple negative metastatic human Hs578T cell line. To better
understand the contribution of the lncRNA MEG3 in breast
tumorigenesis, we developed a protocol to knockout MEG3
expression by CRISPR/Cas9 and analyzed the phenotypic impact of
MEG3_KO using in vitro assays.
Materials and methods
MEG3 expression profiling in breast
cancer derived cell lines
Expression profiling was carried out using a panel
of breast cancer derived cell lines representing tumor progression,
ranging from non-tumorigenic to highly metastatic tumor cells. The
following cell lines were obtained from ATCC (American Type Culture
Collection): Non-tumoral cell lines MCF10A (CRL-10317;
ER-/PR-/AR-/HER2-) and MCF12A (CRL-10782; ER-/PR-/AR+/HER2-);
tumoral cell lines estrogen-positive MCF-7 (HTB-22;
ER+/PR+/AR+/HER2-), ZR-75-1 (CRL-1500; ER+/PR+/AR+/HER2+); and
tumoral cell lines estrogen-negative SK-BR-3 (HTB-30;
ER-/PR-/AR+/HER2+), MDA-MB-231 (HTB-26;ER-/PR-/AR+/HER2-) and
Hs578T (HTB-126; ER-/PR-/AR+/HER2-). Replicate experiments were
carried out with cells at increasing sequential passage number.
293T cells (CRL-3216) were used for the production of the
lentiviral particles. All cell lines were maintained at 37°C with
5% CO2 in specific culture mediums following
recommendations suggested by the ATCC.
RNA extraction, cDNA synthesis and
reverse transcription-quantitative PCR (RT-qPCR)
Total RNA was isolated from cultured cells with
Trizol (Life Technologies) and purified with an RNAspin Mini kit
(GE Healthcare) according to the manufacturer's instructions, with
an extended treatment with DNase I for 1 h. Total RNA was
quantified using the ND-1000 (NanoDrop) and its integrity was
assessed on a Bioanalyzer (Agilent Technologies). For measuring
lncRNAs, reverse transcription was performed with the SuperScript
III (Life Technologies) followed by qPCR. PCR with 40 cycles and 1
µg of the resulting purified total RNA (without reverse
transcription), using different pairs of primers for tubulin TUBA1C
gene and Histone H3 (multiple copy gene) were used to confirm
absence genomic DNA in all samples previously. For all genes,
oligo-dT20 primed reverse transcription was performed
using 1 µg of total RNA in 20 µl of RT reaction with SuperScript
III (Life Technologies), followed by qPCR using 5 µl of the 8-fold
diluted RT reaction in 20 µl of qPCR (ViiA 7 Real-Time PCR System,
Thermo Fisher Scientific). Transcript levels were normalized to
HMBS, and represented as relative abundance using the delta Ct
method (30). Two controls for the
RT step, one without primer (-primer) and the other without reverse
transcriptase (-RT) were performed, followed by qPCR with the pair
of primers, in order to confirm the absence of RNA self-priming and
of genomic DNA contamination in the RT, respectively. Graph design
and statistical analyses were carried out using the Graphpad Prism
V6 (Graphpad Software). Conditions for PCR reactions were: 40
cycles of 95°C/15 sec, 60°C/1 min, using the following primers:
MEG3 forward 5′-TGAAGAACTGCGGATGGAAG-3′ and reverse
5′-CACGTAGGCATCCAGGTGAT-3′; HMBS forward
5′-TGGACCTGGTTGTTCACTCCTT-3′ and reverse
5′-CAACAGCATCATGAGGGTTTTC-3′; TUBA1C forward
5′-TCAACACCTTCTTCAGTGAAACG-3′ and reverse
5′-AGTGCCAGTGCGAACTTCATC-3′; H3 forward
5′-ACGGCTCGTACAAAGCAGAC-3′ and reverse
5′-CCGCTGAAACTTGTTCACTG-3.
Knockout of MEG3 in Hs578T breast
cancer cells
Small guide RNAs (sgRNAs) were designed using an
online CRISPR Design Tool (http://tools.genome-engineering.org) and then cloned
(guide sequences Table I) into the
pL-CRISPR.EFS.GFP (Addgene #57818, Massachusetts, USA) or
lentiCRISPR-v2 (Addgene #52961, Massachusetts, USA). Viral
particles were produced in 293T cells using fourth-generation
lentiviral packaging. Hs578T cells were co-transduced in a ratio
1:1 with sgRNAs targeting the 5′ and 3′ ends of the gene locus.
Cell populations were first selected with 6 µg/ml puromycin (Life
Technologies) for 48 h and after cell expansion, GFP positive cells
were sorted by FACS (BD FACSARIA II, BD Bioscience).
 | Table I.Primer sequences used to clone the
sgRNAs targeting long non-coding RNA MEG3. |
Table I.
Primer sequences used to clone the
sgRNAs targeting long non-coding RNA MEG3.
| Guide | Forward
(5′-3′) | Reverse
(5′-3′) |
|---|
| 5′
sgRNA_MEG3#1 |
CACCGTTCGGGTATACGGCAGTCAC |
AAACGTGACTGCCGTATACCCGAAC |
| 5′
sgRNA_MEG3#2 |
CACCGCACTATTAACGCGATTCTAG |
AAACCTAGAATCGCGTTAATAGTGC |
| 3′
sgRNA_MEG3#3 |
CACCGTGAACTCTTGTCGGCCAGCG |
AAACCGCTGGCCGACAAGAGTTCAC |
| 3′
sgRNA_MEG3#4 |
CACCGAAGTGGGCCGAGTCTAAGGT |
AAACACCTTAGACTCGGCCCACTTC |
To verify genome-editing efficiency of the different
sgRNAs combinations (1+ 3; 1+4; 2+3 and 2+4), transduced cell
populations were further expanded for genomic DNA and total RNA
extraction. Genomic DNA was extracted with QIAamp DNA Kit (Qiagen,
Venlo, Netherlands) and MEG3 deletion was detected by PCR
(30 cycles of 94°C/1 min, 60°C/30 sec) using the following primers:
forward: 5′-ACCACAGGGTGTTGGTCAT-3′; reverse:
5′-CTCCACCACCACCTCCTC-3′. Total RNA extraction and RT-qPCR were
carried out following the same procedure for MEG3 expression
profiling characterization. To verify the stability of the MEG3_KO
2+4 cell population, we collected samples from passages 0, 5, 10
and 15 to perform FACS sorting (BD FACSARIA II, BD Bioscience) and
RT-qPCR. Hs578T wild type (WT) cells were used as control.
Growth curve and anchorage-independent
clonal growth
5×10³ cells from the Hs578T_WT and
MEG3_KO 2+4 cell population were cultured in 12-well plates in
triplicate for each time point. Cells were harvested every 48 h and
the total cell number was obtained using the Accuri C6 Plus flow
cytometry system (BD Biosciences). Anchorage-independent clonal
growth was assessed using the soft-agar assay. Briefly,
104 cells/well were seeded in triplicates in a 24 well
plate on top of the 0.6% agarose (Fisher Scientific,
Leicestershire, UK) solution in 10% FCS-DMEM. Cells were then
allowed to stand for about 10 min before the addition of 500 µl of
melted 0.3% agarose in 10% FCS-DMEM. Finally, 500 µl of liquid 10%
FCS-DMEM were added. The liquid medium was renewed every two days
and total cell colonies were quantified after 14 days using the AMG
EVOS FL Inverted Microscope. Statistical analysis was carried out
using Graphpad Prism V6 (Graphpad Software).
Migration and invasion assays
For wound-healing scratch assay, 1×10⁵
cells were plated in 24 well plates in triplicates. On the
following day, the cell layer was scratched using a 200 µl sterile
pipette tip. The wound location was marked and images of the same
field were captured to record the wound width at 0,8 and 12 h. The
area of migrating cells was measure by ImageJ software. For the
transwell assay, cells were washed in phosphate buffered saline
(PBS) and resuspended in serum-free medium. A cell suspension
containing 104 and 2×10⁴ cells was added to
the upper well of transwell migration inserts (pore size: 8 µm, BD
Biosciences) or to BD BioCoatTM MatrigelTM invasion chambers (pore
size: 8 µm, BD Biosciences), respectively. In the lower well, 700
µl of complete medium were used as chemo-attractant. The cells were
maintained for 16 h at 37°C and 5% CO2, followed by
fixation in cold methanol for 10 min and staining with Mayer's alum
hematoxylin for 20 min. Inserts were mounted in glass slides and
six fields per sample were counted, with duplicates for each cell
line in each experiment.
Immunofluorescence
For immunofluorescence, cells were seeded onto 13 mm
diameter glass coverslips and maintained under usual culture
conditions until sub-confluence (less than 80%). Each sample was
then fixed in 4% formaldehyde for 10 min, permeabilized with 0.5%
Triton X-100 for 10 min and blocked in 1% Bovine Serum Albumin for
60 min, all at room temperature. Primary antibody anti-GFP (1:500,
ab6556, Abcam, Cambridge, UK) was incubated overnight at 2–8°C and
washed three times with PBS buffer for 10 min. Alexa Fluor
594-phalloidin (1:100, A12381, Thermo Fischer Scientific,
Massachusetts, USA) and secondary antibody AlexaFluor 488 goat
anti-rabbit IgG (1:400, A27012, Thermo Fischer Scientific) were
incubated 1 h at room temperature. Coverslips were mounted using
VECTASHIELD Anti-fade Mounting Medium with DAPI (H-1200, Vector
Laboratories, CA) and images were acquired with a confocal Zeiss
LSM 780-NLO microscope.
Immunofluorescence by high-content
screening assays
After seeding the cells in 96-well plates (Greiner
Bio-One, 655986), the cultures were washed with PHEM buffer (2 mM
HEPES, 10 mM EGTA, 2 mM MgCl2, 60 mM PIPES-pH 6.9) and
fixed for 1 h with cold 4% PFA. Cells were permeabilized with 0.1%
Triton X-100 for 5 min, blocked with 1% bovine serum albumin (BSA)
for 30 min, and then incubated with primary antibody overnight at
4°C. After PHEM-glycine washing (3X), the cells were incubated with
the fluorescent dye at room temperature for 1 h and plates were
subjected to high-content imaging analysis on MetaXpress
High-Content Image Acquisition & Analysis Software (Molecular
Devices). The primary antibodies used were mouse anti-N-Cadherin
(DAKO, M3613) (1:50) and rabbit anti-TGF-β (Santa Cruz, sc-146)
(1:100). After PHEM washing (3X), the cells were incubated with
fluorescent dye, namely, FITC-labeled goat anti-rabbit IgG (H + L)
(1:100) (A11008 Thermo Fisher Scientific) or AlexaFluor 647 goat
anti-mouse IgG (H + L) (1:100) (A21236 Thermo Fisher Scientific) at
room temperature for 1 h. Protein expression was determined and
quantified through fluorescence signal changes (MFI-Median
Fluorescent Intensity) using the Multi Wavelength Cell
Scoring module. Cell counts were assessed using Hoechst 33342
(5 µM-Life Technologies, Thermo Fisher Scientific) staining for 1
h, and the stained samples were subjected to high-content imaging
analysis. In parallel, the cells were labeled with rabbit anti-GFP
(1:1,000) (ABCAM, ab6556) to confirm expression of the reporter
protein in MEG3_KO cells. Cytoskeletal F-Actin was marked with
AlexaFluor-555 Phalloidin for imaging (1:2,000) (Life Technologies,
Thermo Fisher Scientific). The image acquisition and fluorescence
intensity measurements were conducted by automatic scanning through
the MetaXpress software, using a 40X objective. For each treatment
condition and channel, 20 images per well in triplicate, were
acquired and analyzed.
Doxorubicin-induced apoptosis
To assess the endogenous modulation of MEG3
expression upon doxorubicin (DXR) treatment (D1515, Sigma-Aldrich,
Missouri, USA), 1×10⁵ Hs578T parental cells were plated
in six-well plate and treated with DMSO or with a sub-lethal
concentration of 0.25 µg/ml DXR for 24 h. Cells were then harvested
for RT-qPCR analysis. The chemosensitivity of Hs578T_WT and MEG3_KO
cells to DXR was determined by MTT assay. Briefly, 104
cells/well were seeded onto 96-well plates. On the next day, cells
were treated with different concentrations of DXR (range, 0–5
µg/ml). At 24 h post-DXR application, cell metabolism was assessed
using 0.5 mg/ml MTT (Sigma-Aldrich, St. Louis, MO, USA) solution.
Following 4 h incubation at 37°C, the medium was replaced with 150
µl dimethyl sulfoxide (Sigma-Aldrich) and vortexed for 10 min. The
absorbance of each well at 490 nm was measured using a microplate
reader (SpectraMax Paradigm, Molecular Devices, California, USA).
For apoptosis assay, 105 cells/well were seeded onto
6-well plates and incubated overnight under culture conditions.
Culture medium was replaced by fresh medium containing DXR (0.5 and
1 µg/ml) and incubated for 24 h. The cells were then harvested,
washed with PBS and resuspended in Annexin-V binding buffer
(BioVision; #1006). APC conjugated Annexin-V (ThermoFisher
Scientific; A35110) was added according to manufacturer's
instructions and propidium iodide (ThermoFisher Scientific; P3566)
was added at final concentration of 1.0 µg/ml. Samples were kept in
the dark for 5 min and the analyses was carried out using FACSARIA
II cytometer. For analysis of BAX and BCL2 protein levels,
1×10⁶ cells/ml were trypsinized, centrifuged and fixed
in 4% paraformaldehyde. Cells were washed twice with PBS and
pelleted at 400 g for 4 min. For permeabilization, cells were
incubated for 20 min with 0.05% Triton X-100 in PBS and blocked for
1 h at room temperature in 2% bovine serum albumin. Primary rabbit
BAX (#2772S, Cell Signaling) and BCL2 (#2876S, Cell Signaling)
antibodies (1:200 dilution) were incubated for 1 h at 4°C. Unbound
antibodies were washed out through two cycles of washing with PBS.
Rabbit secondary antibody (1:250, Invitrogen AlexaFluor Dye) was
incubated for 30 min at 4°C. Cells were washed again and the
analyses were performed on a FACS (BD FACSARIA II, BD Bioscience).
Data were analyzed using FlowJo 7.6 software and statistical
analysis was carried out using the GraphPad Prisma Software.
Statistical analysis
Results are expressed as the mean and standard error
of the mean (SEM) of triplicate determinations. Statistical
significance was calculated using a two-way ANOVA followed by the
Bonferroni test as a post-test or using a two-tailed paired Student
t-test. P<0.05 was considered to be significant and statistical
results are denoted in the graphs with one asterisk (P<0.05),
two asterisks (P<0.01) or three asterisks (P<0.001). All
statistical analyses were carried out using Prism 5 (GraphPad
Software, La Jolla, CA).
Results
MEG3 is highly expressed in the Hs578T
human triple negative mammary cell line
Using a panel of seven breast cancer cell lines,
which display different invasive and metastatic potential in
vitro, we found that expression of the maternally expressed
gene 3 (MEG3) is strikingly increased in the triple negative
and highly metastatic Hs578T cell line (average Ct value of 21.5),
when compared to the expression levels in the non-tumorigenic
MCF12A cell line (average Ct value of 32.9) (Fig. 1A). Interestingly, this gene has been
extensively described as a tumor suppressor gene (31). Due to this apparent controversy, we
next carried out loss-of-function experiments using the CRISPR/Cas9
knockout system.
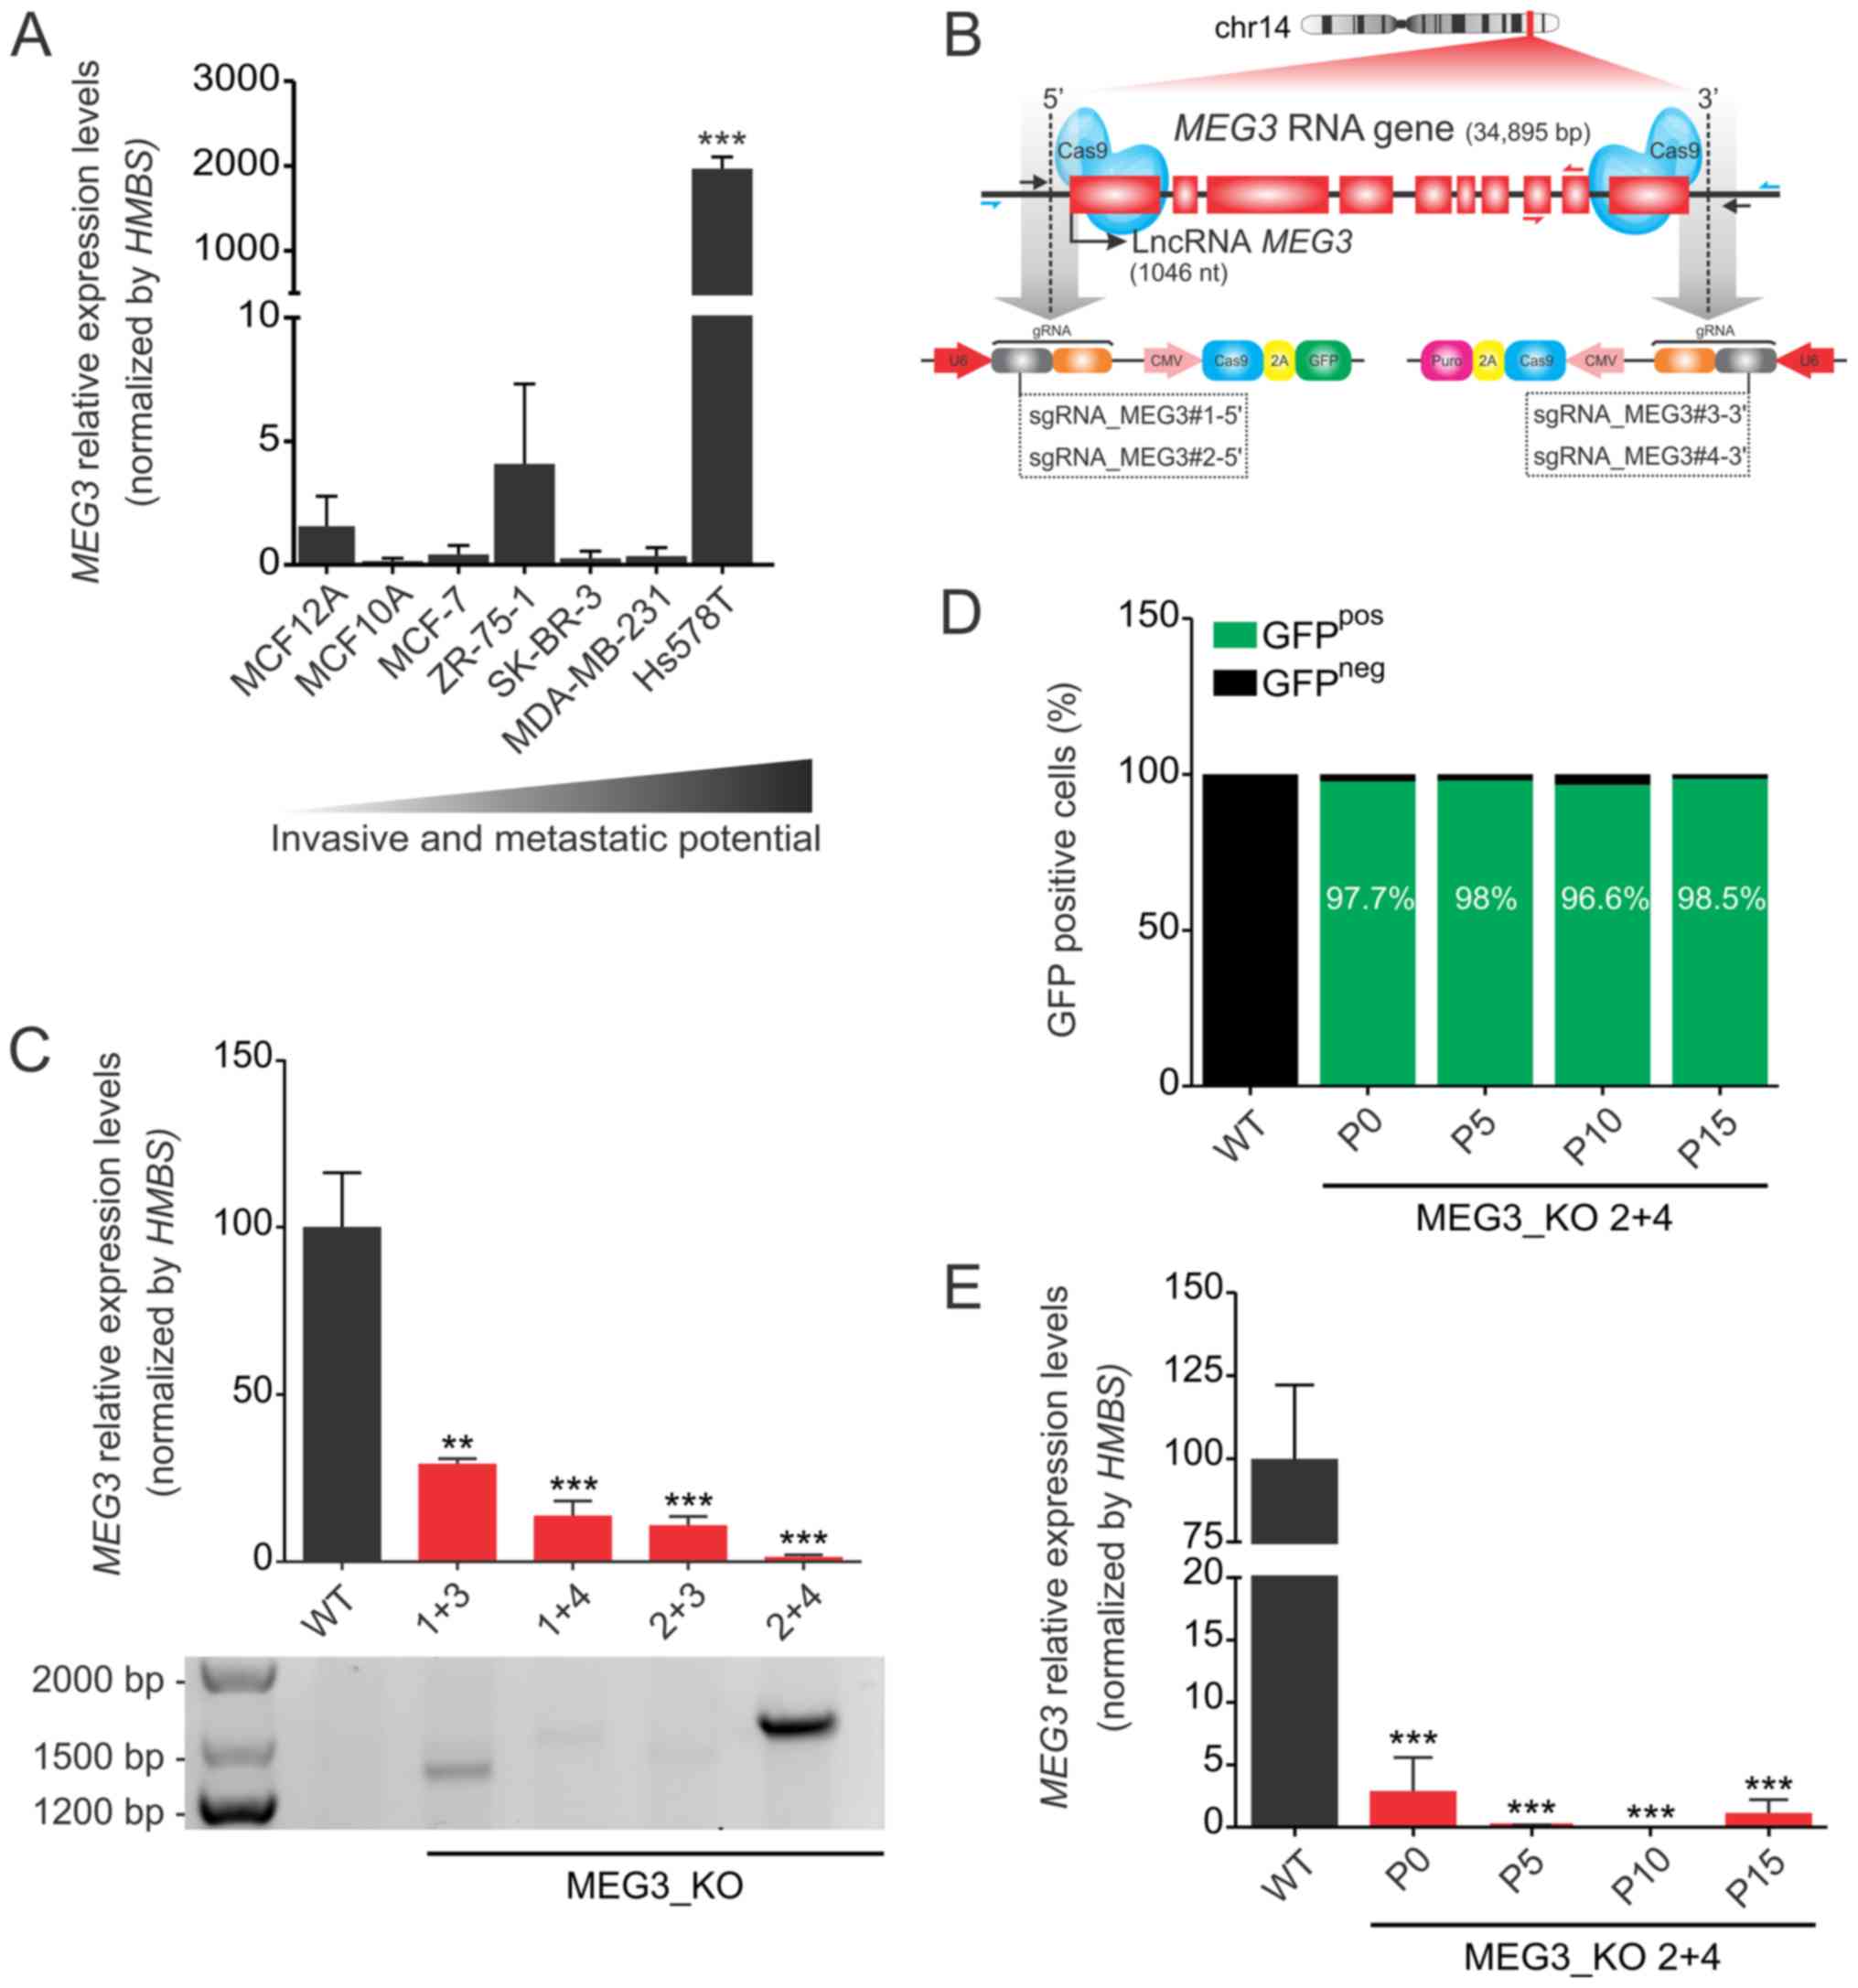 | Figure 1.MEG3 is highly expressed in
Hs578T cells and its expression can be efficiently deleted using a
CRISPR/Cas9 system. (A) Relative mRNA quantification was carried
out by RT-qPCR, using a panel of breast cancer cell lines in a
scale of increased invasive and metastatic potential. Values are
presented as the mean ± SEM (n=3) relative to the expression in the
non-tumorigenic MCF12A cell line, after normalization using
HMBS as the endogenous control. ***P<0.001 vs. MCF12A.
(B) Strategy used to generate MEG3_KO cell population. Hs578T cell
line was co-transduced with two sgRNAs, selected with puromycin for
48 h and FACS sorted for GFP-positive cells. The scheme indicates
the sgRNA (black arrows) targeting the 5′ (sgRNA_MEG3#1 and #2) and
3′ (sgRNA_MEG3#3 and #4) regions of the MEG3 gene and the
primers used for confirmation of genome editing (blue harpoon
arrows). Red harpoon arrows represent primers used for RT-qPCR
quantifications. (C) Confirmation of knockout cell populations by
RT-qPCR and genomic PCR. Values are presented as the mean ± SEM
(n=3) relative to the expression in the Hs578T_WT cell line, after
normalization using HMBS as an endogenous control. The
agarose gel shows the bands amplified when deletion occurred. The
primers flank the region outside the sgRNAs target sequence,
ranging ~35 kbp. Therefore, the deletion enables fragment
amplification, corresponding to 1.500 and 1.300 pb depending on the
sgRNA combination. (D) FACS sorting of GFP positive cells in
increasing passage numbers (P0, P5, P10 and P15) of the MEG3_KO 2+4
cell population followed by (E) lncRNA MEG3 quantification
in the same samples tested in the FACS sorting. Values are
presented as the mean ± SEM of three technical replicates for each
cell passage relative to the expression in the Hs578T_WT cell line,
after normalization using HMBS as an endogenous control.
Data were analyzed using one-way ANOVA. **P<0.01; ***P<0.001
vs. WT. FACS, fluorescence-activated cell sorting; GFP, green
fluorescent protein; HMBS, hydroxymethylbilane synthase; KO,
knockout; lncRNA, long non-coding RNA; MEG3, maternally expressed
gene 3; RT-qPCR, reverse transcription-quantitative PCR; sgRNA,
single guide RNA; WT, wild-type. |
MEG3 CRISPR/Cas9-mediated
knockout
To obtain the complete knockout (KO) of the
MEG3 gene, we used four sgRNAs: Two targeting the 5′-end
(GFP reporter) and two targeting the 3′-end (puromycin resistant
cassette) of this gene's locus (Fig.
1B). The cells were then co-transduced with a combination of
viral particles coding for the different regions of the gene, thus
generating four MEG3_KO cell populations designated according to
the sgRNAs used: 1+3, 1+4, 2+3 and 2+4.
We observed that different combinations of sgRNAs
result in distinct efficiency of genomic editing, although all KO
populations showed significant reduction on lncRNA expression
(Fig. 1C). The combination 2+4
displayed a striking reduction of around 98% in MEG3
expression when compared to the Hs578T_WT cells. Likewise, the PCR
set up to detect MEG3 deletion, revealed a higher rate of
genomic edition in this cell population.
To better test our CRISPR/Cas9 protocol, we next
aimed to investigate the knockout stability in this cell
population. To that end, we collected samples from sequential
passage numbers in order to verify the percentage of GFP-positive
cells and MEG3 lncRNA expression levels. FACS sorting
confirmed that the number of GFP expressing cells remained above
95% over time (Fig. 1D) while
MEG3 expression levels was consistently reduced (Fig. 1E). Therefore, we selected the MEG3_KO
2+4 cell population to investigate the phenotypic effects of
MEG3 deletion in the Hs578T cell line.
MEG3 knockout cells exhibit increased
proliferation and anchorage-independent cell growth
First, we examined the proliferative potential of
the MEG3_KO cells, observing that cells display increased
proliferative rates upon MEG3 deletion, when compared to the
Hs578T_WT cells (Fig. 2A). Next, we
evaluated the anchorage-independent cell growth ability in soft
agar assay. As shown in Fig. 2B,
MEG3_KO cells exhibit significant increase in the ability to form
colonies in semi-solid substrate.
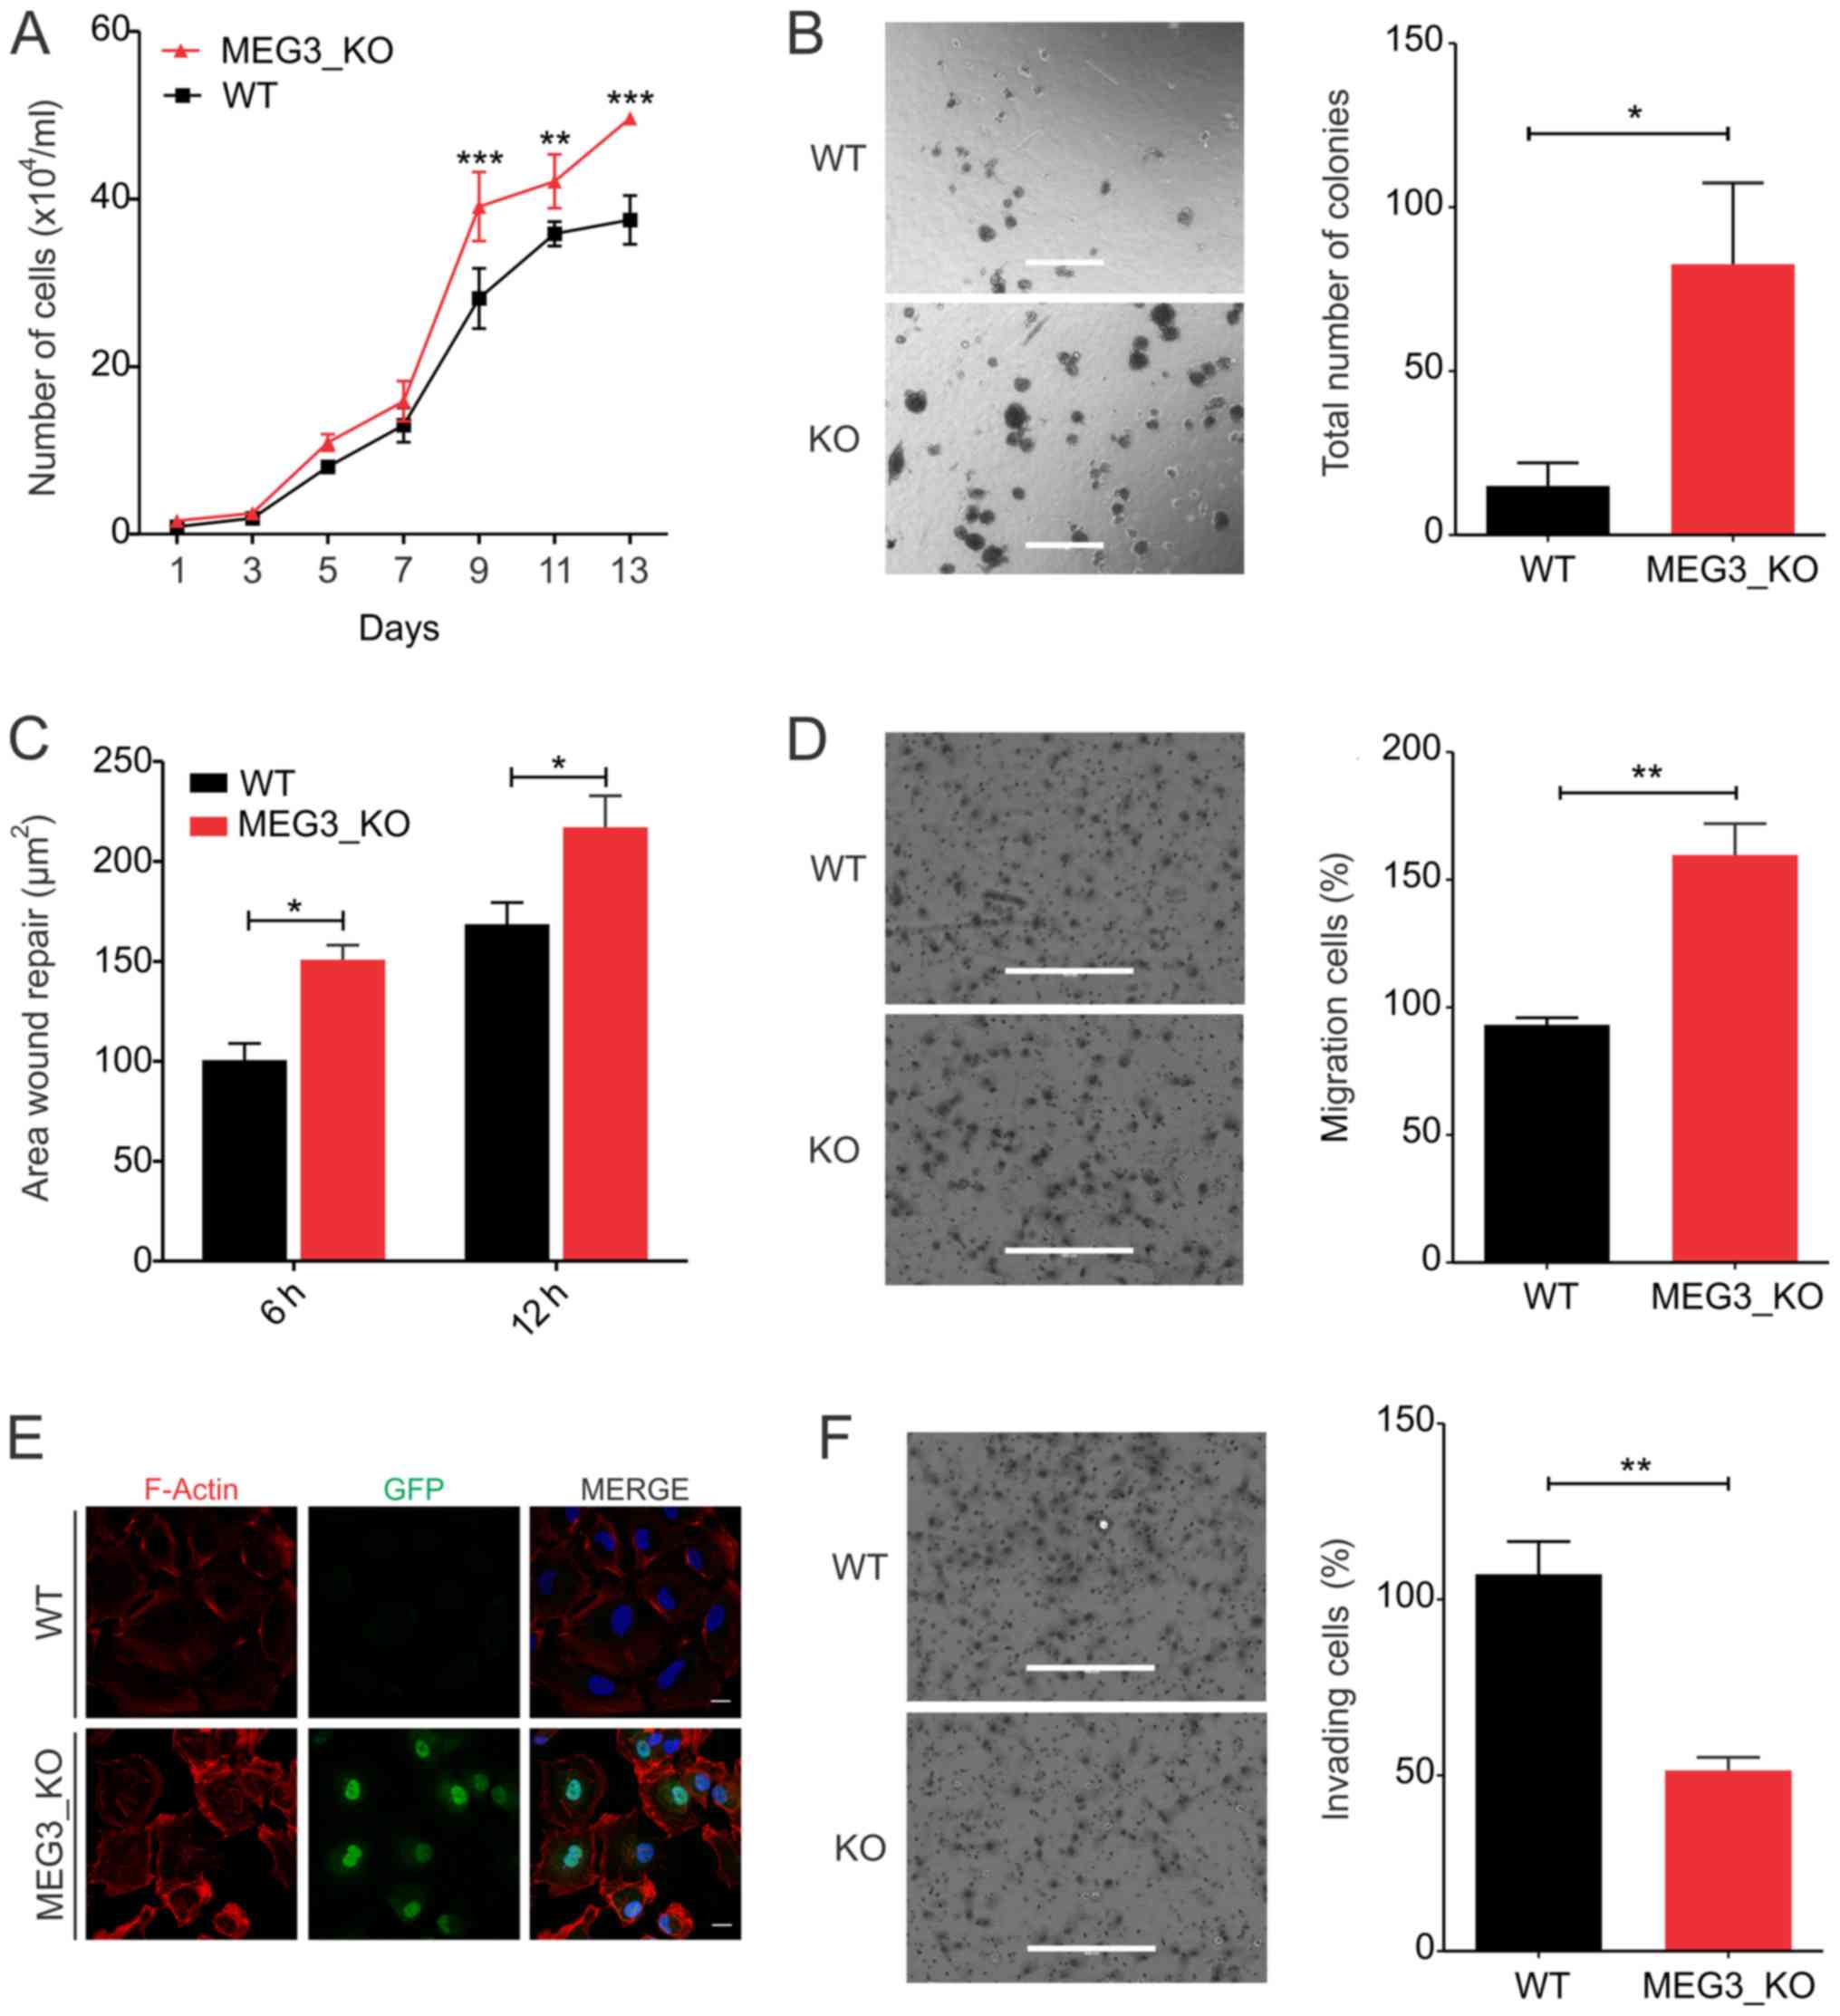 | Figure 2.MEG3 knockout leads to
increased cell proliferation, anchorage-independent growth and cell
migration capacity while cell invasion is reduced. (A) Growth curve
of Hs578T_WT and KO cells revealing a significant increase in the
proliferation rate of Hs578T cells upon MEG3 deletion by
CRISPR/Cas9. **P<0.01; ***P<0.001 vs. WT. (B)
Anchorage-independent growth assessment using a soft-agar assay.
Representative images of colonies formed in Hs578T_WT and KO cells.
Total number of colonies per well was counted. Scale bars, 400 µm.
(C) Wound healing assay. The area of migrating cells was measured
at different time points (0, 6 and 12 h) using ImageJ software. (D)
Transwell migration assay. Representative images showing Hs578T_WT
and KO cells that migrated through the membrane. Scale bars, 400
µm. (E) Immunofluorescence of Hs578T_WT and KO cells. GFP (green),
F-actin (red) and DAPI (blue). Scale bars, 20 µm. (F) Transwell
invasion assay. Representative images showing Hs578T_WT and KO
cells that migrated through the membrane. Scale bars, 400 µm.
Values are presented as the mean ± SEM for three independent
experiments. The data were analyzed using two-way ANOVA or a
t-test. *P<0.05 and **P<0.01, as indicated. GFP, green
fluorescent protein; KO, knockout; MEG3, maternally expressed gene
3; WT, wild-type. |
MEG3 knockout increases cell migration
through cytoskeleton changes but reduces the cell invasion
capacity
Given the increased anchorage-independent growth
capacity of KO_MEG3 cells, we next sought to investigate the effect
of MEG3 knockout in cell motility in vitro. Wound
healing assays showed that MEG3_KO cells migrate significantly
more, when compared to the Hs578T_WT cells (Fig. 2C). We further validated their
migration potential using transwell inserts. Consistently, the
number of cells which migrated through the membrane was 50% higher
in MEG3_KO cells than in Hs578T_WT cells (Fig. 2D). Since cytoskeleton reorganization
affects cancer cell motility (32),
we investigated whether F-Actin polymerization was changed upon
MEG3 deletion. Interestingly, staining of F-Actin showed
evident changes in the cytoskeleton organization of KO_MEG3 cells
(Fig. 2E).
Next, we used Matrigel-coated inserts to analyze
KO_MEG3 cells invasiveness capacity. Surprisingly, we found that
these cells invade significantly less, when compared to the WT
cells, suggesting a reduced ability of these cells to digest the
extracellular matrix and migrate through the membrane (Fig. 2F).
MEG3 regulates the expression of
invasiveness factors
To better understand the effects of MEG3 on
cell migration and invasion, we investigated the expression of
different markers related to cell motility and invasiveness by
RT-qPCR and immunofluorescence. Interestingly, we found significant
reduction of MMP2, ZEB1 and COL3A1 in KO cells, when
compared to WT (Fig. 3A). Since
MEG3 has previously been described to be involved in
regulation of EMT factors, we next sought to analyze
epithelial-mesenchymal transition (EMT) factors by
immunofluorescence (33). We
detected an increase, of at least two fold, in TGF-β and N-Cadherin
protein expression in KO cells (Fig.
3B-D), but we did not observe significant differences for
Vimentin, Fibronectin or E-Cadherin (data not shown).
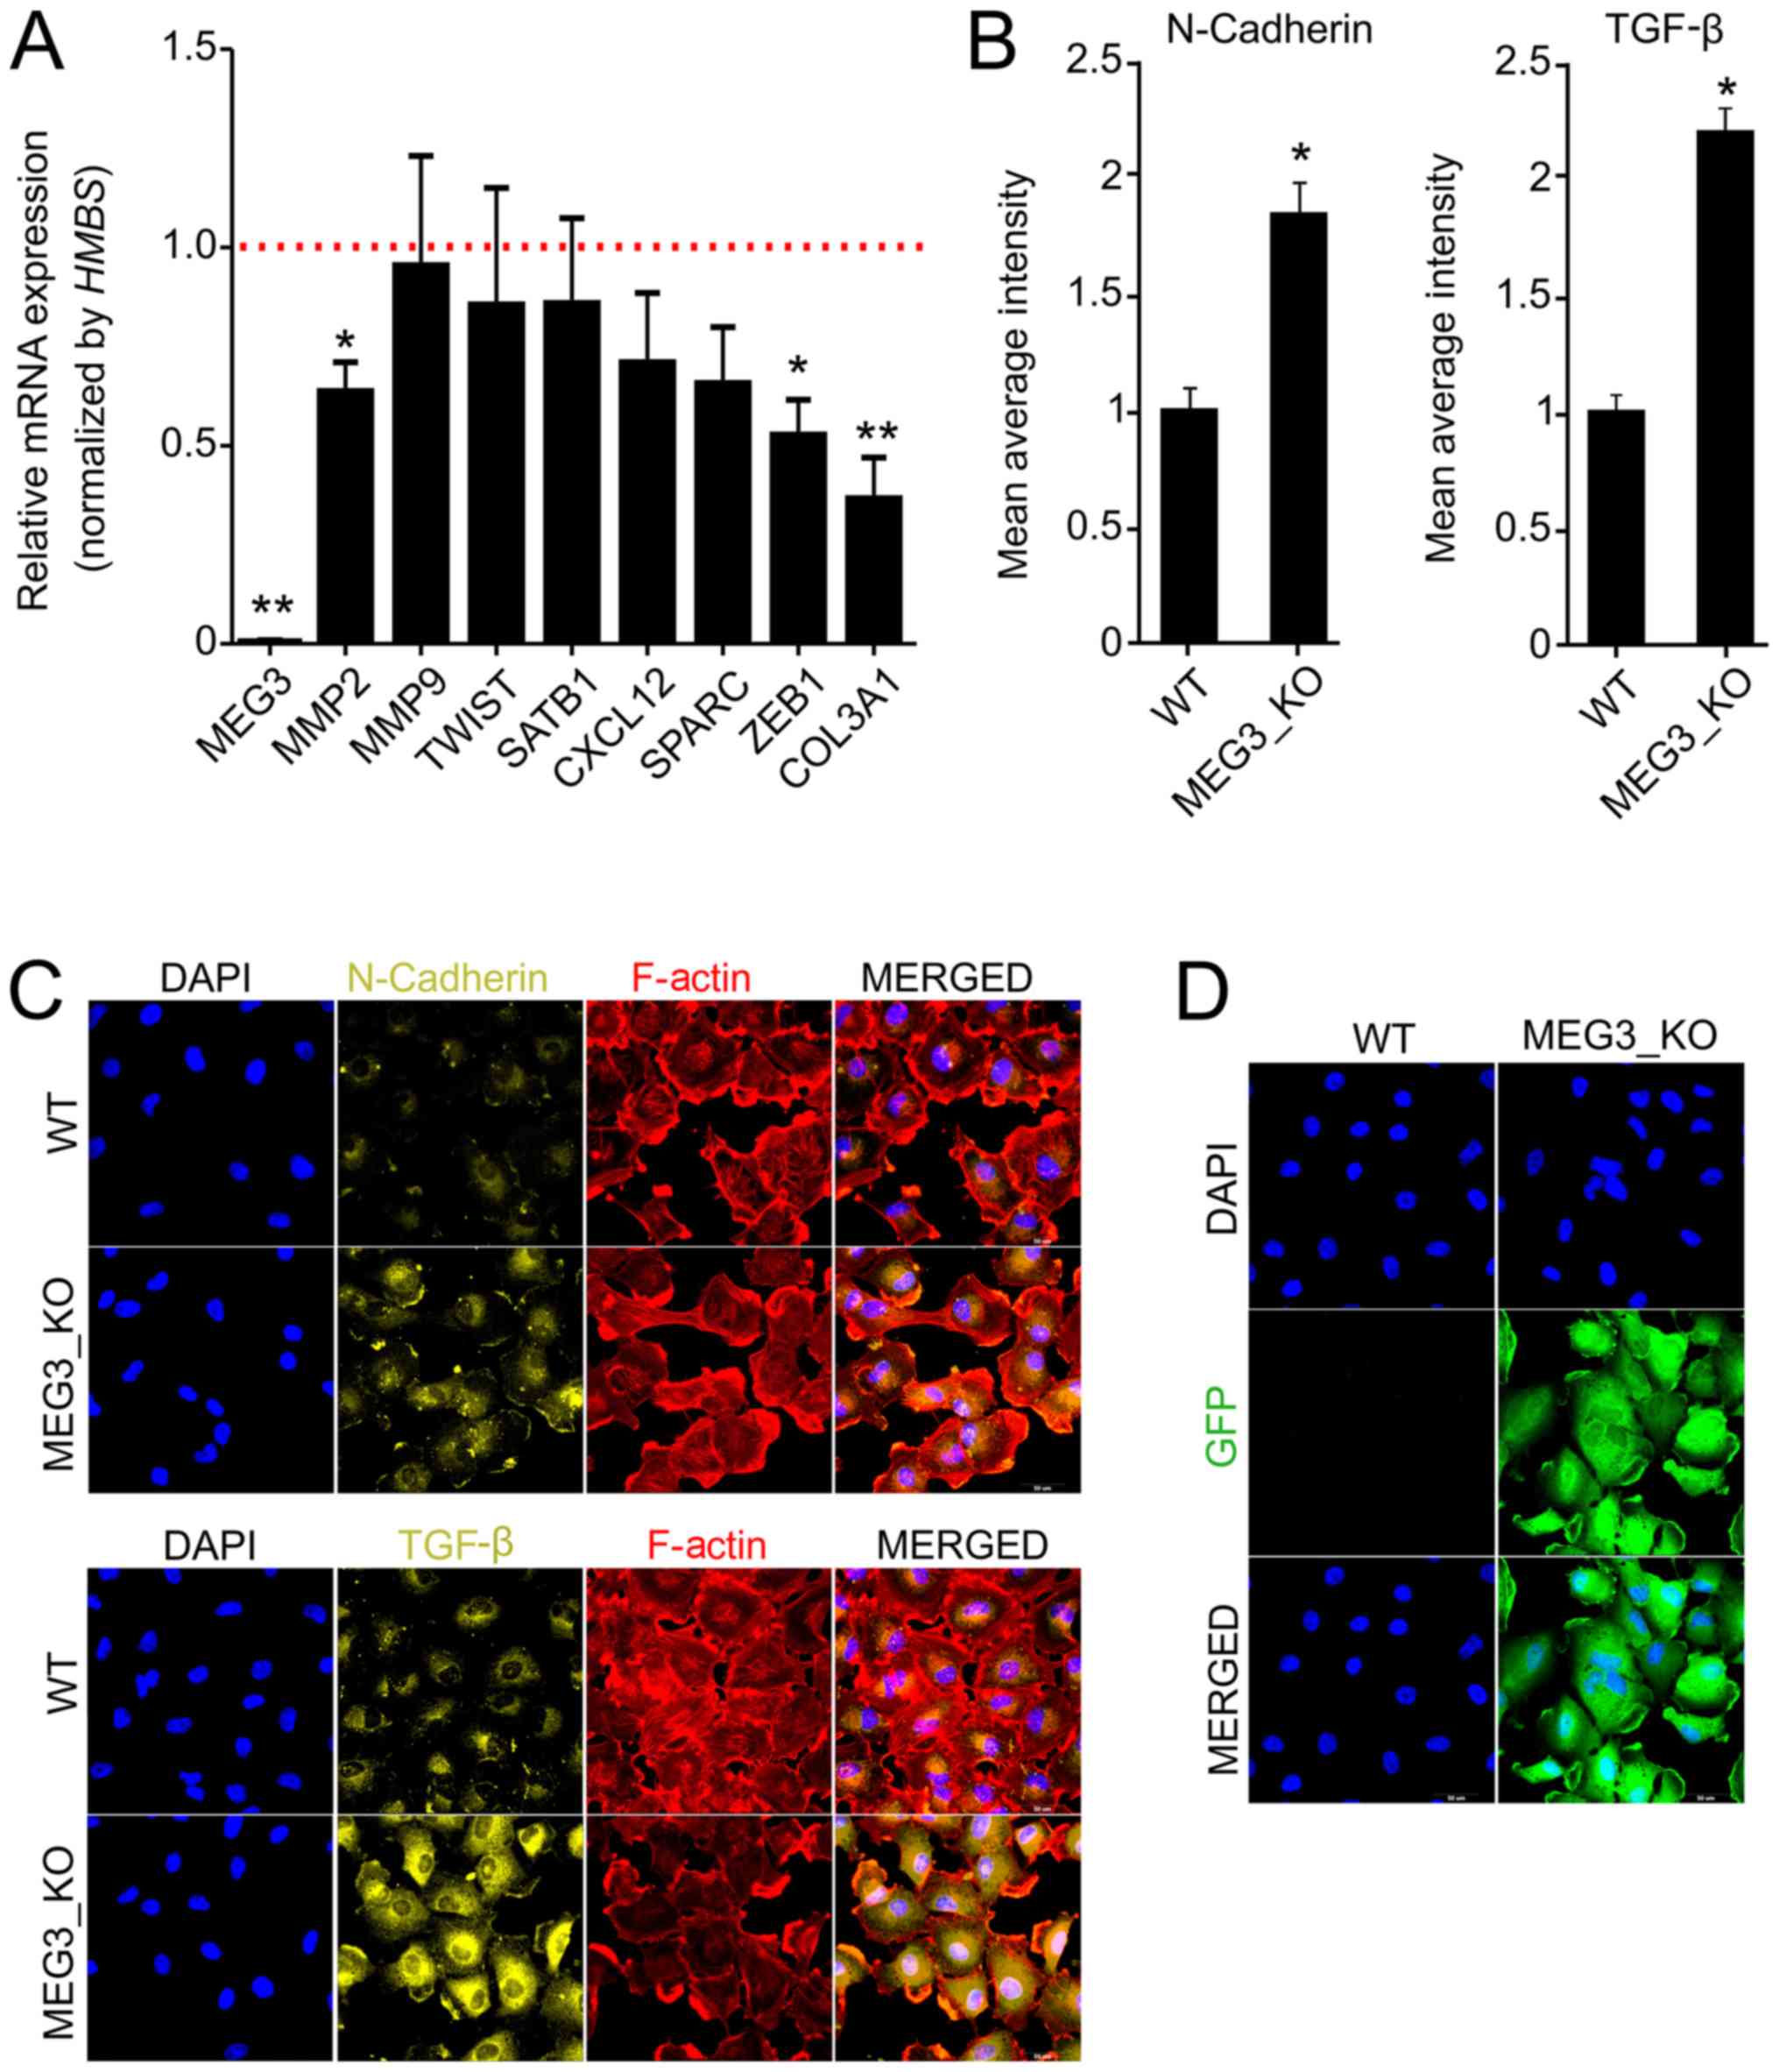 | Figure 3.MEG3 knockout alters the
expression of markers associated with cell invasiveness and
epithelial-mesenchymal transition. (A) Relative mRNA quantification
was carried out by reverse transcription-quantitative PCR using
Hs578T_WT and MEG3_KO (2 + 4) cell lines. Values are presented as
the mean ± SEM relative to the expression in the Hs578T_WT cell
line, after normalization using HMBS as an endogenous
control. The expression levels of the genes in the Hs578T-WT cell
line were set as 1, as indicated by the red dotted line. (n=3;
test-t). *P<0.05; **P<0.01 vs. Hs578T-WT. (B)
Immunofluorescence was performed to quantify the expression of
N-cadherin and TGF-β in cells. The fluorescence intensity of each
marker was quantified and the data presented are relative to WT
cells. A total of 20 images of each well were acquired and the data
represent the mean of the images acquired. Values are presented as
the mean ± SEM (n=3; test-t) relative to the expression in the
Hs578T_WT cell line. *P<0.05 vs. WT. (C) Representative
fluorescence microscopy images of each marker. Magnification, ×40.
(D) Fluorescence microscopy images revealing GFP expression in
MEG3_KO cells. Magnification, ×40. GFP (green), F-actin (red), DAPI
(blue), N-cadherin (yellow), TGF-β (yellow). Scale bars, 50 µm.
COL3A1, collagen type III αI chain; CXCL12, C-X-C motif chemokine
ligand 12; GFP, green fluorescent protein; HMBS,
hydroxymethylbilane synthase; KO, knockout; MEG3, maternally
expressed gene 3; MMP2, matrix metallopeptidase 2; MMP9, matrix
metallopeptidase 9; SATB1, SATB homeobox 1; SPARC, secreted protein
acidic and cysteine rich; TGF-β, transforming growth factor β; WT,
wild-type; ZEB1, zinc finger E-box binding homeobox 1. |
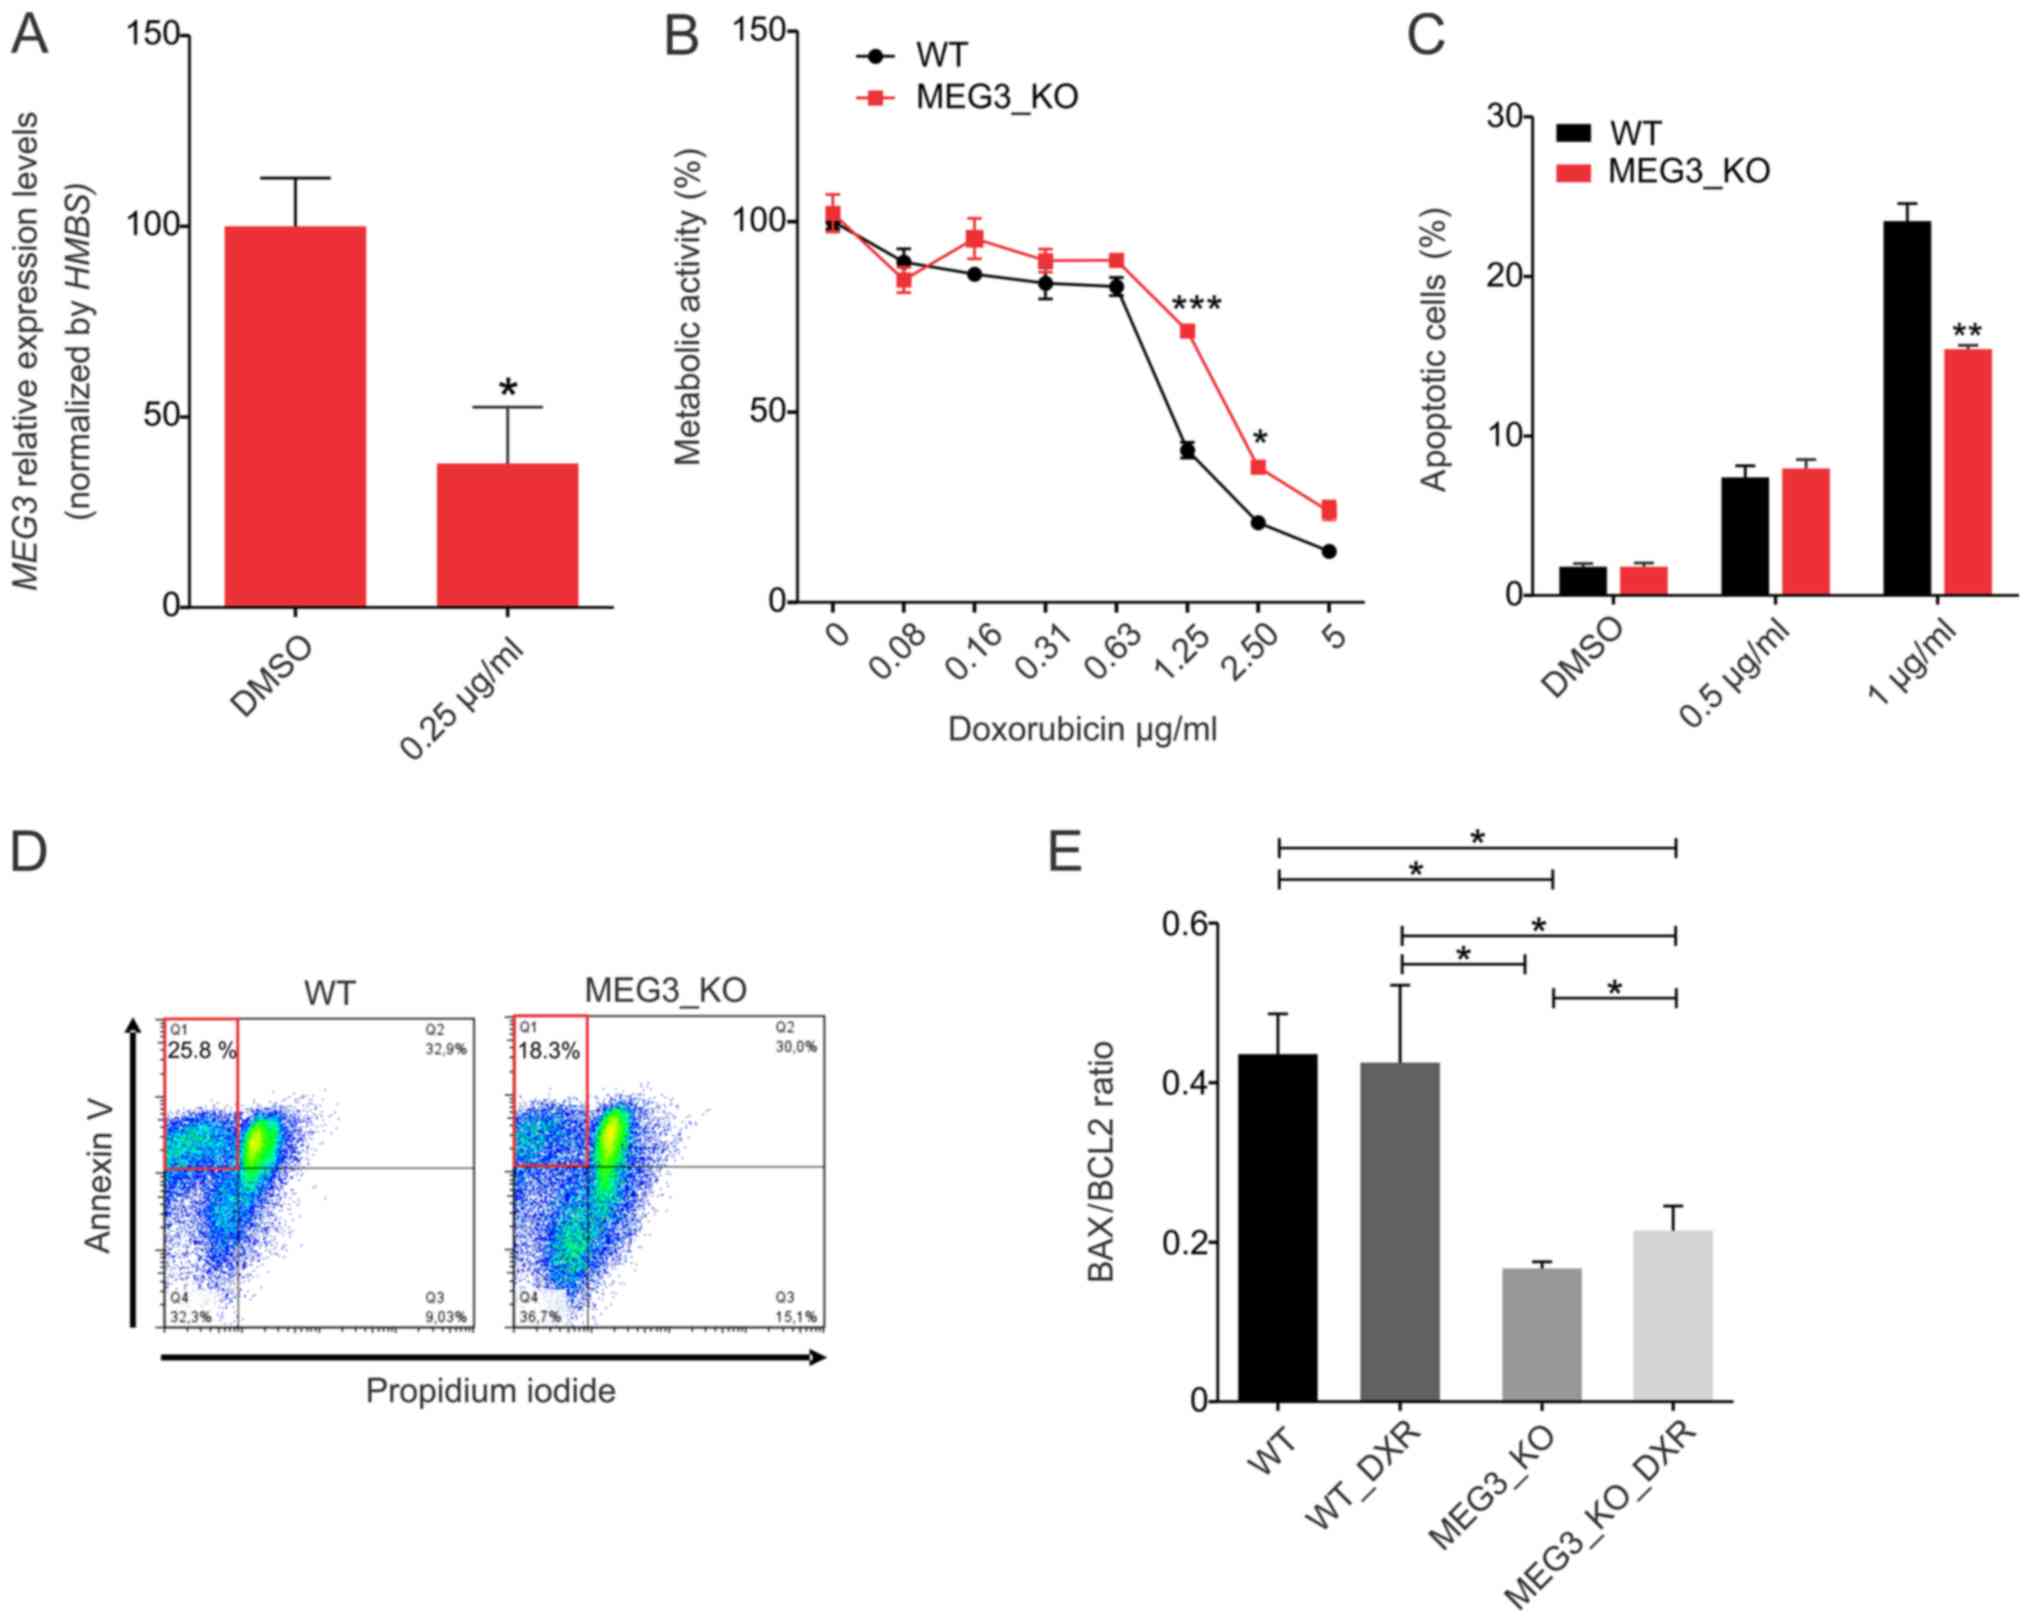
Effect of MEG3 knockout on
doxorubicin-induced apoptosis
MEG3 has previously been shown to contribute
to cisplatin resistance of lung cancer cells (34,35). To
verify whether MEG3 is involved in Hs578T cells
chemo-resistance, we treated parental cells with a sub-toxic
doxorubicin (DXR) concentration (0.25 µg/ml). We found that
MEG3 expression is significantly downregulated upon this
treatment, suggesting that this lncRNA may be involved with the
effect of DXR (Fig. 4A). Moreover,
it has been suggested that MEG3 exerts a pro-apoptotic
function in different cancer cell lines (12,14,36,37). To
extend these findings and determine how MEG3 may affect
breast cancer cell sensitivity to chemotherapy, we analyzed the
metabolic activity, using the MTT assay, upon cells exposure to
different concentrations of DXR for 24 h. We observed that MEG3_KO
cells were less sensitive to DXR treatment, when compared to
control cells, with significant differences at the concentration of
1.25 µg/ml (Fig. 4B).
We further analyzed the rate of appearance of
apoptotic cells following treatment with DXR using the Annexin-V
binding assay, confirming that this rate is not significantly
different when cells are treated for 24 h with 0.5 µg/ml DXR.
However, we found a significant resistance in DXR-induced apoptosis
when cells were treated with 1 µg/ml (Fig. 4C). The rate of cells undergoing
apoptosis was around 28% in Hs578T_WT cells, whereas no more than
18% of MEG3_KO cells were sensitive to this treatment, as
represented by the dot plot shown in Fig. 4D.
In parallel, we aimed at investigating the possible
relation of BAX (an apoptosis promoter) to BCL2 (an apoptosis
inhibitor) ratios with the DXR chemoresistance mediated by
MEG3. We found that MEG3_KO cells display a significant
reduction in BAX/BCL2 endogenous levels when compared to WT cells,
emphasizing the relationship between this lncRNA and the death
phenotype (Fig. 4E). We also
observed a significant increase of BAX/BCL2 ratio upon treatment in
MEG3_KO cell, nevertheless, not sufficient to reach BAX/BCL2
protein levels in WT cells.
Discussion
The versatile role of lncRNAs highlight their
relevance and the complexity of the signaling network in which they
are involved. Various functional mechanisms have been described for
lncRNAs, including recruitment of transcription factors, guiding
chromatin modifiers to specific genomic loci, allosteric modulation
of transcriptional regulatory proteins, alteration of nuclear
domains, modulation of translation and mRNA stability as well as
natural competing endogenous RNAs (5,8,9).
MEG3 is a maternally expressed imprinted
lncRNA gene, comprised of 10 exons located at chromosome 14q32
(38). Under physiological
conditions, it is found to be expressed in many normal tissues and
maternal deletion of the MEG3 gene in mice was shown to
cause skeletal muscle defects and perinatal death (39). Interestingly, MEG3 gene
expression is significantly reduced or completely lost in several
human cancers (10,12–14,23) as a
result of different events, including promoter hypermethylation,
hypermethylation of the intergenic differentially methylated region
as well as gene deletion (31).
MEG3 downregulation has been previously
suggested to be a potential prognostic factor for breast cancer
patients, representing an unfavorable risk factor with significant
correlation to patient survival (19–21).
Mechanistically, overexpression of MEG3 in MDA-MB-231 and
MCF-7 breast cancer cell lines promoted downregulation of AKT
signaling, which is pivotal for breast cancer cell growth, invasion
and tumor angiogenesis (22).
Additionally, MEG3 was shown to act through activation of
the p53 pathway, playing a role as a growth suppressor factor
(40,41). Importantly, these authors showed that
the secondary RNA folding structure of each MEG3 isoform is
essential to its function, promoting significant increase in p53
protein levels and stimulating the expression of p53 downstream
targets (40).
LncRNAs may regulate cancer cell migration by
targeting the Rho/ROCK signaling pathway (42). In our model, we found that
MEG3 deletion promoted cell migration, potentially through
induction of cytoskeleton rearrangement. Curiously, downregulated
MEG3 was previously associated with lymph node metastasis in
primary thyroid cancer (43). This
study showed that MEG3 suppresses the expression of Rac1
through a specific site in the 3′ UTR. This small signaling GTPase
exerts a critical regulatory role driving cell motility by
formation of lamellipodia (44),
confirming the involvement of MEG3 as a key regulator of
F-actin polymerization dynamic.
Here, we used the CRISPR/Cas9 system to analyze the
effects of MEG3 deletion in the TNBC Hs578T cell line.
Consistently, we found that KO cells display increased
proliferation rate and anchorage-independent growth, suggesting
greater tumorigenic potential of these cells. In parallel, using
Matrigel-coated inserts, we observed a decrease in cell invasion
capacity upon MEG3 deletion. Interestingly, integrated
analysis has identified MEG3 overexpression and their gene
regulation network as an important player in ovarian cancer EMT
(45). By genome-wide mapping, it
was shown that 73% of MEG3-regulated genes are EMT-linked
pathway factors. However, survival analysis showed no significant
correlation of MEG3 overexpression with overall patient
survival. Another study also described MEG3 as a regulatory
RNA for EMT in lung cancer cell lines (33). These authors showed that MEG3
knockdown inhibited EMT by antagonizing TGF-β-dependent changes in
the expression of EMT-related genes. Additionally, MEG3
overexpression caused significant changes in the expression of
CDH1, E-cadherin, ZEB1, ZEB2, miR-200a, and miR-200c but had no
effect in the expression of FN1/fibronectin, vimentin or JARID2. In
fact, Mondal and collaborators demonstrated that MEG3
represses the expression of TGF-β pathway genes through formation
of RNA-DNA triplex structures (46).
Our results show that MEG3 deletion alone leads to increased
TGF-β and N-cadherin protein levels and also promotes the reduction
of MMP2, ZEB1 and COL3A1 gene expression. These data
highlight the role of MEG3 in inhibiting cell migration by
regulating the TGF-β pathway however, the exact mechanisms by which
MEG3 regulates cell invasion in Hs578T cells and why this
effect may differ among different cell lines requires further
investigation.
The potential mechanisms involved in chemotherapy
drug resistance are largely unclear. Different studies have already
suggested that epigenetic alterations, such as histone methylation
and acetylation, may play a role in the development of drug
resistance (47). In a very
elaborate study, Li and collaborators have recently demonstrated
that MEG3 promoter methylation correlates with Chronic
Myeloid Leukemia tumor stages (48).
In that study, MEG3 expression was found to be reduced in
advanced phase of the disease, while the expression of methylation
related genes, such as DNMT1, DNMT3B, MBD2, MECP2 and
HDAC1, was found to be increased, when compared to controls.
We speculate that reduced MEG3 expression resulting from DXR
treatment may be due to induced promoter hypermethylation.
Moreover, it will be interesting to investigate whether the
promoter methylation status might be responsible for the discrepant
expression levels of MEG3 found in the Hs578T cell line.
MEG3 has been previously implicated in cell
death response, regulating intracellular signals triggering
apoptosis pathways (12,14,34–37).
Thus, MEG3 was shown to inhibit the intrinsic cell survival
pathway both in vitro and in vivo by reducing Bcl-2
protein expression, enhancing BAX protein levels and activating
caspase-3 in prostate cancer cells (14). Consistently, lung adenocarcinoma
patients with lower levels of MEG3 expression displayed
worse responses to cisplatin-based chemotherapy (35). MEG3-mediated chemosensitivity
enhancement in lung cancer cells was associated with induction of
cell-cycle arrest and increased apoptosis, through regulation of
p53, β-catenin and survivin, which are target genes of the
WNT/β-catenin signaling pathway (34). Here, we demonstrate that Hs578T
MEG3_KO cells display reduced ratios of BAX/BCL-2, consistent with
a higher resistance to a given apoptotic stimulus. Moreover,
MEG3_KO cells showed a slight increase in the ratio of these
factors upon treatment with DXR, however, this response is not
sufficient to restore the physiological BAX/BCL-2 levels, further
supporting a role for MEG3 as an important apoptosis
regulator.
In conclusion, lncRNAs are key components involved
in diverse biological processes and MEG3 has been previously
shown to exert regulatory functions in cell proliferation,
apoptosis, migration/invasion and angiogenesis. We confirmed the
overall tumorigenic effect of MEG3 deletion by CRISPR/Cas9
system in Hs578T cells, nevertheless, MEG3 was found to be
highly expressed in this cell line, suggesting that escape
mechanisms are used to counteract its growth suppressor functions,
but this need to be further investigated.
Taken together our results indicate that reduced
MEG3 expression in breast cancer tissues may contribute to
drug resistance in DXR-containing chemotherapy, nevertheless,
future therapeutic approaches to promote MEG3
expression/activation should be carefully considered given the
ability of MEG3 to modulate EMT factors, which may in turn,
promote metastasis. A more conclusive assessment of MEG3
function could benefit from patient derived samples. Also,
determining the sensitivity to apoptotic induction and MEG3
expression levels in different models should provide a better
understanding of the pathways involved and contribute to decision
making regarding patient treatment.
Acknowledgements
The authors would like to thank Dr Ana Marisa
Chudzinski-Tavassi (Center of Excellence for New Target Discovery,
Butantan Institute, São Paulo, Brazil) for expert advice on the
high-content screening assays, and Mr. Eduardo Osório Frare (Center
of Excellence for New Target Discovery, Butantan Institute, São
Paulo, Brazil) for antibody samples used in the immunofluorescence
assays. The authors would also like to thank Ms. Zizi de Mendonça,
Ms. Marluce da Cunha Mantovani and Mr. Alan Pereira dos Santos (all
Department of Internal Medicine, School of Medicine, University of
São Paulo, São Paulo, Brazil) for their technical support.
Funding
The present study was supported by the Brazilian
Federal Bank for Social and Economical Development (grant no.
09.2.1066.1), Federal Agency for Higher Education Training (grant
no. 88881.068070/2014-01), Brazilian National Council for Research
and Development (grant nos. 401430/2013-8, 457601/2013-2,
409960/2013-6, 426896/2016-5 and 465656/2014-5), São Paulo Research
State Foundation (grant no. 016/05311-2; Thematic Project),
Brazilian Federal Agency for Studies and Projects (grant nos.
01.08.0622.05, 51634-1AD and 01.08.0484.00), Brazilian Science and
Technology Ministry, and the Health Ministry. CDP received a
post-doctoral fellowship from the Brazilian National Council for
Research and Development (grant no. 401828/2012-3). RACM was the
recipient of pre-doctoral FAPESP fellowships (nos. 2016/05311-2 and
2013/23271-0). TM received undergraduate training support from the
Brazilian National Council for Research and Technology (CNPq; PIBIC
no. 147052/2016-5), and MCS is a recipient of a CNPq Productivity
Award (no. 3118/2015-6).
Availability of data and materials
The datasets used and/or analyzed during the present
study are available from the corresponding author on reasonable
request.
Authors' contributions
CDP and RACM developed the concept, designed and
performed experiments and wrote the article. TM cloned the
CRISPR/Cas9 constructs, generated the KO cell lines and performed
functional experiments. HCJF and ACOC performed functional
experiments. TFP performed Annexin-V/PI experiments and FACS
analysis. MCS contributed to the conception and design of the
study, data interpretation, and drafting and critical revision of
the manuscript, and approved the manuscript for publication. All
authors read and approved the final version of the manuscript.
Ethics approval and consent to
participate
Not applicable.
Patient consent for publication
Not applicable.
Competing interests
The authors declare that they have no competing
interests.
References
|
1
|
Guttman M, Amit I, Garber M, French C, Lin
MF, Feldser D, Huarte M, Zuk O, Carey BW, Cassady JP, et al:
Chromatin signature reveals over a thousand highly conserved large
non-coding RNAs in mammals. Nature. 458:223–227. 2009. View Article : Google Scholar : PubMed/NCBI
|
|
2
|
Qureshi IA and Mehler MF: Emerging roles
of non-coding RNAs in brain evolution, development, plasticity and
disease. Nat Rev Neurosci. 13:528–541. 2012. View Article : Google Scholar : PubMed/NCBI
|
|
3
|
Esteller M: Non-coding RNAs in human
disease. Nat Rev Genet. 12:861–874. 2011. View Article : Google Scholar : PubMed/NCBI
|
|
4
|
Calore F, Lovat F and Garofalo M:
Non-coding RNAs and cancer. Int J Mol Sci. 14:17085–17110. 2013.
View Article : Google Scholar : PubMed/NCBI
|
|
5
|
Rinn JL and Chang HY: Genome regulation by
long noncoding RNAs. Annu Rev Biochem. 81:145–166. 2012. View Article : Google Scholar : PubMed/NCBI
|
|
6
|
Zhao Y, Li H, Fang S, Kang Y, Wu W, Hao Y,
Li Z, Bu D, Sun N, Zhang MQ and Chen R: NONCODE 2016: An
informative and valuable data source of long non-coding RNAs.
Nucleic Acids Res. 44(D1): D203–D208. 2016. View Article : Google Scholar : PubMed/NCBI
|
|
7
|
Li S, Li B, Zheng Y, Li M, Shi L and Pu X:
Exploring functions of long noncoding RNAs across multiple cancers
through co-expression network. Sci Rep. 7:7542017. View Article : Google Scholar : PubMed/NCBI
|
|
8
|
Fatica A and Bozzoni I: Long non-coding
RNAs: New players in cell differentiation and development. Nat Rev
Genet. 15:7–21. 2014. View Article : Google Scholar : PubMed/NCBI
|
|
9
|
Long Y, Wang X, Youmans DT and Cech TR:
How do lncRNAs regulate transcription? Sci Adv. 3:eaao21102017.
View Article : Google Scholar : PubMed/NCBI
|
|
10
|
Zhang X, Zhou Y, Mehta KR, Danila DC,
Scolavino S, Johnson SR and Klibanski A: A pituitary-derived MEG3
isoform functions as a growth suppressor in tumor cells. J Clin
Endocrinol Metab. 88:5119–5126. 2003. View Article : Google Scholar : PubMed/NCBI
|
|
11
|
Gibb EA, Brown CJ and Lam WL: The
functional role of long non-coding RNA in human carcinomas. Mol
Cancer. 10:382011. View Article : Google Scholar : PubMed/NCBI
|
|
12
|
Zhang J, Yao T, Wang Y, Yu J, Liu Y and
Lin Z: Long noncoding RNA MEG3 is downregulated in cervical cancer
and affects cell proliferation and apoptosis by regulating miR-21.
Cancer Biol Ther. 17:104–113. 2016. View Article : Google Scholar : PubMed/NCBI
|
|
13
|
Wang P, Ren Z and Sun P: Overexpression of
the long non-coding RNA MEG3 impairs in vitro glioma cell
proliferation. J Cell Biochem. 113:1868–1874. 2012. View Article : Google Scholar : PubMed/NCBI
|
|
14
|
Luo G, Wang M, Wu X, Tao D, Xiao X, Wang
L, Min F, Zeng F and Jiang G: Long non-coding RNA MEG3 inhibits
cell proliferation and induces apoptosis in prostate cancer. Cell
Physiol Biochem. 37:2209–2220. 2015. View Article : Google Scholar : PubMed/NCBI
|
|
15
|
Bray F, Ferlay J, Soerjomataram I, Siegel
RL, Torre LA and Jemal A: Global cancer statistics 2018: GLOBOCAN
estimates of incidence and mortality worldwide for 36 cancers in
185 countries. CA Cancer J Clin. 68:394–424. 2018. View Article : Google Scholar : PubMed/NCBI
|
|
16
|
Siegel RL, Miller KD and Jemal A: Cancer
statistics, 2018. CA Cancer J Clin. 68:7–30. 2018. View Article : Google Scholar : PubMed/NCBI
|
|
17
|
Dai X, Li T, Bai Z, Yang Y, Liu X, Zhan J
and Shi B: Breast cancer intrinsic subtype classification, clinical
use and future trends. Am J Cancer Res. 5:2929–2943.
2015.PubMed/NCBI
|
|
18
|
Abramson VG, Lehmann BD, Ballinger TJ and
Pietenpol JA: Subtyping of triple-negative breast cancer:
Implications for therapy. Cancer. 121:8–16. 2015. View Article : Google Scholar : PubMed/NCBI
|
|
19
|
Zhang JJ, Guo SH and Jia BQ:
Down-regulation of long non-coding RNA MEG3 serves as an
unfavorable risk factor for survival of patients with breast
cancer. Eur Rev Med Pharmacol Sci. 20:5143–5147. 2016.PubMed/NCBI
|
|
20
|
Tian T, Wang M, Lin S, Guo Y, Dai Z, Liu
K, Yang P, Dai C, Zhu Y, Zheng Y, et al: The impact of lncRNA
dysregulation on clinicopathology and survival of breast cancer: A
systematic review and meta-analysis. Mol Ther Nucleic Acids.
12:359–369. 2018. View Article : Google Scholar : PubMed/NCBI
|
|
21
|
Cui X, Yi Q, Jing X, Huang Y, Tian J, Long
C, Xiang Z, Liu J, Zhang C, Tan B, et al: Mining prognostic
significance of MEG3 in human breast cancer using bioinformatics
analysis. Cell Physiol Biochem. 50:41–51. 2018. View Article : Google Scholar : PubMed/NCBI
|
|
22
|
Zhang CY, Yu MS, Li X, Zhang Z, Han CR and
Yan B: Overexpression of long non-coding RNA MEG3 suppresses breast
cancer cell proliferation, invasion, and angiogenesis through AKT
pathway. Tumour Biol. 39:10104283177013112017.PubMed/NCBI
|
|
23
|
Sun L, Li Y and Yang B: Downregulated long
non-coding RNA MEG3 in breast cancer regulates proliferation,
migration and invasion by depending on p53's transcriptional
activity. Biochem Biophys Res Commun. 478:323–329. 2016. View Article : Google Scholar : PubMed/NCBI
|
|
24
|
Ran FA, Hsu PD, Wright J, Agarwala V,
Scott DA and Zhang F: Genome engineering using the CRISPR-Cas9
system. Nat Protoc. 8:2281–2308. 2013. View Article : Google Scholar : PubMed/NCBI
|
|
25
|
Sánchez-Rivera FJ and Jacks T:
Applications of the CRISPR-Cas9 system in cancer biology. Nat Rev
Cancer. 15:387–395. 2015. View Article : Google Scholar : PubMed/NCBI
|
|
26
|
Wang H, La Russa M and Qi LS: CRISPR/Cas9
in genome editing and beyond. Annu Rev Biochem. 85:227–264. 2016.
View Article : Google Scholar : PubMed/NCBI
|
|
27
|
Liu SJ, Horlbeck MA, Cho SW, Birk HS,
Malatesta M, He D, Attenello FJ, Villalta JE, Cho MY, Chen Y, et
al: CRISPRi-based genome-scale identification of functional long
noncoding RNA loci in human cells. Science. 355(pii): aah71112017.
View Article : Google Scholar : PubMed/NCBI
|
|
28
|
Chen W, Zhang G, Li J, Zhang X, Huang S,
Xiang S, Hu X and Liu C: CRISPRlnc: A manually curated database of
validated sgRNAs for lncRNAs. Nucleic Acids Res. 47:D63–D68. 2019.
View Article : Google Scholar : PubMed/NCBI
|
|
29
|
Goyal A, Myacheva K, Groß M, Klingenberg
M, Duran Arqué B and Diederichs S: Challenges of CRISPR/Cas9
applications for long non-coding RNA genes. Nucleic Acids Res.
45:e122017.PubMed/NCBI
|
|
30
|
Pfaffl MW: A new mathematical model for
relative quantification in real-time RT-PCR. Nucleic Acids Res.
29:e452001. View Article : Google Scholar : PubMed/NCBI
|
|
31
|
Zhou Y, Zhang X and Klibanski A: MEG3
noncoding RNA: A tumor suppressor. J Mol Endocrinol. 48:R45–R53.
2012. View Article : Google Scholar : PubMed/NCBI
|
|
32
|
Olson MF and Sahai E: The actin
cytoskeleton in cancer cell motility. Clin Exp Metastasis.
26:273–287. 2009. View Article : Google Scholar : PubMed/NCBI
|
|
33
|
Terashima M, Tange S, Ishimura A and
Suzuki T: MEG3 long noncoding RNA contributes to the epigenetic
regulation of epithelial-mesenchymal transition in lung cancer cell
lines. J Biol Chem. 292:82–99. 2017. View Article : Google Scholar : PubMed/NCBI
|
|
34
|
Xia Y, He Z, Liu B, Wang P and Chen Y:
Downregulation of Meg3 enhances cisplatin resistance of lung cancer
cells through activation of the WNT/β-catenin signaling pathway.
Mol Med Rep. 12:4530–4537. 2015. View Article : Google Scholar : PubMed/NCBI
|
|
35
|
Liu J, Wan L, Lu K, Sun M, Pan X, Zhang P,
Lu B, Liu G and Wang Z: The long noncoding RNA MEG3 contributes to
cisplatin resistance of human lung adenocarcinoma. PLoS One.
10:e01145862015. View Article : Google Scholar : PubMed/NCBI
|
|
36
|
Zhao H, Wang X, Feng X, Li X, Pan L, Liu
J, Wang F, Yuan Z, Yang L, Yu J, et al: Long non-coding RNA MEG3
regulates proliferation, apoptosis and autophagy and is associated
with prognosis in glioma. J Neurooncol. 140:281–288. 2018.
View Article : Google Scholar : PubMed/NCBI
|
|
37
|
Shi Y, Lv C, Shi L and Tu G: MEG3 inhibits
proliferation and invasion and promotes apoptosis of human
osteosarcoma cells. Oncol Lett. 15:1917–1923. 2018.PubMed/NCBI
|
|
38
|
Miyoshi N, Wagatsuma H, Wakana S,
Shiroishi T, Nomura M, Aisaka K, Kohda T, Surani MA, Kaneko-Ishino
T and Ishino F: Identification of an imprinted gene, Meg3/Gtl2 and
its human homologue MEG3, first mapped on mouse distal chromosome
12 and human chromosome 14q. Genes Cells. 5:211–220. 2000.
View Article : Google Scholar : PubMed/NCBI
|
|
39
|
Zhou Y, Cheunsuchon P, Nakayama Y, Lawlor
MW, Zhong Y, Rice KA, Zhang L, Zhang X, Gordon FE, Lidov HG, et al:
Activation of paternally expressed genes and perinatal death caused
by deletion of the Gtl2 gene. Development. 137:2643–2652. 2010.
View Article : Google Scholar : PubMed/NCBI
|
|
40
|
Zhou Y, Zhong Y, Wang Y, Zhang X, Batista
DL, Gejman R, Ansell PJ, Zhao J, Weng C and Klibanski A: Activation
of p53 by MEG3 non-coding RNA. J Biol Chem. 282:24731–24742. 2007.
View Article : Google Scholar : PubMed/NCBI
|
|
41
|
Zhang X, Rice K, Wang Y, Chen W, Zhong Y,
Nakayama Y, Zhou Y and Klibanski A: Maternally expressed gene 3
(MEG3) noncoding ribonucleic acid: Isoform structure, expression,
and functions. Endocrinology. 151:939–947. 2010. View Article : Google Scholar : PubMed/NCBI
|
|
42
|
Tang Y, He Y, Zhang P, Wang J, Fan C, Yang
L, Xiong F, Zhang S, Gong Z, Nie S, et al: LncRNAs regulate the
cytoskeleton and related Rho/ROCK signaling in cancer metastasis.
Mol Cancer. 17:772018. View Article : Google Scholar : PubMed/NCBI
|
|
43
|
Wang C, Yan G, Zhang Y, Jia X and Bu P:
Long non-coding RNA MEG3 suppresses migration and invasion of
thyroid carcinoma by targeting of Rac1. Neoplasma. 62:541–549.
2015. View Article : Google Scholar : PubMed/NCBI
|
|
44
|
Parri M and Chiarugi P: Rac and Rho
GTPases in cancer cell motility control. Cell Commun Signal.
8:232010. View Article : Google Scholar : PubMed/NCBI
|
|
45
|
Mitra R, Chen X, Greenawalt EJ, Maulik U,
Jiang W, Zhao Z and Eischen CM: Decoding critical long non-coding
RNA in ovarian cancer epithelial-to-mesenchymal transition. Nat
Commun. 8:16042017. View Article : Google Scholar : PubMed/NCBI
|
|
46
|
Mondal T, Subhash S, Vaid R, Enroth S,
Uday S, Reinius B, Mitra S, Mohammed A, James AR, Hoberg E, et al:
MEG3 long noncoding RNA regulates the TGF-β pathway genes through
formation of RNA-DNA triplex structures. Nat Commun. 6:77432015.
View Article : Google Scholar : PubMed/NCBI
|
|
47
|
Housman G, Byler S, Heerboth S, Lapinska
K, Longacre M, Snyder N and Sarkar S: Drug resistance in cancer: An
overview. Cancers (Basel). 6:1769–1792. 2014. View Article : Google Scholar : PubMed/NCBI
|
|
48
|
Li ZY, Yang L, Liu XJ, Wang XZ, Pan YX and
Luo JM: The long noncoding RNA MEG3 and its target miR-147 regulate
JAK/STAT pathway in advanced chronic myeloid leukemia.
EBioMedicine. 34:61–75. 2018. View Article : Google Scholar : PubMed/NCBI
|