Introduction
Glioma is the most common primary malignant tumor in
the central nervous system (1).
Despite surgery and radiotherapy, chemotherapy and targeted
therapy, the majority of malignant gliomas still recur (2,3), which
is primarily due to chemo-radiotherapy resistance (4). Previous studies have demonstrated that
intra-tumor heterogeneity (ITH) is the main cause underlying
resistance to current therapy methods and, ultimately, glioma
recurrence (5–8).
ITH was first described by Rudolf Virchow in the
1800s (9), which involved genetic
heterogeneity. Subsequently, Peter Nowell put forward the theory of
‘Clonal Evolution of Tumor Cell Populations’ in 1976 (10). Nowell noted that natural selection
gives rise to tumor subclones and that ITH is a basis for tumor
evolution (10). With the
development of DNA sequencing technology, an increasing number of
studies (11,12) support this hypothesis. Several
studies have analyzed ITH at multiple loci in tumors or by using
single cell sequencing (13,14). However, it would be difficult to
implement these methods in large-scale analyses of clinical
samples.
Mutant-allele tumor heterogeneity (MATH) values are
indicators of gene mutation dispersion that were developed by Mroz
and Rocco (15). These values are
based on whole-exome sequencing (WES) of tumor tissues. Sub-clonal
mutations and copy-number aberrations can influence MATH values
(15). Importantly, ITH can be
quantified by comparing the fraction of tumor gene mutations to
that of normal gene mutations, as has been reported in head and
neck (16), rectal (17), breast (18), and lung cancer (19).
The present study calculated MATH values of low
grade glioma (LGG) and glioblastoma (GBM) samples using data from
The Cancer Genome Atlas (TCGA) database. Subsequently, the
distributions of MATH values in different glioma subtypes were
analyzed. Furthermore, the results of gene expression enrichment
analysis in cohorts with different MATH levels were reported.
Finally, the association between MATH levels and glioma recurrence
was verified, and a nomogram table was built to predict the
probabilities of glioma recurrence-free survival (RFS) time.
Materials and methods
Patients and clinical variables
The whole data (LGG and GBM; obtained from 41
clinical centers) used in the present study were downloaded from
the TCGA database (https://portal.gdc.cancer.gov; project ID: TCGA-LGG
and TCGA-GBM, downloaded on April 3, 2018). Clinical data were
obtained for 515 patients with LGG and 596 patients with GBM. WES
data were obtained for 508 patients with LGG and 390 patients with
GBM. RNA sequencing data were obtained for 529 patients with LGG
and 174 patients with GBM. Cases of recurrent status with
uncertainty, contradiction or lack of clinical data were excluded.
Isocitrate dehydrogenase (NADP(+)) (IDH)1/2 gene
mutation status was obtained from the WES data. Recurrence status,
recurrence time, histological type, World Health Organization (WHO)
grade (2007 WHO classification) and clinical information were
obtained from the clinical follow-up data.
Generation of MATH values
MATH values were calculated according to the method
described by Mroz and Rocco (15,16). The
‘t_ref_count’ and ‘t_alt_count’ items in the WES data were
selected. To obtain the MATH value, the mutant-allele fraction
(MAF), median MAF value (mMAF) and median absolute deviation (MAD)
were successively calculated to obtain the equation: MATH =
100*MAD/mMAF. The aforementioned calculations were performed using
R (version 3.5.0); http://www.r-project.org).
Generation of cut-off values
RFS data and MATH values were combined using the
Euclidean distance of the receiver operating characteristic (ROC)
curve to obtain the cut-off values of the MATH values. The whole
patients were separated into high- and low-MATH groups. Similarly,
the present study obtained the MATH cut-off values in different
subtypes including: The IDH-mutant (mut), IDH-wild-type (wt), grade
II, grade III, grade IV (GBM), oligodendroglioma, oligo-astrocytoma
and astrocytoma groups. Using these cut-off values, the patients
were divided into high- and low-MATH groups.
Statistical analysis
The Kolmogorov-Smirnov test (test of normality),
unpaired t-test, one-way ANOVA followed by least significant
difference post hoc test, χ2 test and Cox regression
analysis were performed using SPSS v25.0 (IBM Corp.). Kaplan-Meier
analysis and log-rank tests were carried out using STATA v15.0
(StataCorp LP). The nomogram and calibration analyses were
performed using R (version 3.5.0). The discrimination and
calibration of the nomogram were validated by discrimination using
ROC curve and calibration curve analyses, respectively. FunRich
(version 3.1.3; http://funrich.org/download) was used for DNA mutation
enrichment analysis of 460 patients with 13,663 mutations in the
low-MATH group and 427 patients with 15,174 mutations in the
high-MATH group, and gene set enrichment analysis (GSEA; version
3.0; http://software.broadinstitute.org/gsea/index.jsp) was
used for RNA enrichment analysis. The χ2 test was used
to compare the DNA mutation rates of patients with different MATH
levels. P<0.05 was considered to indicate a statistically
significant difference.
Results
MATH values in different cohorts of
patients with glioma
The present study screened a total of 757 patients
with complete clinical and total exon sequencing information
(Table SI). The obtained MATH
values exhibited a normal distribution according to the
Kolmogorov-Smirnov test (Fig. 1A).
Since the IDH1/2 gene is a vital molecular marker that influences
glioma prognosis (20), the present
study first investigated the association between MATH values and
IDH mutation status. The MATH values were significantly higher in
the IDH-wt glioma group than in the IDH-mut glioma group (Fig. 1B). As the MATH value reflected the
gene ITH, the results indicated that ITH levels were higher in the
IDH-wt group than in the IDH-mut group. Furthermore, MATH values
were significantly higher in GBM than in oligodendroglioma and
oligo-astrocytoma. However, there was no significant difference
observed in MATH values between the GBM and astrocytoma groups
(P=0.126; Fig. 1C). Finally, MATH
values were positively associated with glioma WHO grade. MATH
values were significantly higher in grade IV glioma than in grade
II and III glioma (Fig. 1D). These
data indicated that among glioma types, GBM had the highest ITH
level.
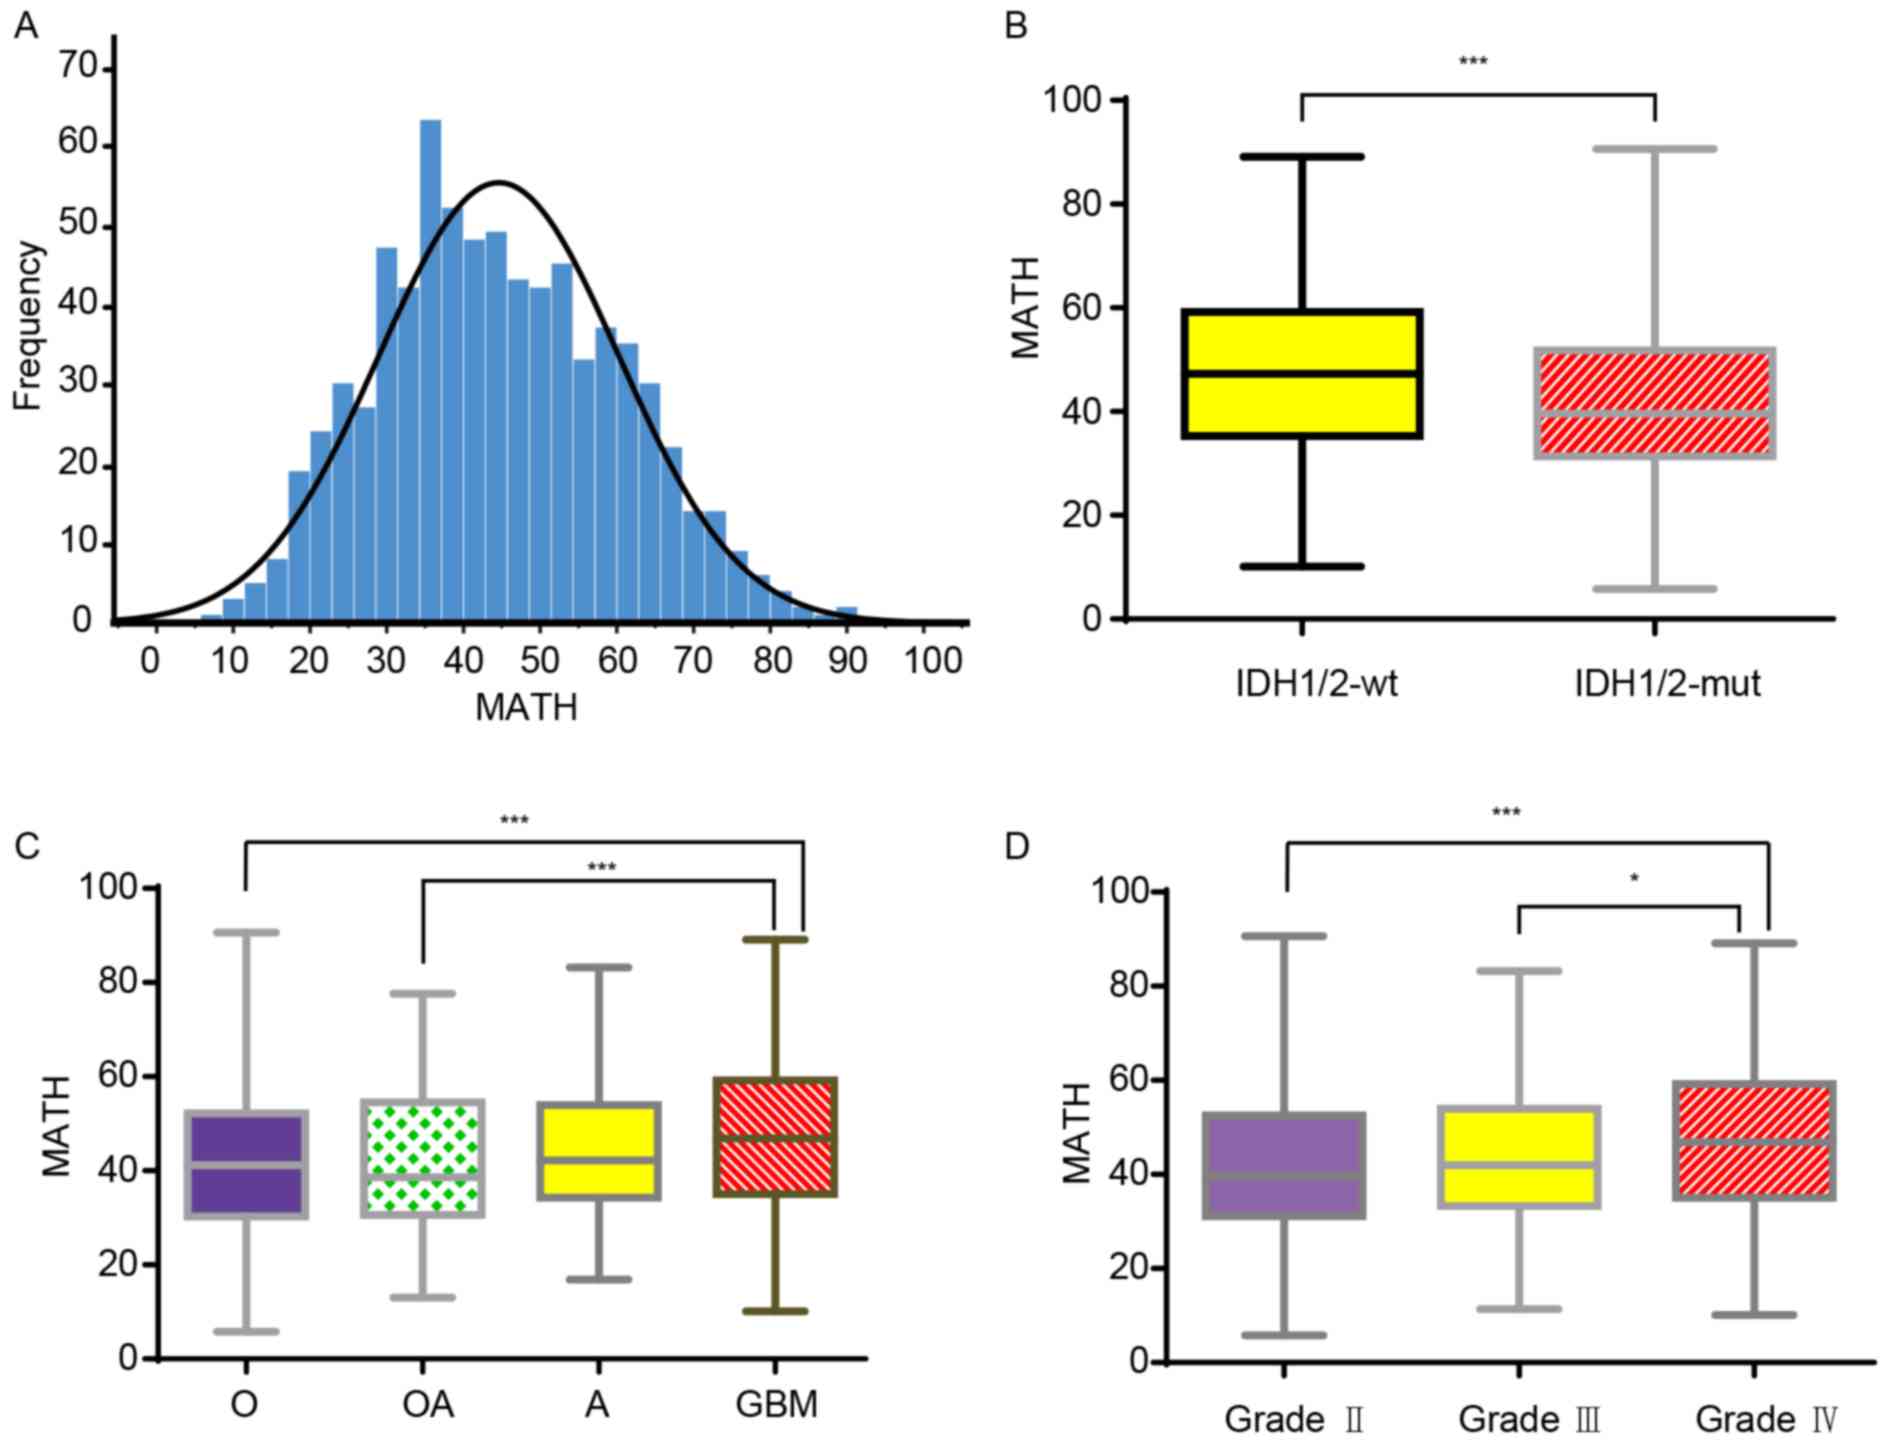 | Figure 1.MATH values in different glioma
subtypes. (A) Distribution of MATH values among all patients with
glioma (LGG and GBM). The MATH values ranged between 5.81 and
90.60, with a mean of 44.61 and a median of 43.28. (B) Boxplot
showing the MATH values of patients with different IDH1/2 glioma
types. The MATH values found in IDH1/2-wt ranged between 10.12 and
89.15, with a mean of 47.37±16.03. The MATH values found in
patients with IDH1/2-mut ranged between 5.81 and 90.60, with a mean
of 41.68±14.70. (C) Boxplot showing the MATH values found in
patients with glioma with different histological classifications.
The MATH values in O, OA, A and GBM were 41.39±15.17, 42.18±15.26,
44.52±14.56 and 46.86±16.13, respectively, and the ranges were
5.81–90.60, 13.07–77.60, 16.87–83.22 and 10.12–89.15, respectively.
(D) Boxplot showing the MATH values obtained for patients with
different World Health Organization grades of glioma. The MATH
values obtained in grade II, III and IV were 41.77±15.15,
43.62±14.84 and 46.86±16.13, respectively, and the ranges were
5.81–90.60, 11.40–83.22 and 10.12–89.15, respectively. Data are
presented as the mean ± SD. *P<0.05, ***P<0.001. A,
astrocytoma; GBM, glioblastoma; IDH, isocitrate dehydrogenase
(NADP(+)); LGG, low grade glioma; MATH, mutant-allele
tumor heterogeneity; mt, mutant; O, oligodendroglioma; OA,
olio-astrocytoma; wt, wild-type. |
MATH values and the interval to
recurrence are negatively associated
Kaplan-Meier analysis of all patients was performed
and suitable cut-off values were utilized to divide the patients
with glioma into low- and high-MATH groups. The RFS rates were 43%
at 1 year and 17% at 2 years in the high-MATH group and 56 and 28%,
respectively, in the low-MATH group. Therefore, the RFS rates were
higher in the low-MATH group compared with in the high-MATH group
(P=0.001). These results demonstrated that MATH values were
negatively associated with the interval to glioma RFS (Fig. 2A).
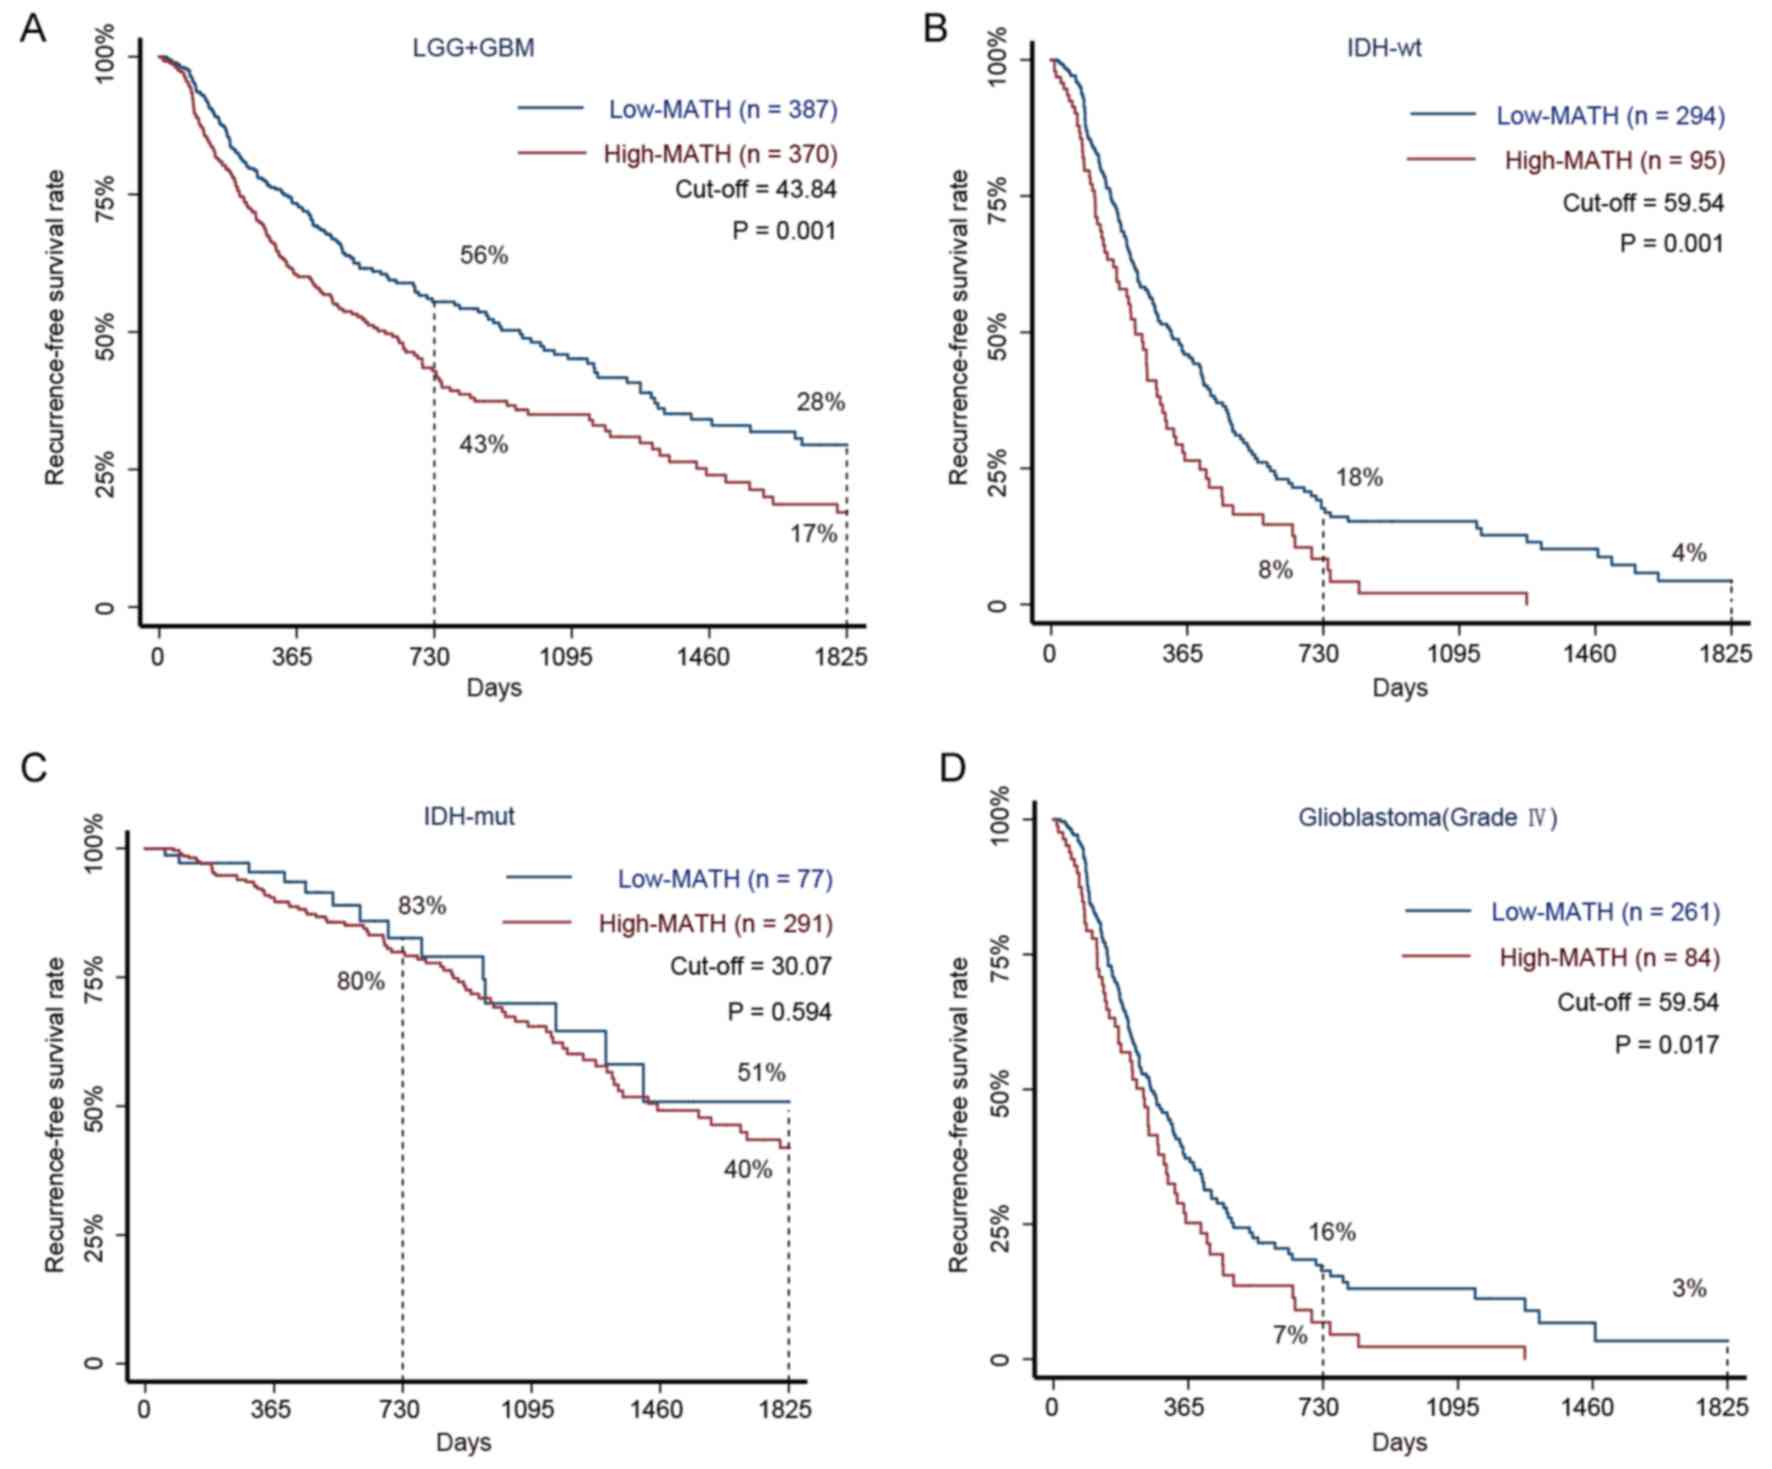 | Figure 2.Kaplan-Meier survival curves for
patients with glioma with high and low MATH levels. (A) The 5-year
RFS rate in 757 patients with glioma (LGG and GBM) with high and
low MATH levels. Among patients in the low-MATH group, the RFS
rates were 56% at 2 years and 28% at 5 years, whereas the rates
were 43 and 17%, respectively, in the high-MATH group (P=0.001).
(B) The 5-year RFS rate in 389 patients with glioma with the IDH-wt
subtype and high or low MATH levels. The Kaplan-Meier estimates
revealed RFS rates of 18% at 2 years and 4% at 5 years in the
low-MATH group compared with respective rates of 8 and <0.001%
in the high-MATH group (P=0.001). (C) The 5-year RFS rates in 368
patients with the IDH-mut subtype and high or low MATH levels.
Patients in the low-MATH group had an RFS rate of 83% at 2 years
and 51% at 5 years, whereas the corresponding rates were 80 and 40%
in the high-MATH group (P=0.594). (D) The 5-year RFS rates in 345
patients with GBM with high or low MATH levels. Patients in the
low-MATH group had RFS rates of 16% at 2 years and 3% at 5 years,
whereas those in the high-MATH group had rates of 7 and <0.1%,
respectively (P=0.017). The log-rank test was used to determine
significance. GBM, glioblastoma; IDH, isocitrate dehydrogenase
(NADP(+)); LGG, low grade glioma; MATH, mutant-allele
tumor heterogeneity; mut, mutant; RFS, recurrence-free survival;
wt, wild-type. |
Patients with glioma with IDH1/2-wt are predicted to
have a poor prognosis (20).
However, the present study revealed that in the IDH1/2-wt cohort,
the interval to neoplastic recurrence was significantly longer in
low-MATH patients than in high-MATH patients (Fig. 2B). Similarly, although patients with
GBM have been reported to have the shortest interval to recurrence
among all patients with malignant glioma (21), the present study revealed that
prognoses were significantly improved in patients with GBM with low
MATH levels compared with those with high MATH levels (Fig. 2D). In the IDH1/2-mut cohort, glioma
MATH levels were not observed to significantly influence the 5-year
RFS rate (Fig. 2C).
Gene mutation and expression
enrichment in glioma groups with different MATH levels
The patients were divided into low- and high-MATH
groups according to the cut-off value shown in Fig. 2A, and then genetic mutations were
analyzed in the two groups. The present study revealed that the
mutation frequency of single genes distinguished the two groups
from each other. It was observed that seven genes [IDH1, tumor
protein p53 (TP53), titin (TTN), ATRX chromatin remodeler (ATRX),
capicua transcriptional repressor, mucin 16 (MUC16) and epidermal
growth factor receptor (EGFR)] were hypermutated in the low-MATH
group (frequency >10%; Fig. 3A),
whereas 13 genes (TTN, TP53, IDH1, MUC16, ATRX, PTEN, EGFR,
obscurin cytoskeletal calmodulin and titin-interacting RhoGEF,
filaggrin, neurofibromin 1, mucin 17, dynein axonemal heavy chain 3
and LDL receptor related protein 2) were hypermutated in the
high-MATH group (Fig. 3B).
Therefore, six genes (IDH1, TP53, TTN, ATRX, MUC16 and EGFR) were
hypermutated in the low- and high-MATH groups. Using a
χ2 test, it was identified that while the difference in
TP53 was not significant (P=0.91), the mutation sample frequencies
of IDH1 and ATRX were significantly lower in the high-MATH group,
whereas the mutation sample frequencies of TTN, MUC16 and EGFR were
significantly higher in the high-MATH group (Fig. 3C).
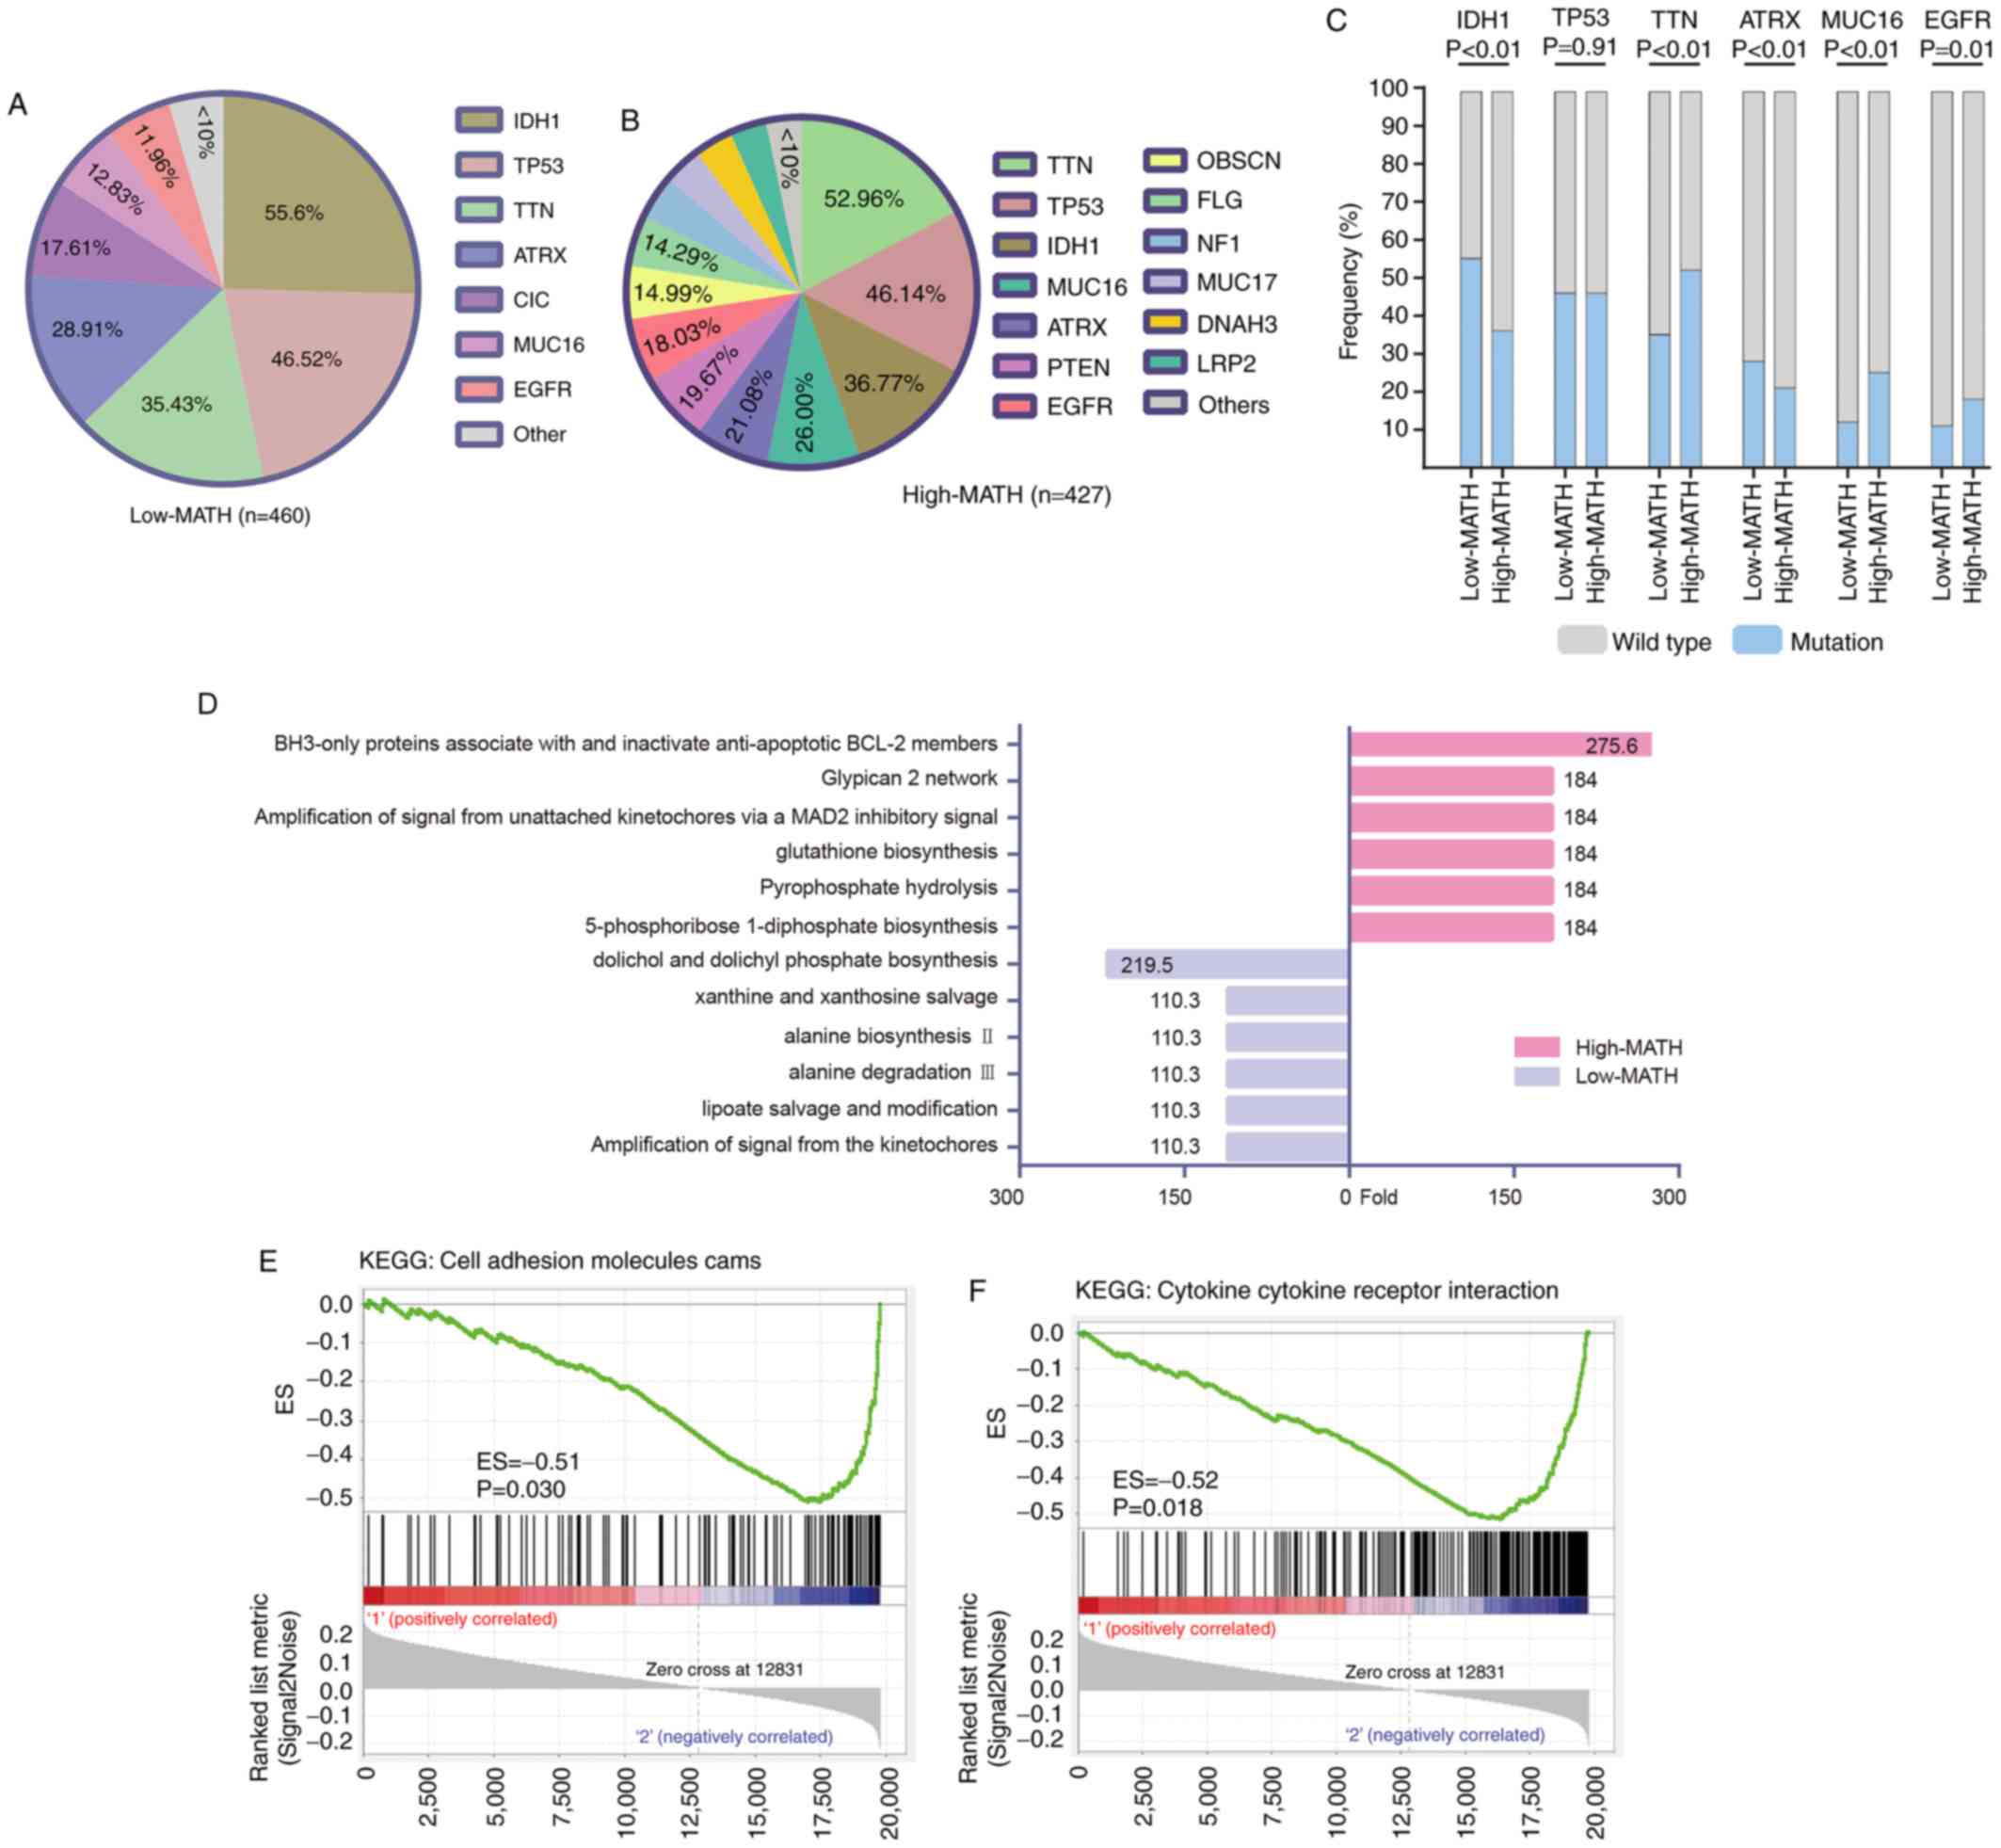 | Figure 3.Somatic mutation sample frequency
pattern analysis and gene set enrichment analysis. (A) Mutated
genes with higher sample frequency in the low-MATH group of
patients. (B) Mutated genes with higher sample frequency in the
high-MATH group of patients. (C) Comparison of six common high
sample frequency mutation genes (IDH1, TP53, TTN, ATRX, MUC16 and
EGFR) at different levels in the MATH group. Comparisons were made
using the χ2 test. (D) Mutated genes enriched in
biological pathways with fold-changes >100. Compared with
low-MATH glioma, high-MATH glioma exhibited more gene mutations in
the BH3 anti-apoptotic signaling pathway and fewer in the dolichyl
phosphate biosynthesis signaling pathway. The gene expression set
observed in the high-MATH group was enriched in (E) ‘cell adhesion
molecules cams’ (P=0.030; FDR q<0.25) and (F) ‘cytokine cytokine
receptor interaction’ signaling pathways (P=0.018; FDR q<0.25).
ATRX, ATRX chromatin remodeler; CIC, capicua transcriptional
repressor; DNAH3, dynein axonemal heavy chain 3; EGFR, epidermal
growth factor receptor; ES, enrichment score; FDR, false discovery
rate; FLG, filaggrin; IDH1, isocitrate dehydrogenase
(NADP(+)) 1; KEGG, Kyoto Encyclopedia of Genes and
Genomes; LRP2, LDL receptor related protein 2; MATH, mutant-allele
tumor heterogeneity; MUC16, mucin 16; MUC17, mucin 17; NF1,
neurofibromin 1; OBSCN, obscurin, cytoskeletal calmodulin and
titin-interacting RhoGEF; TP53, tumor protein p53; TTN, titin. |
Furthermore, DNA mutation enrichment analysis
demonstrated that enriched and depleted pathways in the high-MATH
group were different from those in the low-MATH group (Fig. 3D). Finally, GSEA indicated that there
were differences in the expression patterns of the ‘cell adhesion
molecules cams’ (Fig. 3E) and
‘cytokine cytokine receptor interaction’ signaling pathways
(Fig. 3F).
Nomogram based on MATH predicts glioma
RFS probability
The present study utilized Cox regression analysis
to screen for key factors associated with glioma recurrence. In
univariate Cox regression analysis, race and the mutation status of
the MUC16 gene had no effect on glioma recurrence. The results of
the multivariate Cox regression analysis suggested that MATH level,
the mutation status of two genes (IDH and TTN), and four clinical
characteristics (age, sex, WHO grade and histological
classification) had a significant influence on glioma recurrence.
However, the mutation status of the other three genes assessed
(TP53, ATRX and EGFR) was not closely associated with recurrence
(Table I).
 | Table I.Univariate and multivariate Cox
analyses for factors with a significant influence on glioma
recurrence. |
Table I.
Univariate and multivariate Cox
analyses for factors with a significant influence on glioma
recurrence.
|
| Univariate
analysis | Multivariate
analysis |
|---|
|
|
|
|
|---|
| Clinical and
molecular factors (n=757) | HR | 95% CI | P-value | HR | 95% CI | P-value |
|---|
| Age (18–45 years
=1, 46–65 years =2, >65 years =3) | 2.270 | 1.951–2.641 | <0.001 | 1.011 | 1.508–1.547 | 0.011 |
| Sex (male =1,
female =0) | 1.354 | 1.902–1.679 | 0.006 | 0.705 | 0.571–0.888 | 0.003 |
| Ethnicity (Asian
=1, Black or African American=2, White =3, Other =4) | 1.050 | 0.919–1.198 | 0.474 | / | / | / |
| MATH (0–25=1,
25–50=2,50–75=3,75–100=4) | 1.307 | 1.123–1.521 | 0.001 | 1.198 | 1.037–1.410 | 0.015 |
| WHO grade (G2=2,
G3=3, GBM=4) | 3.081 | 2.632–3.607 | <0.001 | 1.478 | 1.118–1.976 | 0.006 |
| Histological
classification (Oligodendroglioma =1, Oligoastrocytoma =2,
Astrocytoma =3, GBM =4) | 2.107 | 1.876–2.367 | <0.001 | 1.214 | 1.012–1.473 | 0.037 |
| IDH1/2 (wild type
=0, mutated type =1) | 0.172 | 0.136–0.217 | <0.001 | 0.364 | 0.261–0.561 | <0.001 |
| TTN (wild type =0,
mutated type =1) | 1.340 | 1.050–1.697 | 0.018 | 0.782 | 0.599–0.992 | 0.043 |
| MUC16 (wild type
=0, mutated type =1) | 1.010 | 0.724–1.402 | 0.965 | / | / | / |
| TP53 (wild type =0,
mutated type =1) | 0.622 | 0.501–0.772 | <0.001 | 0.792 | 0.607–1.011 | 0.061 |
| ATRX (wild type =0,
mutated type =1) | 0.499 | 0.382–0.652 | <0.001 | 1.171 | 0.802–1.561 | 0.508 |
| EGFR (wild type =0,
mutated type =1) | 2.130 | 1.601–2.834 | <0.001 | 0.949 | 0.686–1.254 | 0.625 |
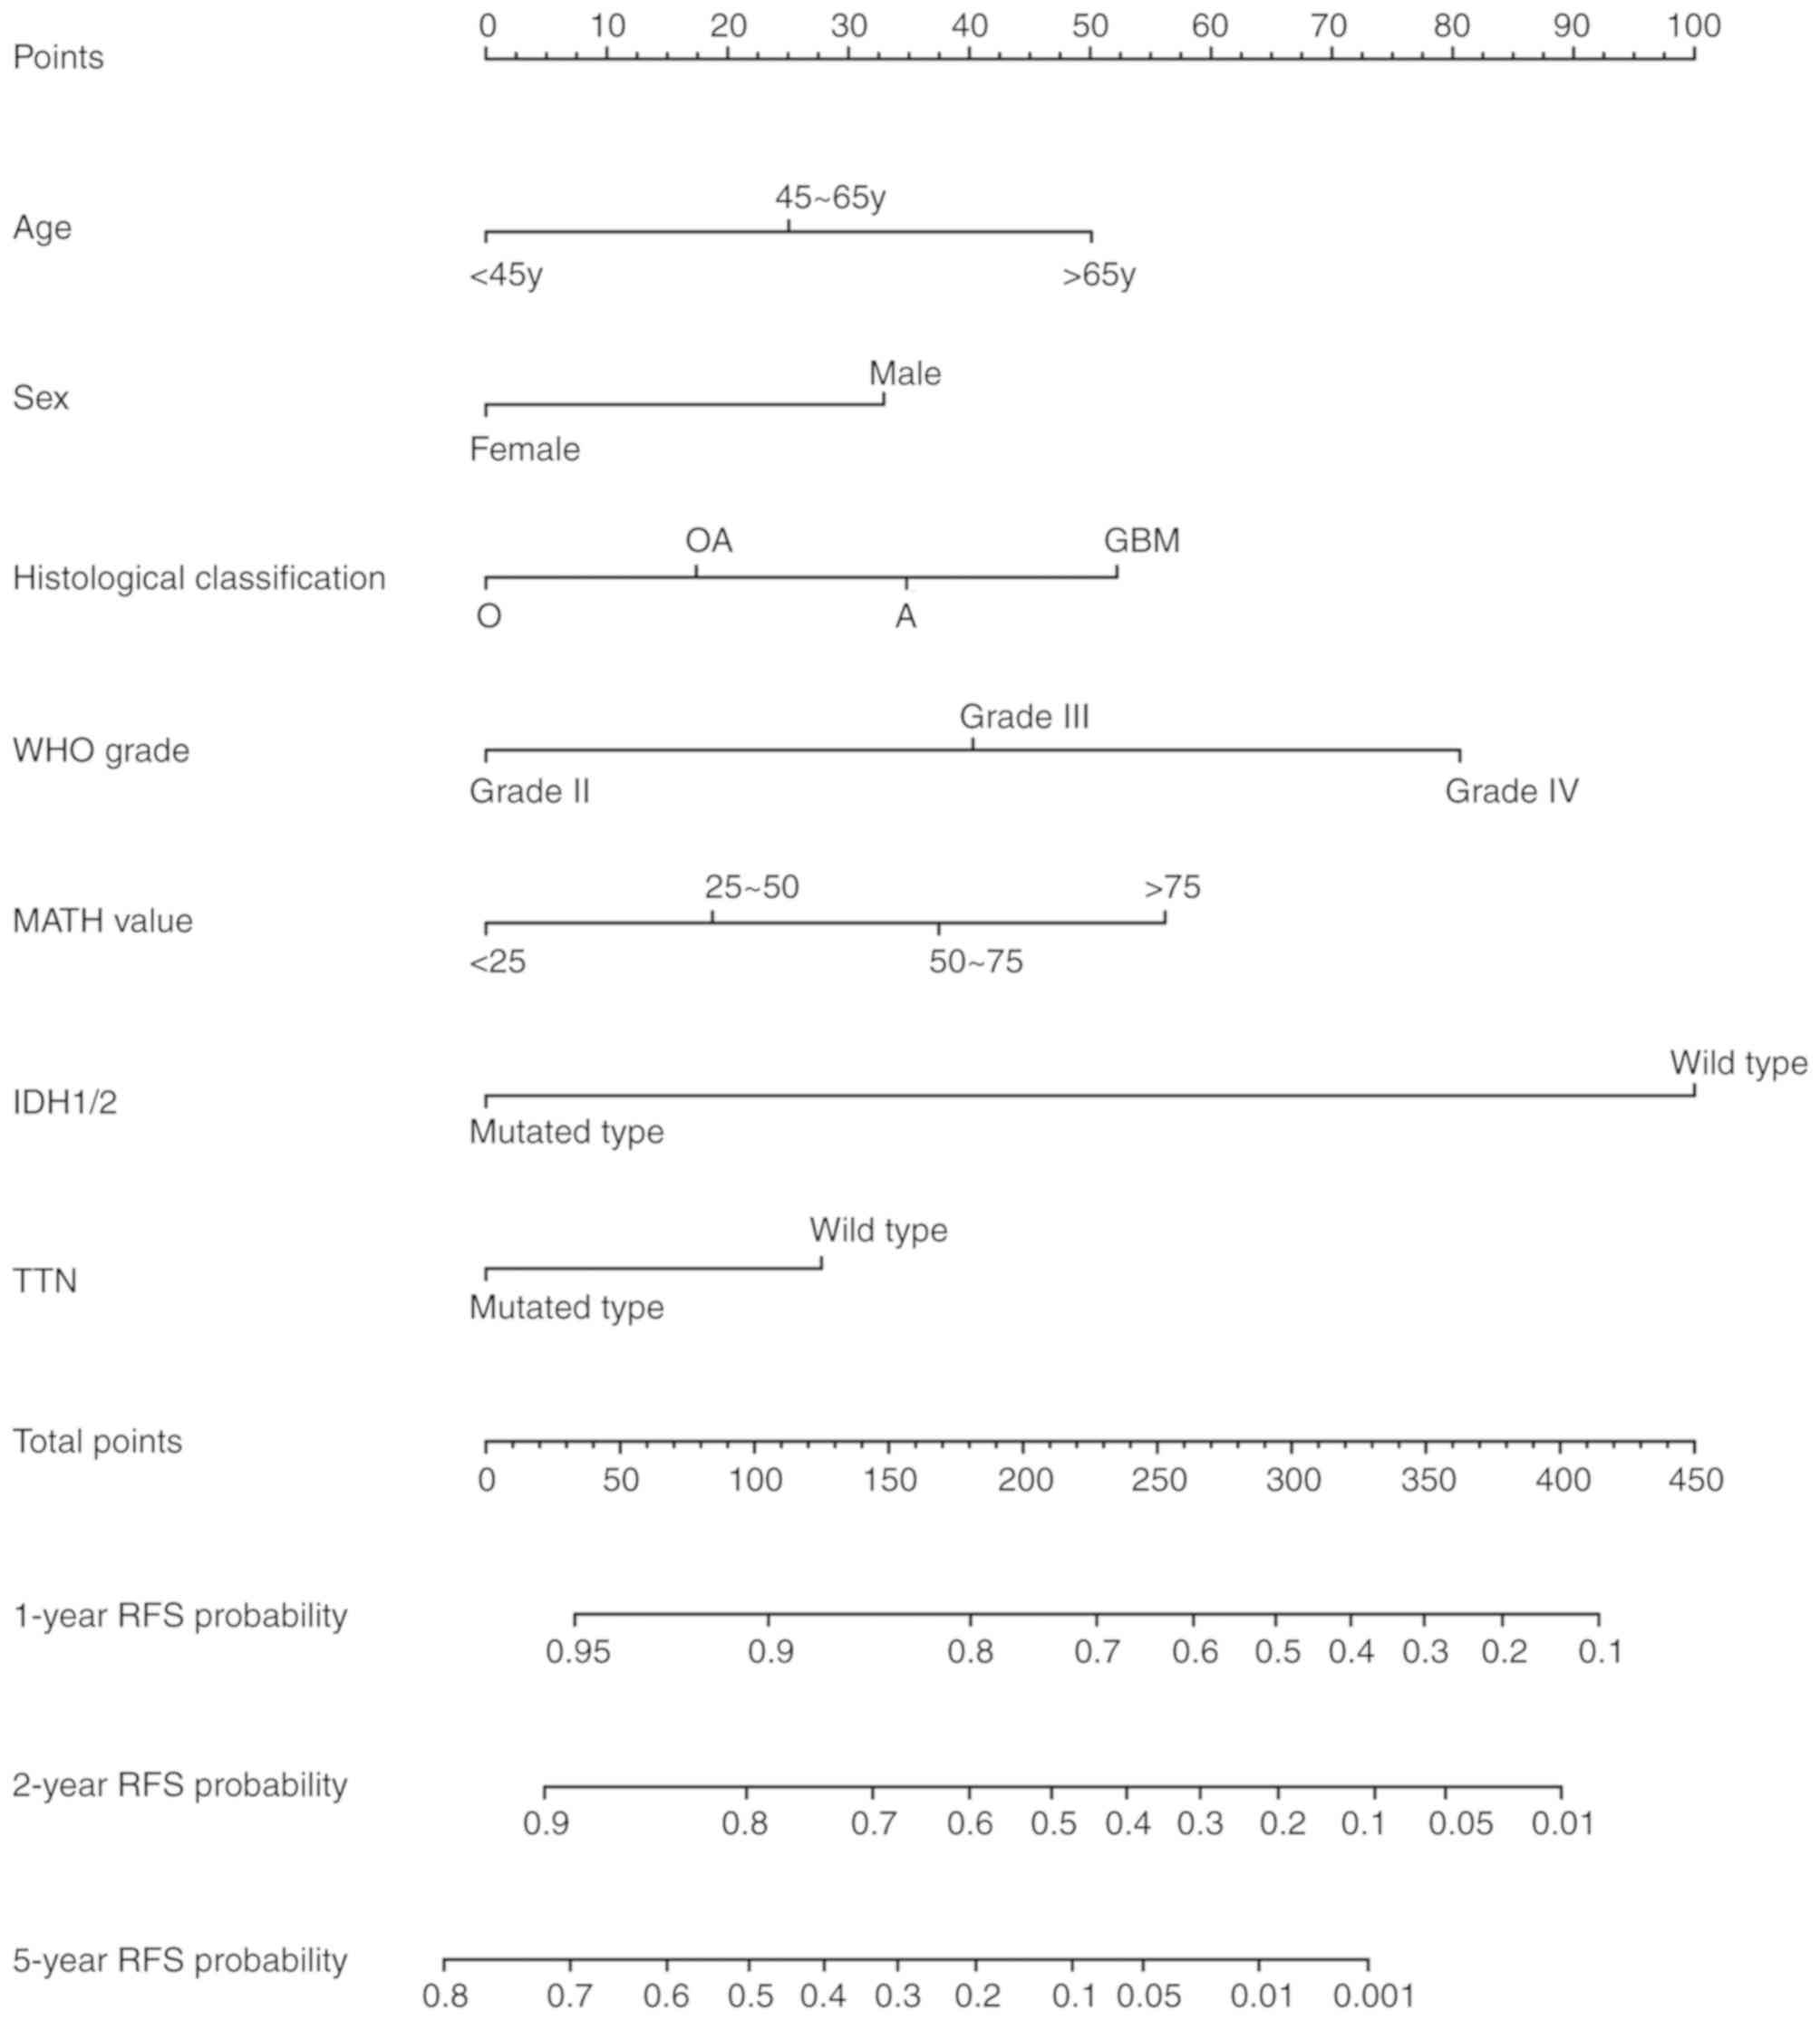
Based on the results of the multivariate Cox
regression analysis, the present study developed a nomogram table
to predict the probabilities of glioma RFS within 1, 2 and 5 years.
The total scores shown in the nomogram table reflect the sum of all
significant factors, and were positively associated with glioma
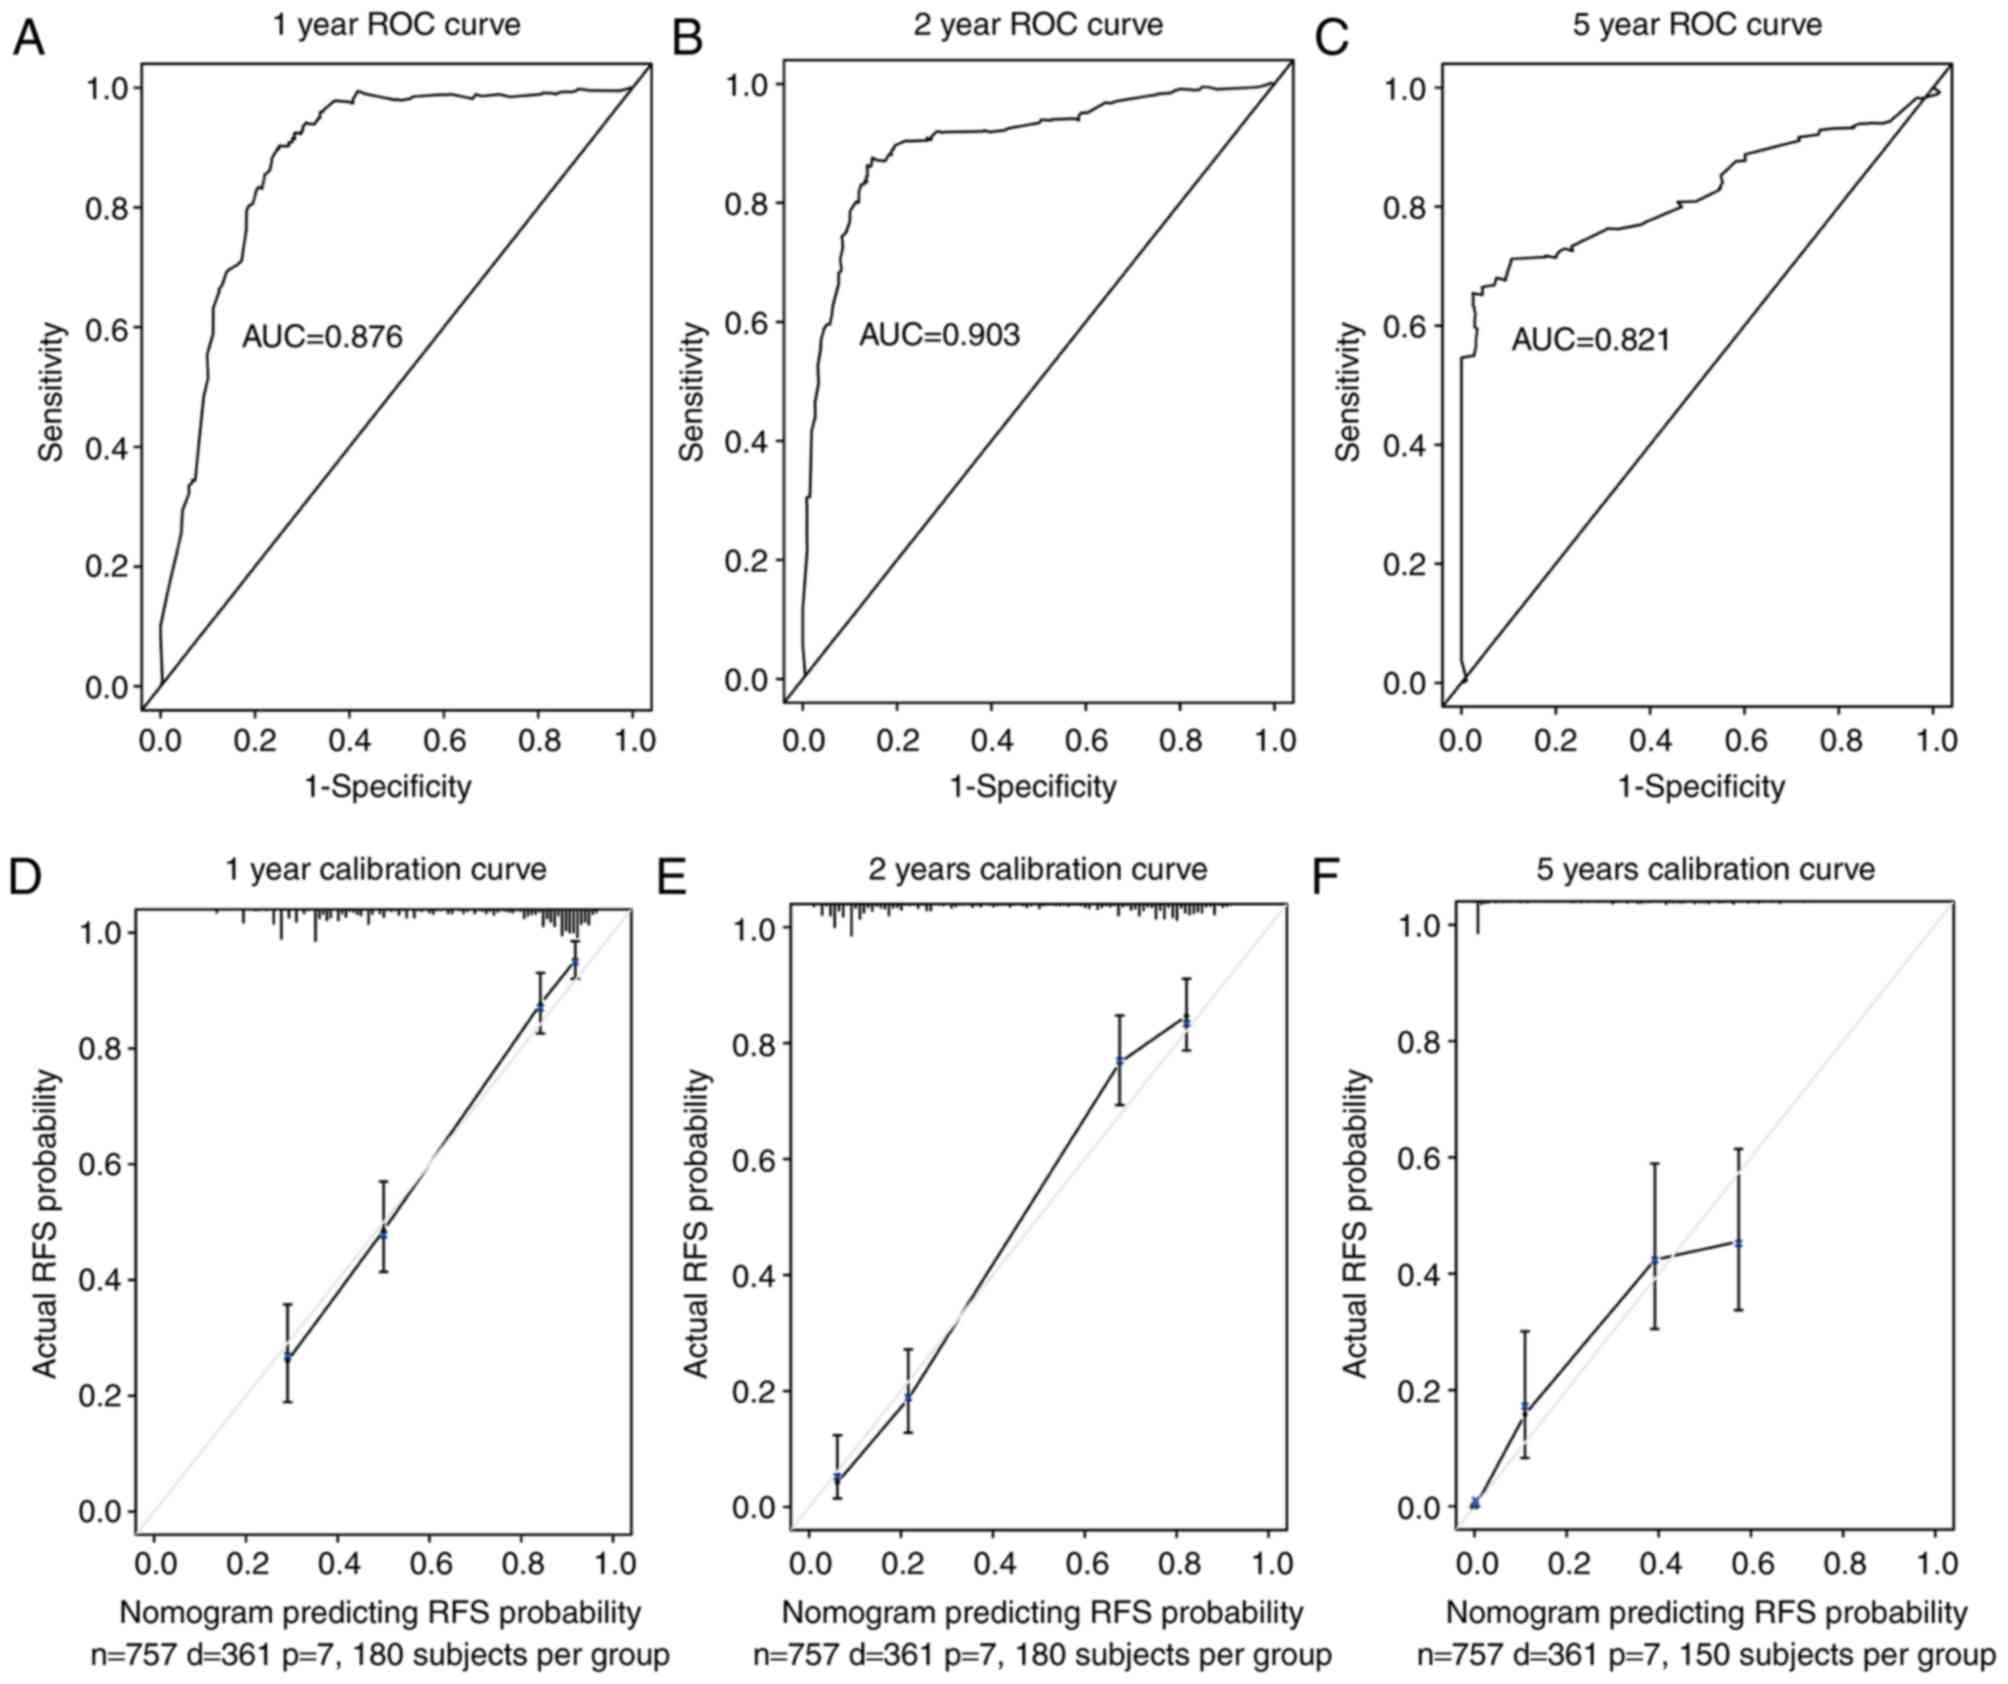
recurrence (Fig. 4). ROC curve
analysis of the nomogram was used to validate the discrimination
capability of the nomogram, and the area under the curve values for
1, 2 and 5 years were 0.876, 0.903 and 0.821, respectively
(Fig. 5A-C). Subsequently, a
calibration curve was generated to validate the calibration of the
nomogram table (Fig. 5D-F). The
trends indicated by the curve were consistent with the actual RFS
probability curves at 1, 2 and 5 years. Since the patients came
from multiple clinical centers, there was no need for external
validation (22). In addition,
discrimination and calibration analyses revealed good
correspondence between the predicted probabilities of RFS and the
actual probabilities within 1, 2 and 5 years. In summary, the
nomogram presented in the current study effectively predicted
glioma RFS probabilities.
Discussion
The present study combined LGG and GBM data, and
compared the genetic difference between different MATH levels of
glioma. Firstly, combining LGG and GBM data could help screen
efficient predictors more accurately. LGG data from TCGA database
contains grade II and III glioma, which has malignant progression.
In addition, the majority of LGG cases may eventually progress to
GBM, which is combined with continuous evolution of gene expression
(23). Therefore, gene expression of
each grade of glioma is closely associated, and it is valuable to
analyze the genetic heterogeneity of glioma throughout the whole
evolution process.
The analysis confirmed that ITH is an indicator of
poor prognosis in glioma. Patients with GBM and IDH1/2-wt glioma
had higher MATH levels than the other patients with glioma. When
analyzing mutation genes, both the single gene mutations and
signaling pathways reflected by the mutant gene sets were different
between the high- and low-MATH groups. In addition, the gene
expression enriched signaling pathways differed between the high-
and low-MATH groups. Furthermore, MATH values were independent
predictors of glioma recurrence (P=0.015). However, histological
typing cannot accurately predict glioma prognosis, since a number
of patients with LGG had an even worse prognosis than those with
GBM (24,25). Additionally, ~15% of patients with
GBM have good prognosis, and >2% of patients with GBM achieve
long term survival (>10 years) (26). In certain cohorts predicted to have a
poor prognosis, including the IDH-wt and GBM groups, MATH levels
distinguished patients with a relatively good prognosis. Finally,
the present study established a nomogram model based on MATH values
that accurately predicted glioma recurrence. The present study
integrated the factors and accurately predicted the prognosis of
glioma, provided a novel idea for the classification of glioma and
increased the understanding of malignant glioma in terms of gene
heterogeneity.
The effect of ITH on treatment resistance and the
results of the gene enrichment analysis may explain the poor
outcomes observed in patients with glioma with high MATH levels.
High ITH levels have been found to increase chemoradiotherapy
resistance in glioma (27). In the
present study, the results of the analyses of gene mutation
patterns and signaling pathway enrichment were much more
complicated in the high-MATH group than in the low-MATH group.
Glioma progression conforms to Darwinian theory in that tumors with
a high ITH level possess more tumor subclones (28,29),
which is beneficial for coping with external selective pressure. In
patients receiving chemotherapy drugs or radiation, high ITH
gliomas will have more residual subclones to replace those that are
lost (30,31). Therefore, compared with the low-MATH
group, the high-MATH group tended to have a shorter interval to
recurrence. Additionally, gene enrichment analysis demonstrated
that the gene mutations occurring in patients with high MATH values
were enriched in the ‘BH3 anti-apoptotic’, ‘MAD2 inhibitory signal’
and ‘glutathione biosynthesis’ signaling pathways, which act to
inhibit apoptosis (32), mitotic
catastrophe and radio-chemotherapy resistance (33), respectively (Fig. 3D). In addition, gene expression was
enriched in ‘adhesion molecules’ and ‘cytokine interaction’
signaling pathways (Fig. 3E and F).
These two signaling pathways act on the tumor microenvironment and
provide a driving force for glioma invasion, migration and growth
(34). Therefore, patients with high
MATH values have a genetic and expression background that indicates
a worse prognosis, which is consistent with the results of the
survival analysis.
In the nomogram, several factors including, MATH
level, gene IDH1/2, gene TTN, age, sex, WHO grade and histological
classification, were indicated to have a substantial effect on
glioma recurrence. Age has been identified as an independent
prognostic factor in high-grade glioma (35), and elderly patients with glioma
exhibit abnormal repair functions, resulting in gene mutations and
impaired DNA metabolic functions. Therefore, compared with young
patients with glioma, older patients are more likely to have higher
tumor ITH levels. In addition, elderly patients tend to choose
palliative surgery and low-dose chemo-radiotherapy treatment to
avoid severe complications (36),
and residual glioma cells can resist chemoradiotherapy by
increasing their DNA mutation rate, which may also increase the ITH
level in glioma (30). Furthermore,
prognoses in glioma are worse in female patients than in male
patients (37). However, in the
present study, ITH levels were not significantly different between
male and female patients with glioma (data not shown).
Additionally, while IDH1/2 mutation status, WHO grade and
histological classification are generally considered to influence
glioma prognosis, the present study revealed that patients with
IDH1/2-wt glioma, GBM and WHO grade IV all have high MATH
levels.
The mutation status of the TTN gene was strongly
associated with glioma recurrence. The TTN gene encodes the titin
protein, which performs nucleic acid- and protein-binding
functions, and is involved in dilated cardiomyopathy and cardiac
conduction disease (38). A recent
study demonstrated that TTN serves a role in overgrowth-associated
signaling pathways in PTEN-wildtype Bannayan-Riley-Ruvalcaba
syndrome (39). Although, to the
best of our knowledge, no studies have yet investigated the
association between TTN and tumors, data from the TCGA database
revealed that the TTN gene has a high frequency of mutation in a
number of tumors, including lung (724 cases), skin (379 cases),
uterus (282 cases), stomach (274 cases), colon (264 cases) and
breast (291 cases) tumors (https://portal.gdc.cancer.gov).
In the present study, the mutation status of the
TP53, PTEN, EGFR and ATRX genes was not associated with glioma
recurrence. Although these were identified to be significant in the
univariate Cox regression analysis, the multivariate Cox regression
analysis revealed no association with glioma recurrence. These
results suggest that numerous confounding factors can interfere
with Cox regression analyses. For example, a number of studies have
demonstrated that TP53 mutations are significantly associated with
short survival times in patients with glioma (40–44).
However, not all mutations in TP53 result in a loss in gene
transcription; patients with TP53 mutant glioma that retain
transcriptional activity exhibit longer survival times (45).
Several refinements must be taken into account in
future studies. First, the data used to calculate the MATH values
were obtained from a single location in tumor tissues deposited in
the TCGA database, and an increasing number of studies confirm that
the gene mutations found in different locations within various
tumor regions are heterogeneous (46,47).
Therefore, whether the MATH values found in a single location in a
tumor are representative of the state of the whole tumor should be
further investigated by multiple locus sequencing. In addition,
MATH values do not comprehensively describe glioma ITH, which
results from epigenetic regulation and the tumor microenvironment
and needs to be analyzed using advanced methods.
In conclusion, the present study quantified ITH
according to MATH values and extended the knowledge concerning the
association between ITH and glioma recurrence. Additionally, the
present study provided a novel MATH-containing nomogram model that
accurately predicted glioma RFS probabilities.
Supplementary Material
Supporting Data
Acknowledgements
The authors would like to thank Professor Xuhui Wang
(Department of Neurosurgery, Daping Hospital and Institute Research
of Surgery, Army Medical University, Chongqing, China), for his
guidance and financial support in the present study.
Funding
The present study was supported by grants from the
National Natural Science Foundation of China (grant no. 81772662),
the Chongqing Science and Technology Commission (grant no.
cstc2018jcyjA2025), and the National Natural Science Foundation of
China (grant no. 81300965). This work was also supported by a grant
from the Chongqing Science and Technology Commission (grant no.
cstc2017jcyjBX0021).
Availability of data and materials
The datasets analyzed during the present study are
available in the TCGA repository, (https://portal.gdc.cancer.gov).
Authors' contributions
MX and LY designed the experiments. PW, WY, JZ and
JM collected, combined and analyzed the data. PW created the images
and tables. LX and ML validated the data. All authors wrote and
revised the manuscript.
Ethics approval and consent to
participate
Not applicable.
Patient consent for publication
Not applicable.
Competing interests
The authors declare that they have no competing
interests.
Glossary
Abbreviations
Abbreviations:
|
GBM
|
glioblastoma
|
|
ITH
|
intra-tumor heterogeneity
|
|
LGG
|
low grade glioma
|
|
MATH
|
mutant-allele tumor heterogeneity
|
|
RFS
|
recurrence-free survival
|
References
|
1
|
Wood MD, Halfpenny AM and Moore SR:
Applications of molecular neuro-oncology-A review of diffuse glioma
integrated diagnosis and emerging molecular entities. Diagn Pathol.
14:292019. View Article : Google Scholar : PubMed/NCBI
|
|
2
|
Freese C, Takiar V, Fouladi M, DeWire M,
Breneman J and Pater L: Radiation and subsequent reirradiation
outcomes in the treatment of diffuse intrinsic pontine glioma and a
systematic review of the reirradiation literature. Pract Radiat
Oncol. 7:86–92. 2017. View Article : Google Scholar : PubMed/NCBI
|
|
3
|
Lin L, Cai J and Jiang C: Recent advances
in targeted therapy for glioma. Curr Med Chem. 24:1365–1381. 2017.
View Article : Google Scholar : PubMed/NCBI
|
|
4
|
Kline C, Felton E, Allen IE, Tahir P and
Mueller S: Survival outcomes in pediatric recurrent high-grade
glioma: Results of a 20-year systematic review and meta-analysis. J
Neurooncol. 137:103–110. 2018. View Article : Google Scholar : PubMed/NCBI
|
|
5
|
Johnson BE, Mazor T, Hong C, Barnes M,
Aihara K, McLean CY, Fouse SD, Yamamoto S, Ueda H, Tatsuno K, et
al: Mutational analysis reveals the origin and therapy-driven
evolution of recurrent glioma. Science. 343:189–193. 2014.
View Article : Google Scholar : PubMed/NCBI
|
|
6
|
Sottoriva A, Spiteri I, Piccirillo SG,
Touloumis A, Collins VP, Marioni JC, Curtis C, Watts C and Tavaré
S: Intratumor heterogeneity in human glioblastoma reflects cancer
evolutionary dynamics. Proc Natl Acad Sci USA. 110:4009–4014. 2013.
View Article : Google Scholar : PubMed/NCBI
|
|
7
|
Mazor T, Pankov A, Johnson BE, Hong C,
Hamilton EG, Bell RJA, Smirnov IV, Reis GF, Phillips JJ, Barnes MJ,
et al: DNA methylation and somatic mutations converge on the cell
cycle and define similar evolutionary histories in brain tumors.
Cancer Cell. 28:307–317. 2015. View Article : Google Scholar : PubMed/NCBI
|
|
8
|
Zhao Y, Alakhova DY and Kabanov AV: Can
nanomedicines kill cancer stem cells? Adv Drug Deliv Rev.
65:1763–1783. 2013. View Article : Google Scholar : PubMed/NCBI
|
|
9
|
Brown TM and Fee E: Rudolf carl virchow:
Medical scientist, social reformer, role model. Am J Public Health.
96:2104–2105. 2006. View Article : Google Scholar : PubMed/NCBI
|
|
10
|
Nowell PC: The clonal evolution of tumor
cell populations. Science. 194:23–28. 1976. View Article : Google Scholar : PubMed/NCBI
|
|
11
|
Kim J, Lee IH, Cho HJ, Park CK, Jung YS,
Kim Y, Nam SH, Kim BS, Johnson MD, Kong DS, et al: Spatiotemporal
evolution of the primary glioblastoma genome. Cancer Cell.
28:318–328. 2015. View Article : Google Scholar : PubMed/NCBI
|
|
12
|
Kim H, Zheng S, Amini SS, Virk SM,
Mikkelsen T, Brat DJ, Grimsby J, Sougnez C, Muller F, Hu J, et al:
Whole-genome and multisector exome sequencing of primary and
post-treatment glioblastoma reveals patterns of tumor evolution.
Genome Res. 25:316–327. 2015. View Article : Google Scholar : PubMed/NCBI
|
|
13
|
Sidow A and Spies N: Concepts in solid
tumor evolution. Trends Genet. 31:208–214. 2015. View Article : Google Scholar : PubMed/NCBI
|
|
14
|
Ibragimova MK, Tsyganov MM and Litviakov
NV: Natural and chemotherapy-Induced clonal evolution of tumors.
Biochemistry (Mosc). 82:413–425. 2017. View Article : Google Scholar : PubMed/NCBI
|
|
15
|
Mroz EA and Rocco JW: MATH, a novel
measure of intratumor genetic heterogeneity, is high in
poor-outcome classes of head and neck squamous cell carcinoma. Oral
Oncol. 49:211–215. 2013. View Article : Google Scholar : PubMed/NCBI
|
|
16
|
Mroz EA, Tward AD, Hammon RJ, Ren Y and
Rocco JW: Intra-tumor genetic heterogeneity and mortality in head
and neck cancer: Analysis of data from the cancer Genome Atlas.
PLoS Med. 12:e10017862015. View Article : Google Scholar : PubMed/NCBI
|
|
17
|
Rajput A, Bocklage T, Greenbaum A, Lee JH
and Ness SA: Mutant-allele tumor heterogeneity scores correlate
with risk of metastases in colon cancer. Clin Colorectal Cancer.
16:e165–e170. 2017. View Article : Google Scholar : PubMed/NCBI
|
|
18
|
Ma D, Jiang YZ, Liu XY, Liu YR and Shao
ZM: Clinical and molecular relevance of mutant-allele tumor
heterogeneity in breast cancer. Breast Cancer Res Treat. 162:39–48.
2017. View Article : Google Scholar : PubMed/NCBI
|
|
19
|
Shen S, Wei Y, Zhang R, Du M, Duan W, Yang
S, Zhao Y, Christiani DC and Chen F: Mutant-allele fraction
heterogeneity is associated with non-small cell lung cancer patient
survival. Oncol Lett. 15:795–802. 2018.PubMed/NCBI
|
|
20
|
Turkalp Z, Karamchandani J and Das S: IDH
mutation in glioma: New insights and promises for the future. JAMA
Neurol. 71:1319–1325. 2014. View Article : Google Scholar : PubMed/NCBI
|
|
21
|
Alexander BM and Cloughesy TF: Adult
glioblastoma. J Clin Oncol. 35:2402–2409. 2017. View Article : Google Scholar : PubMed/NCBI
|
|
22
|
Li S, Yang R, Sun X, Miao S, Lu T, Wang Y,
Wo Y and Jiao W: Identification of SPP1 as a promising biomarker to
predict clinical outcome of lung adenocarcinoma individuals. Gene.
679:398–404. 2018. View Article : Google Scholar : PubMed/NCBI
|
|
23
|
Claus EB, Walsh KM, Wiencke JK, Molinaro
AM, Wiemels JL, Schildkraut JM, Bondy ML, Berger M, Jenkins R and
Wrensch M: Survival and low-grade glioma: The emergence of genetic
information. Neurosurg Focus. 38:E62015. View Article : Google Scholar : PubMed/NCBI
|
|
24
|
Babu R, Bagley JH, Park JG, Friedman AH
and Adamson C: Low-grade astrocytomas: The prognostic value of
fibrillary, gemistocytic, and protoplasmic tumor histology. J
Neurosurg. 119:434–441. 2013. View Article : Google Scholar : PubMed/NCBI
|
|
25
|
Tom MC, Park DYJ, Yang K, Leyrer CM, Wei
W, Jia X, Varra V, Yu JS, Chao ST, Balagamwala EH, et al: Malignant
transformation of molecularly classified adult low grade glioma.
Int J Radiat Oncol Biol Phys. Aug 25–2019.(Epub ahead of print).
View Article : Google Scholar
|
|
26
|
Tykocki T and Eltayeb M: Ten-year survival
in glioblastoma. A systematic review. J Clin Neurosci. 54:7–13.
2018. View Article : Google Scholar : PubMed/NCBI
|
|
27
|
Ghosh D, Nandi S and Bhattacharjee S:
Combination therapy to checkmate Glioblastoma: Clinical challenges
and advances. Clin Transl Med. 7:332018. View Article : Google Scholar : PubMed/NCBI
|
|
28
|
Lee JK, Wang J, Sa JK, Ladewig E, Lee HO,
Lee IH, Kang HJ, Rosenbloom DS, Camara PG, Liu Z, et al:
Spatiotemporal genomic architecture informs precision oncology in
glioblastoma. Nat Genet. 49:594–599. 2017. View Article : Google Scholar : PubMed/NCBI
|
|
29
|
Suzuki H, Aoki K, Chiba K, Sato Y,
Shiozawa Y, Shiraishi Y, Shimamura T, Niida A, Motomura K, Ohka F,
et al: Mutational landscape and clonal architecture in grade II and
III gliomas. Nat Genet. 47:458–468. 2015. View Article : Google Scholar : PubMed/NCBI
|
|
30
|
Qazi MA, Vora P, Venugopal C, Sidhu SS,
Moffat J, Swanton C and Singh SK: Intratumoral heterogeneity:
Pathways to treatment resistance and relapse in human glioblastoma.
Ann Oncol. 28:1448–1456. 2017. View Article : Google Scholar : PubMed/NCBI
|
|
31
|
Bernstock JD, Mooney JH, Ilyas A, Chagoya
G, Estevez-Ordonez D, Ibrahim A and Nakano I: Molecular and
cellular intratumoral heterogeneity in primary glioblastoma:
Clinical and translational implications. J Neurosurg. 1-9:Aug
23–2019.(Epub ahead of print).
|
|
32
|
Yang MC, Loh JK, Li YY, Huang WS, Chou CH,
Cheng JT, Wang YT, Lieu AS, Howng SL, Hong YR and Chou AK: Bcl2L12
with a BH3-like domain in regulating apoptosis and TMZ-induced
autophagy: A prospective combination of ABT-737 and TMZ for
treating glioma. Int J Oncol. 46:1304–1316. 2015. View Article : Google Scholar : PubMed/NCBI
|
|
33
|
Rocha CR, Garcia CC, Vieira DB, Quinet A,
de Andrade-Lima LC, Munford V, Belizário JE and Menck CF:
Glutathione depletion sensitizes cisplatin- and
temozolomide-resistant glioma cells in vitro and in vivo. Cell
Death Dis. 6:e17272015. View Article : Google Scholar : PubMed/NCBI
|
|
34
|
Turaga SM and Lathia JD: Adhering towards
tumorigenicity: Altered adhesion mechanisms in glioblastoma cancer
stem cells. CNS Oncol. 5:251–259. 2016. View Article : Google Scholar : PubMed/NCBI
|
|
35
|
Chen JW, Zhou CF and Lin ZX: The influence
of different classification standards of age groups on prognosis in
high-grade hemispheric glioma patients. J Neurol Sci. 356:148–152.
2015. View Article : Google Scholar : PubMed/NCBI
|
|
36
|
Gallego Perez-Larraya J and Delattre JY:
Management of elderly patients with gliomas. Oncologist.
19:1258–1267. 2014. View Article : Google Scholar : PubMed/NCBI
|
|
37
|
Rasmussen BK, Hansen S, Laursen RJ,
Kosteljanetz M, Schultz H, Nørgård BM, Guldberg R and Gradel KO:
Epidemiology of glioma: Clinical characteristics, symptoms, and
predictors of glioma patients grade I–IV in the the Danish
Neuro-Oncology Registry. J Neurooncol. 135:571–579. 2017.
View Article : Google Scholar : PubMed/NCBI
|
|
38
|
Chauveau C, Rowell J and Ferreiro A: A
rising titan: TTN review and mutation update. Hum Mutat.
35:1046–1059. 2014. View Article : Google Scholar : PubMed/NCBI
|
|
39
|
Yehia L, Ni Y and Eng C: Germline TTN
variants are enriched in PTEN-wildtype Bannayan-Riley-Ruvalcaba
syndrome. NPJ Genom Med. 2:372017. View Article : Google Scholar : PubMed/NCBI
|
|
40
|
Cho SY, Park C, Na D, Han JY, Lee J, Park
OK, Zhang C, Sung CO, Moon HE, Kim Y, et al: High prevalence of
TP53 mutations is associated with poor survival and an EMT
signature in gliosarcoma patients. Exp Mol Med. 49:e3172017.
View Article : Google Scholar : PubMed/NCBI
|
|
41
|
Todorova PK, Fletcher-Sananikone E,
Mukherjee B, Kollipara R, Vemireddy V, Xie XJ, Guida PM, Story MD,
Hatanpaa K, Habib AA, et al: Radiation-induced DNA damage
cooperates with heterozygosity of TP53 and PTEN to generate
high-grade gliomas. Cancer Res. 79:3749–3761. 2019. View Article : Google Scholar : PubMed/NCBI
|
|
42
|
Pessoa IA, Amorim CK, Ferreira WAS, Sagica
F, Brito JR, Othman M, Meyer B, Liehr T and de Oliveira EHC:
Detection and correlation of single and concomitant TP53, PTEN, and
CDKN2A alterations in gliomas. Int J Mol Sci. 20(pii): E26582019.
View Article : Google Scholar : PubMed/NCBI
|
|
43
|
Jesionek-Kupnicka D, Braun M,
Trabska-Kluch B, Czech J, Szybka M, Szymańska B, Kulczycka-Wojdala
D, Bieńkowski M, Kordek R and Zawlik I: MiR-21, miR-34a, miR-125b,
miR-181d and miR-648 levels inversely correlate with MGMT and TP53
expression in primary glioblastoma patients. Arch Med Sci.
15:504–512. 2019. View Article : Google Scholar : PubMed/NCBI
|
|
44
|
Forte IM, Indovina P, Iannuzzi CA, Cirillo
D, Di Marzo D, Barone D, Capone F, Pentimalli F and Giordano A:
Targeted therapy based on p53 reactivation reduces both
glioblastoma cell growth and resistance to temozolomide. Int J
Oncol. 54:2189–2199. 2019.PubMed/NCBI
|
|
45
|
Fischer NW, Prodeus A and Gariepy J:
Survival in males with glioma and gastric adenocarcinoma correlates
with mutant p53 residual transcriptional activity. JCI Insight.
3(pii): 1213642018. View Article : Google Scholar : PubMed/NCBI
|
|
46
|
Seow P, Wong JHD, Ahmad-Annuar A, Mahajan
A, Abdullah NA and Ramli N: Quantitative magnetic resonance imaging
and radiogenomic biomarkers for glioma characterisation: A
systematic review. Br J Radiol. 91:201709302018. View Article : Google Scholar : PubMed/NCBI
|
|
47
|
Aubry M, de Tayrac M, Etcheverry A,
Clavreul A, Saikali S, Menei P and Mosser J: From the core to
beyond the margin: A genomic picture of glioblastoma intratumor
heterogeneity. Oncotarget. 6:12094–12109. 2015. View Article : Google Scholar : PubMed/NCBI
|