Introduction
Head and neck squamous cell carcinoma (HNSC) is a
common cancer worldwide and accounts for >600,000 new cases
annually (1). Despite significant
advancements in treatments, including reconstructive microvascular
free tissue transfer, hyperfractionated radiotherapy and concurrent
chemoradiation, the survival rate of patients with HNSC has not
sufficiently improved over the last 50 years, with overall survival
of ~50%, resulting in increased mortality rates worldwide every
year (2). HNSC is a highly complex
disease emerging from the oral cavity, tongue, pharynx or larynx
(3). Each tumor harbors unique
mutations, presents variable clinical outcomes and is associated
with specific risk factors (4,5). For
example, TP53 inactivation, either through somatic mutation or HPV
infection, appears nearly universal in this malignancy (6). The present study particularly focused
on one type of HNSC, the oral tongue squamous cell carcinoma
(OTSCC), because of its poor diagnosis, high incidence rate,
aggressive clinical behavior and poor outcome (7–10). A
recent study reported a five-year survival rate of 63% for patients
with OTSCC in The Netherlands (11).
In 2017, nearly 16,400 new cases of tongue cancer were diagnosed
and 2,400 tongue cancer-associated mortality cases were recorded in
the United States (12). Several
prognostic factors for OTSCC exist, including occult node
positivity, tumor depth, lymphovascular invasion and perineural
invasion (13). Nevertheless, robust
and reliable molecular prognostic biomarkers need to be determined
in order to identify patients with advanced stages of OTSCC.
Several thousands of tumor biomarkers have been
discovered and are associated with the prognosis of various types
of cancer (14). In particular,
markers for OTSCC, including microtubule associated scaffold
protein 1 and beta-parvin, have attracted much attention due to
their crucial role in OTSCC pathogenesis (15). Furthermore, it was demonstrated that
downregulation of these markers markedly decreases cancer cell
survival (15–19).
Thanks to the rapid development and extensive
application of microarrays for gene identification in various types
of cancer (20–22), a high number of differentially
expressed genes (DEGs) in OTSCC have been identified (13,19).
However, the results between studies are inconsistent, which might
be due the variability of tissue samples used. In addition, no
reliable biomarkers for OTSCC have been established. Subsequently,
the combination of bioinformatics methods and expression profiling
techniques may represent a novel approach to resolve these
problems. The present study used four microarray datasets [GSE9844
(3), GSE13601 (23), GSE31056 (24), and GSE75538 (25)] from the National Center for
Biotechnology Information (NCBI)-Gene Expression Omnibus (GEO)
database and an mRNA sequencing (mRNA-seq) dataset from The Cancer
Genome Atlas (TCGA). DEGs were filtered using the GEO2R tool
according to conventional data processing standards, and gene
ontology (GO) enrichment analysis was performed to screen for DEGs
using The Database for Annotation, Visualization and Integrated
Discovery (DAVID). Expression levels of DEGs in samples from TCGA
were assessed using Gene Expression Profiling Interactive Analysis
(GEPIA), and corrections were applied for DEGs is samples from
TCGA-HNSC using cBioPortal to identify potential oncogenes in
OTSCC. The identified DEGs and their associated pathways may be
considered as robust and reliable tumor biomarkers for OTSCC and
serve as precise therapeutic targets for the prevention of OTSCC
progression at early stages.
Materials and methods
GEO datasets
GEO (https://www.ncbi.nlm.nih.gov/gds) is a public
repository at NCBI for storing high-throughput gene expression data
(26). The gene expression profiles
of GSE9844, GSE13601, GSE31056, and GSE75538 were selected from the
GEO database (http://www.ncbi.nlm.nih.gov/geo/). GSE9844 included 26
OTSCC and 12 normal tissues, GSE13601 included 31 OTSCC and 26
normal tissues, GSE31056 included 22 OTSCC and 24 normal tissues,
and GSE75538 included 14 OTSCC and 14 normal tissues.
Identification of DEGs
GEO2R (https://www.ncbi.nlm.nih.gov/geo/geo2r/) was used to
detect DEGs between OTSCC and normal tissue samples (27). Adjusted P-values <0.01 and |log
fold change (FC)|>2 were set as cutoffs. Co-expressed DEGs that
were downregulated or upregulated in the two sets of gene
expression profiles were identified using Venn diagrams (http://bioinformatics.psb.ugent.be/webtools/Venn/).
GO enrichment analysis of DEGs
Usually, genes and their products are annotated to
identify characteristic biological function and processes of a
high-throughput genome or transcriptome (28). DAVID (https://david.ncifcrf.gov/) is a web-based
bioinformatics resource for gene annotation and visualization with
an integrated discovery function. It is therefore useful for
determining gene biological attributes (29). P<0.01 and the Benjamini corrected
P<0.01 (30) were set as the
cutoff. Sequential pathways, molecular and cellular components and
biological functions of DEGs could be visualized by using DAVID
(https://david.ncifcrf.gov/).
Comparison of gene expression in
patients with OTSCC
The mRNA-seq data of the five OTSCC genes of
interest from HNSC samples were obtained from the TCGA database
(https://cancergenome.nih.gov/) (31). In addition, clinical data of OTSCC
were downloaded using TCGA Assembler (Table I). mRNA-seq data of 147 OTSCC tissues
and 15 adjacent normal tongue tissues were obtained on an Illumina
HiSeq RNASeq platform (32). Since
the TCGA dataset was developed as a community resource project, no
additional approval was required for this study from Fujian Medical
University. The present study complied with the TCGA publication
guidelines and data access policies (33).
 | Table I.Characteristics of 147 patients with
tongue tumor from The Cancer Genome Atlas database. |
Table I.
Characteristics of 147 patients with
tongue tumor from The Cancer Genome Atlas database.
|
Characteristics | Patient number | Percentage |
|---|
| Sex |
|
Female | 46 | 31.29 |
|
Male | 101 | 68.71 |
| Age at diagnosis,
years |
|
Mean | 58.60±12.71 |
|
|
<40 | 10 | 6.80 |
|
40–49 | 20 | 13.61 |
|
50–59 | 38 | 25.85 |
|
60–69 | 53 | 36.05 |
|
70–79 | 21 | 14.29 |
|
>80 | 4 | 2.72 |
| Tumor pathological
stage |
|
T1-T2 | 70 | 47.62 |
|
T3-T4 | 72 | 48.98 |
| Nodal pathological
stage |
|
N0-N1 | 72 | 48.98 |
|
N2-N4 | 70 | 47.62 |
| Smoking
history |
|
Yes | 98 | 66.67 |
|
No/Never | 47 | 31.97 |
|
Unknown | 2 | 1.36 |
| Alcohol
history |
|
Yes | 99 | 67.35 |
|
No/Never | 44 | 29.93 |
|
Unknown | 4 | 2.72 |
| Primary lymph
node |
|
Yes | 128 | 87.07 |
| No | 9 | 6.12 |
Analysis of gene expression patterns
in all tumors from TCGA through GEPIA
The expression patterns of the five genes of
interest in various types of cancers and normal tissues were
determined using GEPIA (http://gepia.cancer-pku.cn) (34). The program was used to analyze RNA
sequencing data of 33 types of cancer (including adrenocortical
carcinoma, bladder urothelial carcinoma, breast invasive carcinoma
(BRCA), cervical squamous cell carcinoma and endocervical
adenocarcinoma (CESC), cholangiocarcinoma (CHOL), colon
adenocarcinoma (COAD), lymphoid neoplasm diffuse large B-cell
lymphoma, esophageal carcinoma (ESCA), glioblastoma multiforme,
head and neck squamous cell carcinoma (HNSC), kidney chromophobe
(KICH), kidney renal clear cell carcinoma, kidney renal papillary
cell carcinoma, acute myeloid leukemia, brain lower grade glioma,
liver hepatocellular carcinoma, lung adenocarcinoma (LUAD), lung
squamous cell carcinoma (LUSC), mesothelioma, ovarian serous
cystadenocarcinoma, pancreatic adenocarcinoma, pheochromocytoma and
paraganglioma, prostate adenocarcinoma, rectum adenocarcinoma
(READ), sarcoma, skin cutaneous melanoma, stomach adenocarcinoma
(STAD), testicular germ cell tumor, thyroid carcinoma, thymoma,
uterine corpus endometrial carcinoma, uterine carcinosarcoma, uveal
melanoma) and adjacent normal samples from TCGA following the
standard processing pipeline. P-value <0.01 and |logFC|>2
were set as cutoffs. Box plots were generated to visualize the
associations.
Correlations among genes expression in
HNSC samples from TCGA through cBioPortal
The correlations between expression patterns of the
genes of interest in cancer tissues from TCGA-HNSC dataset were
analyzed using Pearson and Spearman correlation coefficient via
cBioPortal (http://www.cbioportal.org) (35–36).
Statistical analysis
Statistical analyses were performed using Graphpad
Prism 5.0 (GraphPad Software, Inc.). Mann-Whitney U test was
performed to compare gene expression between tumor and adjacent
normal tissues. A two-tailed P-value <0.01 was considered
statistically significant.
Results
Some biomarkers distinguished OTSCC
tissues from normal tissues
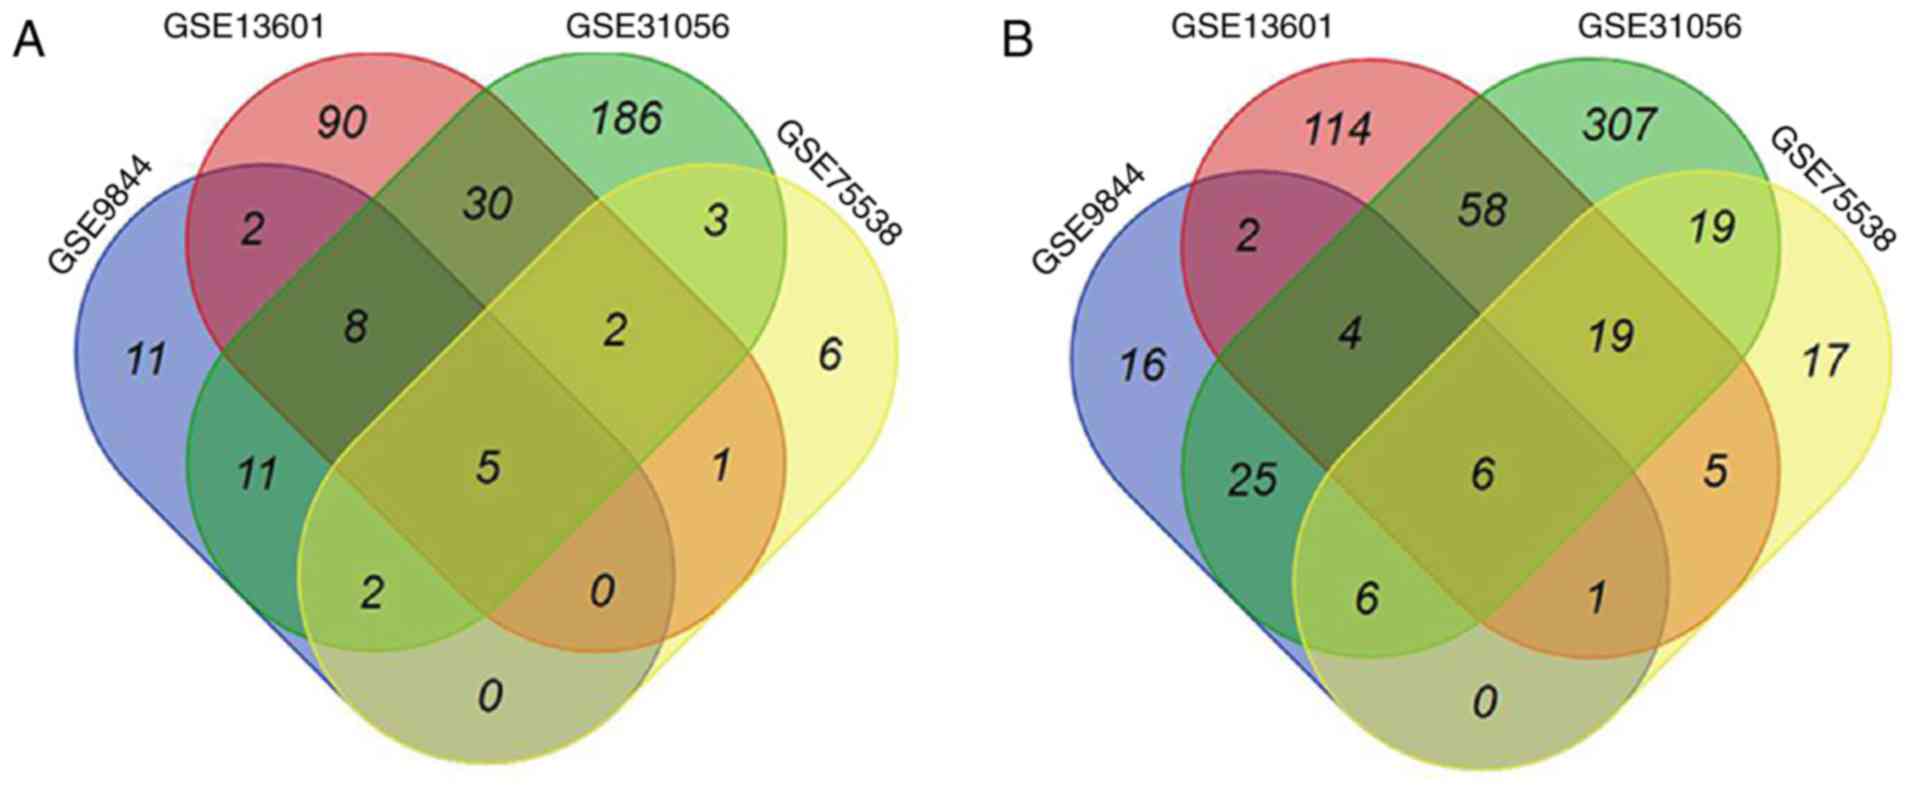
Four GEO datasets (GSE9844, GSE13601, GSE31056, and
GSE75538) were imported into the GEO2R analysis tool. Based on DEGs
between OTSCC and normal tissues, five upregulated genes [matrix
metalloproteinases 1, 3, 10 and 12 (MMP1, MMP3, MMP10 and
MMP12) and laminin subunit gamma 2 (LAMC2)] (Fig. 1A) and six downregulated genes
(dermatopontin, cartilage intermediate layer protein, keratin 4,
ATP binding cassette subfamily A member 8, alcohol dehydrogenase 1B
and protein phosphatase 1 regulatory subunit 3C) (Fig. 1B) were highlighted in all four
datasets. Whether the five upregulated genes could be considered as
potential biomarkers for distinguishing OTSCC tissues from normal
tissues was therefore assessed.
GO function enrichment analysis
GO enrichment analysis was performed using DAVID
tool. The five specific upregulated genes MMP1, LAMC2, MMP3,
MMP10 and MMP12 were uploaded into the DAVID software.
GO results indicated that these genes were specifically involved in
certain biological processes, including ‘extracellular matrix
disassembly’, ‘collagen catabolism’ and ‘proteolysis’. Furthermore,
with regards to the molecular function, the products of these five
genes mainly comprised metalloendopeptidases, serine-type
endopeptidases, calcium ion binders and zinc ion binders.
Similarly, GO cell component analysis revealed that the proteins
encoded by these genes were significantly enriched for functions
associated with the proteinaceous extracellular matrix and
extracellular region (P<0.01, Table
II).
| Table II.Gene ontology analysis of upregulated
genes associated with oral tongue squamous cell carcinoma. |
Table II.
Gene ontology analysis of upregulated
genes associated with oral tongue squamous cell carcinoma.
| Category | Term | Count | Genes | P-value | Benjamini corrected
P-value |
|---|
|
GOTERM_BP_DIRECT |
GO:0022617~extracellular matrix
disassembly | 5 | MMP10, LAMC2, MMP3,
MMP12, MMP1 |
3.9×10⁻¹⁰ |
7.7×10⁻⁹ |
|
GOTERM_BP_DIRECT | GO:0030574~collagen
catabolic process | 4 | MMP10, MMP3, MMP12,
MMP1 |
2.1×10⁻⁷ |
2.1×10⁻⁶ |
|
GOTERM_MF_DIRECT | GO:0004222
~metalloendopeptidase activity | 4 | MMP10, MMP3, MMP12,
MMP1 |
1.2×10⁻⁶ |
9.3×10⁻⁶ |
|
GOTERM_CC_DIRECT |
GO:0005578~proteinaceous extracellular
matrix | 4 | MMP10, MMP3, MMP12,
MMP1 |
1.2×10⁻⁵ |
1.1×10⁻⁴ |
|
GOTERM_MF_DIRECT |
GO:0004252~serine-type endopeptidase
activity | 4 | MMP10, MMP3, MMP12,
MMP1 |
1.3×10⁻⁵ |
5.4×10⁻⁵ |
|
GOTERM_MF_DIRECT |
GO:0004175~endopeptidase activity | 3 | MMP3, MMP12,
MMP1 |
6.0×10⁻⁵ |
1.6×10⁻⁴ |
|
GOTERM_CC_DIRECT |
GO:0005576~extracellular region | 5 | MMP10, LAMC2, MMP3,
MMP12, MMP1 |
6.1×10⁻⁵ |
2.7×10⁻⁴ |
|
GOTERM_BP_DIRECT |
GO:0006508~proteolysis | 4 | MMP10, MMP3, MMP12,
MMP1 |
1.0×10⁻⁴ |
6.8×10⁻⁴ |
|
GOTERM_MF_DIRECT | GO:0005509~calcium
ion binding | 4 | MMP10, MMP3, MMP12,
MMP1 |
3.0×10⁻⁴ |
5.9×10⁻⁴ |
|
GOTERM_MF_DIRECT | GO:0008270~zinc ion
binding | 4 | MMP10, MMP3, MMP12,
MMP1 |
1.3×10⁻³ |
2.0×10⁻³ |
Gene expression of MMP1, LAMC2, MMP3,
MMP10 and MMP12 in OTSCC samples from TCGA
TCGA database was used to analyze the expression
levels of the five genes of interest in OTSCC and adjacent normal
tissues. The results demonstrated that the expression levels of
MMP1, LAMC2, MMP3, MMP10 and MMP12 were significantly
upregulated in OTSCC tissues compared with adjacent normal tissues
(Fig. 2).
 | Figure 2.Expression levels of (A) MMP1,
(B) LAMC2, (C) MMP3, (D) MMP10 and (E)
MMP12 in oral tongue squamous cell carcinoma and normal
tissues based on TCGA database. *P<0.01. LAMC2, laminin subunit
gamma 2; MMP1, 3, 10 and 12, matrix metalloproteinase 1, 3, 10 and
12; N, normal tissue; T, cancer tissue. |
Gene expression of MMP1, LAMC2, MMP3,
MMP10 and MMP12 in 23 cancer samples from TCGA
Consistent results were obtained for bladder
urothelial carcinoma, BRCA, COAD, ESCA, HNSC, LUAD, LUSC, READ and
STAD. MMP1 expression level was significantly increased in
all cancer tissues compared with adjacent normal tissues (Fig. 3A). LAMC2 was upregulated in
CESC, CHOL, ESCA, HNSC, STAD and uterine corpus endometrial
carcinoma, whereas it was significantly downregulated in BRCA,
kidney chromophobe and kidney renal clear cell carcinoma (Fig. 3B). Furthermore, MMP3
expression was upregulated in COAD, ESCA, HNSC, and READ (Fig. 3C). MMP10 expression was
significantly upregulated in ESCA, HNSC and LUSC (Fig. 3D). In addition, MMP12 was
upregulated in CESC, ESCA, HNSC, LUAD, LUSC and STAD, whereas it
was downregulated in pancreatic adenocarcinoma (Fig. 3E). Overall, the expression level of
MMP1, LAMC2, MMP3, MMP10 and MMP12 was significantly
upregulated in HNSC tissues.
 | Figure 3.Comparison of MMP1, LAMC2, MMP3,
MMP10 and MMP12 expressions between cancer (Red) and
normal tissues (Green) among 23 various types of cancer from The
Cancer Genome Atlas according to GEPIA program. (A) MMP1;
(B) LAMC2; (C) MMP3; (D) MMP10; (E)
MMP12. The Y axis indicates the log2 (TPM + 1) for gene
expression. The red and the green bars represent the cancer and
normal tissues, respectively. These figures were derived from
GEPIA. *P<0.01. BLCA, bladder urothelial carcinoma; BRCA, breast
invasive carcinoma; CESC, cervical squamous cell carcinoma and
endocervical adenocarcinoma; CHOL, cholangiocardinoma; COAD, colon
adenocarcinoma; ESCA, esophageal carcinoma; GEPIA, Gene Expression
Profiling Interactive Analysis; HNSC, head and neck squamous cell
carcinoma; KICH, kidney chromophobe; KIRC, kidney renal clear cell
carcinoma; LAMC2, laminin subunit gamma 2; LUAD, lung
adenocarcinoma; LUSC, lung squamous cell carcinoma; MMP1, 3, 10 and
12, matrix metalloproteinase 1, 3, 10 and 12; PAAD, pancreatic
adenocarcinoma; READ, rectum adenocarcinoma; STAD, stomach
adenocarcinoma; UCEC, uterine corpus endometrioid carcinoma; TPM,
transcripts per million. |
Correlations among genes expression in
samples from the TCGA-HNSC database
To select the five genes of interest for further
investigation, the correlations between gene expression patterns in
samples from TCGA were analyzed using cBioPortal (35–36). The
results demonstrated that MMP1 expression level was
positively correlated with LAMC2 (Fig. 4A), MMP3 (Fig. 4B) and MMP10 (Fig. 4C) expression levels. In addition,
LAMC2 expression level was positively correlated with
MMP10 expression level (Fig.
4D). Pearson correlation coefficients ranged from 0.33 to 0.69,
and Spearman correlation coefficients ranged from 0.55 to 0.83. All
together, these results suggested that MMP1, LAMC2, MMP3 and
MMP10 expression levels were positively correlated in HNSC
tissues.
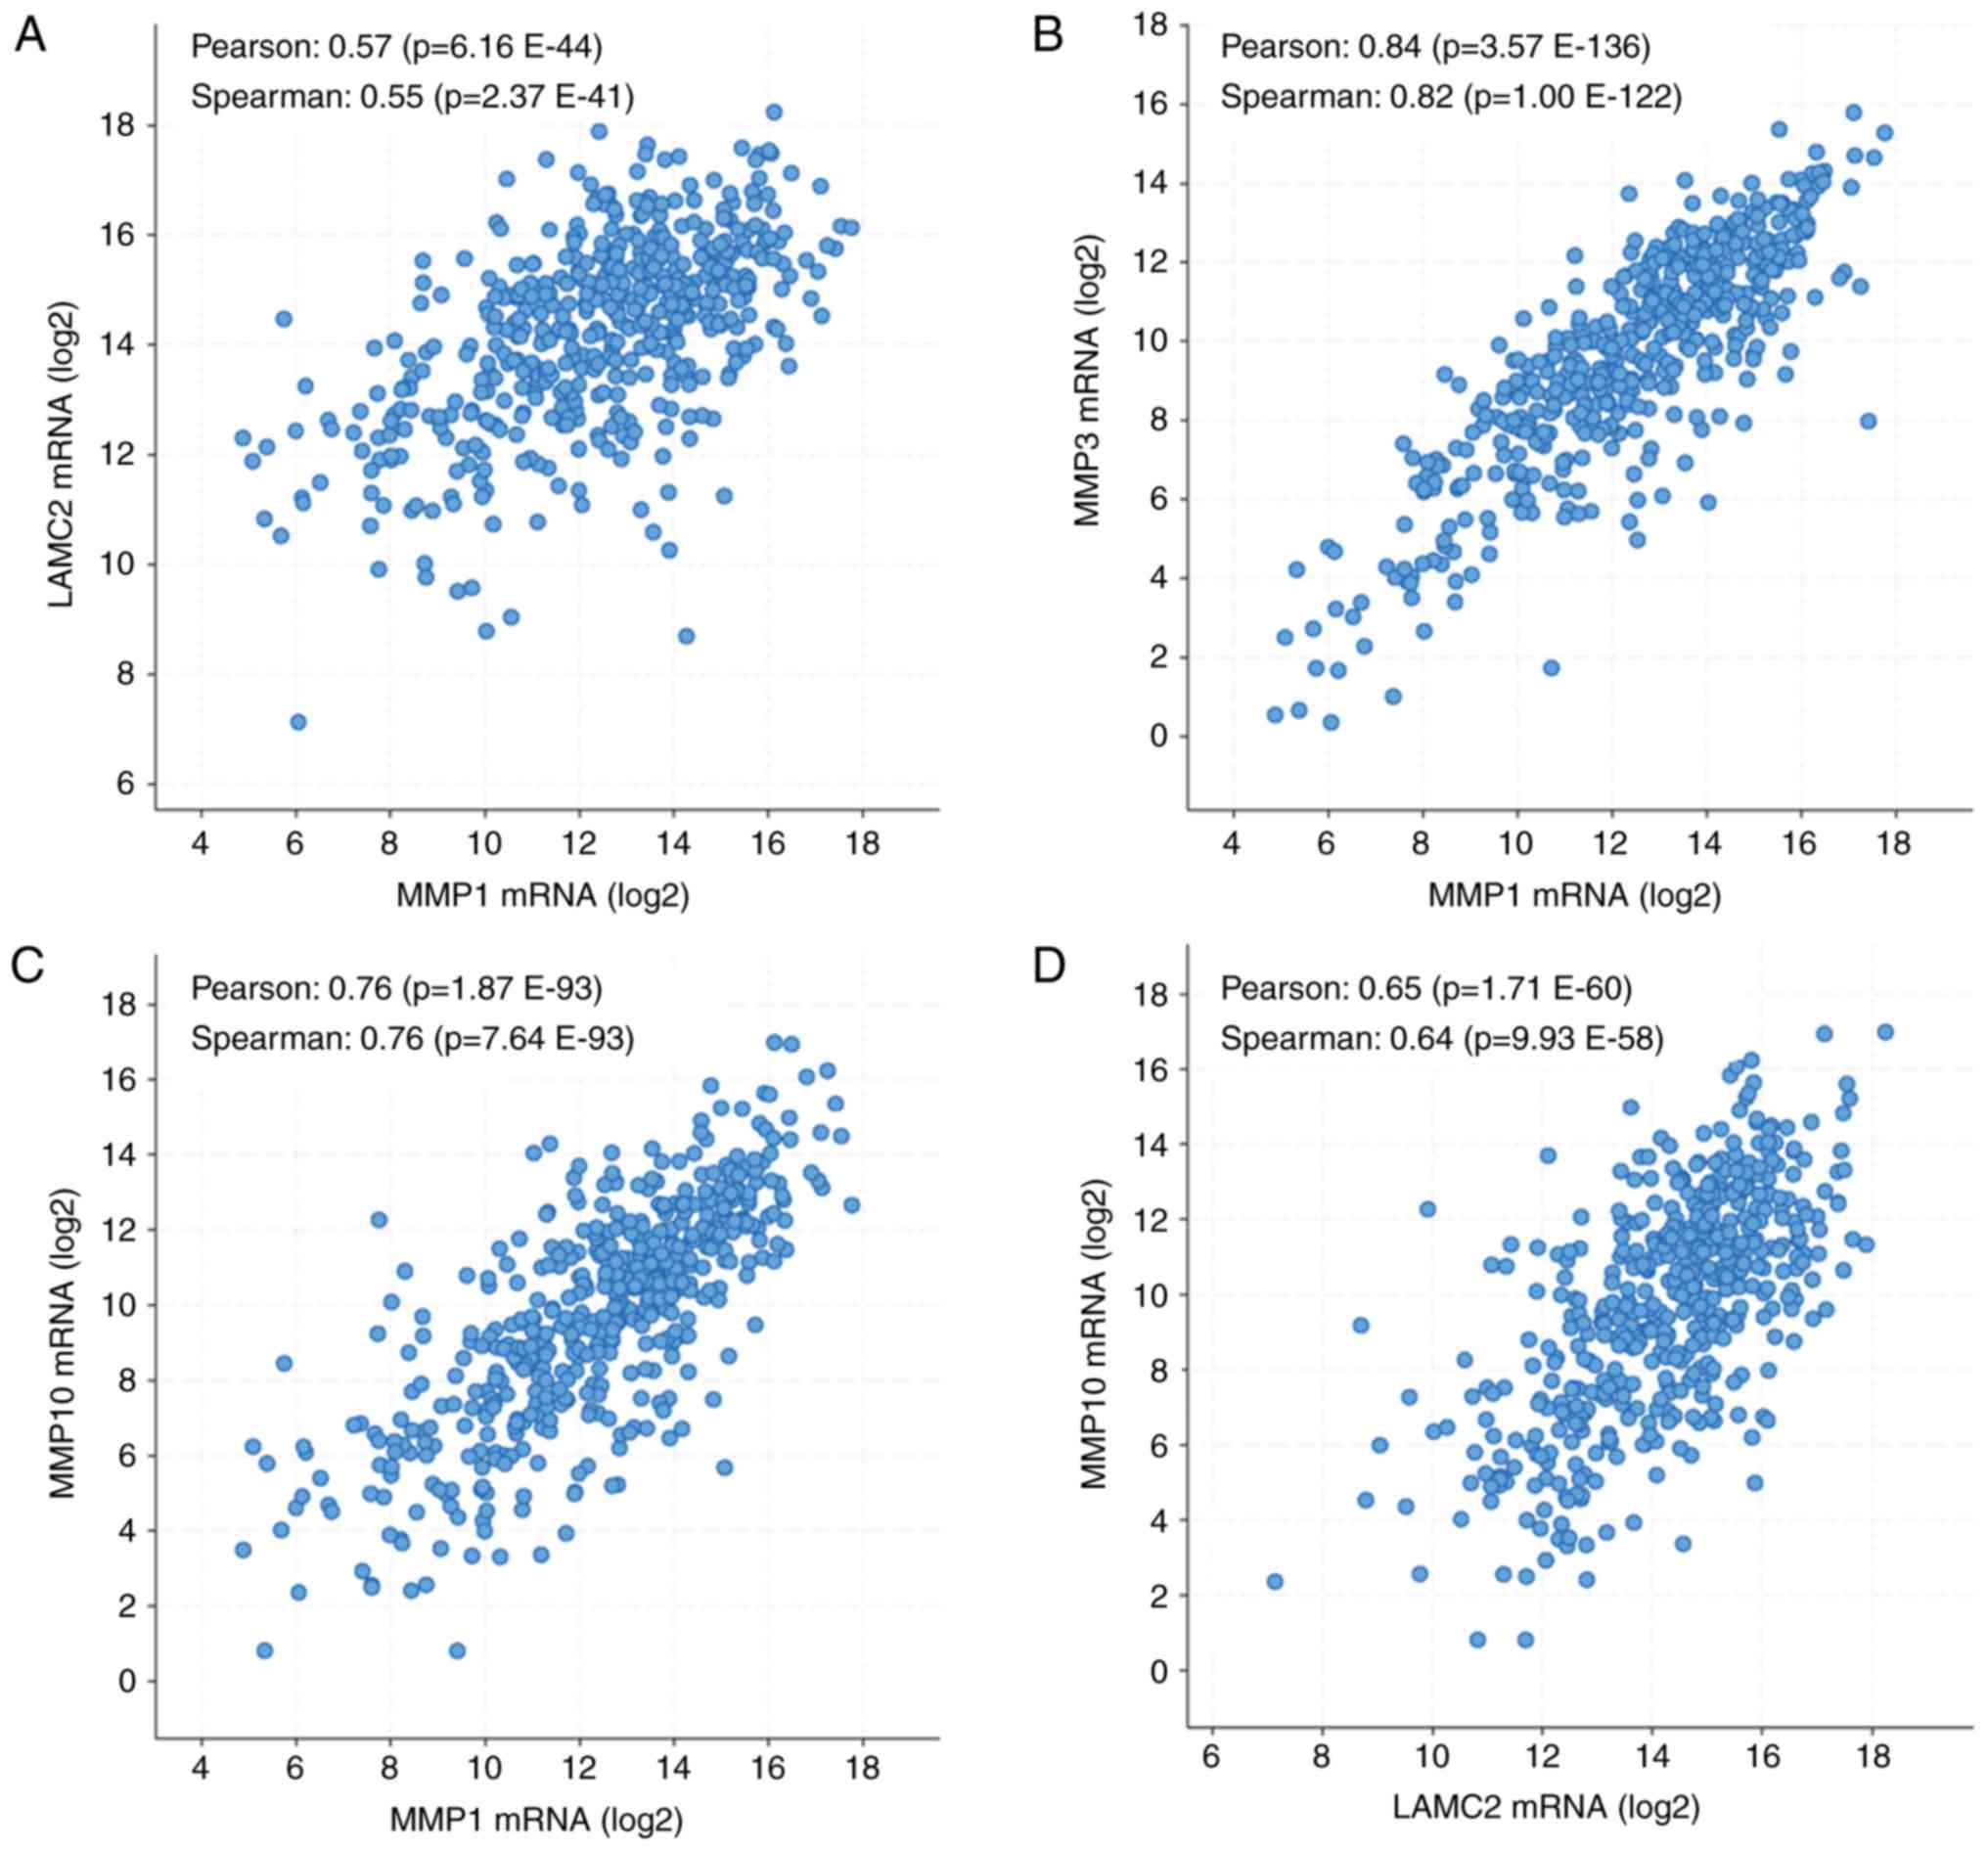 | Figure 4.Correlations between MMP1, LAMC2,
MMP3, MMP10 and MMP12 expression levels in HNSC tissues.
(A) Correlation between MMP1 and LAMC2 expression
levels in HNSC tissues. (B) Correlation between MMP1 and
MMP3 expression levels in HNSC tissues. (C) Correlation
between MMP1 and MMP10 expression levels in HNSC
tissues. (D) Correlation between LAMC2 and MMP10
expression levels in HNSC tissues. Analyses were performed using
cBioPortal on the provisional datasets from The Cancer Genome
Atlas. HNSC, head and neck squamous cell carcinoma; LAMC2, laminin
subunit gamma 2; MMP1, 3, 10 and 12, matrix metalloproteinase 1, 3,
10 and 12. |
Discussion
The American Joint Committee on Cancer has updated
the Tumor-Node-Metastasis system for cancer staging system
according to diagnostic class, treatment choices and prognosis for
OTSCC (37). However, with the
development of novel modern therapeutic approaches for cancer,
genetic analysis is an outstanding tool for early diagnosis of
cancer that can prolong patient survival (38). Previous clinical studies on OTSCC
development and progression reported increased incidence and
mortality rates due to the lack of knowledge on OTSCC (39,40). The
present study identified 11 DEGs (five upregulated and six
downregulated genes) from four mRNA expression profile datasets via
GEO. These DEGs were significantly associated with OTSCC
pathogenesis. The present study therefore focused on the five
upregulated DEGs since they may be considered as potential reliable
biomarkers. These five target genes were categorized into three
classes according to their associated biological functions
(molecular functions, biological processes and cellular components)
thanks to the GO enrichment using multiple approaches. The results
demonstrated that all genes were involved in extracellular matrix
disassembly and were localized in the extracellular region during
cancer development. Furthermore, expression levels of these genes
were positively correlated with each other and upregulated in OTSCC
and HNSC tissues compared with adjacent normal tissues, as
confirmed using DAVID.
Expression levels of four MMP family members,
including MMP1, MMP3, MMP10 and MMP12, were
upregulated in HNSC tissues compared with adjacent normal tissues.
These genes serve important functions in numerous physiological and
pathological processes involved in tumor progression and can
promote tumor-induced angiogenesis and extracellular matrix
disassembly, enhancing therefore tumor invasion and metastasis
(41,42). MMP1 is known to be
significantly associated with poor clinical outcomes and is
therefore a robust prognostic factor for various types of cancer,
including colorectal cancer and breast cancer (43–45).
Furthermore, MMP3 has been proposed as a vital tumor
oncogene in numerous cancers, including pancreatic, pulmonary, and
mammary carcinoma (46). In
addition, MMP10 has been demonstrated to be a potential
clinical marker for cancer stem-like cells/cancer-initiating cells
in epithelial ovarian cancer (EOC) and may serve as a therapeutic
target in chemotherapy-resistant EOCs (47). MMP12 has been reported to be
highly expressed in nasopharyngeal carcinoma both in vitro
and in vivo, and is therefore a powerful tumor marker for
cancer metastasis (48).
Furthermore, LAMC2, which encodes the major component of
laminin-5, was one of the upregulated genes in the present study.
Highly expression levels of LAMC2 have been previously
reported in numerous invasive tumors (49,50),
including carcinomas of the lung (51), the colorectum (52,53) and
the pancreas (54,55). In addition, it has been reported that
LAMC2 overexpression in esophageal cancer is associated with
poor survival (56,57). Subsequently, MMP1,
MMP3, MMP10, MMP12 and LAMC2 may serve as
novel promising prognostic factors in advanced metastasis of OTSCC.
The protein expression of MMP1, MMP3, MMP10, MMP12 and LAMC2 should
be further confirmed in OTSCC tissues. Furthermore, the correlation
between MMP1, MMP3, MMP10, MMP12 and LAMC2 protein expression and
the survival and clinic characteristics of patients with OTSCC
should be further assessed. Tissue samples from patients with OSTCC
are currently being collected for this purpose, and will be used
for immunohistochemistry analysis to detect MMPs protein
expression. Furthermore, the clinical significance, biological
function and underlying mechanism of MMPs on the pathogenesis and
progression of OTSCC will be further investigated.
In conclusion, the present study identified five
upregulated genes that may be considered as robust and reliable
biomarkers in OTSCC prognosis. The findings from this study may
help discovering the role of oncogenes in cancer progression and
determining the underlying pathways in order to develop novel
therapeutic strategies for OTSCC.
Acknowledgements
Not applicable.
Funding
The present study was funded by the National Natural
Science Foundation of China (grant no. 81673721) and the Natural
Science Foundation of Fujian Province (grant no. 2017I0007).
Availability of data and materials
The datasets used and/or analyzed during the current
study are available from the corresponding author on reasonable
request.
Authors' contributions
PZ, LL, YC and JP conceived and designed the
experiments. PZ, AS, ZC and XH performed GEO and GEO2R analyses.
LL, XH, YC and JL conducted gene ontology analyses using DAVID. BW,
JL, YC and JP analyzed TCGA database using GEPIA. LL, AS, ZC and YC
analyzed expressions of genes in OTSCC from the TCGA database. XH,
JL, BW and JL assessed the correlations among gene expressions
using cBioPortal. PZ, LL, YC and JP drafted the manuscript.
Ethics approval and consent to
participate
Not applicable.
Patient consent for publication
Not applicable.
Competing interest
The authors declare that they have no competing
interests.
Glossary
Abbreviations
Abbreviations:
|
HNSC
|
head and neck squamous cell
carcinoma
|
|
OTSCC
|
oral tongue squamous cell
carcinoma
|
|
DEG
|
differentially expressed gene
|
|
TCGA
|
The Cancer Genome Atlas
|
|
GEO
|
Gene Expression Omnibus
|
|
GO
|
Gene Ontology
|
References
|
1
|
Jemal A, Bray F, Center MM, Ferlay J, Ward
E and Forman D: Global cancer statistics. CA Cancer J Clin.
61:69–90. 2011. View Article : Google Scholar : PubMed/NCBI
|
|
2
|
Ledgerwood LG, Kumar D, Eterovic AK, Wick
J, Chen K, Zhao H, Tazi L, Manna P, Kerley S, Joshi R, et al: The
degree of intratumor mutational heterogeneity varies by primary
tumor sub-site. Oncotarget. 7:27185–27198. 2016. View Article : Google Scholar : PubMed/NCBI
|
|
3
|
Ye H, Yu T, Temam S, Ziober BL, Wang J,
Schwartz JL, Mao L, Wong DT and Zhou X: Transcriptomic dissection
of tongue squamous cell carcinoma. BMC Genomics. 9:692008.
View Article : Google Scholar : PubMed/NCBI
|
|
4
|
Döbrossy L: Epidemiology of head and neck
cancer: Magnitude of the problem. Cancer Metastasis Rev. 24:9–17.
2005. View Article : Google Scholar : PubMed/NCBI
|
|
5
|
Tímár J, Csuka O, Remenár E, Répássy G and
Kásler M: Progression of head and neck squamous cell cancer. Cancer
Metastasis Rev. 24:107–127. 2005. View Article : Google Scholar : PubMed/NCBI
|
|
6
|
Stransky N, Egloff AM, Tward AD, Kostic
AD, Cibulskis K, Sivachenko A, Kryukov GV, Lawrence MS, Sougnez C,
McKenna A, et al: The mutational landscape of head and neck
squamous cell carcinoma. Science. 333:1157–1160. 2011. View Article : Google Scholar : PubMed/NCBI
|
|
7
|
Patel SC, Carpenter WR, Tyree S, Couch ME,
Weissler M, Hackman T, Hayes DN, Shores C and Chera BS: Increasing
incidence of oral tongue squamous cell carcinoma in young white
women, age 18 to 44 years. J Clin Oncol. 29:1488–1494. 2011.
View Article : Google Scholar : PubMed/NCBI
|
|
8
|
Ng JH, Iyer NG, Tan MH and Edgren G:
Changing epidemiology of oral squamous cell carcinoma of the
tongue: A global study. Head Neck. 39:297–304. 2017. View Article : Google Scholar : PubMed/NCBI
|
|
9
|
Bello IO, Soini Y and Salo T: Prognostic
evaluation of oral tongue cancer: Means, markers and perspectives
(I). Oral Oncol. 46:630–635. 2010. View Article : Google Scholar : PubMed/NCBI
|
|
10
|
Almangush A, Heikkinen I, Mäkitie AA,
Coletta RD, Läärä E, Leivo I and Salo T: Prognostic biomarkers for
oral tongue squamous cell carcinoma: A systematic review and
meta-analysis. Br J Cancer. 117:856–866. 2017. View Article : Google Scholar : PubMed/NCBI
|
|
11
|
van Dijk BA, Brands MT, Geurts SM, Merkx
MA and Roodenburg JL: Trends in oral cavity cancer incidence,
mortality, survival and treatment in the Netherlands. Int J Cancer.
139:574–583. 2016. View Article : Google Scholar : PubMed/NCBI
|
|
12
|
Siegel RL, Miller KD and Jemal A: Cancer
statistics, 2017. CA Cancer J Clin. 67:7–30. 2017. View Article : Google Scholar : PubMed/NCBI
|
|
13
|
Thangaraj SV, Shyamsundar V, Krishnamurthy
A, Ramani P, Ganesan K, Muthuswami M and Ramshankar V: Molecular
portrait of oral tongue squamous cell carcinoma shown by
integrative meta-analysis of expression profiles with validations.
PLoS One. 11:e01565822016. View Article : Google Scholar : PubMed/NCBI
|
|
14
|
Ding X, Zhang N, Cai Y, Li S, Zheng C, Jin
Y, Yu T, Wang A and Zhou X: Down-regulation of tumor suppressor
MTUS1/ATIP is associated with enhanced proliferation, poor
differentiation and poor prognosis in oral tongue squamous cell
carcinoma. Mol Oncol. 6:73–80. 2012. View Article : Google Scholar : PubMed/NCBI
|
|
15
|
Eslami A, Miyaguchi K, Mogushi K, Watanabe
H, Okada N, Shibuya H, Mizushima H, Miura M and Tanaka H: PARVB
overexpression increases cell migration capability and defines high
risk for endophytic growth and metastasis in tongue squamous cell
carcinoma. Br J Cancer. 112:338–344. 2015. View Article : Google Scholar : PubMed/NCBI
|
|
16
|
Zhao T, Ding X, Chang B, Zhou X and Wang
A: MTUS1/ATIP3a down- regulation is associated with enhanced
migration, invasion and poor prognosis in salivary adenoid cystic
carcinoma. BMC Cancer. 15:2032015. View Article : Google Scholar : PubMed/NCBI
|
|
17
|
Rogler A, Hoja S, Giedl J, Ekici AB, Wach
S, Taubert H, Goebell PJ, Wullich B, Stöckle M, Lehmann J, et al:
Loss of MTUS1/ATIP expression is associated with adverse outcome in
advanced bladder carcinomas: Data from a retrospective study. BMC
Cancer. 14:2142014. View Article : Google Scholar : PubMed/NCBI
|
|
18
|
Bravou V, Antonacopoulou A, Papanikolaou
S, Nikou S, Lilis I, Giannopoulou E and Kalofonos HP: Focal
adhesion proteins α- and β-parvin are overexpressed in human
colorectal cancer and correlate with tumor progression. Cancer
Invest. 33:387–397. 2015. View Article : Google Scholar : PubMed/NCBI
|
|
19
|
Qiu Z, Sun W, Gao S, Zhou H, Tan W, Cao M
and Huang W: A 16-gene signature predicting prognosis of patients
with oral tongue squamous cell carcinoma. PeerJ. 5:e40622017.
View Article : Google Scholar : PubMed/NCBI
|
|
20
|
Bullinger L, Döhner K, Bair E, Fröhling S,
Schlenk RF, Tibshirani R, Döhner H and Pollack JR: Use of
gene-expression profiling to identify prognostic subclasses in
adult acute myeloid leukemia. N Engl J Med. 350:1605–1616. 2004.
View Article : Google Scholar : PubMed/NCBI
|
|
21
|
Valk PJ, Verhaak RG, Beijen MA, Erpelinck
CA, Barjesteh van Waalwijk van Doorn-Khosrovani S, Boer JM,
Beverloo HB, Moorhouse MJ, van der Spek PJ, Löwenberg B and Delwel
R: Prognostically useful gene-expression profiles in acute myeloid
leukemia. N Engl J Med. 350:1617–1628. 2004. View Article : Google Scholar : PubMed/NCBI
|
|
22
|
Vogelstein B, Papadopoulos N, Velculescu
VE, Zhou S, Diaz LA Jr and Kinzler KW: Cancer genome landscapes.
Science. 339:1546–1558. 2013. View Article : Google Scholar : PubMed/NCBI
|
|
23
|
Estilo CL, O-charoenrat P, Talbot S, Socci
ND, Carlson DL, Ghossein R, Williams T, Yonekawa Y, Ramanathan Y,
Boyle JO, et al: Oral tongue cancer gene expression profiling:
Identification of novel potential prognosticators by
oligonucleotide microarray analysis. BMC Cancer. 9:112009.
View Article : Google Scholar : PubMed/NCBI
|
|
24
|
Reis PP, Waldron L, Perez-Ordonez B,
Pintilie M, Galloni NN, Xuan Y, Cervigne NK, Warner GC, Makitie AA,
Simpson C, et al: A gene signature in histologically normal
surgical margins is predictive of oral carcinoma recurrence. BMC
Cancer. 11:4372011. View Article : Google Scholar : PubMed/NCBI
|
|
25
|
Krishnan NM, Dhas K, Nair J, Palve V,
Bagwan J, Siddappa G, Suresh A, Kekatpure VD, Kuriakose MA and
Panda B: A minimal DNA methylation signature in oral tongue
squamous cell carcinoma links altered methylation with tumor
attributes. Mol Cancer Res. 14:805–819. 2016. View Article : Google Scholar : PubMed/NCBI
|
|
26
|
Clough E and Barrett T: The gene
expression omnibus database. Methods Mol Biol. 1418:93–110. 2016.
View Article : Google Scholar : PubMed/NCBI
|
|
27
|
Davis S and Meltzer PS: GEOquery: A bridge
between the Gene Expression Omnibus (GEO) and BioConductor.
Bioinformatics. 23:1846–1847. 2007. View Article : Google Scholar : PubMed/NCBI
|
|
28
|
Ashburner M, Ball CA, Blake JA, Botstein
D, Butler H, Cherry JM, Davis AP, Dolinski K, Dwight SS, Eppig JT,
et al: Gene ontology: Tool for the unification of biology. The Gene
Ontology Consortium. Nat Genet. 25:25–29. 2000. View Article : Google Scholar : PubMed/NCBI
|
|
29
|
Huang da W, Sherman BT and Lempicki RA:
Systematic and integrative analysis of large gene lists using DAVID
bioinformatics resources. Nat Protoc. 4:44–57. 2009. View Article : Google Scholar : PubMed/NCBI
|
|
30
|
Mandel-Brehm C, Retallack H, Knudsen GM,
Yamana A, Hajj-Ali RA, Calabrese LH, Tihan T, Sample HA, Zorn KC,
Gorman MP, et al: Exploratory proteomic analysis implicates the
alternative complement cascade in primary CNS vasculitis.
Neurology. 93:e433–e444. 2019. View Article : Google Scholar : PubMed/NCBI
|
|
31
|
Zhu Y, Qiu P and Ji Y: TCGA-assembler:
Open-source software for retrieving and processing TCGA data. Nat
Methods. 11:599–600. 2014. View Article : Google Scholar : PubMed/NCBI
|
|
32
|
Doecke JD, Chekouo TT, Stingo F and Do KA:
miRNA target gene identification: Sourcing miRNA target gene
relationships for the analyses of TCGA illumina MiSeq and RNA-Seq
Hiseq platform data. Int J Hum Genet. 14:17–22. 2017. View Article : Google Scholar
|
|
33
|
Chen WJ, Tang RX, He RQ, Li DY, Liang L,
Zeng JH, Hu XH, Ma J, Li SK and Chen G: Clinical roles of the
aberrantly expressed lncRNAs in lung squamous cell carcinoma: A
studybased on RNA-sequencing and microarray data mining.
Oncotarget. 8:61282–61304. 2017.PubMed/NCBI
|
|
34
|
Tang Z, Li C, Kang B, Gao G, Li C and
Zhang Z: GEPIA: A web server for cancer and normal gene expression
profiling and interactive analyses. Nucleic Acids Res. 45:W98–W102.
2017. View Article : Google Scholar : PubMed/NCBI
|
|
35
|
Cerami E, Gao J, Dogrusoz U, Gross BE,
Sumer SO, Aksoy BA, Jacobsen A, Byrne CJ, Heuer ML, Larsson E, et
al: The cBio cancer genomics portal: An open platform for exploring
multidimensional cancer genomics data. Cancer Discov. 2:401–404.
2012. View Article : Google Scholar : PubMed/NCBI
|
|
36
|
Gao J, Aksoy BA, Dogrusoz U, Dresdner G,
Gross B, Sumer SO, Sun Y, Jacobsen A, Sinha R, Larsson E, et al:
Integrative analysis of complex cancer genomics and clinical
profiles using the cBioPortal. Sci Signal. 6:pl12013. View Article : Google Scholar : PubMed/NCBI
|
|
37
|
Amit M, Tam S, Takahashi H, Choi KY,
Zafereo M, Bell D and Weber RS: Prognostic performance of the
American Joint Committee on Cancer 8th edition of the TNM staging
system in patients with early oral tongue cancer. Head Neck.
41:1270–1276. 2019. View Article : Google Scholar : PubMed/NCBI
|
|
38
|
Cancer Genome Atlas Network, .
Comprehensive genomic characterization of head and neck squamous
cell carcinomas. Nature. 517:576–582. 2015. View Article : Google Scholar : PubMed/NCBI
|
|
39
|
Ashley EA: The precision medicine
initiative: A new national effort. JAMA. 313:2119–2120. 2015.
View Article : Google Scholar : PubMed/NCBI
|
|
40
|
Pitiyage G, Tilakaratne WM, Tavassoli M
and Warnakulasuriya S: Molecular markers in oral epithelial
dysplasia: Review. J Oral Pathol Med. 38:737–752. 2009. View Article : Google Scholar : PubMed/NCBI
|
|
41
|
Duffy MJ: Use of biomarkers in screening
for cancer. Adv Exp Med Biol. 867:27–39. 2015. View Article : Google Scholar : PubMed/NCBI
|
|
42
|
Kerkelä E and Saarialho-Kere U: Matrix
metalloproteinases in tumor progression: Focus on basal and
squamous cell skin cancer. Exp Dermatol. 12:109–125. 2003.
View Article : Google Scholar : PubMed/NCBI
|
|
43
|
Stamenkovic I: Matrix metalloproteinases
in tumor invasion and metastasis. Semin Cancer Biol. 10:415–433.
2000. View Article : Google Scholar : PubMed/NCBI
|
|
44
|
Li H, Zhong A, Li S, Meng X, Wang X, Xu F
and Lai M: The integrated pathway of TGFβ/Snail with TNFα/NFκB may
facilitate the tumor-stroma interaction in the EMT process and
colorectal cancer prognosis. Sci Rep. 7:49152017. View Article : Google Scholar : PubMed/NCBI
|
|
45
|
Shen CJ, Kuo YL, Chen CC, Chen MJ and
Cheng YM: MMP1 expression is activated by Slug and enhances
multi-drug resistance (MDR) in breast cancer. PLoS One.
12:e01744872017. View Article : Google Scholar : PubMed/NCBI
|
|
46
|
Lu X, Wang Q, Hu G, Van Poznak C, Fleisher
M, Reiss M, Massagué J and Kang Y: ADAMTS1 and MMP1 proteolytically
engage EGF-like ligands in an osteolytic signaling cascade for bone
metastasis. Genes Dev. 23:1882–1894. 2009. View Article : Google Scholar : PubMed/NCBI
|
|
47
|
Mehner C, Miller E, Nassar A, Bamlet WR,
Radisky ES and Radisky DC: Tumor cell expression of MMP3 as a
prognostic factor for poor survival in pancreatic, pulmonary, and
mammary carcinoma. Genes Cancer. 6:480–489. 2015.PubMed/NCBI
|
|
48
|
Mariya T, Hirohashi Y, Torigoe T, Tabuchi
Y, Asano T, Saijo H, Kuroda T, Yasuda K, Mizuuchi M, Saito T and
Sato N: Matrix metalloproteinase-10 regulates stemness of ovarian
cancer stem-like cells by activation of canonical Wnt signaling and
can be a target of chemotherapy-resistant ovarian cancer.
Oncotarget. 7:26806–26822. 2016. View Article : Google Scholar : PubMed/NCBI
|
|
49
|
Chung IC, Chen LC, Chung AK, Chao M, Huang
HY, Hsueh C, Tsang NM, Chang KP, Liang Y, Li HP and Chang YS:
Matrix metalloproteinase 12 is induced by heterogeneous nuclear
ribonucleoprotein K and promotes migration and invasion in
nasopharyngeal carcinoma. BMC Cancer. 14:3482014. View Article : Google Scholar : PubMed/NCBI
|
|
50
|
Koshikawa N, Moriyama K, Takamura H,
Mizushima H, Nagashima Y, Yanoma S and Miyazaki K: Overexpression
of laminin gamma 2 chain monomer in invading gastric carcinoma
cells. Cancer Res. 59:5596–5601. 1999.PubMed/NCBI
|
|
51
|
Pyke C, Salo S, Ralfkiaer E, Rømer J, Danø
K and Tryggvason K: Laminin-5 is a marker of invading cancer cells
in some human carcinomas and is coexpressed with the receptor for
urokinase plasminogen activator in budding cancer cells in colon
adenocarcinomas. Cancer Res. 55:4132–4139. 1995.PubMed/NCBI
|
|
52
|
Kagesato Y, Mizushima H, Koshikawa N,
Kitamura H, Hayashi H, Ogawa N, Tsukuda M and Miyazaki K: Sole
expression of laminin gamma 2 chain in invading tumor cells and its
association with stromal fibrosis in lung adenocarcinomas. Jpn J
Cancer Res. 92:184–192. 2001. View Article : Google Scholar : PubMed/NCBI
|
|
53
|
Hlubek F, Jung A, Kotzor N, Kirchner T and
Brabletz T: Expression of the invasion factor laminin gamma2 in
colorectal carcinomas is regulated by beta-catenin. Cancer Res.
61:8089–8093. 2001.PubMed/NCBI
|
|
54
|
Sordat I, Bosman FT, Dorta G, Rousselle P,
Aberdam D, Blum AL and Sordat B: Differential expression of
laminin-5 subunits and integrin receptors in human colorectal
neoplasia. J Pathol. 185:44–52. 1998. View Article : Google Scholar : PubMed/NCBI
|
|
55
|
Soini Y, Määttä M, Salo S, Tryggvason K
and Autio-Harmainen H: Expression of the laminin gamma 2 chain in
pancreatic adenocarcinoma. J Pathol. 180:290–294. 1996. View Article : Google Scholar : PubMed/NCBI
|
|
56
|
Takahashi S, Hasebe T, Oda T, Sasaki S,
Kinoshita T, Konishi M, Ochiai T and Ochiai A: Cytoplasmic
expression of laminin gamma2 chain correlates with postoperative
hepatic metastasis and poor prognosis in patients with pancreatic
ductal adenocarcinoma. Cancer. 94:1894–1901. 2002. View Article : Google Scholar : PubMed/NCBI
|
|
57
|
Yamamoto H, Itoh F, Iku S, Hosokawa M and
Imai K: Expression of the gamma(2) chain of laminin-5 at the
invasive front is associated with recurrence and poor prognosis in
human esophageal squamous cell carcinoma. Clin Cancer Res.
7:896–900. 2001.PubMed/NCBI
|