Introduction
Low rectal cancer (LRC) is located in an area that
is 6–8 cm away from the rectum (1).
LRC is a type of colorectal cancer that occurs at a specific
anatomical site and exhibits a specific biological behavior.
Compared with middle and upper rectal cancer, LRC possesses
different pathological types, clinical outcomes and surgical
options (2,3). Despite advancements in treatment
options for LRC and an improved understanding of its biological
characteristics, LRC remains a challenge to human health due to its
high local recurrence risk (4). The
accurate classification of molecular phenotype may significantly
contribute to monitoring the biological behavior of LRC and improve
the personalized prognosis for the disease.
The TP53 gene, located at the 17p13.1 locus of the
short arm of the human chromosome, covers an overall length of
16–20 kb and consists of 11 exons and 10 introns (5). The TP53 gene encodes an intranuclear
phosphorylated protein that consists of 393 amino acids, with a
25-kb mRNA transcription product (6,7).
Wild-type TP53 is a cancer suppressor gene that serves a crucial
role in multiple cellular processes, including the cell cycle, cell
apoptosis, cell aging, gene stability and the inhibition of
angiogenesis (8–10). By contrast, mutated TP53 can
stimulate cell division and function as an oncogene. It is well
understood that mutation of the TP53 gene and dysfunction of the
TP53 pathway is a characteristic hallmark of various types of human
malignancy (11). In addition to
mutations, polymorphisms in the TP53 gene may occur in coding and
non-coding sequences. According to previous studies, at least eight
polymorphic sites have been detected in the promoter region of the
TP53 gene, as well as in the first, second, third, sixth, seventh
and tenth intron regions, and in the seventh exon region. Among
these polymorphisms, three polymorphic sites have been associated
with genetic susceptibility to multiple cancer types. These include
a CD72 Arg/Pro polymorphism, a repetitive sequence inserted in 16
bp of the third intron region and a polymorphism of the restriction
enzyme digestion site of MspI in the sixth intron (12–14). As
one of these functional TP53 single nucleotide polymorphisms
(SNPs), the CD72 Arg/Pro polymorphism (rs1042522) has been studied
in colon cancer. One study reported that there was no evident
association between rs1042522 and colorectal cancer (15), while two study groups identified that
the rs1042522 polymorphic genotype was associated with increased
colon cancer risk (16,17).
With structural variation of the TP53 gene, abnormal
protein expression of p53 has also been revealed to be associated
with multiple cancer types, including colorectal cancer. A
literature review revealed that the overexpression of p53 is an
independent predictor for cancer survival (18). However, another study did not
identify a prognostic value of p53 in colorectal cancer (19). A further study demonstrated that p53
protein expression is associated with short-term prognosis in
colorectal cancer, since a significant association between p53
expression and rectal carcinoma was identified and the percentage
of p53 positive cells was associated with clinicopathological
variables (20).
Although the association between p53 and colorectal
cancer has been studied for a number of years, the majority of
previous studies failed to investigate colorectal cancer based on
the position of the lesion site or only divided colorectal cancer
into colon cancer and rectum cancer. Furthermore, the conclusions
of these previous studies have been contradictory. To the best of
our knowledge, the association between p53 and LRC has not been
investigated in previous studies. Therefore, it remains unclear
whether p53 protein expression is associated with TP53 gene
polymorphisms in LRC, and whether p53 protein expression is
associated with the biological behavior and prognosis of LRC.
Based on patients with or without LRC, associations
between the five most common polymorphic sites of the TP53 gene
(rs1042522, rs12947788, rs1625895, rs2909430 and rs12951053) and
p53 protein expression were investigated in the present study. In
addition, the associations between p53 protein expression and
biological behavior and the prognosis of LRC were systematically
studied. The overall aim of the current study was to provide
information that may be useful for the development of
individualized therapeutic strategies prior to surgery, and to
improve the biological behavior and prognosis of patients with LRC
in clinical practice.
Materials and methods
Patients
The current study was approved by the Medical Ethics
Committee of the First Hospital of China Medical University
(Shenyang, China) and written informed consent for use of samples
was obtained from all participants. A total of 347 patients
diagnosed with LRC (within 8 cm from the anal verge), treated by
surgery at the Department of Anus and Intestine Surgery of the
First Hospital of China Medical University (Shenyang, China)
between December 2011 and June 2016, were included in the present
study. A total of 353 patients with an anal benign lesion, but no
colorectal cancer, as determined by colonoscopy and rectal
examination, were hospitalized during the same period and used as
controls. The mean ages of patients with LRC and patients with an
anal benign lesion were 61.4±11.0 and 59.6±14.4 years,
respectively. The sex distribution (male vs. female) in patients
group and control group were 203:144 and 185:168, respectively.
The inclusion criteria were as follows: i) Rectal
cancer diagnosed within 8 cm of the anal verge; and ii) age >18
years old. The clinical diagnostic criteria for LRC were defined
according to the literature (21).
The exclusion criteria were as follows: i) Patients with an immune
system disease; ii) patients with an infectious disease; iii)
patients with primary tumors on other visceral organs prior to
surgery; and iv) patients who received neoadjuvant
chemoradiotherapy prior to surgery.
Sample and patient history
collection
The peripheral blood of each individual included in
the present study was collected prior to surgery for patients or
prior to colonoscopy for controls for genomic DNA extraction. Each
sample was immediately frozen and kept at −80°C until further use.
The basic information of each individual was collected using a
questionnaire, which included their sex, age, and smoking status
and alcohol consumption. Data regarding the Tumor-Node-Metastasis
(TNM) system classification, depth of invasion, growth pattern,
histological type, paracancerous lymphocyte infiltration status,
peripheral ganglion violation status, cancer embolus in
vascularization, lymph node metastasis and implantation in extra
nodes were extracted from the medical records of patients with LRC.
The overall survival (OS) of individuals following diagnosis or
treatment was assessed until August 2016.
Candidate TP53 gene SNP selection
To explore the association between TP53 gene
polymorphisms and p53 protein expression, a total of 5 SNPs
(rs1042522, rs12947788, rs1625895, rs2909430 and rs12951053) with a
minimum allele frequency <5% in the Chinese population were
selected based on the tagging information from the NCBI dbSNP
(https://www.ncbi.nlm.nih.gov/snp) and
International HapMap Project (www.hapmap.org) in 2016.
Kompetitive allele-specific polymerase
chain reaction (KASP™) genotyping assay
Genomic DNA was prepared from peripheral blood
mononuclear cells collected from patients using the QIAamp DNA
Blood Mini kit (Qiagen China Co., Ltd., Shanghai, China) according
to the manufacture's protocol and stored at −80°C. SNP genotyping
was performed applying KASP with an SNPLine platform (LGC
Genomics). The steps of the PCR were as follows: i) The extracted
DNA samples were diluted in 30 µl TE buffer (concentration ≥60
ng/µl) in 96-well plates, and transferred into 384-well plates and
1536-well plates by Replikator (final concentration ~10 ng/µl); ii)
the 1536-well plates containing DNA samples were dried in an oven
at 65°C for 30 min; iii) the PCR reaction system (1 µl) was
constructed and the sequences of primers used were presented in
Table I; iv) plates with reaction
system were sealed and centrifuged at 12,000 × g; v) PCR was
performed in water bath after centrifugation according to the
thermal cycling conditions presented in Table II; vi) plates with completed
reaction were cooled down and read with a microplate reader
Pherastar (BMG Labtech GmbH); and vii) additional PCR would be
performed to double check the genotyping results if necessary.
 | Table I.Sequences of the primers used for the
Kompetitive allele specific polymerase chain reaction. |
Table I.
Sequences of the primers used for the
Kompetitive allele specific polymerase chain reaction.
| SNPs | Primer sequences |
|---|
| rs1042522 |
|
|
Forward |
GGGTCTTACGGTCTCCGACGAGGGG |
|
Reverse |
GCACCGGGGACGTGGTCGTCGAGGA |
| rs12947788 |
|
|
Forward |
CCTCTGCTTGCCTCTGACCCCTGGG |
|
Reverse |
CCACCTCTTACCGATTTCTTCCATA |
| rs1625895 |
|
|
Forward |
ATTCCCACCAACAGTCACCGGGAGG |
|
Reverse |
CCACTCGTCATCCCCCCGAAAGAGG |
| rs2909430 |
|
|
Forward |
GATCACCCAACGTCCTCCACGAATG |
|
Reverse |
GTACAAACAAAGAAACGACGGCAGA |
| rs12951053 |
|
|
Forward |
CTGGGCCCACCTCTTACCGATTTCT |
|
Reverse |
CCATACTACTACCCATCCACCTCTC |
| Table II.Thermocycling conditions for the
polymerase chain reaction. |
Table II.
Thermocycling conditions for the
polymerase chain reaction.
| Steps | Temperature | Duration | Number of cycles |
|---|
| 1 |
|
|
|
|
Activation | 94°C | 15 min | 1 |
| 2 |
|
|
|
|
Denaturation | 94°C | 20 sec | 10 |
|
Annealing/Elongation | 55-61°C | 60 sec |
|
| 3 |
|
|
|
|
Denaturation | 94°C | 20 sec | 26 |
|
Annealing/Elongation | 55°C | 60 sec |
|
Immunohistochemistry assay
Tissue specimens were fixed with 10% formalin at
room temperature for 24 h and embedded with paraffin and cut into
4-µm sections. Immunohistochemical staining was performed using
Ultra Sensitive™ SP kit (cat. no. KIT-9709/9719; Maixin, Fuzhou,
China) according to the manufacturer's protocol. Sections were
deparaffinized and rehydrated through ethanol gradient (100, 95 and
75% ethanol for 5 min each), incubated in 10 mM citrate buffer (pH
6.0) and heated in a microwave oven for 5 min. After cooling,
slides were incubated with blocker of endogenous peroxidase
activity (buffer A in the kit) at room temperature for 1 h, and
blocked with normal goat serum (one drop; buffer B in the kit) for
30 min at room temperature. Sections were washed with PBS,
incubated with anti-p53 rabbit polyclonal antibody (1:100; cat. no.
ab131442; Abcam, Cambridge, UK) for 1 h r at room temperature, with
biotin-conjugated secondary antibody (one drop, buffer C in the
kit) for 10 min at room temperature, and with HPR-Streptomycin (one
drop, buffer D in the kit) for 10 min at room temperature. Signal
was visualized with the 3′-diaminobenzidine visualization kit.
(cat. no. dab-0031; Fuzhou Maixin Biotech Co., Ltd.). Slides were
observed with an inverted microscopy (Olympus Corporation, Tokyo,
Japan).
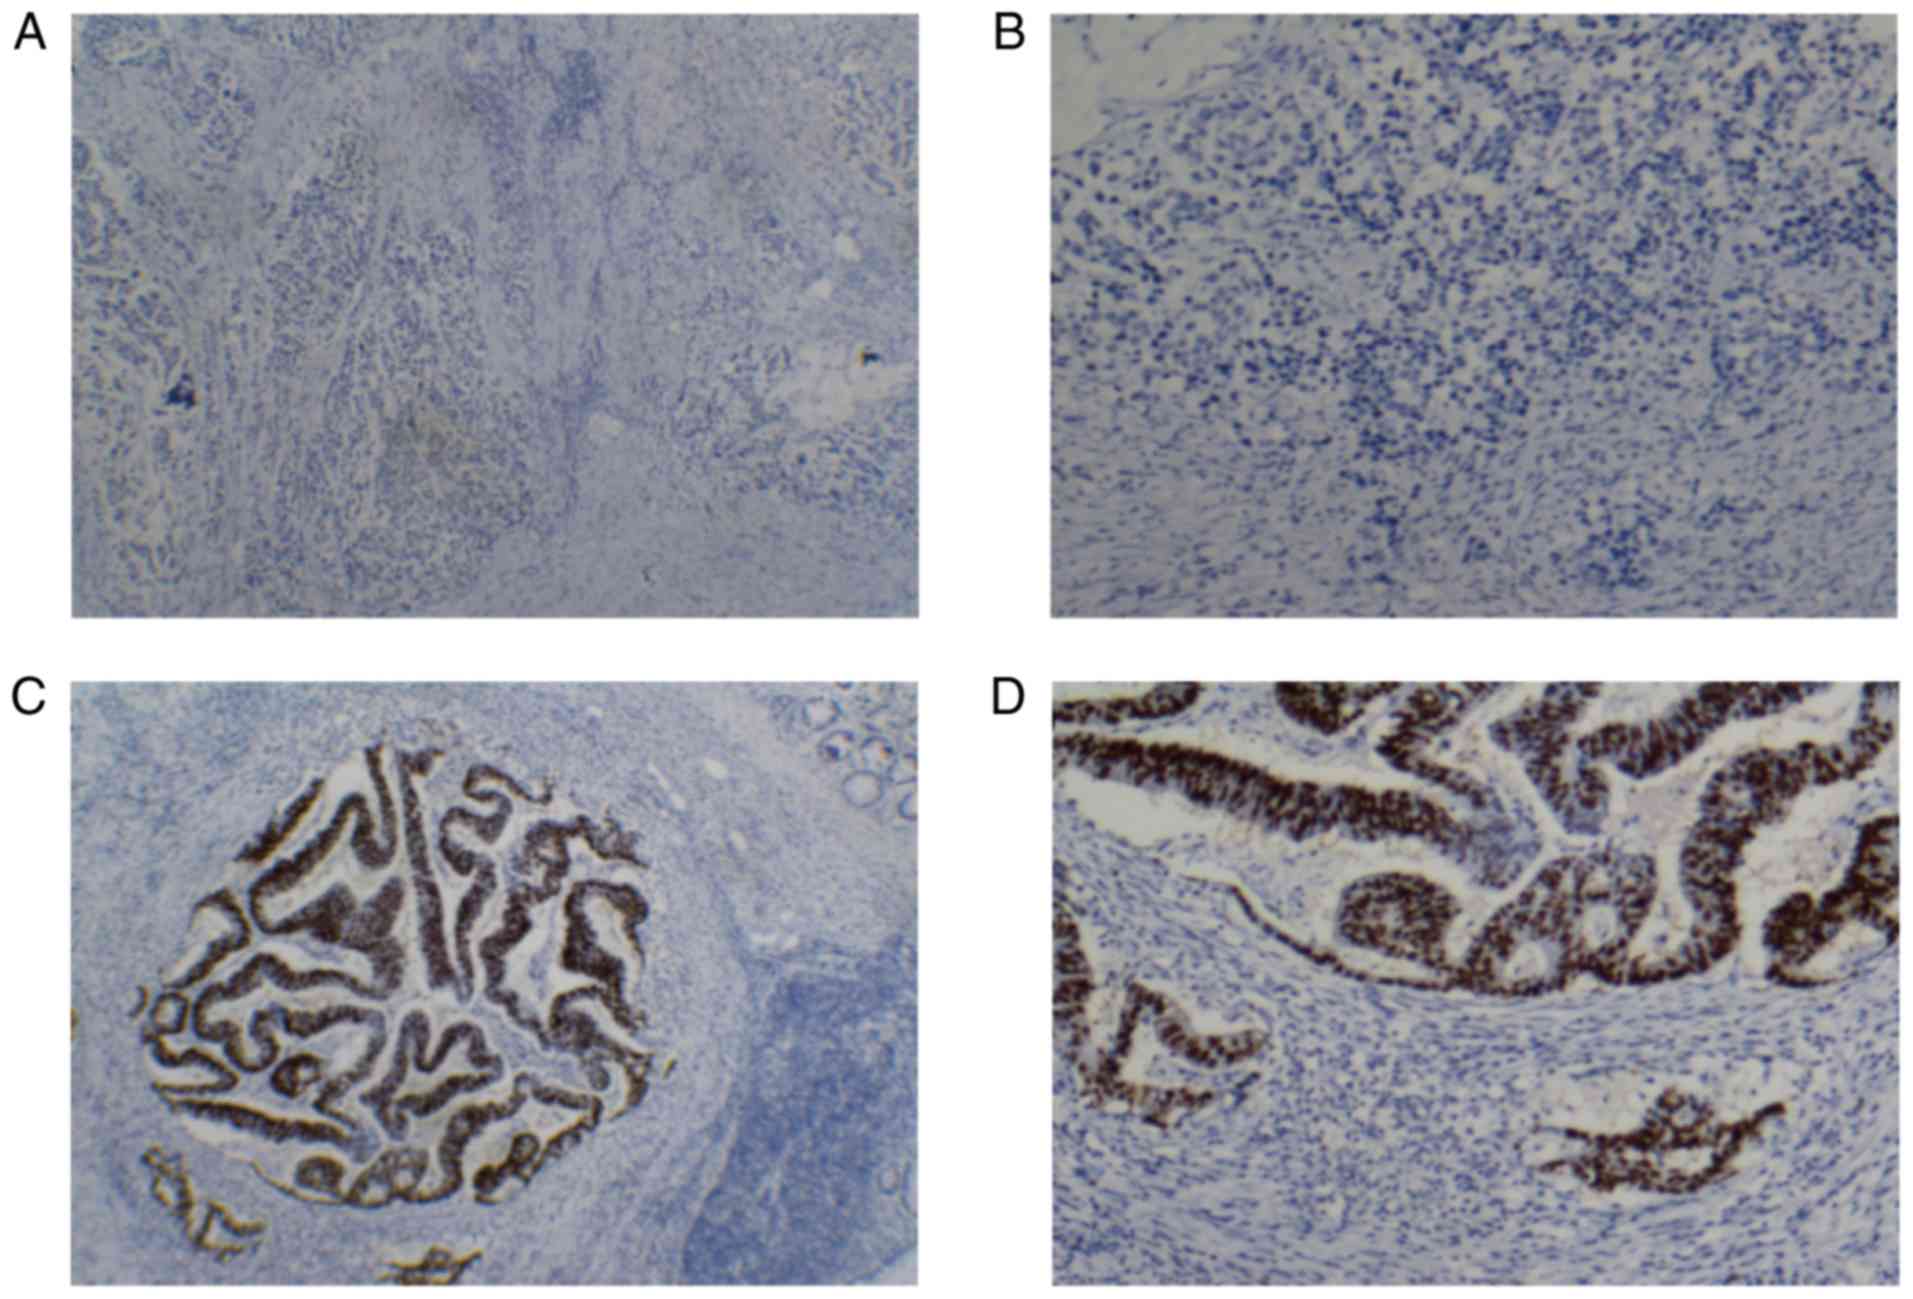
p53 protein expression was independently read and
scored by two pathologists, in accordance with the double-blind
principle. A senior pathologist was consulted with regard to
inconsistent scores in order to arrive at a consensus. Positive p53
protein expression was located in the nuclei of cancer cells and
appeared as stronger brown granules under a microscope with high
magnification (×40). Subsequently, the positive p53 protein
expression area was detected under a microscope with low
magnification (×10). A total of 10 fields of each slide were
randomly selected under a microscope with high magnification and
100 cancer cells were counted in each field. The percentage of
cancer cells with positive p53 protein expression was calculated.
The scores for positive p53 expression were determined according to
the percentage of p53-positive cells in each sample as follows:
Negative, <10%; positive +, 10–30%); ++, 30–50%; and +++,
50–100%.
Statistical analysis
Statistical analysis was performed using SPSS 20.0
software (IBM Corp., Armonk, NY, USA). Independent sample t-test
was used to compare the differences between two groups, and one-way
ANOVA followed by Tukey post-hoc analysis was used to compare the
differences among multiple groups (>2). Parameters that
reflected the behavior and prognosis of LRC in each genotype were
represented by hazard ratios (HR) and 95% confidence intervals
(CIs). The HR values were calculated by multivariate Cox
proportional hazards regression analysis. The χ2 test
was used to evaluate the association between TP53 gene polymorphism
and p53 protein expression, or between p53 protein expression and
the clinical pathological parameters of LRC. The log-rank test was
used to compare the survival times between the groups. P<0.05
was considered to indicate a statistically significant
difference.
Results
Association between TP53 gene
polymorphism and p53 protein expression
To study the influence of TP53 gene polymorphism on
the protein expression of p53, five polymorphic loci of the TP53
gene (rs1042522, rs12947788, rs1625895, rs2909430 and rs12951053)
and the protein expression level of p53 in the 347 patients
diagnosed with LRC were detected. Results revealed that the TP53
rs1042522 polymorphism was associated with p53 protein expression
[CG (heterozygous) vs. GG (mutant), P=0.027; CC (wide-type) + CG
vs. GG, P=0.032], indicating that positive p53 protein expression
was significantly higher compared with other genotypes in the
heterozygous and dominant models (Table III and Fig. 1). The other four polymorphic loci
were not identified to be associated with p53 protein
expression.
| Table III.Associations between polymorphisms of
the TP53 gene and p53 protein expression. |
Table III.
Associations between polymorphisms of
the TP53 gene and p53 protein expression.
|
| Genotype | Heterozygous
vs.wild-type | Mutant vs.
wild-type | Dominant model | Recessive model |
|---|
|
|
|
|
|
|
|
|---|
| p53 protein
expression | Wild-type, n | Heterozygous,
n | Mutant, n | P-value | P-value | P-value | P-value |
|---|
| rs1042522 |
|
|
| 0.027 | 0.239 | 0.032 | 0.905 |
|
Positive | 64 | 135 | 49 |
|
|
|
|
|
Negative | 37 | 43 | 19 |
|
|
|
|
| rs12947788 |
|
|
| 0.203 | 0.990 | 0.278 | 0.659 |
|
Positive | 97 | 125 | 26 |
|
|
|
|
|
Negative | 45 | 42 | 12 |
|
|
|
|
| rs1625895 |
|
|
| 0.280 |
|
|
|
|
Positive | 221 | 27 |
|
|
|
|
|
|
Negative | 92 | 7 |
|
|
|
|
|
| rs2909430 |
|
|
| 0.204 |
|
|
|
|
Positive | 216 | 32 |
|
|
|
|
|
|
Negative | 91 | 8 |
|
|
|
|
|
| rs12951053 |
|
|
| 0.154 | 0.787 | 0.191 | 0.905 |
|
Positive | 116 | 108 | 24 |
|
|
|
|
|
Negative | 54 | 35 | 10 |
|
|
|
|
Protein expression of p53 is
associated with the biological characteristics of LRC
In the present study, the association between time
survival and clinicopathological parameters of LRC, including TNM
classification, depth of invasion, histological type, paracancerous
lymphocyte infiltration, ganglion infiltration, vascular cancer
embolus, lymph node metastasis and extranodal implantation status
were analyzed (Table IV). The
χ2 test revealed that the protein expression of p53 was
not significantly associated with the clinicopathological
parameters in the whole population (Table V). However, following stratification
of the patients by classic risk factors, including sex, age,
smoking status and alcohol consumption, the results revealed a
significant association between the protein expression of p53 and
the clinicopathological parameters of LRC. In female patients, the
protein expression of p53 in stage III–IV was significantly higher
compared with that in stage I–II (P=0.044). Furthermore, in
patients with an age ≥60 years, histological type, TNM stage and
depth of tumor invasion were all associated with the protein
expression of p53 (P=0.002, P=0.049 and P=0.034, respectively). The
protein expression of p53 was significantly higher in
poorly-differentiated tumors compared with well-differentiated
tumors, in stage III–IV compared with stage I–II, and in the T3-4
stage compared with the T1-2 stage. In patients with a history of
smoking, the p53 protein expression was significantly associated
with the occurrence of lymph node metastasis (P=0.032). In contrast
to smokers, the p53 protein expression level in
poorly-differentiated tumors was significantly higher compared with
well-differentiated tumors in non-smokers (P=0.047; Table VI).
| Table IV.Clinical characteristics and overall
survival time of patients with low rectal cancer. |
Table IV.
Clinical characteristics and overall
survival time of patients with low rectal cancer.
| Characteristic | Low rectal cancer,
n | Mortality, n | Median survival
time | P-value |
|---|
| Sex | 304 | 44 |
| 0.193 |
|
Male | 178 | 29 | 38.504 |
|
|
Female | 126 | 15 | 38.908 |
|
| Age, years | 304 | 44 |
| 0.827 |
|
≤60 | 138 | 20 | 39.656 |
|
|
>60 | 166 | 24 | 38.362 |
|
| TNM stage | 303 | 44 |
|
3.246×10⁻¹⁰ |
|
I–II | 181 | 8 | 43.197 |
|
|
III–IV | 122 | 36 | 33.081 |
|
| Depth of
infiltration | 304 | 44 |
| 0.003 |
|
T1+T2 | 87 | 4 | 42.988 |
|
|
T3+T4 | 217 | 40 | 37.261 |
|
| Lymph node
metastasis | 303 | 44 |
|
2.406×10⁻¹¹ |
|
Negative | 193 | 8 | 43.288 |
|
|
Positive | 110 | 36 | 32.490 |
|
| Histological
type | 304 | 44 |
|
4.1911×10⁻⁸ |
|
Well-differentiated | 195 | 13 | 42.412 |
|
| Poorly
differentiated | 109 | 31 | 32.060 |
|
| Peripheral
lymphocyte infiltration | 283 | 41 |
| 0.619 |
|
Negative | 24 | 4 | 40.125 |
|
|
Positive | 259 | 37 | 35.165 |
|
| Peripheral ganglion
violation | 266 | 39 |
| 0.002 |
|
Negative | 72 | 4 | 38.586 |
|
|
Positive | 194 | 35 | 32.952 |
|
| Vascular cancer
embolus | 293 | 44 |
| 0.001 |
|
Negative | 222 | 25 | 40.574 |
|
|
Positive | 71 | 19 | 33.467 |
|
| Implantation in
extra nodes | 264 | 39 |
| <0.001 |
|
Negative | 246 | 30 | 35.886 |
|
|
Positive | 18 | 9 | 23.202 |
|
| Table V.Overall association analysis between
p53 protein expression and characteristics of low rectal
cancer. |
Table V.
Overall association analysis between
p53 protein expression and characteristics of low rectal
cancer.
|
| p53 protein
expression | p53 protein
expression level |
|---|
|
|
|
|
|---|
| Characteristic
(n) | Positive, n | Negative, n | P-value | +++, n | ++, n | +, n | -, n | P-value |
|---|
| Lymph node
metastasis (n=346) |
|
| 0.851 |
|
|
|
| 0.182 |
|
Positive | 100 | 39 |
| 66 | 30 | 4 | 39 |
|
|
Negative | 147 | 60 |
| 97 | 33 | 16 | 60 |
|
| Histological type
(n=347) |
|
| 0.990 |
|
|
|
| 0.056 |
|
Well-differentiated | 158 | 63 |
| 114 | 32 | 11 | 63 |
|
| Poorly
differentiated | 90 | 36 |
| 50 | 31 | 9 | 36 |
|
| TNM stage
(n=347) |
|
| 0.879 |
|
|
|
| 0.304 |
|
III–IV | 108 | 44 |
| 72 | 31 | 5 | 44 |
|
|
I–II | 140 | 55 |
| 92 | 32 | 15 | 55 |
|
| Depth of
infiltration (n=347) |
|
| 0.254 |
|
|
|
| 0.165 |
|
T3+T4 | 127 | 57 |
| 82 | 37 | 7 | 57 |
|
|
T1+T2 | 122 | 47 |
| 83 | 26 | 13 | 42 |
|
| Growth mode
(n=347) |
|
| 0.384 |
|
|
|
| 0.308 |
| Nested
growth | 143 | 52 |
| 93 | 41 | 9 | 52 |
|
|
Infiltration growth | 105 | 47 |
| 71 | 22 | 11 | 47 |
|
| Vascular cancer
embolus (n=336) |
|
| 0.368 |
|
|
|
| 0.672 |
|
Positive | 58 | 27 |
| 38 | 17 | 3 | 27 |
|
|
Negative | 184 | 67 |
| 124 | 45 | 14 | 67 |
|
| Extranodal
implantation (n=305) |
|
| 0.507 |
|
|
|
| 0.685 |
|
Positive | 13 | 7 |
| 10 | 3 | 0 | 7 |
|
|
Negative | 205 | 80 |
| 137 | 52 | 15 | 80 |
|
| Ganglion violation
(n=307) |
|
| 0.595 |
|
|
|
| 0.260 |
|
Positive | 163 | 67 |
| 111 | 43 | 8 | 67 |
|
|
Negative | 57 | 20 |
| 37 | 13 | 7 | 20 |
|
| Peripheral
lymphatic infiltration (n=326) |
|
| 0.454 |
|
|
|
| 0.829 |
|
Positive | 214 | 87 |
| 146 | 52 | 15 | 87 |
|
|
Negative | 16 | 9 |
| 10 | 5 | 1 | 9 |
|
| Table VI.Stratified association analysis
between p53 protein expression and characteristics of low rectal
cancer. |
Table VI.
Stratified association analysis
between p53 protein expression and characteristics of low rectal
cancer.
| A, Male sex |
|---|
|
|---|
|
| p53 protein
expression | p53 protein
expression level |
|---|
|
|
|
|
| Characteristic | Positive, n | Negative, n | P-value | +++, n | ++, n | +, n | -, n | P-value |
|---|
| Lymph node
metastasis |
|
| 0.412 |
|
|
|
| 0.567 |
|
Positive | 57 | 26 |
| 42 | 14 | 1 | 26 |
|
|
Negative | 88 | 31 |
| 60 | 22 | 5 | 31 |
|
| Histological
type |
|
| 0.171 |
|
|
|
| 0.136 |
|
Well-differentiated | 97 | 32 |
| 73 | 19 | 4 | 32 |
|
| Poorly
differentiated | 49 | 25 |
| 30 | 17 | 2 | 25 |
|
| TNM stage |
|
|
|
|
|
|
|
|
|
III–IV | 62 | 28 |
| 48 | 13 | 1 | 28 |
|
|
I–II | 84 | 29 |
| 55 | 23 | 5 | 29 |
|
| Depth of
infiltration |
|
| 0.755 |
|
|
|
| 0.317 |
|
T3+T4 | 81 | 33 |
| 54 | 24 | 2 | 33 |
|
|
T1+T2 | 65 | 24 |
| 49 | 12 | 4 | 24 |
|
| Growth mode |
|
| 0.857 |
|
|
|
| 0.057 |
| Nested
growth | 84 | 32 |
| 57 | 26 | 1 | 32 |
|
|
Infiltration growth | 62 | 25 |
| 46 | 10 | 5 | 25 |
|
| Vascular cancer
embolus |
|
| 0.506 |
|
|
|
| 0.447 |
|
Positive | 35 | 16 |
| 22 | 12 | 1 | 16 |
|
|
Negative | 108 | 39 |
| 80 | 23 | 4 | 39 |
|
| Extranodal
implantation |
|
| 0.786 |
|
|
|
| 0.934 |
|
Positive | 9 | 4 |
| 7 | 2 | 0 | 4 |
|
|
Negative | 120 | 45 |
| 85 | 30 | 4 | 45 |
|
| Ganglion
violation |
|
| 0.335 |
|
|
|
| 0.335 |
|
Positive | 98 | 40 |
| 68 | 27 | 2 | 40 |
|
|
Negative | 33 | 9 |
| 25 | 6 | 2 | 9 |
|
| Peripheral
lymphatic infiltration |
|
| 0.325 |
|
|
|
| 0.582 |
|
Positive | 126 | 49 |
| 91 | 6 | 2 | 49 |
|
|
Negative | 9 | 6 |
| 8 | 30 | 4 | 6 |
|
|
| B, Female
sex |
|
|
| p53 protein
expression | p53 protein
expression level |
|
|
|
|
|
Characteristic | Positive,
n | Negative,
n | P-value | +++, n | ++, n | +, n | -, n | P-value |
|
| Lymph node
metastasis |
|
| 0.210 |
|
|
|
| 0.054 |
|
Positive | 43 | 13 |
| 24 | 16 | 3 | 13 |
|
|
Negative | 59 | 29 |
| 37 | 11 | 11 | 29 |
|
| Histological
type |
|
| 0.112 |
|
|
|
| 0.104 |
|
Well-differentiated | 61 | 31 |
| 41 | 13 | 7 | 31 |
|
| Poorly
differentiated | 41 | 11 |
| 20 | 14 | 7 | 11 |
|
| TNM stage |
|
|
|
|
|
|
|
|
|
III–IV | 46 | 16 |
| 24 | 18 | 4 | 16 |
|
|
I–II | 56 | 26 |
| 37 | 9 | 10 | 26 |
|
| Depth of
infiltration |
|
| 0.155 |
|
|
|
| 0.458 |
|
T3+T4 | 45 | 24 |
| 27 | 13 | 5 | 24 |
|
|
T1+T2 | 57 | 18 |
| 34 | 14 | 9 | 18 |
|
| Growth mode |
|
| 0.262 |
|
|
|
| 0.717 |
| Nested
growth | 59 | 20 |
| 36 | 15 | 8 | 20 |
|
|
Infiltration growth | 43 | 22 |
| 25 | 12 | 6 | 22 |
|
| Vascular cancer
embolus |
|
| 0.542 |
|
|
|
| 0.716 |
|
Positive | 23 | 11 |
| 16 | 5 | 2 | 11 |
|
|
Negative | 76 | 28 |
| 44 | 22 | 10 | 28 |
|
| Extranodal
implantation |
|
| 0.442 |
|
|
|
| 0.773 |
|
Positive | 4 | 3 |
| 3 | 1 | 0 | 3 |
|
|
Negative | 85 | 35 |
| 52 | 22 | 11 | 35 |
|
| Ganglion
violation |
|
| 0.819 |
|
|
|
| 0.423 |
|
Positive | 65 | 27 |
| 43 | 16 | 6 | 27 |
|
|
Negative | 24 | 11 |
| 12 | 7 | 5 | 11 |
|
| Peripheral
lymphatic infiltration |
|
| 0.992 |
|
|
|
| 0.294 |
|
Positive | 88 | 38 |
| 55 | 22 | 11 | 38 |
|
|
Negative | 7 | 3 |
| 2 | 4 | 1 | 3 |
|
|
| C, Age ≥60
years |
|
|
| p53 protein
expression | p53 protein
expression level |
|
|
|
|
|
Characteristic | Positive,
n | Negative,
n | P-value | +++, n | ++, n | +, n | -, n | P-value |
|
| Lymph node
metastasis |
|
| 0.212 |
|
|
|
| 0.166 |
|
Positive | 50 | 23 |
| 33 | 16 | 1 | 23 |
|
|
Negative | 95 | 29 |
| 64 | 22 | 9 | 29 |
|
| Histological
type |
|
| 0.127 |
|
|
|
| 0.002 |
|
Well-differentiated | 96 | 28 |
| 73 | 16 | 7 | 28 |
|
| Poorly
differentiated | 50 | 24 |
| 25 | 22 | 3 | 24 |
|
| TNM stage |
|
| 0.073 |
|
|
|
| 0.049 |
|
III–IV | 55 | 27 |
| 36 | 18 | 1 | 27 |
|
| I–II
staging | 91 | 25 |
| 62 | 20 | 9 | 25 |
|
| Depth of
infiltration |
|
| 0.130 |
|
|
|
| 0.034 |
|
T3+T4 | 72 | 32 |
| 44 | 25 | 3 | 32 |
|
|
T1+T2 | 74 | 20 |
| 54 | 13 | 7 | 20 |
|
| Growth
mode |
|
| 0.729 |
|
|
|
| 0.227 |
| Nested
growth | 83 | 31 |
| 55 | 25 | 3 | 31 |
|
|
Infiltration growth | 63 | 21 |
| 43 | 13 | 7 | 21 |
|
| Vascular cancer
embolus |
|
| 0.158 |
|
|
|
| 0.482 |
|
Positive | 29 | 15 |
| 20 | 8 | 1 | 15 |
|
|
Negative | 114 | 35 |
| 77 | 29 | 8 | 35 |
|
| Extranodal
implantation |
|
| 0.199 |
|
|
|
| 0.529 |
|
Positive | 5 | 4 |
| 3 | 2 | 0 | 4 |
|
|
Negative | 125 | 42 |
| 85 | 32 | 8 | 42 |
|
| Ganglion
violation |
|
| 0.107 |
|
|
|
| 0.205 |
|
Positive | 93 | 38 |
| 63 | 26 | 4 | 38 |
|
|
Negative | 39 | 8 |
| 26 | 9 | 4 | 8 |
|
| Peripheral
lymphatic infiltration |
|
| 0.336 |
|
|
|
| 0.551 |
|
Positive | 130 | 46 |
| 90 | 33 | 7 | 46 |
|
|
Negative | 6 | 4 |
| 4 | 1 | 1 | 4 |
|
|
| D, Age <60
years |
|
|
| p53 protein
expression | p53 protein
expression level |
|
|
|
|
|
Characteristic | Positive,
n | Negative,
n | P-value | +++, n | ++, n | +, n | -, n | P-value |
|
| Lymph node
metastasis |
|
| 0.087 |
|
|
|
| 0.166 |
|
Positive | 50 | 16 |
| 33 | 14 | 3 | 16 |
|
|
Negative | 52 | 31 |
| 33 | 11 | 7 | 31 |
|
| Histological
type |
|
| 0.103 |
|
|
|
| 0.184 |
|
Well-differentiated | 62 | 35 |
| 41 | 16 | 4 | 35 |
|
| Poorly
differentiated | 40 | 12 |
| 25 | 9 | 6 | 12 |
|
| TNM stage |
|
| 0.073 |
|
|
|
| 0.245 |
|
III–IV | 53 | 17 |
| 36 | 13 | 4 | 17 |
|
|
I–II | 49 | 30 |
| 30 | 12 | 6 | 30 |
|
| Depth of
infiltration |
|
| 0.977 |
|
|
|
| 0.760 |
|
T3+T4 | 54 | 25 |
| 37 | 12 | 4 | 25 |
|
|
T1+T2 | 48 | 22 |
| 29 | 13 | 6 | 22 |
|
| Growth mode |
|
| 0.107 |
|
|
|
| 0.375 |
| Nested
growth | 60 | 21 |
| 38 | 16 | 6 | 21 |
|
|
Infiltration growth | 42 | 26 |
| 28 | 9 | 4 | 26 |
|
| Vascular cancer
embolus |
|
| 0.805 |
|
|
|
| 0.855 |
|
Positive | 29 | 12 |
| 18 | 9 | 2 | 12 |
|
|
Negative | 20 | 32 |
| 47 | 16 | 6 | 32 |
|
| Extranodal
implantation |
|
| 0.737 |
|
|
|
| 0.585 |
|
Positive | 8 | 3 |
| 7 | 1 | 0 | 3 |
|
|
Negative | 80 | 38 |
| 52 | 20 | 7 | 38 |
|
| Ganglion
violation |
|
| 0.270 |
|
|
|
| 0.358 |
|
Positive | 70 | 29 |
| 48 | 17 | 4 | 29 |
|
|
Negative | 18 | 12 |
| 11 | 4 | 3 | 12 |
|
| Peripheral
lymphatic infiltration |
|
| 0.967 |
|
|
|
| 0.554 |
|
Positive | 84 | 41 |
| 56 | 19 | 8 | 41 |
|
|
Negative | 10 | 5 |
| 6 | 4 | 0 | 5 |
|
|
| E,
Smoker |
|
|
| p53 protein
expression | p53 protein
expression level |
|
|
|
|
|
Characteristic | Positive,
n | Negative,
n | P-value | +++, n | ++, n | +, n | -, n | P-value |
|
| Lymph node
metastasis |
|
| 0.032 |
|
|
|
| 0.095 |
|
Positive | 26 | 16 |
| 18 | 7 | 1 | 16 |
|
|
Negative | 54 | 13 |
| 40 | 8 | 5 | 13 |
|
|
Histological type |
|
| 0.198 |
|
|
|
| 0.608 |
|
Well-differentiated | 58 | 17 |
| 43 | 10 | 4 | 17 |
|
| Poorly
differentiated | 23 | 12 |
| 16 | 5 | 2 | 12 |
|
| TNM stage |
|
|
|
|
|
|
|
|
|
III–IV | 31 | 16 |
| 24 | 6 | 1 | 16 |
|
|
I–II | 50 | 13 |
| 35 | 9 | 5 | 13 |
|
| Depth of
infiltration |
|
| 0.135 |
|
|
|
| 0.375 |
|
T3+T4 | 40 | 19 |
| 30 | 7 | 2 | 19 |
|
|
T1+T2 | 41 | 10 |
| 29 | 8 | 4 | 10 |
|
| Growth mode |
|
| 0.608 |
|
|
|
| 0.381 |
| Nested
growth | 43 | 17 |
| 29 | 11 | 3 | 17 |
|
|
Infiltration growth | 38 | 12 |
| 30 | 4 | 3 | 12 |
|
| Vascular cancer
embolus |
|
| 0.882 |
|
|
|
| 0.114 |
|
Positive | 18 | 6 |
| 10 | 7 | 1 | 6 |
|
|
Negative | 61 | 22 |
| 48 | 8 | 4 | 22 |
|
| Extranodal
implantation |
|
| 0.226 |
|
|
|
| 0.578 |
|
Positive | 4 | 0 |
| 3 | 1 | 0 | 0 |
|
|
Negative | 70 | 26 |
| 51 | 13 | 5 | 26 |
|
| Ganglion
violation |
|
| 0.625 |
|
|
|
| 0.392 |
|
Positive | 54 | 20 |
| 40 | 11 | 2 | 20 |
|
|
Negative | 21 | 6 |
| 14 | 4 | 3 | 6 |
|
| Peripheral
lymphatic infiltration |
|
| 0.269 |
|
|
|
| 0.642 |
|
Positive | 77 | 26 |
| 56 | 15 | 5 | 26 |
|
|
Negative | 2 | 2 |
| 2 | 0 | 0 | 2 |
|
|
| F,
Non-smoker |
|
|
| p53 protein
expression | p53 protein
expression level |
|
|
|
|
|
Characteristic | Positive,
n | Negative,
n | P-value | +++, n | ++, n | +, n | -, n | P-value |
|
| Lymph node
metastasis |
|
| 0.102 |
|
|
|
| 0.109 |
|
Positive | 74 | 23 |
| 48 | 23 | 3 | 23 |
|
|
Negative | 93 | 47 |
| 57 | 25 | 11 | 47 |
|
| Histological
type |
|
| 0.400 |
|
|
|
| 0.047 |
|
Well-differentiated | 100 | 46 |
| 71 | 22 | 7 | 46 |
|
|
Poorly-differentiated | 67 | 24 |
| 34 | 26 | 7 | 24 |
|
| TNM stage |
|
|
|
|
|
|
|
|
|
III–IV | 77 | 28 |
| 48 | 25 | 4 | 28 |
|
|
I–II | 90 | 42 |
| 57 | 23 | 10 | 42 |
|
| Depth of
infiltration |
|
| 0.695 |
|
|
|
| 0.237 |
|
T3+T4 | 86 | 38 |
| 51 | 30 | 5 | 38 |
|
|
T1+T2 | 81 | 32 |
| 54 | 18 | 9 | 32 |
|
| Growth mode |
|
| 0.161 |
|
|
|
| 0.284 |
| Nested
growth | 100 | 35 |
| 64 | 30 | 6 | 35 |
|
|
Infiltration growth | 67 | 35 |
| 41 | 18 | 8 | 35 |
|
| Vascular cancer
embolus |
|
| 0.259 |
|
|
|
| 0.529 |
|
Positive | 40 | 21 |
| 28 | 10 | 2 | 21 |
|
|
Negative | 123 | 45 |
| 76 | 37 | 10 | 45 |
|
| Extranodal
implantation |
|
| 0.202 |
|
|
|
| 0.478 |
|
Positive | 9 | 7 |
| 7 | 2 | 0 | 7 |
|
|
Negative | 135 | 54 |
| 86 | 39 | 10 | 54 |
|
| Ganglion
violation |
|
| 0.774 |
|
|
|
| 0.676 |
|
Positive | 109 | 47 |
| 71 | 32 | 6 | 47 |
|
|
Negative | 36 | 14 |
| 23 | 9 | 4 | 14 |
|
| Peripheral
lymphatic infiltration |
|
| 0.812 |
|
|
|
| 0.912 |
|
Positive | 137 | 61 |
| 90 | 37 | 10 | 61 |
|
|
Negative | 14 | 7 |
| 8 | 5 | 1 | 7 |
|
|
| G, Alcohol
consumption |
|
|
| p53 protein
expression | p53 protein
expression level |
|
|
|
|
|
Characteristic | Positive,
n | Negative,
n | P-value | +++, n | ++, n | +, n | -, n | P-value |
|
| Lymph node
metastasis |
|
| 0.816 |
|
|
|
| 0.499 |
|
Positive | 11 | 4 |
| 7 | 4 | 0 | 4 |
|
|
Negative | 21 | 9 |
| 16 | 3 | 1 | 9 |
|
| Histological
type |
|
| 0.458 |
|
|
|
| 0.243 |
|
Well-differentiated | 24 | 8 |
| 19 | 4 | 0 | 8 |
|
| Poorly
differentiated | 9 | 5 |
| 5 | 3 | 1 | 5 |
|
| TNM stage |
|
|
|
|
|
|
|
|
|
III–IV | 12 | 4 |
| 8 | 4 | 0 | 4 |
|
|
I–II | 21 | 9 |
| 16 | 3 | 1 | 9 |
|
| Depth of
infiltration |
|
| 0.818 |
|
|
|
| 0.718 |
|
T3+T4 | 19 | 7 |
| 14 | 4 | 0 | 7 |
|
|
T1+T2 | 14 | 6 |
| 10 | 3 | 1 | 6 |
|
| Growth mode |
|
| 0.818 |
|
|
|
| 0.575 |
| Nested
growth | 19 | 7 |
| 14 | 5 | 0 | 7 |
|
|
Infiltration growth | 14 | 6 |
| 10 | 2 | 1 | 6 |
|
| Vascular cancer
embolus |
|
| 0.452 |
|
|
|
| 0.363 |
|
Positive | 8 | 2 |
| 5 | 3 | 0 | 2 |
|
|
Negative | 23 | 11 |
| 18 | 3 | 1 | 11 |
|
| Extranodal
implantation |
|
| 0.220 |
|
|
|
| 0.496 |
|
Positive | 3 | 0 |
| 2 | 1 | 0 | 0 |
|
|
Negative | 25 | 13 |
| 19 | 4 | 1 | 13 |
|
| Ganglion
violation |
|
| 0.226 |
|
|
|
| 0.130 |
|
Positive | 23 | 8 |
| 17 | 5 | 0 | 8 |
|
|
Negative | 6 | 5 |
| 5 | 0 | 1 | 5 |
|
| Peripheral
lymphatic infiltration |
|
| 0.314 |
|
|
|
| 0.613 |
|
Positive | 25 | 13 |
| 19 | 4 | 1 | 13 |
|
|
Negative | 2 | 0 |
| 2 | 0 | 0 | 0 |
|
|
| H, No alcohol
consumption |
|
|
| p53 protein
expression | p53 protein
expression level |
|
|
|
|
|
Characteristic | Positive,
n | Negative,
n | P-value | +++, n | ++, n | +, n | -, n | P-value |
|
| Lymph node
metastasis |
|
| 0.912 |
|
|
|
| 0.275 |
|
Positive | 89 | 35 |
| 59 | 26 | 4 | 35 |
|
|
Negative | 126 | 51 |
| 81 | 30 | 15 | 51 |
|
| Histological
type |
|
| 0.792 |
|
|
|
| 0.127 |
|
Well-differentiated | 134 | 55 |
| 95 | 28 | 11 | 55 |
|
| Poorly
differentiated | 81 | 31 |
| 45 | 28 | 8 | 31 |
|
| TNM stage |
|
|
|
|
|
|
|
|
|
III–IV | 96 | 40 |
| 64 | 27 | 5 | 40 |
|
|
I–II | 119 | 46 |
| 76 | 29 | 14 | 46 |
|
| Depth of
infiltration |
|
| 0.189 |
|
|
|
| 0.166 |
|
T3+T4 | 107 | 50 |
| 67 | 33 | 7 | 50 |
|
|
T1+T2 | 108 | 36 |
| 73 | 23 | 12 | 36 |
|
| Growth mode |
|
| 0.398 |
|
|
|
| 0.455 |
| Nested
growth | 124 | 45 |
| 79 | 36 | 9 | 45 |
|
|
Infiltration growth | 91 | 41 |
| 61 | 20 | 10 | 41 |
|
| Vascular cancer
embolus |
|
| 0.209 |
|
|
|
| 0.608 |
|
Positive | 50 | 25 |
| 33 | 14 | 3 | 25 |
|
|
Negative | 161 | 56 |
| 106 | 42 | 13 | 56 |
|
| Extranodal
implantation |
|
| 0.212 |
|
|
|
| 0.461 |
|
Positive | 10 | 7 |
| 8 | 2 | 0 | 7 |
|
|
Negative | 180 | 67 |
| 118 | 48 | 14 | 67 |
|
| Ganglion
violation |
|
| 0.277 |
|
|
|
| 0.349 |
|
Positive | 140 | 59 |
| 94 | 38 | 8 | 59 |
|
|
Negative | 51 | 15 |
| 32 | 13 | 6 | 15 |
|
| Peripheral
lymphatic infiltration |
|
| 0.265 |
|
|
|
| 0.599 |
|
Positive | 189 | 74 |
| 127 | 48 | 14 | 74 |
|
|
Negative | 14 | 9 |
| 8 | 5 | 1 | 9 |
|
p53 protein expression is associated
with the prognosis of LRC
To further determine whether p53 protein expression
is an independent prognostic factor for LRC, univariate and
multivariate Cox proportional hazards regression analyses were
conducted (Table VII). Univariate
survival analysis revealed a significant association between the
protein expression of p53 and the OS for LRC; the survival time of
patients with low p53 expression was significantly longer compared
with that of patients with high p53 expression [hazard ratio (HR),
2.071; 95% CI, 1.083–3.958; P=0.028]. However, the multivariate
survival analysis revealed that the protein expression level of p53
was no longer associated with the survival time in all patients
with LRC (HR, 1.580; 95% CI, 0.791–3.154; P=0.195) (Table VII). Following stratification of
the patients according to risk factors of LRC, including sex, age,
smoking status and drinking status, the results revealed that the
survival time of patients with low p53 protein expression was
significantly longer compared with patients with high p53 protein
expression in female patients (HR, 3.280; 95% CI, 1.043–10.311;
P=0.042) and non-smokers (HR, 2.724; 95% CI, 1.223–6.066; P=0.014).
Multivariate analysis for patients with an age ≥60 years revealed
that patients with low p53 protein expression had a longer survival
time compared with patients with high p53 protein expression
(P=0.021; HR, 3.425; 95% CI, 1.208–9.712).
| Table VII.Association analysis between p53
protein expression and the prognosis of low rectal cancer. |
Table VII.
Association analysis between p53
protein expression and the prognosis of low rectal cancer.
| A, Overall
analysis |
|---|
|
|---|
|
|
|
|
| Univariate | Multivariate |
|---|
|
|
|
|
|
|
|
|---|
| p53 protein
expression | Low rectal cancer,
n | Mortality, n | Median survival
time, months | P-value | HR | 95% CI | P-value | HR | 95% CI |
|---|
| Low expression | 137 | 13 | 41.235 |
| 1 (ref.) |
|
| 1 (ref) |
|
| High
expression | 167 | 31 | 37.137 | 0.028 | 2.071 | 1.083–3.958 | 0.195 | 1.580 | 0.791–3.154 |
|
| B,
Stratification analysis |
|
|
|
|
|
|
Univariate |
Multivariate |
|
|
|
|
|
|
|
| p53 protein
expression | Low rectal
cancer, n | Mortality,
n | Median survival
time, months | P-value | HR | 95% CI | P-value | HR | 95% CI |
|
| Sex |
|
|
|
|
|
|
|
|
|
|
Male |
|
|
|
|
|
|
|
|
|
|
Low
expression | 71 | 9 | 39.821 |
| 1 (ref.) |
|
| 1 (ref.) |
|
|
High
expression | 107 | 20 | 36.890 | 0.312 | 1.501 | 0.683–3.298 | 0.750 | 1.153 | 0.481–2.764 |
|
Female |
|
|
|
|
|
|
|
|
|
|
Low
expression | 66 | 4 | 40.939 |
| 1 (ref.) |
|
| 1 (ref.) |
|
|
High
expression | 60 | 11 | 36.694 | 0.042 | 3.280 | 1.043–10.311 | 0.139 | 2.890 | 0.708–11.792 |
| Age, years |
|
|
|
|
|
|
|
|
|
|
≥60 |
|
|
|
|
|
|
|
|
|
|
Low
expression | 71 | 6 | 40.783 |
| 1 (ref.) |
|
| 1 (ref.) |
|
|
High
expression | 95 | 18 | 36.734 | 0.083 | 2.268 | 0.900–5.716 | 0.021 | 3.425 | 1.208–9.712 |
|
<60 |
|
|
|
|
|
|
|
|
|
|
Low
expression | 66 | 7 | 40.983 |
| 1 (ref.) |
|
| 1 (ref.) |
|
|
High
expression | 72 | 13 | 36.819 | 0.182 | 1.871 | 0.745–4.696 | 0.848 | 0.908 | 0.339–2.431 |
| Smoking status |
|
|
|
|
|
|
|
|
|
|
Smoker |
|
|
|
|
|
|
|
|
|
|
Low
expression | 38 | 5 | 38.281 |
| 1 (ref.) |
|
| 1 (ref.) |
|
|
High
expression | 56 | 7 | 38.217 | 0.896 | 1.079 | 0.342–3.410 | 0.815 | 0.852 | 0.223–3.256 |
|
Non-smoker |
|
|
|
|
|
|
|
|
|
|
Low
expression | 99 | 8 | 41.879 |
| 1 (ref.) |
|
| 1 (ref.) |
|
|
High
expression | 111 | 24 | 36.564 | 0.014 | 2.724 | 1.223–6.066 | 0.081 | 2.185 | 0.909–5.254 |
| Alcohol
consumption |
|
|
|
|
|
|
|
|
|
|
Consumption |
|
|
|
|
|
|
|
|
|
|
Low
expression | 15 | 0 |
|
| 1 (ref.) |
|
| 1 (ref.) |
|
|
High
expression | 28 | 4 |
| 0.371 | 41.001 | 0.132–1.987 | 1.000 | 1.000 | 0.094–10.593 |
| No
consumption |
|
|
|
|
|
|
|
|
|
|
Low
expression | 122 | 13 | 40.841 |
| 1 (ref.) |
|
| 1 (ref.) |
|
|
High
expression | 139 | 27 | 36.914 | 0.054 | 1.918 | 0.990–3.718 | 0.224 | 1.559 | 0.762–3.189 |
Discussion
As a subtype of colorectal cancer at a special
anatomical site, LRC is characterized by its specific biological
behavior. TP53 is one of the most important cancer suppressor
genes, and structural variation and abnormal expression of p53 have
been identified to be associated with numerous cancer types
(22–25). However, the associations between TP53
gene polymorphisms and protein expression, and the association of
p53 protein expression with the biological behavior and prognosis
of LRC have not been clearly investigated. Understanding these
associations is important for the preoperative assessment of LRC
and the development of individualized treatments. The present study
investigated the associations between TP53 gene polymorphisms and
p53 protein expression, and the associations between p53 protein
expression and the biological behavior and prognosis of LRC. The
overall aim was to address the role of TP53 gene polymorphisms and
p53 protein expression in the biological behavior and prognosis of
LRC.
Genetic polymorphisms are a common genetic
variation, which may affect the expression of proteins and protein
function (26–29). In the present study, the associations
between the five most common TP53 SNPs (rs1042522, rs12947788,
rs1625895, rs2909430 and rs12951053) and p53 protein expression
were evaluated. The results revealed that the TP53 rs1042522
polymorphism was associated with p53 protein expression, which was
evidenced by the significantly higher p53 protein expression in
TP53 rs1042522 mutant carriers compared with that in the other
genotypes. No associations were identified between p53 protein
expression and the other TP53 SNPs. Among the five polymorphic loci
selected in the present study, only rs1042522 was located in the
exon region, whereas the other four polymorphic loci were located
in the intron region. This indicated that the rs1042522
polymorphism may be present in the coding sequence of the TP53
gene, affecting therefore the protein expression of p53 (30). However, this does not indicate that
other polymorphisms are not functionally important, since SNPs that
are not located in protein coding regions may affect other
processes, including gene splicing, which requires further
investigation.
Although previous studies have been conducted to
investigate the protein expression of p53 and its association with
the clinical biological behavior and prognosis of colorectal
cancer, results from these studies have been inconsistent.
Furthermore, to the best of our knowledge, systematic studies
focusing on LRC have not previously been performed. Therefore, the
association between p53 expression and LRC at 6–8 cm from the anal
margin was investigated in the present study. Overall analysis
results revealed that there was no significant association between
p53 protein expression and the clinicopathological parameters of
LRC. However, following stratification analysis, an association was
identified between lymphatic metastasis in smokers and p53 protein
expression. Furthermore, histological type, TNM stage and tumor
infiltration depth were associated with p53 expression level in
patients ≥60 years old. In addition, p53 expression was markedly
higher in poorly-differentiated, III–IV phase or T3-4 phase tumors,
and a significant association was revealed between p53 expression
level and TNM stage in female patients, which was evidently higher
in III–IV phase female patients. Additionally, an association was
identified between p53 expression and the histological type of LRC
among non-smokers.
The survival time of patients with low p53 protein
expression was significantly longer in females, non-smokers and
patients ≥60 years old. These results indicate that p53 protein
expression may be used as an indicator for the prognosis of LRC,
particularly for patients ≥60 years old, non-smokers, patients with
III–IV phase tumor or female patients with T3-4 phase tumors.
Although the exact mechanism requires further exploration, the
current findings indicate that p53 protein expression should be
regularly screened in the aforementioned subgroups of patients to
enable individualized treatments that improve clinical outcomes in
future clinical practice.
In conclusion, the TP53 rs1042522 polymorphism
affects the p53 protein expression in LRC, and p53 protein
expression is associated with the biological behavior and prognosis
of LRC. Therefore, the TP53 rs1042522 polymorphism and p53 protein
expression may serve as indicators to predict the biological
behavior and prognosis of LRC.
Acknowledgements
Not applicable.
Funding
The present study was supported by the National
Science and Technology Support Program (grant no. 2015BAI13B07) and
the National Key R&D Program (grant no. 2016YFC1303202).
Availability of data and materials
All data generated or analyzed during the present
study are included in this published article.
Authors' contributions
YY designed the study. CX, GZ, ZW and LS collected
the samples and performed the experiments. QX, ZL and JL performed
the statistical analysis. GZ and QX drafted the manuscript. YY
revised the manuscript. All authors approved final version of the
manuscript.
Ethics approval and consent to
participate
This study was approved by the Medical Ethics
Committee of the First Hospital of China Medical University
(Shenyang, China) and written informed consent was obtained from
all participants.
Patient consent for publication
Not applicable.
Competing interests
The authors declare that they have no competing
interests.
References
|
1
|
Pachler J and Wille-Jørgensen P: Quality
of life after rectal resection for cancer, with or without
permanent colostomy. Cochrane Database Syst Rev.
12:CD0043232012.PubMed/NCBI
|
|
2
|
Sarver AL, Li L and Subramanian S:
MicroRNA miR-183 functions as an oncogene by targeting the
transcription factor EGR1 and promoting tumor cell migration.
Cancer Res. 70:9570–9580. 2010. View Article : Google Scholar : PubMed/NCBI
|
|
3
|
Liu Y, Zhang H, Zhou K, Chen L, Xu Z,
Zhong Y, Liu H, Li R, Shugart YY, Wei Q, et al: Tagging SNPs in
non-homologous end-joining pathway genes and risk of glioma.
Carcinogenesis. 28:1906–1913. 2007. View Article : Google Scholar : PubMed/NCBI
|
|
4
|
Liu Y, Zhou K, Zhang H, Shugart YY, Chen
L, Xu Z, Zhong Y, Liu H, Jin L, Wei Q, et al: Polymorphisms of LIG4
and XRCC4 involved in the NHEJ pathway interact to modify risk of
glioma. Hum Mutat. 29:381–389. 2008. View Article : Google Scholar : PubMed/NCBI
|
|
5
|
Liu Y, Shete S, Etzel CJ, Scheurer M,
Alexiou G, Armstrong G, Tsavachidis S, Liang FW, Gilbert M, Aldape
K, et al: Polymorphisms of LIG4, BTBD2, HMGA2, and RTEL1 genes
involved in the double-strand break repair pathway predict
glioblastoma survival. J Clin Oncol. 28:2467–2474. 2010. View Article : Google Scholar : PubMed/NCBI
|
|
6
|
Soussi T and Béroud C: Assessing TP53
status in human tumours to evaluate clinical outcome. Nat Rev
Cancer. 1:233–240. 2001. View
Article : Google Scholar : PubMed/NCBI
|
|
7
|
Bénard J, Douc-Rasy S and Ahomadegbe JC:
TP53 family members and human cancers. Hum Mutat. 21:182–191. 2003.
View Article : Google Scholar : PubMed/NCBI
|
|
8
|
Li D, Suzuki H, Liu B, Morris J, Liu J,
Okazaki T, Li Y, Chang P and Abbruzzese JL: DNA repair gene
polymorphisms and risk of pancreatic cancer. Clin Cancer Res.
15:740–746. 2009. View Article : Google Scholar : PubMed/NCBI
|
|
9
|
Liu H and Zhou M: Evaluation of p53 gene
expression and prognosis characteristics in uveal melanoma cases.
Onco Targets Ther. 10:3429–3434. 2017. View Article : Google Scholar : PubMed/NCBI
|
|
10
|
Chava S, Mohan V, Shetty PJ, Manolla ML,
Vaidya S, Khan IA, Waseem GL, Boddala P, Ahuja YR and Hasan Q:
Immunohistochemical evaluation of p53, FHIT, and IGF2 gene
expression in esophageal cancer. Dis Esophagus. 25:81–87. 2012.
View Article : Google Scholar : PubMed/NCBI
|
|
11
|
Vogelstein B, Lane D and Levine AJ:
Surfing the p53 network. Nature. 408:307–310. 2000. View Article : Google Scholar : PubMed/NCBI
|
|
12
|
Tefre T, Ryberg D, Haugen A, Nebert DW,
Skaug V, Brøgger A and Børresen AL: Human CYP1A1 (cytochrome P
(1)450) gene: Lack of association between the Msp I restriction
fragment length polymorphism and incidence of lung cancer in a
Norwegian population. Pharmacogenetics. 1:20–25. 1991. View Article : Google Scholar : PubMed/NCBI
|
|
13
|
Slattery ML, Samowtiz W, Ma K, Murtaugh M,
Sweeney C, Levin TR and Neuhausen S: CYP1A1, cigarette smoking, and
colon and rectal cancer. Am J Epidemiol. 160:842–852. 2004.
View Article : Google Scholar : PubMed/NCBI
|
|
14
|
Kiyohara C, Washio M, Horiuchi T, Asami T,
Ide S, Atsumi T, Kobashi G, Takahashi H and Tada Y; Kyushu Sapporo
SLE (KYSS) Study Group, : Risk modification by CYP1A1 and GSTM1
polymorphisms in the association of cigarette smoking and systemic
lupus erythematosus in a Japanese population. Scand J Rheumatol.
41:103–109. 2012. View Article : Google Scholar : PubMed/NCBI
|
|
15
|
Goodman JE, Mechanic LE, Luke BT, Ambs S,
Chanock S and Harris CC: Exploring SNP-SNP interactions and colon
cancer risk using polymorphism interaction analysis. Int J Cancer.
118:1790–1797. 2006. View Article : Google Scholar : PubMed/NCBI
|
|
16
|
Tan XL, Nieters A, Hoffmeister M, Beckmann
L, Brenner H and Chang-Claude J: Genetic polymorphisms in Tp53,
nonsteroidal anti-inflammatory drugs and the risk of colorectal
cancer: Evidence for gene-environment interaction? Pharmacogenet
Genomics. 17:639–645. 2007. View Article : Google Scholar : PubMed/NCBI
|
|
17
|
Li XL, Zhou J, Chen ZR and Chng WJ: P53
mutations in colorectal cancer-molecular pathogenesis and
pharmacological reactivation. World J Gastroenterol. 21:84–93.
2015. View Article : Google Scholar : PubMed/NCBI
|
|
18
|
Kahlenberg MS, Stoler DL, Rodriguez-Bigas
MA, Weber TK, Driscoll DL, Anderson GR and Petrelli NJ: p53 tumor
suppressor gene mutations predict decreased survival of patients
with sporadic colorectal carcinoma. Cancer. 88:1814–1819. 2000.
View Article : Google Scholar : PubMed/NCBI
|
|
19
|
Mulder JW, Baas IO, Polak MM, Goodman SN
and Offerhaus GJ: Evaluation of p53 protein expression as a marker
for long-term prognosis in colorectal carcinoma. Br J Cancer.
71:1257–1262. 1995. View Article : Google Scholar : PubMed/NCBI
|
|
20
|
Erhan Y, Korkut MA, Kara E, Aydede H,
Sakarya A and Ilkgü O: Value of p53 protein expression and its
relationship with short-term prognosis in colorectal cancer. Ann
Saudi Med. 22:377–380. 2002. View Article : Google Scholar : PubMed/NCBI
|
|
21
|
Glimelius B, Tiret E, Cervantes A and
Arnold D; ESMO Guidelines Working Group, : Rectal cancer: ESMO
clinical practice guidelines for diagnosis, treatment and
follow-up. Ann Oncol. 24 (Suppl 6):vi81–vi88. 2013. View Article : Google Scholar : PubMed/NCBI
|
|
22
|
Albibas AA, Rose-Zerilli MJJ, Lai C,
Pengelly RJ, Lockett GA, Theaker J, Ennis S, Holloway JW and Healy
E: Subclonal evolution of cancer-related gene mutations in p53
immunopositive patches in human skin. J Invest Dermatol.
138:189–198. 2018. View Article : Google Scholar : PubMed/NCBI
|
|
23
|
Duffy MJ, Synnott NC and Crown J: Mutant
p53 as a target for cancer treatment. Eur J Cancer. 83:258–265.
2017. View Article : Google Scholar : PubMed/NCBI
|
|
24
|
Jen J, Lin LL, Lo FY, Chen HT, Liao SY,
Tang YA, Su WC, Salgia R, Hsu CL, Huang HC, et al: Oncoprotein
ZNF322A transcriptionally deregulates alpha-adducin, cyclin D1 and
p53 to promote tumor growth and metastasis in lung cancer.
Oncogene. 36:52192017. View Article : Google Scholar : PubMed/NCBI
|
|
25
|
Chaudhary R, Gryder B, Woods WS,
Subramanian M, Jones MF, Li XL, Jenkins LM, Shabalina SA, Mo M,
Dasso M, et al: Prosurvival long noncoding RNA PINCR regulates a
subset of p53 targets in human colorectal cancer cells by binding
to Matrin 3. Elife. 6(pii): e232442017. View Article : Google Scholar : PubMed/NCBI
|
|
26
|
Jiang Z, Hennein L, Xu Y, Bao N, Coh P and
Tao L: Elevated serum monocyte chemoattractant protein-1 levels and
its genetic polymorphism is associated with diabetic retinopathy in
Chinese patients with type 2 diabetes. Diabet Med. 33:84–690. 2016.
View Article : Google Scholar : PubMed/NCBI
|
|
27
|
Zlotorynski E: Cancer biology: A Neat
target of p53. Nat Rev Mol Cell Biol. 18:5322017. View Article : Google Scholar : PubMed/NCBI
|
|
28
|
Boiocchi C, Osera C, Monti MC, Ferraro OE,
Govoni S, Cuccia M, Montomoli C, Pascale A and Bergamaschi R: Are
Hsp70 protein expression and genetic polymorphism implicated in
multiple sclerosis inflammation? J Neuroimmunol. 268:84–88. 2014.
View Article : Google Scholar : PubMed/NCBI
|
|
29
|
Yao C, Li G, Cai M, Qian Y, Wang L, Xiao
L, Thaiss F and Shi B: Expression and genetic polymorphism of
necroptosis related protein RIPK1 is correlated with severe hepatic
ischemia-reperfusion injury and prognosis after hepatectomy in
hepatocellular carcinoma patients. Cancer Biomark. 20:23–29. 2017.
View Article : Google Scholar : PubMed/NCBI
|
|
30
|
Naccarati A, Polakova V, Pardini B,
Vodickova L, Hemminki K, Kumar R and Vodicka P: Mutations and
polymorphisms in TP53 gene-an overview on the role in colorectal
cancer. Mutagenesis. 27:211–218. 2012. View Article : Google Scholar : PubMed/NCBI
|