Introduction
Cancer cells reprogram their metabolism to increase
energy and nutrient depots for their continuous biosynthetic
requirements (1). While healthy
cells follow rigorous metabolic pathways that secure the balance
between anabolism and catabolism, cancer cells override these
molecular checkpoints and increase their anabolism, at the cost of
the catabolism of the host (2).
The malignant metabolic reprogramming occurs at the
three main pathways: Glycolysis, glutaminolysis and de novo
fatty acid (FA) synthesis. Therefore, cancer cells commonly
overexpress hexokinase-II (HK2), glutaminase-1 (GLS1) and fatty
acid synthase (FASN) (3). In
addition to their energetic requirements, malignant cells require
macromolecule synthesis, including synthesis of nucleotides, amino
acids and lipids. Glucose and glutamine supply the majority of the
necessary carbon and nitrogen atoms required for the synthesis of
macromolecules. These atoms further serve as reducing equivalents
in order to support cell growth (4,5).
Regarding lipogenesis, malignant cells synthesize de novo FA
instead of removing them from circulation. Therefore, cancer cells
frequently overexpress FASN (6).
Regarding the de novo synthesis of FA, both glucose and
glutamine supply citrate. Glucose is converted to acetyl-CoA in the
mitochondria in order to produce citrate in the tricarboxylic acid
cycle, whereas glutamine maintains citrate production by supplying
the carbon in the form of mitochondrial oxaloacetate. Therefore,
the metabolism of glutamine and glucose supports the production of
acetyl-CoA and NADPH required for FA synthesis (5).
A previous report using this combination of
orlistat+lonidamine+6-Diazo-5-oxo-L-norleucine (OLD) in
vitro showed that while it inhibits the growth of number of
malignant cell lines, the effect is minor in primary lung
fibroblasts suggesting that OLD preferentially targets malignant
cells (7). Moreover, in syngeneic
and allogenic mouse models, this treatment exerts an antitumor
effect without affecting the weight of treated mice. Nevertheless,
serum chemokines were not measured (8). In the present study, orlistat,
lonidamine and DON were employed, which inhibited FASN, HK2 and
GLS1, respectively, and analyzed the transcriptional and protein
levels of their corresponding drug targets by reverse transcription
PCR. Using small interfering (si)RNA interference of the same
targets, cellular viability was measured in the absence or presence
of specific compounds inhibiting the remaining energetic pathways.
In addition, the study investigated whether the metabolic
inhibition may influence the expression of chemokines and growth
factors associated with colon cancer.
Materials and methods
Cell lines
The human colon adenocarcinoma SW480 and murine
CT26.WT cell lines were obtained from the American Type Culture
Collection. Both cell lines were cultured at 37°C in a humidified
atmosphere containing 5% CO2, in DMEM/F12 (SW480) or
RPMI-1640 (CT26.WT) in the presence of 10% fetal bovine serum and
1% antibiotic/antimycotic solution (all from Invitrogen; Thermo
Fisher Scientific, Inc.).
Drug treatments
Orlistat (Psicofarma, S.A., De C.V.), lonidamine and
DON were dissolved in absolute ethanol, dimethyl sulfoxide, and
culture medium without serum, respectively. All drugs with the
exception of orlistat and all vehicles were from Sigma-Aldrich;
Merck KGaA. Drug treatments were freshly prepared for each
experiment.
SW480 cell viability assays and
identification of inhibitory concentrations (ICs)
A total of 5×10⁴ cells/well were seeded
in 6-well plates with 2 ml complete medium and were allowed to
attach to the bottom of the surface overnight. Subsequently,
complete medium containing either orlistat, lonidamine or DON was
added at increasing doses every 24 h until 72 h. Control cells were
treated with the vehicle used for each drug, using the same volume
as of that of the highest evaluated dose. The cells were washed
once with 1X PBS and detached with a 0.5% trypsin/2% EDTA solution.
Cell viability was evaluated by the trypan blue exclusion assay.
Briefly, the cells were gently mixed at 1:1 ratio with trypan Blue
Stain (0.4%; Gibco; Thermo Fisher Scientific, Inc.) for 5 sec and
placed in a TC10™ Automated Cell Counter (Bio-Rad Laboratories,
Inc.) at room temperature. The cytotoxic effect was expressed as
the percentage of cell viability relative to the control cells. The
resulting data were analyzed in the SigmaPlot software (version
10.0; Systat Software, Inc.). The percentage of growth inhibition
was estimated and the IC20-IC50 values were
obtained from the survival curves.
Drug treatment
Increasing doses of orlistat (IC20,
IC30, IC40 and IC50) were combined
with their respective increasing doses of lonidamine
(IC20, IC30, IC40 and
IC50) and DON (IC20, IC30,
IC40 and IC50). The resulting mixed solutions
were incubated for 72 h with 5×10⁴ SW480 cells/well, as
previously stated. The pharmacological interaction was determined
with the combination index (CI) method from the formula of Chou and
Talalay using the Calcusyn software (version 2.0; Biosoft)
(9). The CI values used to assign
the pharmacological interaction are shown in Table I. The synergistic combination at the
lowest doses was selected for further experiments.
 | Table I.CI values, recommended symbols and
descriptions for determining synergism, antagonism or addition
using the Chou-Talalay formula. |
Table I.
CI values, recommended symbols and
descriptions for determining synergism, antagonism or addition
using the Chou-Talalay formula.
| Range of CI | Symbol | Description |
|---|
| <0.1 | +++++ | Very strong
synergism |
| 0.1–0.3 | ++++ | Strong
synergism |
| 0.3–0.7 | +++ | Synergism |
| 0.7–0.85 | ++ | Moderate
synergism |
| 0.85–0.9 | + | Slight
synergism |
| 0.9–1.1 | ± | Nearly
additive |
| 1.1–1.2 | – | Slight
antagonism |
| 1.2–1.45 | −− | Moderate
antagonism |
| 1.45–3.3 | −−− | Antagonism |
| 3.3–10 | −−−− | Strong
antagonism |
| >10 | −−−−− | Very strong
antagonism |
Reverse transcription-quantitative
(RT-q)PCR of the target enzymes
A total of 5×10⁴ (SW480) or
3×10⁴ (CT26.WT) cells were seeded and treated as stated
above. Following 72 h of treatment, the cells were detached and
total RNA isolation was carried out using TRIzol (Thermo Fisher
Scientific, Inc.). A total of 1 µg of total RNA was used for cDNA
synthesis at 45°C with the GeneAmp RNA PCR Core kit (Applied
Biosystems; Thermo Fisher Scientific, Inc.). cDNA was mixed with
the iQ SYBR Green SuperMix (Bio-Rad Laboratories, Inc.) according
to the manufacturer's protocol. qPCR reactions were run using an
ABI Prism 7000 (Applied Biosystems; Thermo Fisher Scientific,
Inc.). The qPCR cycling conditions were as follows: Initial
denaturation for 10 min at 95°C followed by 40 cycles of 30 sec at
95°C, 30 sec at 60°C and 30 sec at 72°C. The data were analyzed
using the 2−ΔΔCq method (10) and reported as the fold-change in gene
expression normalized to the expression of the endogenous control
gene hypoxanthine phosphoribosyltransferase 1 (HPRT1)
(for SW480), or glyceraldehyde-3-phosphate dehydrogenase
(GAPDH) (for CT26.WT). The primers used for detection of the
human genes were as follows: HPRT1 forward,
5′-GAACCTCTCGGCTTTCCCG-3′ and reverse, 3′-CACTAATCACGACGCCAGGG-5′;
HK2 forward, 5′-GCAGAAGGTTGACCAGTATC-3′ and reverse,
5′-TGGAGTGGACCTCACAAA-3′; GLS1 forward,
5′-CTCTTCCGAAAGTGTGTGAG-3′ and reverse, 5′-CAGGTCTGGGTTTGACTTG-3′;
FASN forward, 5′-CGCTCGGCATGGCTATCTC-3′ and reverse,
5′-CTCGTTGAACGCATCCA-3′. The detection of the mouse genes was
performed with the following primers: HK2 forward,
5′-GCAGAAGGTTGACCAGTATC-3′ and reverse, 5′-CGGAGTTGACCTCACAAAG-3′;
GLS1 forward, 5′-ACAGGAGCGTATCCCTATC-3′ and reverse,
5′GTTGCTGCTCACACACTT-3′; FASN forward,
5′-GGCACTGACTGTCTGTTTTCCA-3′ and reverse,
5′-TTAATTGTGGGATCAGGAGAGCAT-3′ and GAPDH forward
5′-GTGGAGTCATACTGGAACATGTAG-3′ and reverse
5′-AATGGTGAAGGTCGGTGTG-3′. The latter gene was used for
normalization purposes. The annealing temperature was 60°C for all
reactions.
siRNA inhibition of target
enzymes
A total of 8×10⁴ (SW480) and
4×10⁴ (CT26.WT) cells were seeded in 6-well plates to
achieve 50% confluent cultures at the time of transfection. A total
of 12.5 pmol siRNA was used for knockdown of the HK2, FASN
and GLS1 genes (HK2 cat. no. 4390824 ID s6562;
FASN cat. no. 4390824 ID 55031; and GLS1 cat. no.
4392420 ID s5838) in SW480 cells. In CT26.WT cells, 12.5 pmol
(FASN cat. no. 4390771 ID 565865), GLS1 (cat. no.
AM16708 ID 501056) and 25 pmol (HK2 cat. no. AM16708 ID
159330) siRNA (all from Ambion; Thermo Fisher Scientific, Inc.)
sequences were diluted in 100 µl Opti-MEM-I reduced serum medium
(Gibco; Thermo Fisher Scientific, Inc.). Lipofectamine®
RNAiMAX transfection reagent (4 µl; Invitrogen; Thermo Fisher
Scientific, Inc.) was diluted in 100 µl Opti-MEM-I. The mixtures
were pooled and incubated for 20 min at room temperature. Silencer
select negative control No. 1 siRNA (cat. no. 4390844; Ambion;
Thermo Fisher Scientific, Inc.) was used as a negative control for
both cell lines. The mixture was added to each well in 1 ml
Opti-MEM-I and replaced following 6 h of incubation with complete
fresh medium or complete medium in the presence of drugs. This
protocol was used for the experiments combining siRNA and drug
treatment. For both cell lines, one siRNA sequence was added per
time and the effects were compared with the control without siRNA,
the silencer negative control, the siRNA inhibition groups and the
drug groups in the presence of siRNA treatment. Fresh complete
medium was provided every 24 h for a total period of 72 h. The
compounds were added at their IC40 doses when the medium
was changed. Following 72 h, the compounds were removed and
viability was evaluated with trypan blue as described above. The
cytotoxic effect was expressed as a percentage of cell viability
relative to the untransfected control cells.
Total protein extraction, western blot
analysis and densitometry
Following either OLD or siRNA treatments, total
protein was extracted using radio-immunoprecipitation buffer (150
mM NaCl; 1.0% IGEPAL CA630; 0.5% sodium deoxycholate; 0.1% SDS and
50 mM Tris, pH 8.0) in the presence of proteinase inhibitors (cat.
no. p8340; Sigma-Aldrich; Merck KGaA). The protein concentration
was determined using the bicinchoninic acid assay. A total of 30 µg
of protein was separated by 10% SDS-PAGE and transferred onto a
PVDF membrane (cat. no. 162-0177; Bio-Rad Laboratories, Inc.). The
membrane was blocked with 5% skimmed milk in 1X PBS (1 h at room
temperature) and subsequently incubated with antibodies against
GLS1 (cat. no. sc-100533; 1:500; Santa Cruz Biotechnology, Inc.);
HK2 (cat. no. sc-6521; 1:200; Santa Cruz Biotechnology, Inc.); FASN
(cat. no. sc-55580; 1:500; Santa Cruz Biotechnology, Inc.), the
phosphorylated p65 subunit of nuclear factor (NF)κB (cat. no. 6956;
1:10,000; Cell Signaling Technology, Inc.), and anti-actin
peroxidase (cat. no. A3854; 1:10,000; Sigma-Aldrich; Merck KGaA) in
blocking solution (5% skimmed milk in TBS/0.1% Tween 20), overnight
at 4°C. The secondary antibodies used were the following: Donkey
anti-goat for HK2 (cat. no. sc-2020); and bovine anti-mouse for
GLS1, FASN, and the phosphorylated p65 subunit of NF-κB (cat. no.
sc-2371). The secondary antibodies were diluted at 1:1,000 (1 h at
room temperature). The protein bands were visualized using the
Clarity Western Enhanced Chemiluminescence Substrate (cat. no.
1705060; Bio-Rad Laboratories, Inc.). The bands were quantified by
densitometry using the Image J software, version 1.50 (National
Institute of Health).
Flow cytometry evaluation of
chemokines and growth factors in the supernatant
A total of 5×10⁴ SW480 cells were seeded
in 6-well plates and treated as stated above. The supernatant was
recovered every 24 h until the end of the treatment and
subsequently centrifuged (650 × g, 20 min, 4°C) and stored at −20°C
until further use. The LEGEND plex™ Human Proinflammatory Chemokine
Panel (cat. no. 740003) and Human Growth Factor Panel (cat. no.
740180) were employed to quantify the expression levels of
chemokines and growth factors in the supernatant, following the
manufacturer's protocol. The analysis was performed with the BD
FACSCanto™ II flow cytometer with BD FACSDiva™ software (BD
Biosciences).
Statistical analysis
A total of 3 independent experiments were performed
in triplicate per assay and the data were expressed as the mean ±
standard deviation. The data were analyzed with GraphPad Prism V6
software (GraphPad Software Inc.). Significant differences were
analyzed with the Student's t test for data derived from RT-qPCR,
densitometry and growth factor/chemokine expression analysis.
Regarding dose-response curves and siRNA inhibition experiments,
the significance of the differences was determined with one-way
analysis of variance and Tukey post hoc correction. P<0.05 was
considered to indicate a statistically significant difference.
Results
Viability inhibition
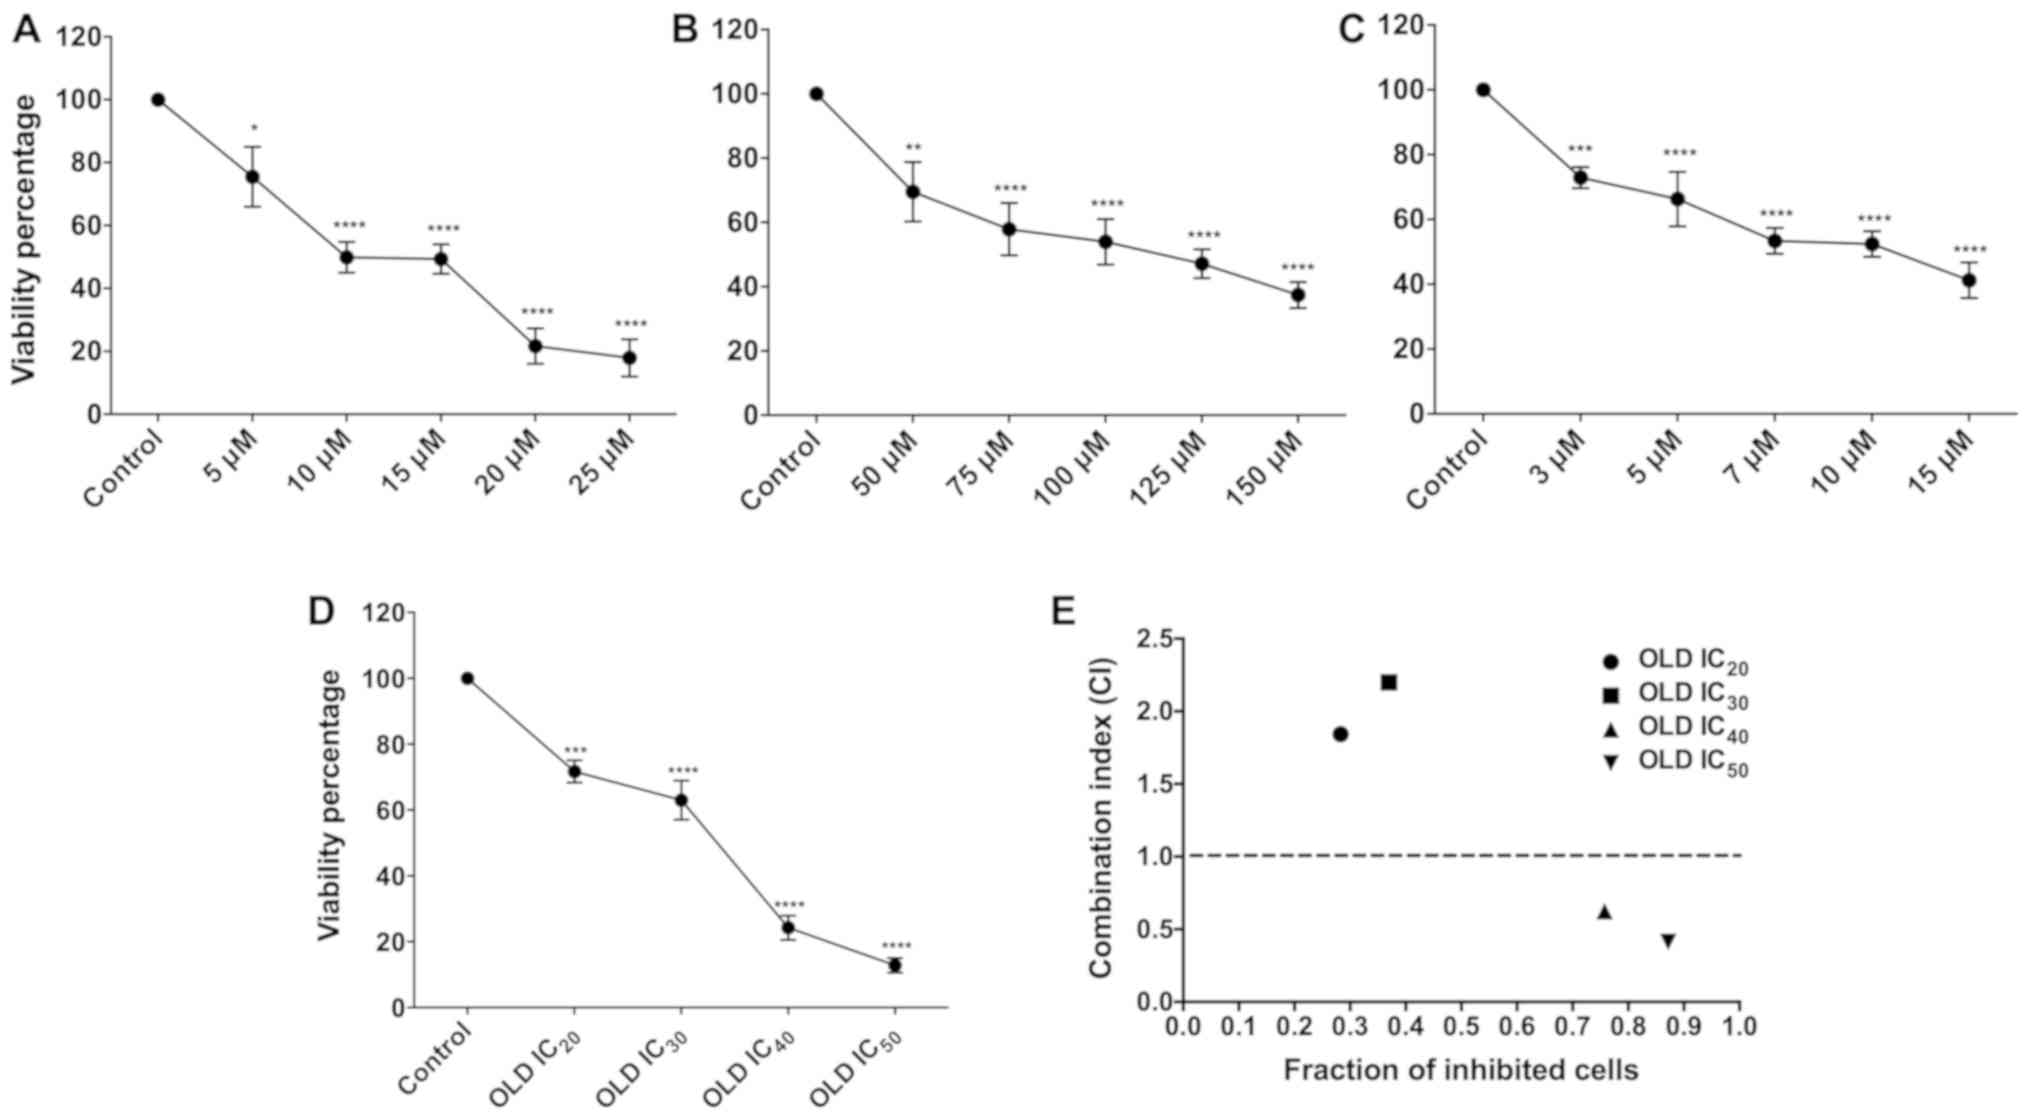
Treatment of human and murine cells with orlistat,
DON and lonidamine exerted a dose-dependent effect on cell
viability reduction at the concentrations tested. These differences
were statistically significant compared with those noted in
vehicle-treated control cells (P<0.05; Fig. 1A-C).
Determination of the
IC20-IC50
Following treatment of SW480 cells with the drugs,
the IC20-IC50 doses were obtained using
SigmaPlot software. These values are shown in Table II. Subsequently, the cells were
treated with the different ICs of the three drugs in combination. A
significant difference was noted with regard to inhibition of cell
proliferation for each IC (P<0.05). It is interesting to note
that the cell viability dropped below 20% when the IC50
was used.
| Table II.Doses of OLD that achieve 20–50%
reduction in SW480 cell viability. |
Table II.
Doses of OLD that achieve 20–50%
reduction in SW480 cell viability.
| OLD drug
scheme | Orlistat dose,
µM | Lonidamine dose,
µM | DON dose, µM |
|---|
| OLD
IC20 | 3.59 | 25.1 | 1.92 |
| OLD
IC30 | 6.01 | 47.36 | 3.62 |
| OLD
IC40 | 8.7 | 75.86 | 6.12 |
| OLD
IC50 | 11.7 | 108.4 | 9.95 |
The pharmacological combination OLD was synergistic
at IC40 and IC50. The OLD IC20 and
IC30 treatments were antagonistic (Fig. 1E and Table III). However, the IC40
and IC50 treatments were synergistic. The
IC40 doses were employed for further assays.
| Table III.Resulting CI values of the
pharmacological interactions between OLD at the
IC20-IC50 combinations. |
Table III.
Resulting CI values of the
pharmacological interactions between OLD at the
IC20-IC50 combinations.
| OLD drug
scheme | CI value | Pharmacological
interaction |
|---|
| OLD
IC20 | 1.843 | Antagonism |
| OLD
IC30 | 2.2 | Antagonism |
| OLD
IC40 | 0.625 | Synergism |
| OLD
IC50 | 0.412 | Synergism |
Triple inhibition induces the
transcription of the enzyme targets
A significant increase was noted in the relative
expression levels of HK2, FASN and GLS1 mRNA compared
with the control (P<0.05). The highest expression levels were
observed for HK2, followed by FASN and GLS1
(Fig. 2A) in human cells. The order
of overexpression noted in murine cells was as follows: FASN,
GLS1 and HK2 (Fig. 2D).
Western blot analysis showed a significant decrease of the enzyme
targets in human (P<0.01; Fig. 2B and
C) and murine cells (P<0.01; Fig.
2E and F).
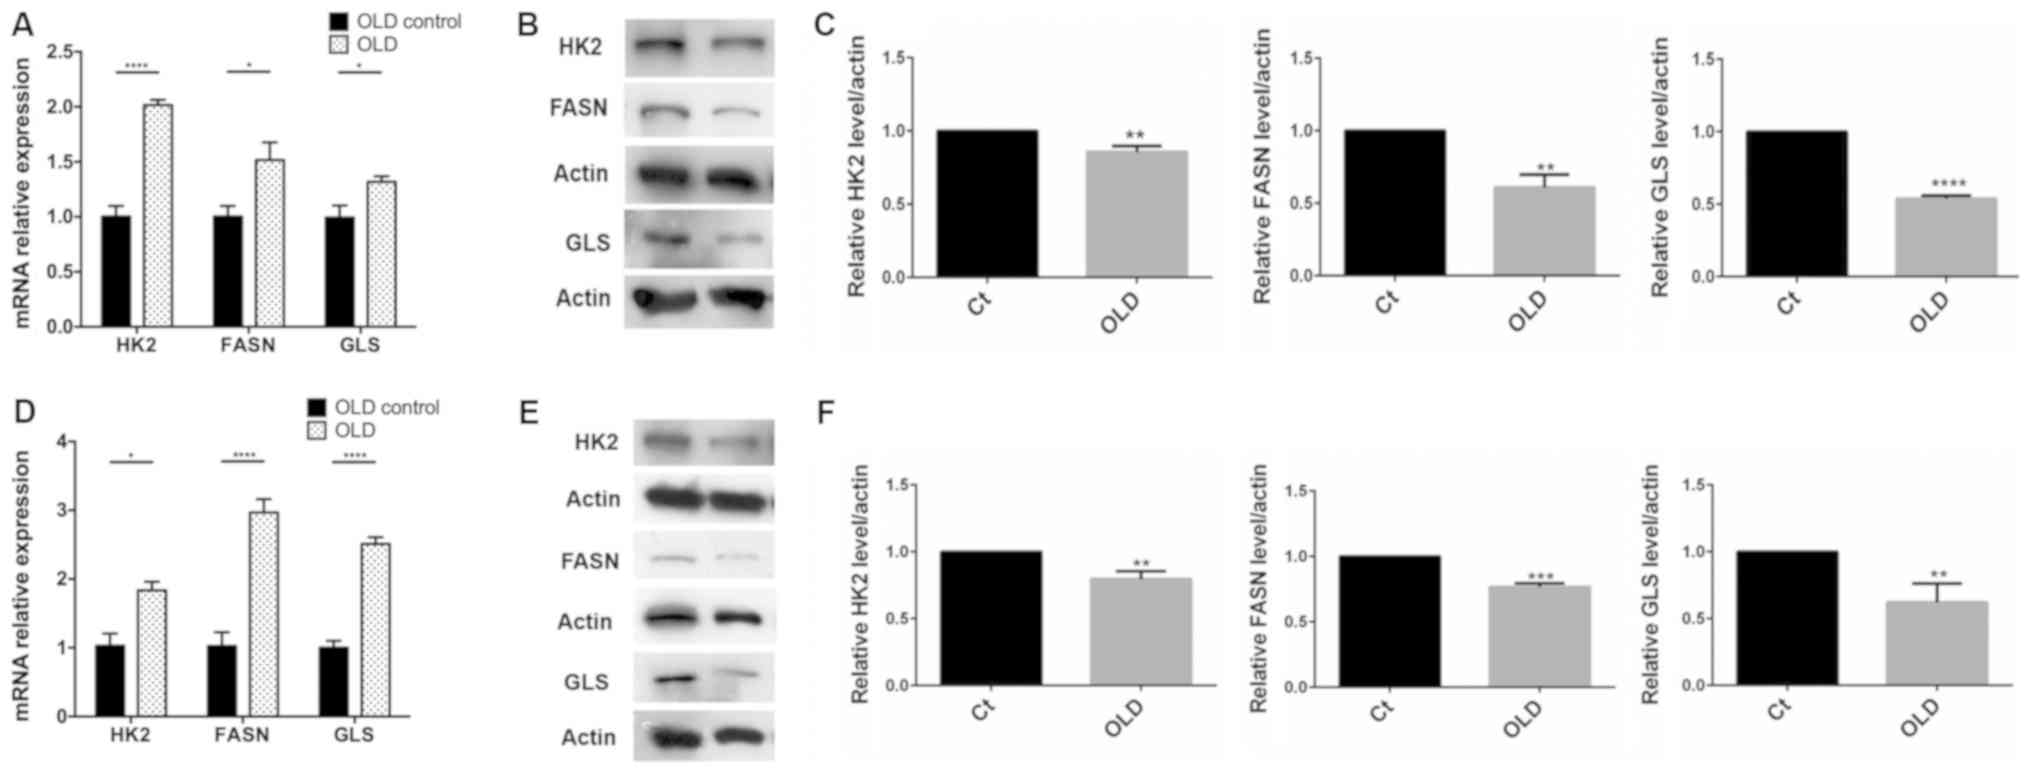 | Figure 2.Reverse transcription-quantitative
PCR and western blotting of FASN, HK2 and GLS in SW480 and CT26.WT
cells treated with OLD. (A) There was a significant increase in
mRNA expression of FASN, GLS and particularly HK2 in SW480, and (D)
in both FASN and GLS in CT26.WT. (B) Western blot evaluation (C)
and densitometry analysis showed a reduction in the intensity of
the three targets on SW480, particularly on glutaminase. On the
CT26.WT cell line, the reduction in the intensity was more
pronounced in FASN (E) western blot evaluation and (F) densitometry
analysis. *P<0.05, **P<0.01, ***P<0.001 and
****P<0.0001. OLD, orlistat + lonidamine + DON; HK2,
hexokinase-II; FASN, fatty acid synthase; GLS, glutaminase; Ct,
control. |
Inhibition of cell viability by
downregulation of HK2, FASN and GSL1 gene expression with
siRNAs
The comparison of the expression levels of the 3
main target genes in untreated and mock-transfected cells did not
exhibit significant differences in both cell lines. A small yet
significant reduction in cell viability of ~20% was noted when each
one of the target genes was silenced in both cell lines compared
with the effects noted in the scramble transfected cells
(P<0.01). These effects were slightly increased for the
FASN gene in SW480 cells (Fig.
3A), whereas depletion of HK2 expression exhibited a
significantly higher increase in CT26.WT cells (P<0.001;
Fig. 3B). Triple pharmacological
inhibition led to a reduction in cell viability of ~80% (Fig. 1D). Therefore, each one of the
siRNA-depleted cells was treated with the two-drug combination that
inhibited the two remaining targets. In all the cases, a
significant inhibition was noted between siRNA-depleted cells and
siRNA-depleted cells with the two-drug combinations (P<0.001 for
HK2 and FASN, and P<0.05 for GLS1) in both
cell lines (Fig. 3A and B). These
results were verified by western blot analysis (Fig. 3C and D).
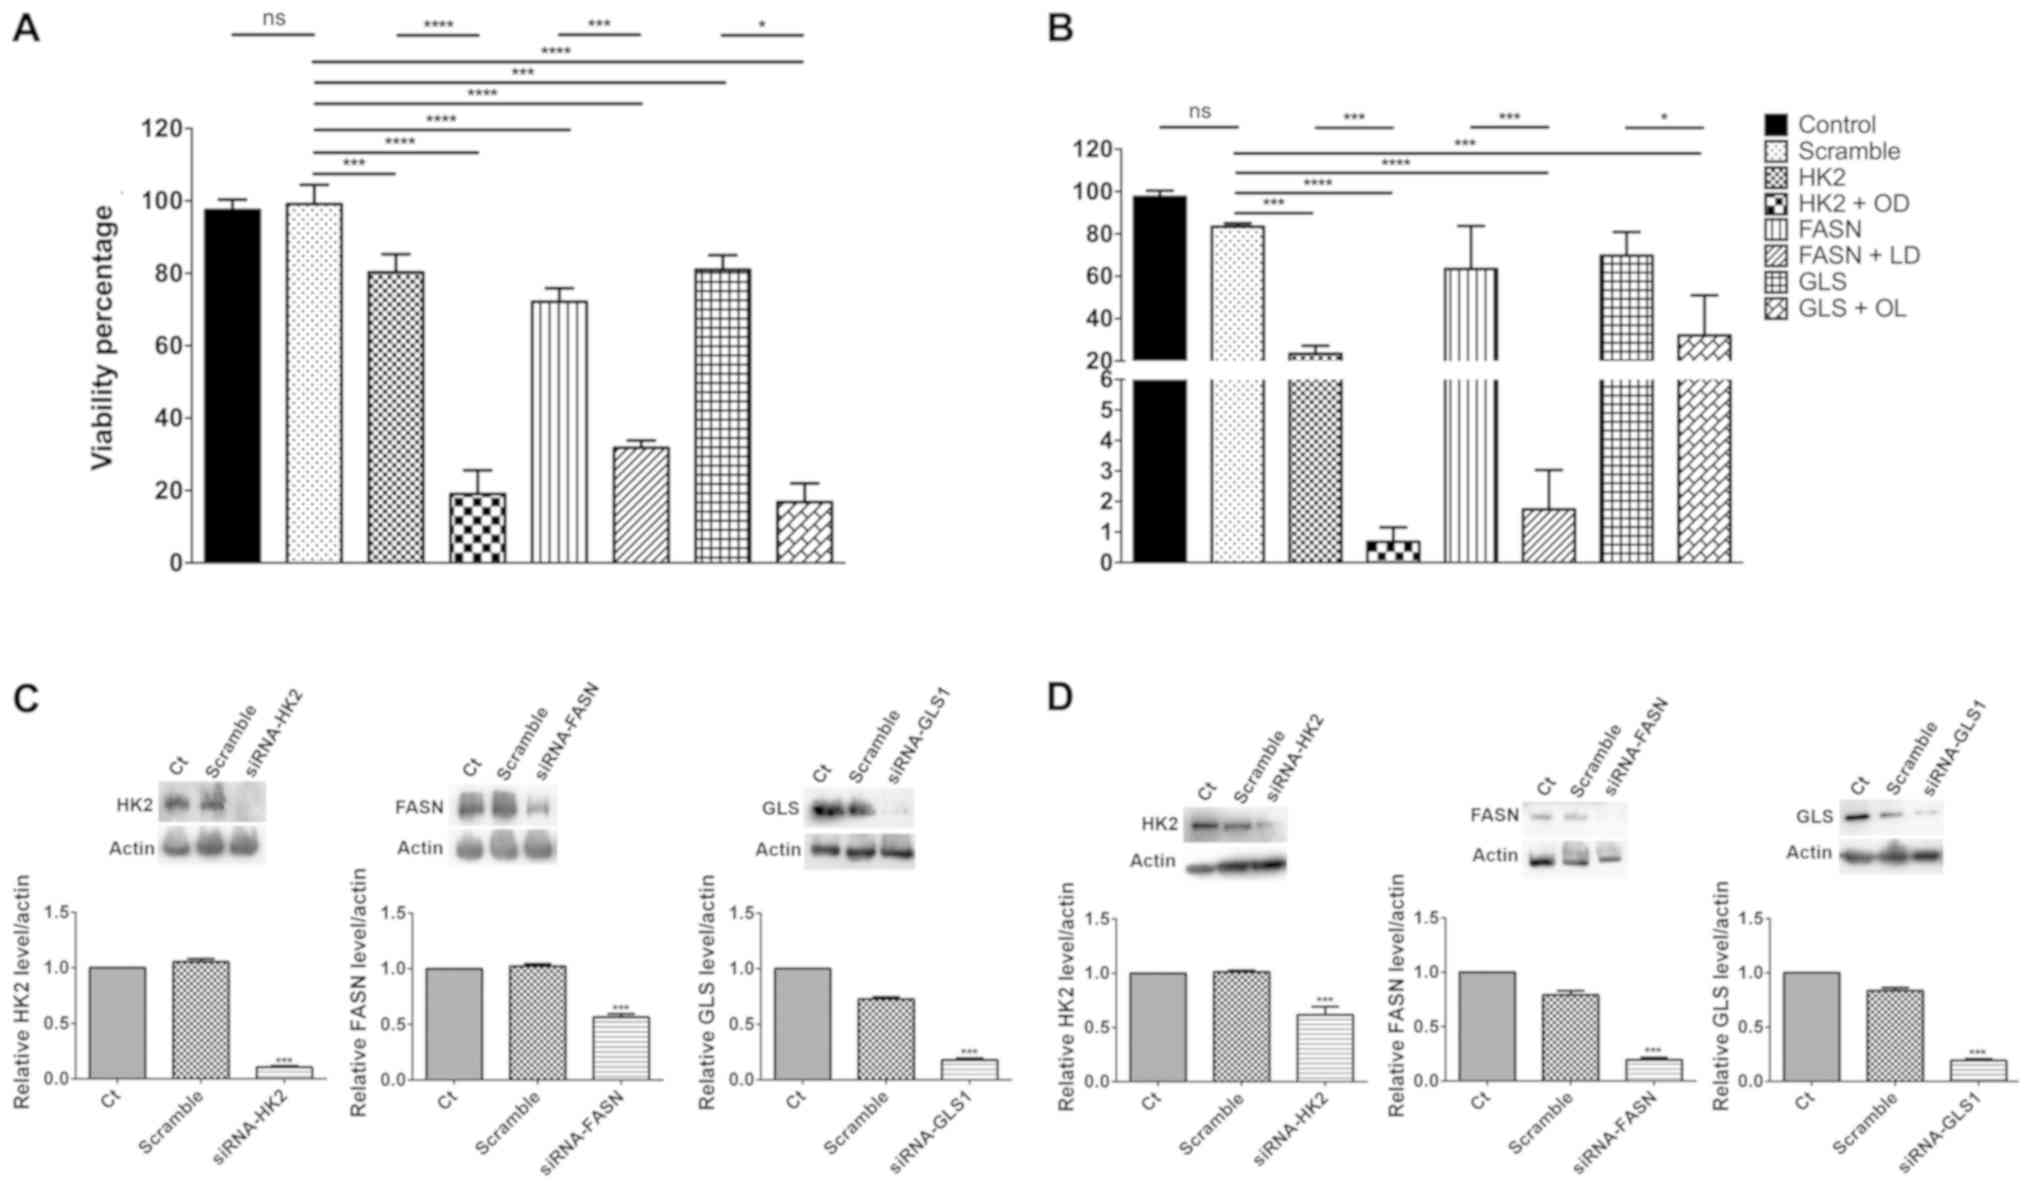 | Figure 3.Effect upon cell viability in SW480
and CT26.WT cells undergoing siRNA blockade, with and without
anti-metabolic drugs. The downregulation of any of the three
targets by siRNAs induced a similar reduction in cell viability in
SW480. (A) In CT26.WT, HK2 blockade, either alone or with orlistat
+ DON, diminished in a more important way the (B) viability.
Western blot evaluation showed an important reduction in the
intensity of the bands representing the blocked enzymes in (C)
SW480 and (D) CT26.WT. *P<0.05, ***P<0.001 and
****P<0.0001. HK2, siRNA against hexokinase-II; HK2 + OD, siRNA
against hexokinase-II + orlistat + DON; FASN, siRNA against fatty
acid synthase; FASN + LD, siRNA against fatty acid synthase +
lonidamine + DON; GLS, siRNA against glutaminase; GLS + OL, siRNA
against glutaminase + orlistat + lonidamine; siRNA, small
interfering RNA; Ct, control. |
Treatment of cells with the OLD
combination reduces the expression levels of chemokines and growth
factors associated with decreased p-NFkB-p65 protein
The evaluation of the expression levels of the 13
chemokines revealed that 9 of them [interleukin (IL)-9, C-X-C motif
chemokine ligand (CXCL) 10, eotaxin, chemokine ligand (CCL) 9,
CXCL5, CCL20, CXCL1, CXCL11 and CCL4] exhibited significant
reduction in their expression levels (P<0.05), whereas no change
was noted in the remaining 4 (CCL17, CCL2, RANTES and CCL3;
Fig. 4A). From all the growth
factors investigated, only the expression levels of the stem cell
factor (SCF) were decreased (Fig.
4B). No increase in expression was noted for any of the
remaining growth factors. Interestingly, the levels of p-NFκB-p65
showed a significant decrease (P<0.01; Fig. 4C and D).
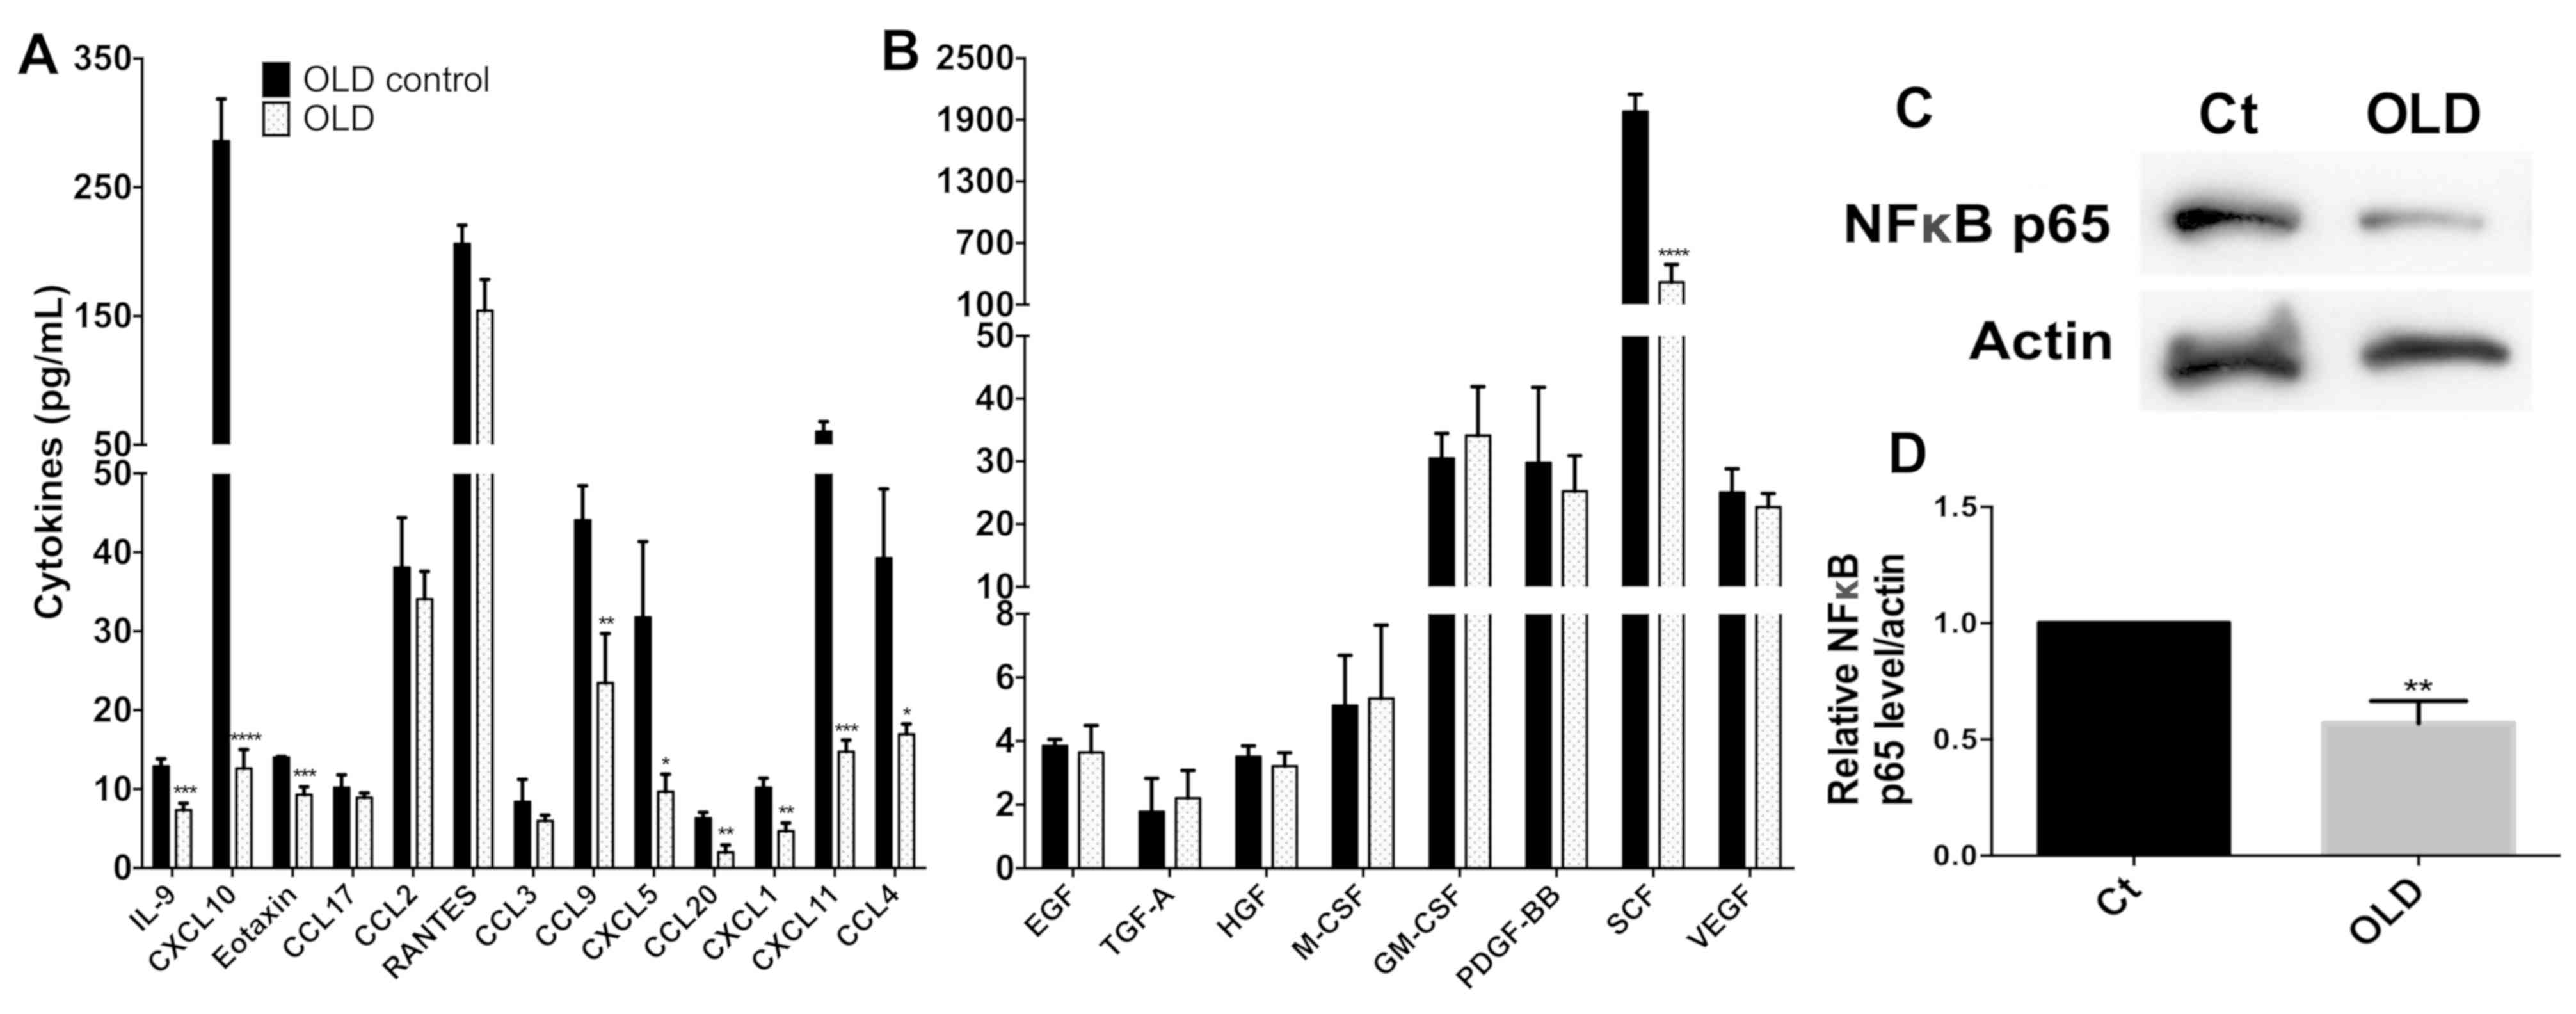 | Figure 4.Quantification of chemokines and
growth factors in the supernatant of SW480 cells treated with OLD.
(A) In the chemokine evaluation, there was an important reduction
in IL-9, CXCL10, eotaxin, CCL9, CXCL5, CCL20, CXCL1, CXCL11 and
CCL4. (B) Regarding growth factors, only SCF was strongly
downregulated. The rest of the cytokines did not differ in a
significant way. (C) Western blot evaluation and (D) densitometry
analysis showed a reduction in the intensity of the phosphorylated
p65 subunit of NF-κB. *P<0.05, **P<0.01, ***P<0.001 and
****P<0.0001. IL, interleukin; OLD, orlistat + lonidamine + DON;
Ct, control; NF, nuclear factor; GM-CSF, granulocyte
macrophage-colony stimulating factor; TGF, transforming growth
factor; SCF, stem cell factor; VEGF, vascular endothelial growth
factor; EGF, epidermal growth factor; PDGF-BB, platelet derived
growth factor-BB; HGF, hepatocyte growth factor; CCL, chemokine
ligand; CXCL, C-X-C motif chemokine ligand. |
Discussion
The present study shows that the combination of
lonidamine, DON and orlistat resulted in a synergistic cytotoxic
effect and induced downregulation of their protein targets (HK-2,
FASN and GLS). Most likely, as a consequence, the transcription of
their target genes was upregulated. Moreover, the genetic or
pharmacological depletion of these enzymes reduces cell viability
in a cell-dependent manner. It is important to note that 9 out of
the 13 chemokines examined have been shown to participate in cancer
invasion and metastasis. These molecules were downregulated
following treatment, while only the growth factor SCF exhibited
reduced expression levels.
A tumor is not only composed of malignant cells. The
tumor microenvironment comprises stromal cells, cancer-associated
fibroblasts, endothelial cells, pericytes and immune cells
(11). The importance of stromal
cells in the development of the tumor microenvironment and tumor
progression is well known. However, little is known, regarding the
ability of the cells from the microenvironment to reprogram their
metabolism (12,13).
Previous studies conducted in colon cancer patients
analyzed the expression levels of several chemokines in normal and
tumor tissues. Erreni et al (14) reported on the mRNA profile of
chemokines and chemokine receptors in 8 tumor samples and paired
tissues from colon cancer patients and found that the expression of
several chemokines was strongly upregulated within the tumor
microenvironment; the main identified chemokines were CCL4 and CCL5
and their corresponding receptors CCR1 and CCR5. In another study,
the levels of CCL2, CCL4, RANTES, CXCL1, CXCL5 and CXCL8/IL-8 were
investigated using ELISA in 10 colorectal carcinomas and their
corresponding normal mucosa, and the protein levels of all these
chemokines were overexpressed in the tumor counterpart with the
exception of RANTES (15).
To the best of our knowledge, this is the first
study to demonstrate that a metabolic inhibition with OLD
downregulates the expression of several chemokines in colon cancer
cells. Among these, IL-9 plays a significant role as an inhibitor
of adaptive immunity and prevents the formation of immunologic
memory against the growing tumor (16). This highlights the potential for IL-9
neutralization by cancer immunotherapy (16). Zeng et al (17) confirmed that CXCL10 and CXCL11 acted
as key protumor chemokines on colon cancer neuroendocrine-like
cells. No studies of eotaxin/CCL11 have been conducted in colon
cancer, however they were increased in a mouse model of ulcerative
colitis, which is considered a colon pre-neoplastic condition
(18). Mouse and human colon cancer
cells secrete CCL9 and CCL15, respectively and recruit immature
myeloid cells, which express the CCL9/15 receptor CCR1 and induce
the expression of matrix metalloproteinase (MMP)-2 and MMP-9
enzymes. It is important to note that the CCR1 antagonist BL5923
blocked metastatic colonization and significantly prolonged the
survival of tumor-bearing mice (19). The expression levels of CXCL5 were
also downregulated in the present study. Cancer cells secrete CXCL5
and in vitro treatment with this ligand can induce protumor
effects. Moreover, CXCL5 is elevated in colorectal cancer patients
and is considered an independent prognostic factor for adverse
effects (20). Yildirim et al
(21) demonstrated an increased
expression of CXCL5 in colon cancer biopsies, as well as in the
serum of these patients compared with the expression levels noted
in adenomas and normal epithelia. These findings were consistent
with the present results. In the present study, the expression
levels of CCL20 were downregulated, which has not been previously
reported for colon cancer cells or tissues. However, colon cancer
patients that exhibit advanced progression of the disease
overexpress the receptor CCR6 and treatment with CCL20 increases
their migratory and invasive potential (22). In addition, the present study
indicated that the expression of CXCL1 was downregulated, which led
to an association of the ligand with colon tumor progression.
Treatment of SW620 cells with CXCL1 increases their metastatic
ability (23). Protumor effects were
also reported for CXCL11. This chemokine is overexpressed in
colorectal cancer tissues and cell lines, and its downregulation
inhibits cell migration and invasion. Moreover, downregulation of
CXCL11 has been shown to reduce colorectal cancer cell growth and
metastasis in a xenograft model (24). Finally, the present study revealed
that CCL4 expression was downregulated by lonidamine, DON and
orlistat treatment. CCL4 has been previously shown to participate
in tumor progression in concert with CCL2 and CCL3. The expression
levels of CCL4 are increased in tumor compared with healthy
tissues. The higher levels of CCL4 in plasma are associated with
poor prognosis (25). Although the
expression levels of CCL2, CCL3, RANTES/CCL5 and CCL17 were not
downregulated in the present study, these chemokines can also
participate in colon cancer progression (25–29).
The data further demonstrated a decrease in SCF
levels. It is known that SCF and its ligand, c-kit, are
overexpressed in colon cancer. Both proteins can establish an
autocrine c-kit-mediated loop that increases growth, survival,
migration and invasive potential (30). This loop further prevents loss of
clonogenic potential under differentiation-induced conditions of
colon cancer cells (31).
The interpretation of the present results is only
hypothesis driven. In the aim to gain a preliminary insight into
the potential mechanisms by which OLD treatment reduces chemokines,
the phosphorylated p65 subunit of the NFκB pathway was evaluated.
NFκB is a crucial orchestrator of innate immunity and inflammation
as it activates the transcription of target genes, including
chemokines among other effectors for inflammation (32,33).
Though not demonstrated in this study, the inhibition of NFκB by
OLD could be responsible at least indirectly for the reduction of
chemokines observed in the present study. More research is needed
to demonstrate the mechanisms by which metabolic drugs inhibit
activation of NFκB which in turn may decrease the expression of
chemokines in colon cancer cells.
The present results are preliminary, since the
metabolic treatment of cancer cells was analyzed in vitro
and the in vivo effect of OLD treatment upon serum
chemokines is yet to be evaluated. In conclusion, the results of
the present study demonstrated that metabolic antitumor drugs
affected the expression levels of chemokines and growth factors
associated with a decrease in NF-κB activation. Additional studies
are required to fully understand the connection between tumor
metabolism and chemokine/growth factor regulation.
Acknowledgements
Not applicable.
Funding
Alejandro Schcolnik-Cabrera is a PhD student from
the Plan de Estudios Combinados en Medicina (UNAM), supported by
the CONACyT scholarship (grant no. 439704).
Availability of data and materials
All data generated or analyzed during the present
study are included in this published article.
Authors' contribution
ASC performed the experiments, analyzed the data and
wrote the manuscript. GG performed the western blotting experiments
on protein extracts. AB, MY and RB participated in the flow
cytometry evaluation of chemokines and growth factors. JD and LC
participated in the primer design and in the RT-qPCR experiments.
AG conceived the study, reviewed the results and participated in
the discussion of the manuscript. All the authors read and approved
the final manuscript.
Ethics approval and consent to
participate
The present study was approved by the Ethics
Committee of the National Cancer Institute (Mexico City, Mexico).
Studies with animal models or with human patients were not
performed for this study.
Patient consent for publication
Not applicable.
Competing interest
The authors declare absence of conflicts of
interest.
References
|
1
|
Pavlova NN and Thompson CB: The emerging
hallmarks of cancer metabolism. Cell Metab. 23:27–47. 2016.
View Article : Google Scholar : PubMed/NCBI
|
|
2
|
Kalyanaraman B: Teaching the basics of
cancer metabolism: Developing antitumor strategies by exploiting
the differences between normal and cancer cell metabolism. Redox
Biol. 12:833–842. 2017. View Article : Google Scholar : PubMed/NCBI
|
|
3
|
Schcolnik-Cabrera A, Chavez-Blanco A,
Dominguez-Gomez G and Duenas-Gonzalez A: Understanding tumor
anabolism and patient catabolism in cancer-associated cachexia. Am
J Cancer Res. 7:1107–1135. 2017.PubMed/NCBI
|
|
4
|
Mathupala SP, Ko YH and Pedersen PL:
Hexokinase II: Cancer's double-edged sword acting as both
facilitator and gatekeeper of malignancy when bound to
mitochondria. Oncogene. 25:4777–4786. 2006. View Article : Google Scholar : PubMed/NCBI
|
|
5
|
Wise DR and Thompson CB: Glutamine
addiction: A new therapeutic target in cancer. Trends Biochem Sci.
35:427–433. 2010. View Article : Google Scholar : PubMed/NCBI
|
|
6
|
Kridel SJ, Axelrod F, Rozenkrantz N and
Smith JW: Orlistat is a novel inhibitor of fatty acid synthase with
antitumor activity. Cancer Res. 64:2070–2075. 2004. View Article : Google Scholar : PubMed/NCBI
|
|
7
|
Cervantes-Madrid D, Dominguez-Gomez G,
Gonzalez-Fierro A, Perez-Cardenas E, Taja-Chayeb L, Trejo-Becerril
C and Duenas-Gonzalez A: Feasibility and antitumor efficacy in
vivo, of simultaneously targeting glycolysis, glutaminolysis and
fatty acid synthesis using lonidamine, 6-diazo-5-oxo-L-norleucine
and orlistat in colon cancer. Oncol Lett. 13:1905–1910. 2017.
View Article : Google Scholar : PubMed/NCBI
|
|
8
|
Cervantes-Madrid D and Dueñas-González A:
Antitumor effects of a drug combination targeting glycolysis,
glutaminolysis and de novo synthesis of fatty acids. Oncol Rep.
34:1533–1542. 2015. View Article : Google Scholar : PubMed/NCBI
|
|
9
|
Matthews H, Deakin J, Rajab M, Idris-Usman
M and Nirmalan NJ: Investigating antimalarial drug interactions of
emetine dihydrochloride hydrate using CalcuSyn-based interactivity
calculations. PLoS One. 12:e01733032017. View Article : Google Scholar : PubMed/NCBI
|
|
10
|
Livak KJ and Schmittgen TD: Analysis of
relative gene expression data using real-time quantitative PCR and
the 2(-Delta Delta C(T)) method. Methods. 25:402–408. 2001.
View Article : Google Scholar : PubMed/NCBI
|
|
11
|
Ramamonjisoa N and Ackerstaff E:
Characterization of the tumor microenvironment and tumor-stroma
interaction by non-invasive preclinical imaging. Front Oncol.
7:32017. View Article : Google Scholar : PubMed/NCBI
|
|
12
|
Tuccitto A, Shahaj E, Vergani E, Ferro S,
Huber V, Rodolfo M, Castelli C, Rivoltini L and Vallacchi V:
Immunosuppressive circuits in tumor microenvironment and their
influence on cancer treatment efficacy. Virchows Arch. 474:407–420.
2018. View Article : Google Scholar : PubMed/NCBI
|
|
13
|
Wegiel B, Vuerich M, Daneshmandi S and
Seth P: Metabolic switch in the tumor microenvironment determines
immune responses to anti-cancer therapy. Front Oncol. 8:2842018.
View Article : Google Scholar : PubMed/NCBI
|
|
14
|
Erreni M, Bianchi P, Laghi L, Mirolo M,
Fabbri M, Locati M, Mantovani A and Allavena P: Expression of
chemokines and chemokine receptors in human colon cancer. Methods
Enzymol. 460:105–121. 2009. View Article : Google Scholar : PubMed/NCBI
|
|
15
|
Baier PK, Eggstein S, Wolff-Vorbeck G,
Baumgartner U and Hopt UT: Chemokines in human colorectal
carcinoma. Anticancer Res. 25:3581–3584. 2005.PubMed/NCBI
|
|
16
|
Hoelzinger DB, Dominguez AL, Cohen PA and
Gendler SJ: Inhibition of adaptive immunity by IL9 can be disrupted
to achieve rapid T-cell sensitization and rejection of progressive
tumor challenges. Cancer Res. 74:6845–6855. 2014. View Article : Google Scholar : PubMed/NCBI
|
|
17
|
Zeng YJ, Lai W, Wu H, Liu L, Xu HY, Wang J
and Chu ZH: Neuroendocrine-like cells -derived CXCL10 and CXCL11
induce the infiltration of tumor-associated macrophage leading to
the poor prognosis of colorectal cancer. Oncotarget. 7:27394–27407.
2016. View Article : Google Scholar : PubMed/NCBI
|
|
18
|
Coburn LA, Horst SN, Chaturvedi R, Brown
CT, Allaman MM, Scull BP, Singh K, Piazuelo MB, Chitnavis MV,
Hodges ME, et al: High-throughput multi-analyte Luminex profiling
implicates eotaxin-1 in ulcerative colitis. PLoS One. 8:e823002013.
View Article : Google Scholar : PubMed/NCBI
|
|
19
|
Kitamura T, Fujishita T, Loetscher P,
Revesz L, Hashida H, Kizaka-Kondoh S, Aoki M and Taketo MM:
Inactivation of chemokine (C-C motif) receptor 1 (CCR1) suppresses
colon cancer liver metastasis by blocking accumulation of immature
myeloid cells in a mouse model. Proc Natl Acad Sci USA.
107:13063–13068. 2010. View Article : Google Scholar : PubMed/NCBI
|
|
20
|
Kawamura M, Toiyama Y, Tanaka K, Saigusa
S, Okugawa Y, Hiro J, Uchida K, Mohri Y, Inoue Y and Kusunoki M:
CXCL5, a promoter of cell proliferation, migration and invasion, is
a novel serum prognostic marker in patients with colorectal cancer.
Eur J Cancer. 48:2244–2251. 2012. View Article : Google Scholar : PubMed/NCBI
|
|
21
|
Yildirim K, Colak E, Aktimur R, Gun S,
Taskin MH, Nigdelioglu A, Aktimur SH, Karagöz F and Ozlem N:
Clinical value of CXCL5 for determining of colorectal cancer. Asian
Pac J Cancer Prev. 19:2481–2484. 2018.PubMed/NCBI
|
|
22
|
Kapur N, Mir H, Clark Iii CE, Krishnamurti
U, Beech DJ, Lillard JW and Singh S: CCR6 expression in colon
cancer is associated with advanced disease and supports
epithelial-to-mesenchymal transition. Br J Cancer. 114:1343–1351.
2016. View Article : Google Scholar : PubMed/NCBI
|
|
23
|
Hsu YL, Chen YJ, Chang WA, Jian SF, Fan
HL, Wang JY and Kuo PL: Interaction between tumor-associated
dendritic cells and colon cancer cells contributes to tumor
progression via CXCL1. Int J Mol Sci. 19:E24272018. View Article : Google Scholar : PubMed/NCBI
|
|
24
|
Gao YJ, Liu L, Li S, Yuan GF, Li L, Zhu HY
and Cao GY: Down-regulation of CXCL11 inhibits colorectal cancer
cell growth and epithelial-mesenchymal transition. Onco Targets
Ther. 11:7333–7343. 2018. View Article : Google Scholar : PubMed/NCBI
|
|
25
|
De la Fuente Lopez M, Landskron G, Parada
D, Dubois-Camacho K, Simian D, Martinez M, Romero D, Roa JC,
Chahuán I, Gutiérrez R, et al: The relationship between chemokines
CCL2, CCL3, and CCL4 with the tumor microenvironment and
tumor-associated macrophage markers in colorectal cancer. Tumour
Biol. 40:10104283188100592018. View Article : Google Scholar : PubMed/NCBI
|
|
26
|
Al-haidari AA, Syk I, Jirstrom K and
Thorlacius H: CCR4 mediates CCL17 (TARC)-induced migration of human
colon cancer cells via RhoA/Rho-kinase signaling. Int J Colorectal
Dis. 28:1479–1487. 2013. View Article : Google Scholar : PubMed/NCBI
|
|
27
|
Cambien B, Richard-Fiardo P, Karimdjee BF,
Martini V, Ferrua B, Pitard B, Schmid-Antomarchi H and
Schmid-Alliana A: CCL5 neutralization restricts cancer growth and
potentiates the targeting of PDGFRβ in colorectal carcinoma. PLoS
One. 6:e288422011. View Article : Google Scholar : PubMed/NCBI
|
|
28
|
Roblek M, Strutzmann E, Zankl C, Adage T,
Heikenwalder M, Atlic A, Weis R, Kungl A and Borsig L: Targeting of
CCL2-CCR2-glycosaminoglycan axis using a CCL2 decoy protein
attenuates metastasis through inhibition of tumor cell seeding.
Neoplasia. 18:49–59. 2016. View Article : Google Scholar : PubMed/NCBI
|
|
29
|
Tanabe Y, Sasaki S, Mukaida N and Baba T:
Blockade of the chemokine receptor, CCR5, reduces the growth of
orthotopically injected colon cancer cells via limiting
cancer-associated fibroblast accumulation. Oncotarget.
7:48335–48345. 2016. View Article : Google Scholar : PubMed/NCBI
|
|
30
|
Bellone G, Carbone A, Sibona N, Bosco O,
Tibaudi D, Smirne C, Martone T, Gramigni C, Camandona M, Emanuelli
G and Rodeck U: Aberrant activation of c-kit protects colon
carcinoma cells against apoptosis and enhances their invasive
potential. Cancer Res. 61:2200–2206. 2001.PubMed/NCBI
|
|
31
|
Fatrai S, van Schelven SJ, Ubink I,
Govaert KM, Raats D, Koster J, Verheem A, Borel Rinkes IH and
Kranenburg O: Maintenance of clonogenic KIT(+) human colon tumor
cells requires secretion of stem cell factor by differentiated
tumor cells. Gastroenterology. 149:692–704. 2015. View Article : Google Scholar : PubMed/NCBI
|
|
32
|
Ghosh S and Karin M: Missing pieces in the
NF-kappaB puzzle. Cell. 109 (Suppl):S81–S96. 2002. View Article : Google Scholar : PubMed/NCBI
|
|
33
|
Del Prete A, Allavena P, Santoro G,
Fumarulo R, Corsi MM and Mantovani A: Molecular pathways in
cancer-related inflammation. Biochem Med (Zagreb). 21:264–275.
2011. View Article : Google Scholar : PubMed/NCBI
|