Introduction
Non-small cell lung cancers (NSCLC), which are
classified into adenocarcinomas (AD) and squamous cell carcinomas
(SC), account for ~85% of primary lung cancer cases and are
responsible for ~25% of cancer deaths in the United States
(1–4). Previous studies have identified key
differences between these histological subtypes at the molecular
level, and have demonstrated the potential of these differences as
diagnostic biomarkers and predictors of overall survival (5–7). For
example, the mammary serine protease inhibitor maspin has been
demonstrated to be highly expressed in SC, but not in AD (5). In addition, thyroid transcription
factor 1 has been effectively used as an immunohistochemical marker
to differentiate AD from SC (7).
Several studies have examined gene expression profiles in lung
cancer, including studies differentiating AD and SC (8–12). Shi
et al (9) identified 2,961
microRNA sequences that may regulate differentially expressed genes
(DEGs) in both NSCLC and small cell lung cancer across all clinical
stages. Lu et al (10)
studied DEGs in NSCLC subtypes across all stages, identifying a set
of upregulated and downregulated genes in AD and SC but had a
limited sample size. A total of 1,127 DEGs in NSCLC were identified
by Grigoroiu et al (12),
however they focused specially on stage IIIA disease and did not
differentiate between AD and SC. Thus, the number of studies
focusing on gene expression profiles specifically at the early
stages (IA and IB) of NSCLC is low. Therefore, the present study
aimed to provide a unique perspective by identifying gene
expression changes specific to the early stages of AD and SC. Gene
expression profiling of early-stage lung cancer may have great
value in identifying potential molecular targets for the early
detection and treatment of NSCLC.
The 5-year survival rate of patients with NSCLC who
start treatment during stage IA of the disease is ~92%; however,
the 5-year survival rate is 60% for stage IIA, 36% for stage IIIA
and <10% for stage IVA (13).
Thus, diagnosis and treatment at the early stages are crucial for
improving the survival rates of patients with NSCLC. Genomic
profiles of early-stage NSCLC may be particularly advantageous with
the advent of next generation sequencing panels that allow rapid
identification of personalized therapies for cancer by analyzing
genetic variants in tissue biopsies (14). This technology has been demonstrated
to provide clinical benefits in NSCLC and is routinely used to
identify common mutations in lung cancer, such as KRAS and
epidermal growth factor receptor (15,16). The
identification of novel genes and pathways uniquely expressed in
early stages of AD and SC may provide more specific elements for
evolving personalized therapies, such as specific drug targets or
as a component of a panel for a prognostic screening test.
The aim of the present study was to identify the
unique signatures of SC and AD, by comparing the gene expression
levels in each carcinoma to fully characterize the genetic profiles
of each subtype. These unique gene sets may improve our
understanding of the molecular basis of each NSCLC subtype and may
provide more specific targets for personalized therapy.
Materials and methods
The cancer genome atlas (TCGA)
datasets
TCGA (https://www.cancer.gov/about-nci/organization/ccg/research/structural-genomics/tcga)
is a landmark dataset, which comprises the molecular
characterization of over 20,000 samples spanning 33 different
cancer types, publicly available to the research community. TCGA
gene expression RNA-Seq data was downloaded from Xenabrowser
(http://xenabrowser.net). Data for the early
stages (IA and IB) (AJCC 7th Edition TNM Staging System; http://cancerstaging.org) of AD and SC, as well as
those for adjacent normal tissues, were selected. Gene expression
levels were compared between the cancer and normal lung tissue
samples to identify DEGs in each subtype.
Statistical analysis
All statistical analyses were performed using the R
language and environment for statistical computing (R version
3.2.2; R Foundation for Statistical Computing; www.r-project.org). The edgeR package
(https://bioconductor.org/packages/release/bioc/html/edgeR.html)
was used to perform differential expression analysis of all genes
with count per million (CPM)>1 in at ≥2 samples, and two
separate differential gene expression analyses were performed for
each cancer type (AD and SC). To identify DEGs in each subtype, the
gene expression data for the early stages of each carcinoma were
compared with those for the adjacent normal tissues. The Benjamini
and Hochberg's method (17) was used
to control the false discovery rate. The level of change in gene
expression was expressed as the mean fold-change (FC) between the
cancerous and adjacent normal tissues. To identify highly
significantly upregulated genes, a filter of |FC|≥ 4 and adjusted
P<0.001 was used. The FCs of downregulated genes were
transformed with a negative reciprocal, as the negative reciprocal
FC of a downregulated gene has a negative sign, but retains the
fold difference information, which is similar to logFC. For
example, FC of 0.5 is the same as 2-fold downregulation (−2
fold-change). To identify the genes uniquely differentially
expressed in either subtype, DEGs were assigned to the following
categories: i) Genes upregulated in AD (FCAD>4;
PAD<0.001), but not in SC; ii) genes upregulated in
SC (FCSC>4; PSC<0.001), but not in AD
(Table I); iii) genes downregulated
in AD (FCAD<-4; PAD<0.001), but not in
SC; and iv) genes downregulated in SC (FCSC<-4;
PAD<0.001), but not in AD (Table II).
 | Table I.Upregulated genes in AD and SC. |
Table I.
Upregulated genes in AD and SC.
| A, Genes
upregulated specifically in AD |
|---|
|
|---|
| Gene | Gene name | AD FC | AD P-value | SC FC | SC P-value |
|---|
| ALB | Albumin | 1,732.04 |
8.37×10⁻²¹a | −1.48 | 0.205 |
| LIN28A | Protein lin-28
homolog A | 150.39 |
1.18×10⁻⁸a | 1.25 | 0.482 |
| LIPF | Lipase,
gastric | 81.24 |
5.48×10⁻⁷a | 2.69 | 0.057 |
| TM4SF4 | Transmembrane 4 l
six family member 4 | 68.74 |
4.11×10⁻¹⁸a | −2.73 |
<0.001a |
| AGXT2L1 | Alanine-glyoxylate
aminotransferase 2-like 1 | 66.16 |
4.11×10⁻¹¹a | −1.89 | 0.087 |
| ACMSD |
Aminocarboxymuconate semialdehyde
decarboxylase | 50.76 |
1.05×10⁻¹⁷a | 1.60 | 0.314 |
| PLUNC | Palate, lung and
nasal epithelium carcinoma associated | 38.01 |
4.59×10⁻¹³a | 1.57 | 0.299 |
| CDHR2 | Cadherin-related
family member 2 | 34.47 |
9.39×10⁻¹¹a | 1.49 | 0.135 |
| CNGA3 | Cyclic nucleotide
gated channel α 3 | 33.38 |
3.92×10⁻²¹a | −1.63 | 0.020 |
| SLC14A2 | Solute carrier
family 14 (urea transporter), member 2 | 32.14 |
8.58×10⁻¹⁴a | −1.02 | 0.894 |
| TMEM229A | Transmembrane
protein 229A | 26.86 |
1.86×10⁻¹²a | −1.47 | 0.125 |
| GLTPD2 | Glycolipid transfer
protein domain containing 2. | 25.59 |
4.10×10⁻¹³a | 1.23 | 0.671 |
| COL25A1 | Collagen, type xxv,
α 1 | 24.22 |
2.69×10⁻¹⁵a | 1.08 | 0.797 |
| GKN1 | Gastrokine 1 | 23.84 |
4.54×10⁻⁵a | −2.85 |
<0.001a |
| NPTX1 | Neuronal pentraxin
I | 21.88 |
3.19×10⁻¹⁸a | 1.17 | 0.448 |
| FAM177B | Family with
sequence similarity 177, member b | 20.74 |
1.13×10⁻²¹a | 1.09 | 0.797 |
| LOC643763 | Hypothetical
protein loc643763 | 19.57 |
6.23×10⁻¹²a | 1.92 | 0.077 |
| LOC145837 | Hypothetical
protein loc145837 | 19.20 |
1.96×10⁻²⁰a | 1.47 | 0.128 |
| ZP2 | Zona pellucida
glycoprotein 2 (sperm receptor) | 18.62 |
8.39×10⁻⁶a | −2.63 |
<0.001a |
| TFPI2 | Tissue factor
pathway inhibitor 2 | 17.86 |
2.40×10⁻¹⁷a | −1.01 | 0.930 |
| LGALS4 | Lectin,
galactoside-binding, soluble, 4 (galectin 4) | 17.76 |
6.23×10⁻¹²a | −2.71 |
<0.001a |
| KNG1 | Kininogen 1 | 17.56 |
1.99×10⁻⁷a | 1.83 | 0.097 |
| TTR | Transthyretin
(prealbumin, amyloidosis type I) | 17.14 |
3.31×10⁻⁷a | 2.86 | 0.054 |
| PHGR1 | Proline, histidine,
and glysine-rich protein 1 | 17.13 |
4.30×10⁻⁶a | 2.38 | 0.076 |
| MUC21 | Mucin 21, cell
surfaceassociated | 14.87 |
1.96×10⁻²⁰a | −2.79 |
<0.001a |
| MUC5B | Mucin 5b,
oligomeric mucus/gel-forming | 14.01 |
4.66×10⁻¹⁴a | −1.13 | 0.640 |
| FGA | Fibrinogen α
chain | 12.68 |
2.45×10⁻¹⁰a | −1.92 | 0.020 |
| UPK3A | Uroplakin 3a | 12.53 |
2.47×10⁻²⁰a | 1.28 | 0.239 |
| SLC1A7 | Solute carrier
family 1 (glutamate transporter), member 7 | 12.38 |
1.11×10⁻¹⁴a | −3.80 |
<0.001a |
| RGS7 | Regulator of
g-protein signaling 7 | 12.38 |
6.30×10⁻¹²a | 1.56 | 0.208 |
|
| B, Genes
upregulated specifically in SC |
|
| Gene | Gene
name | AD FC | AD
P-value | SC FC | SC
P-value |
|
| AMTN | Amelotin | 1.70 | 0.137 | 618.16 |
4.66×10⁻²⁵a |
| ADH7 | Alcohol
dehydrogenase 7 (class iv), mu or sigma polypeptide | 1.52 | 0.277 | 57.12 |
3.30×10⁻²³a |
| SOST | Sclerostin | −1.81 | 0.027 | 54.92 |
3.90×10⁻¹⁸a |
| CLDN22 | Claudin 22 | 2.46 | 0.059 | 54.24 |
5.77×10⁻⁶a |
| SOX10 | SRY (sex
determining region y)-box 10 | 1.76 | 0.050 | 39.80 |
1.92×10⁻¹⁰a |
| C12orf54 | Chromosome 12 open
reading frame 54 | 1.72 | 0.053 | 39.51 |
2.34×10⁻³⁴a |
| GPR149 | G protein-coupled
receptor 149 | 2.42 | 0.116 | 38.62 |
7.30×10⁻¹³a |
| SCGN | Secretagogin,
ef-hand calcium binding protein | 1.96 | 0.172 | 37.66 |
2.92×10⁻⁵a |
| SLC35D3 | Solute carrier
family 35, member d3 | −1.20 | 0.456 | 37.43 |
3.85×10⁻¹³a |
| CT45A3 | Cancer/testis
antigen family 45, member a3 | 3.01 | 0.151 | 35.61 |
2.05×10⁻⁵a |
| ADAM23 | Adam
metallopeptidase domain 23 | 1.01 | 1.000 | 34.46 |
1.71×10⁻²⁹a |
| ST8SIA3 | St8
α-n-acetyl-neuraminide α-2,8-sialyltransferase 3 | 3.17 | 0.059 | 33.69 |
7.23×10⁻⁵a |
| HOXD10 | Homeobox d10 | 1.53 | 0.120 | 32.56 |
3.08×10−36a |
| LMO1 | Lim domain only 1
(rhombotin 1) | 1.59 | 0.072 | 31.08 |
1.71×10⁻²⁴a |
| ODZ2 | Odz, odd oz/ten-m
homolog 2 | 1.00 | 0.972 | 30.69 |
2.36×10⁻³⁰a |
| CLDN19 | Claudin 19 | −1.62 | 0.070 | 30.28 |
1.95×10⁻¹⁰a |
| FOXN1 | Forkhead box
n1 | 1.19 | 0.339 | 29.93 |
6.61×10⁻³⁵a |
| APOA1 | Apolipoprotein
a-i | 1.81 | 0.064 | 29.75 |
8.79×10⁻⁹a |
| HS3ST4 | Heparan sulfate
(glucosamine) 3-o-sulfotransferase 4 | 1.74 | 0.097 | 29.69 |
3.25×10⁻¹¹a |
| PAX1 | Paired box 1 | 1.63 | 0.225 | 28.10 |
7.10×10⁻¹¹a |
| OLFM3 | Olfactomedin 3 | 2.73 | 0.050 | 26.58 |
2.93×10⁻⁹a |
| FAM181B | Family with
sequence similarity 181, member b | 1.11 | 0.668 | 25.19 |
1.25×10−39a |
| CRNN | Cornulin | 2.06 | 0.129 | 24.94 |
1.37×10⁻⁸a |
| TP53AIP1 | Tumor protein p53
regulated apoptosis inducing protein 1 | −1.02 | 0.916 | 23.03 |
8.00×10⁻²⁵a |
| TCHHL1 | Trichohyalin-like
1 | 2.34 | 0.242 | 22.08 |
1.38×10⁻¹⁷a |
| SERPINB2 | Serpin peptidase
inhibitor, clade b (ovalbumin), member 2 | −1.06 | 0.802 | 21.55 |
8.28×10⁻²¹a |
| QRFPR | Pyroglutamylated
rfamide peptide receptor | −2.30 | 0.003 | 21.09 |
1.94×10⁻¹⁰a |
| TGM3 | Transglutaminase
3 | −1.59 | 0.039 | 20.25 |
2.65×10⁻¹³a |
| CT45A1 | Cancer/testis
antigen family 45, member a1 | 1.74 | 0.302 | 20.10 |
5.63×10⁻⁷a |
| CT45A4 | Cancer/testis
antigen family 45, member a4 | 3.55 | 0.079 | 19.29 |
1.5×10⁻⁴a |
| Table II.Downregulated genes in AD and SC. |
Table II.
Downregulated genes in AD and SC.
| A, Genes
downregulated specifically in AD |
|---|
|
|---|
| Gene | Gene name | AD FC | AD P-value | SC FC | SC P-value |
|---|
| ADCY8 | Adenylate cyclase 8
(brain) | −11.65 |
8.60×10⁻²⁴a | 2.13 | 0.073 |
| SOSTDC1 | Sclerostin domain
containing 1 | −10.96 |
2.73×10−39a | −1.01 | 0.937 |
| SLCO1A2 | Solute carrier
organic anion transporter family, member | −10.09 |
1.71×10⁻²⁶a | −1.29 | 0.146 |
| CHRNA2 | Cholinergic
receptor, nicotinic, α 2 (neuronal) | −10.08 |
1.20×10−43a | −1.43 | 0.292 |
| ODAM | Odontogenic,
ameloblast associated | −9.92 |
2.10×10⁻³³a | 3.22 | 0.009 |
| KRT79 | Keratin 79 | −8.53 |
3.65×10⁻³³a | −1.06 | 0.788 |
| SYN2 | Synapsin ii | −7.58 |
5.50×10−37a | −1.05 | 0.790 |
| S100A12 | S100 calcium
binding protein a12 | −6.92 |
5.97×10−45a | −1.26 | 0.310 |
| TGM1 | Transglutaminase
1 | −6.87 |
1.19×10−78a | 2.44 |
<0.001a |
| ANXA8L2 | Annexin a8-like
2 | −6.84 |
2.81×10⁻²⁹a | 1.78 |
<0.001a |
| SLITRK2 | Slit and ntrk-like
family, member 2 | −6.63 |
3.63×10−36a | −1.09 | 0.730 |
| DCC | Deleted in
colorectal carcinoma | −6.26 |
1.78×10−40a | 1.10 | 0.773 |
| FGFBP2 | Fibroblast growth
factor binding protein 2 | −5.78 |
1.31×10⁻²⁴a | 5.56 |
<0.001a |
| VIT | Vitrin | −5.56 |
3.27×10⁻²⁸a | 5.59 |
<0.001a |
| LPPR5 | Lipid phosphate
phosphatase-related protein type 5 | −5.55 |
9.97×10⁻¹⁹a | −1.34 | 0.311 |
| VWC2 | Von willebrand
factor c domain containing 2 | −4.62 |
4.26×10⁻³¹a | 2.15 | 0.008 |
| NOS1 | Nitric oxide
synthase 1 (neuronal) | −4.50 |
1.75×10⁻¹¹a | 1.11 | 0.769 |
| HSPB3 | Heat shock 27 kda
protein 3 | −4.47 |
3.32×10⁻²⁶a | 1.73 | 0.021 |
| SEMA6D | Semaphoring 6D | −4.28 |
1.70×10⁻³³a | −1.14 | 0.404 |
| NTRK2 | Neurotrophic
tyrosine kinase, receptor, type 2 | −4.21 |
1.10×10⁻¹⁸a | 9.48 |
<0.001a |
| SLC27A6 | Solute carrier
family 27 (fatty acid transporter), member 6 | −4.12 |
4.37×10⁻¹⁰a | −1.34 | 0.297 |
| CHRNA4 | Cholinergic
receptor, nicotinic, α 4 | −4.11 |
5.82×10⁻¹⁶a | 2.21 | 0.013 |
| EDN3 | Endothelin 3 | −4.09 |
3.04×10⁻⁹a | 3.96 | 0.014 |
| NDRG4 | Ndrg family member
4 | −4.08 |
6.96×10⁻³⁴a | 1.73 | 0.002 |
| KRT4 | Keratin 4 | −4.03 |
2.93×10⁻¹¹a | 2.55 | 0.006 |
| FEZ1 | Fasciculation and
elongation protein zeta 1 (zygin i) | −4.02 |
3.18×10−77a | −1.19 | 0.141 |
| ANXA8 | Annexin a8 | −4.01 |
1.57×10⁻¹²a | 3.94 |
<0.001a |
|
| B, Genes
downregulated specifically in SC |
|
| Gene | Gene
name | AD FC | AD
P-value | SC FC | SC
P-value |
|
| MYH1 | Myosin, heavy chain
1, skeletal muscle, adult | −1.33 | 0.336 | −16.35 |
8.37×10⁻²¹a |
| PGC | Progastricsin
(pepsinogen c) | 3.89 |
<0.001a | −16.06 |
1.18×10⁻⁸a |
| CHIA | Chitinase,
acidic | 1.25 | 0.420 | −15.74 |
5.48×10⁻⁷a |
| SFTA2 | Surfactant
associated 2 | 1.15 | 0.361 | −14.51 |
4.11×10⁻¹⁸a |
| APOH | Apolipoprotein h
(β-2-glycoprotein i) | 1.82 | 0.035 | −13.95 |
4.11×10⁻¹¹a |
| CAPN9 | Calpain 9 | −1.22 | 0.316 | −12.42 |
1.05×10⁻¹⁷a |
| DPCR1 | Diffuse
panbronchiolitis critical region 1 | 4.44 |
<0.001a | −12.26 |
4.59×10⁻¹³a |
| FOLR1 | Folate receptor 1
(adult) | −1.33 | 0.076 | −11.98 |
9.39×10⁻¹¹a |
| SFTA3 |
Surfactant-associated 3 | −1.20 | 0.184 | −11.69 |
3.92×10⁻²¹a |
| C16orf89 | Chromosome 16 open
reading frame 89 | 1.19 | 0.394 | −11.54 |
8.58×10⁻¹⁴a |
| HNF1B | Hnf1 homeobox
b | 1.23 | 0.114 | −11.46 |
1.86×10⁻¹²a |
| SLC10A2 | Solute carrier
family 10 member 2 | 1.95 | 0.158 | −10.75 |
4.10×10⁻¹³a |
| NAPSA | Napsin a aspartic
peptidase | −1.15 | 0.382 | −10.39 |
2.69×10⁻¹⁵a |
| CYP2B7P1 | Cytochrome p450,
family 2, subfamily b, polypeptide 7 pseudogene 1 | 1.23 | 0.316 | −9.97 |
4.54×10⁻⁵a |
| MIA2 | Melanoma inhibitory
activity 2 | −1.05 | 0.783 | −9.17 |
3.19×10⁻¹⁸a |
| CCL14.CCL15 | C-C motif chemokine
14 | −1.91 | 0.053 | −9.13 |
1.13×10⁻²¹a |
| C4BPA | Complement
component 4 binding protein, α | −1.38 | 0.075 | −8.55 |
6.23×10⁻¹²a |
| TDRD10 | Tudor domain
containing 10 | −1.01 | 0.931 | −8.50 |
1.96×10⁻²⁰a |
| AQP7 | Aquaporin 7 | 2.16 |
<0.001a | −8.20 |
8.39×10⁻⁶a |
| FMO5 | Flavin containing
monooxygenase 5 | 1.54 | 0.008 | −7.99 |
2.40×10⁻¹⁷a |
| NKX2.1 | Homeobox protein
Nkx-2.1 | 1.26 | 0.067 | −7.72 |
6.23×10⁻¹²a |
| SLC26A9 | Solute carrier
family 26, member 9 | 1.27 | 0.249 | −7.64 |
1.99×10⁻⁷a |
| SCGB3A1 | Secretoglobin,
family 3a, member 1 | 1.77 | 0.062 | −7.60 |
3.31×10⁻⁷a |
Functional analysis of DEGs
An Ingenuity Pathway Analysis (IPA) software tool
(https://www.qiagenbioinformatics.com/products/ingenuity-pathway-analysis)
was used to determine the underlying mechanisms, functions,
pathways and associations between the gene sets identified during
DEG analysis. Molecular and cellular functions and canonical
pathways were identified using IPA to distinguish the complex
biology underlying the pathogenesis of the two lung cancer
subtypes. Upstream regulator analysis using IPA was performed to
discover the upstream transcriptional factors regulating changes in
the expression of the identified genes. The analysis is based on
the expected effects between transcriptional regulators and their
targets stored in the Ingenuity database. The analysis provides a
P-value and an activation z-score based on the number of known
targets present in the DEGs for each transcriptional regulator.
Overall, this analysis is part of IPA core analysis examining the
mechanisms, functions and pathways associated with a given set of
genes.
Results
Identification of DEGs
RNA-Seq gene expression data from TCGA were analyzed
to compare the gene expression changes in the early stages of two
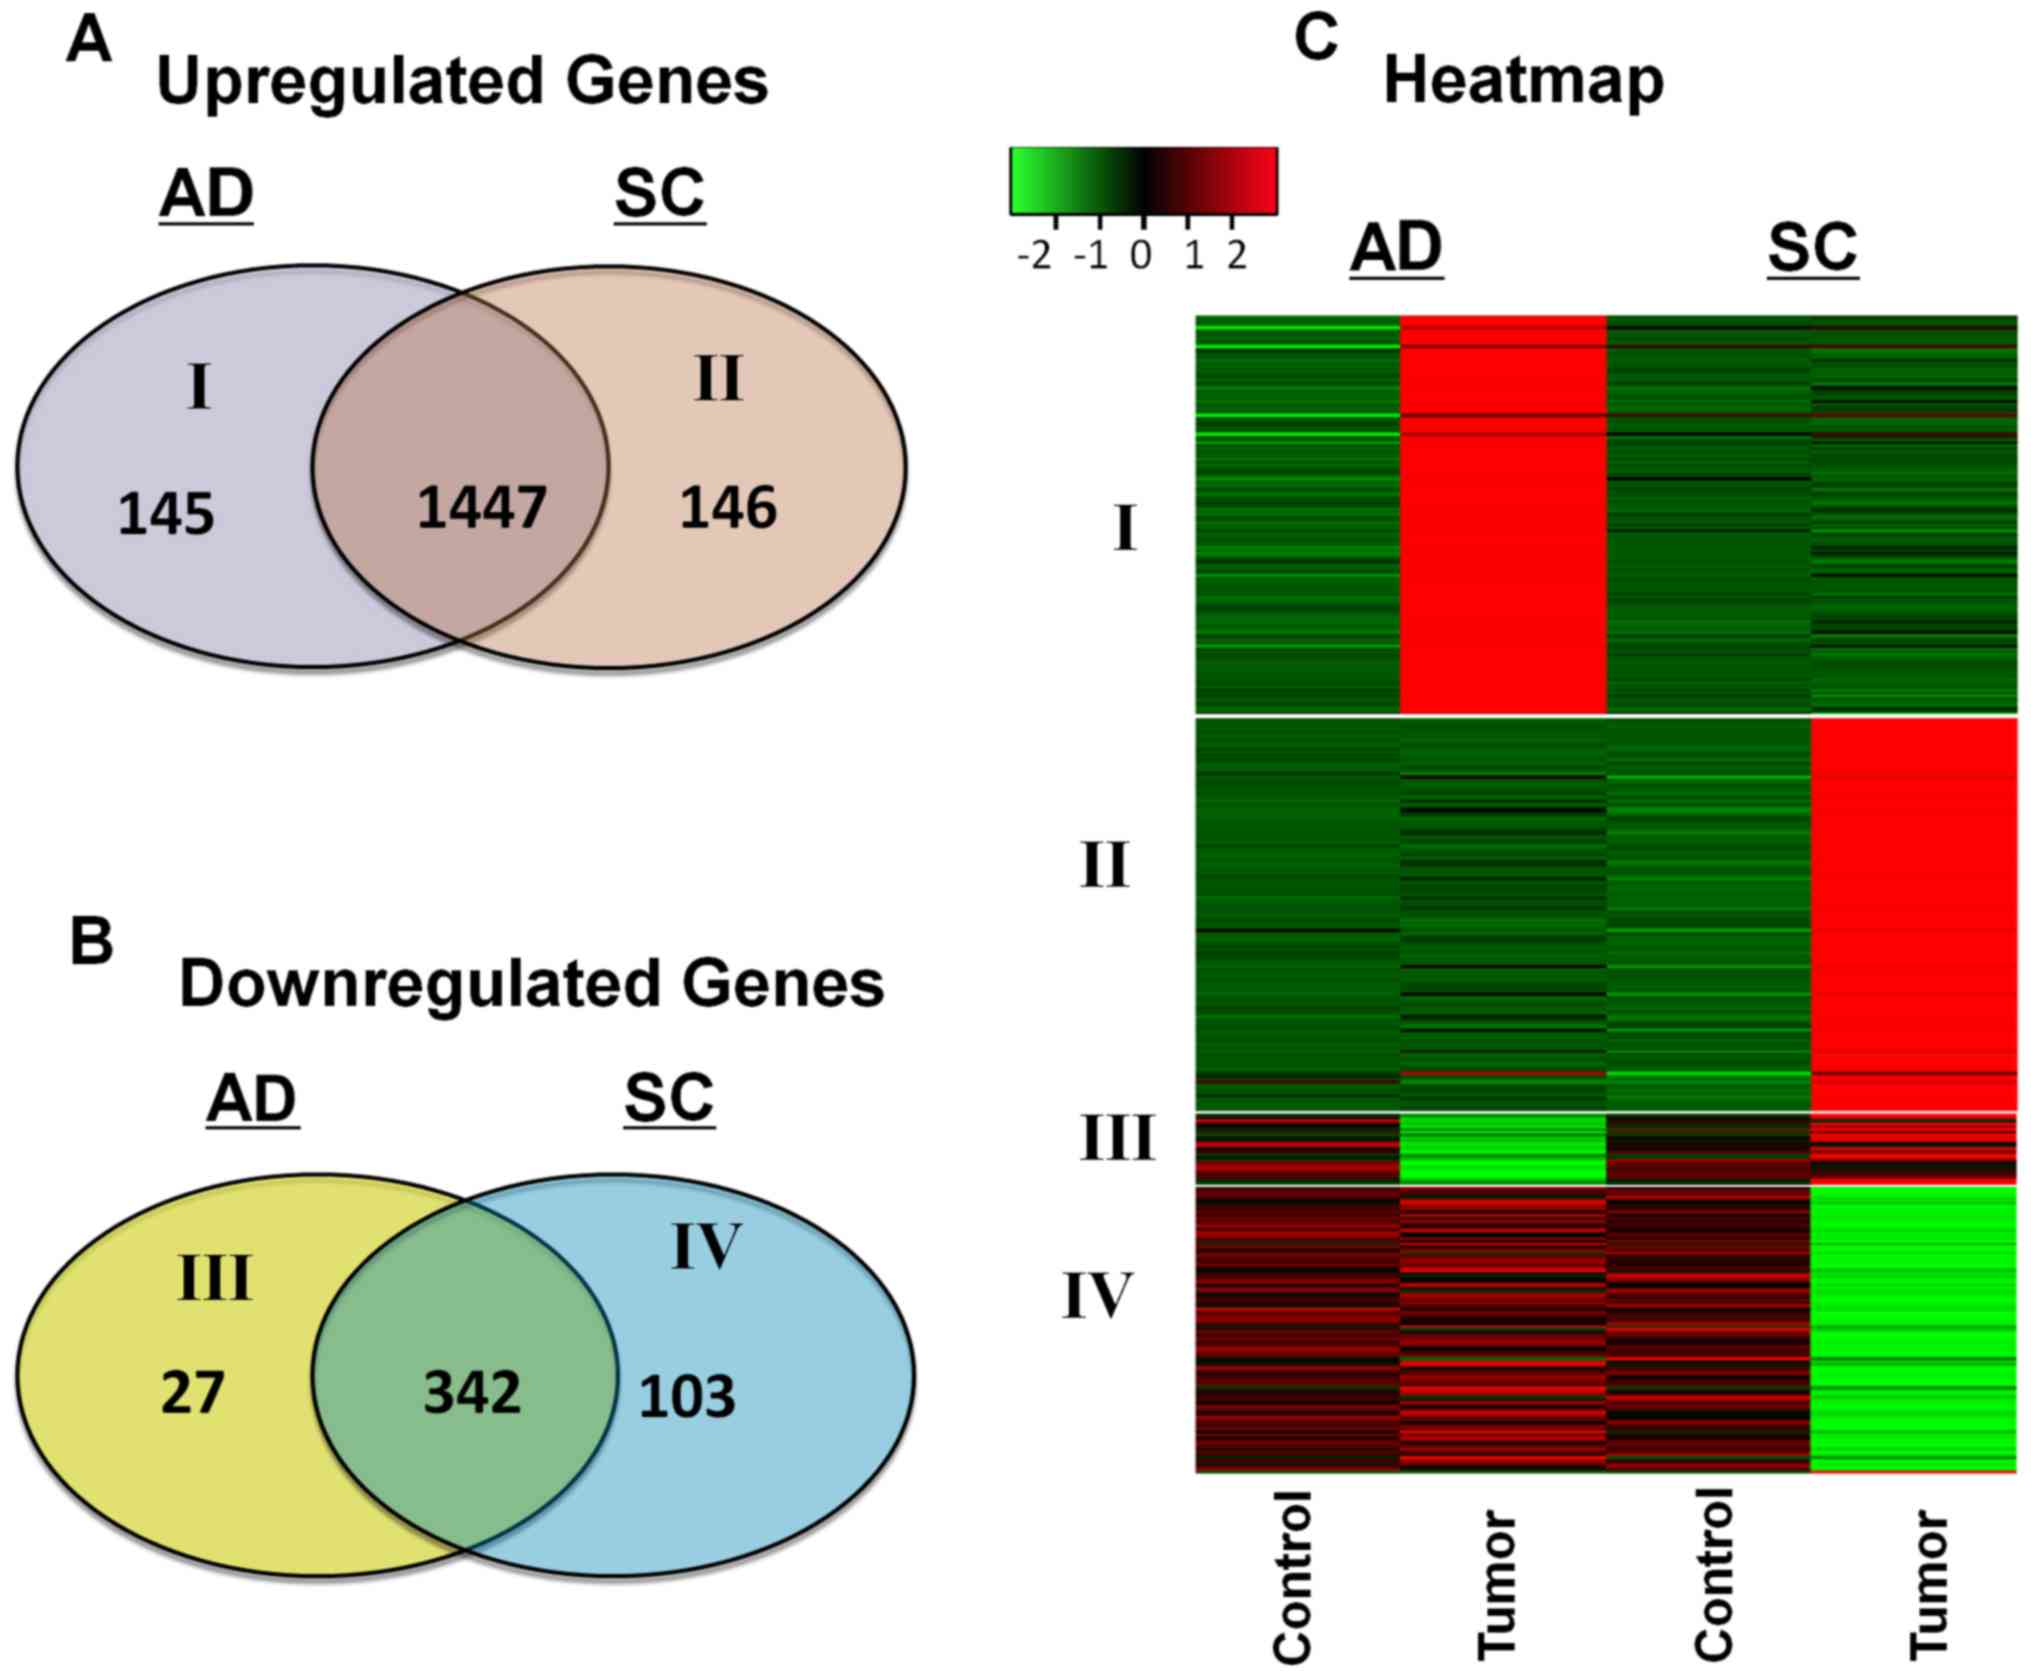
NSCLC subtypes. A total of 145 genes were upregulated specifically
in AD, and 146 genes were upregulated specifically in SC. Among the
downregulated genes, 27 were downregulated specifically in AD,
whereas 103 were downregulated specifically in SC. Venn diagrams
representing the number of upregulated and downregulated genes in
the two NSCLC subtypes are presented in Fig. 1A and B. A heat map was constructed to
identify the expression patterns of these unique gene sets in each
subtype (Fig. 1C). The patients were
stratified by smoking status to determine whether the DEGs were
associated with smoking; the results demonstrated that early-stage
differences unique to each subtype were not associated with smoking
(data not shown).
Genes differentially expressed in
AD
A total of 145 genes were highly upregulated
specifically in AD (FCAD>4; PAD<0.001)
with no significant upregulation in SC. The genes with the highest
FC uniquely upregulated in each subtype are presented in Table I. In addition, 27 genes were
significantly downregulated specifically in AD
(FCAD<-4; PAD<0.001) with no
significant downregulation in SC (Table
II). Highly upregulated genes specific to AD included albumin
(ALB; AD, FC=1,732.04; SC, FC=−1.48), protein lin-28 homolog
A (LIN28A; AD, FC=150.39; SC, FC=1.25), gastric lipase
(LIPF; AD, FC=81.24; SC, FC=2.69), transmembrane 4 L six
family member 4 (TM4SF4; AD, FC=68.74; SC, FC=−2.73) and
alanine-glyoxylate aminotransferase 2-like 1 (AGXT2L1; AD,
FC=66.16; SC, FC=−1.89). The LIN28A gene is a cell cycle
regulator, the role of which has been identified in a number of
human cancers (18,19), but not in NSCLC. AD also demonstrated
~15-fold upregulation in the mucin (MUC) family of genes,
which may be associated with the secretory nature of the tumor. The
top downregulated genes specific to AD included adenylate cyclase 8
(AD, FC=−11.65; SC, FC=2.13), sclerostin domain-containing 1
(SOSTDC1; AD, FC=−10.96; SC, FC=−1.01), solute carrier
organic anion transporter family member 1A2 (AD, FC=−10.09; SC,
FC=−1.29), cholinergic receptor nicotinic α2 subunit (AD,
FC=−10.08; SC, FC=−1.43) and odontogenic ameloblast-associated
(ODAM; AD, FC=−9.92; SC, FC=3.22).
Genes differentially expressed in
SC
A total of 146 genes were highly upregulated in SC
(FCSC>4; PSC<0.001) with no significant
upregulation in AD (Table I). In
addition, 103 genes were significantly downregulated
(FCSC<-4; PSC<0.001) in SC with no
downregulation in AD (Table II).
The top upregulated genes unique to SC were amelotin (AMTN;
SC, FC=618.16; AD, FC=1.70), alcohol dehydrogenase 7 (ADH7;
SC, FC=57.12; AD, FC=1.52), sclerostin (SOST; SC, FC=54.92;
AD, FC=−1.81), claudin 22 (CLDN22; SC, FC=54.24; AD,
FC=2.46) and SRY-box 10 (SC, FC=39.80; AD, FC=1.76). In addition,
early-stage SC exhibited unique upregulation of several members of
the cancer/testis antigen (CTA) family of genes. The top
downregulated genes specific to SC were myosin heavy chain 1 (SC,
FC=−16.35; AD, FC=−1.33), progastricsin (SC, FC=−16.06; AD,
FC=3.89), chitinase acidic (SC, FC-15.74; AD, FC=1.25),
surfactant-associated 2 (SC, FC=−14.51; AD, FC=1.15) and
apolipoprotein H (SC, FC=−13.95; AD, FC=1.82).
Analysis of molecular pathways in
AD
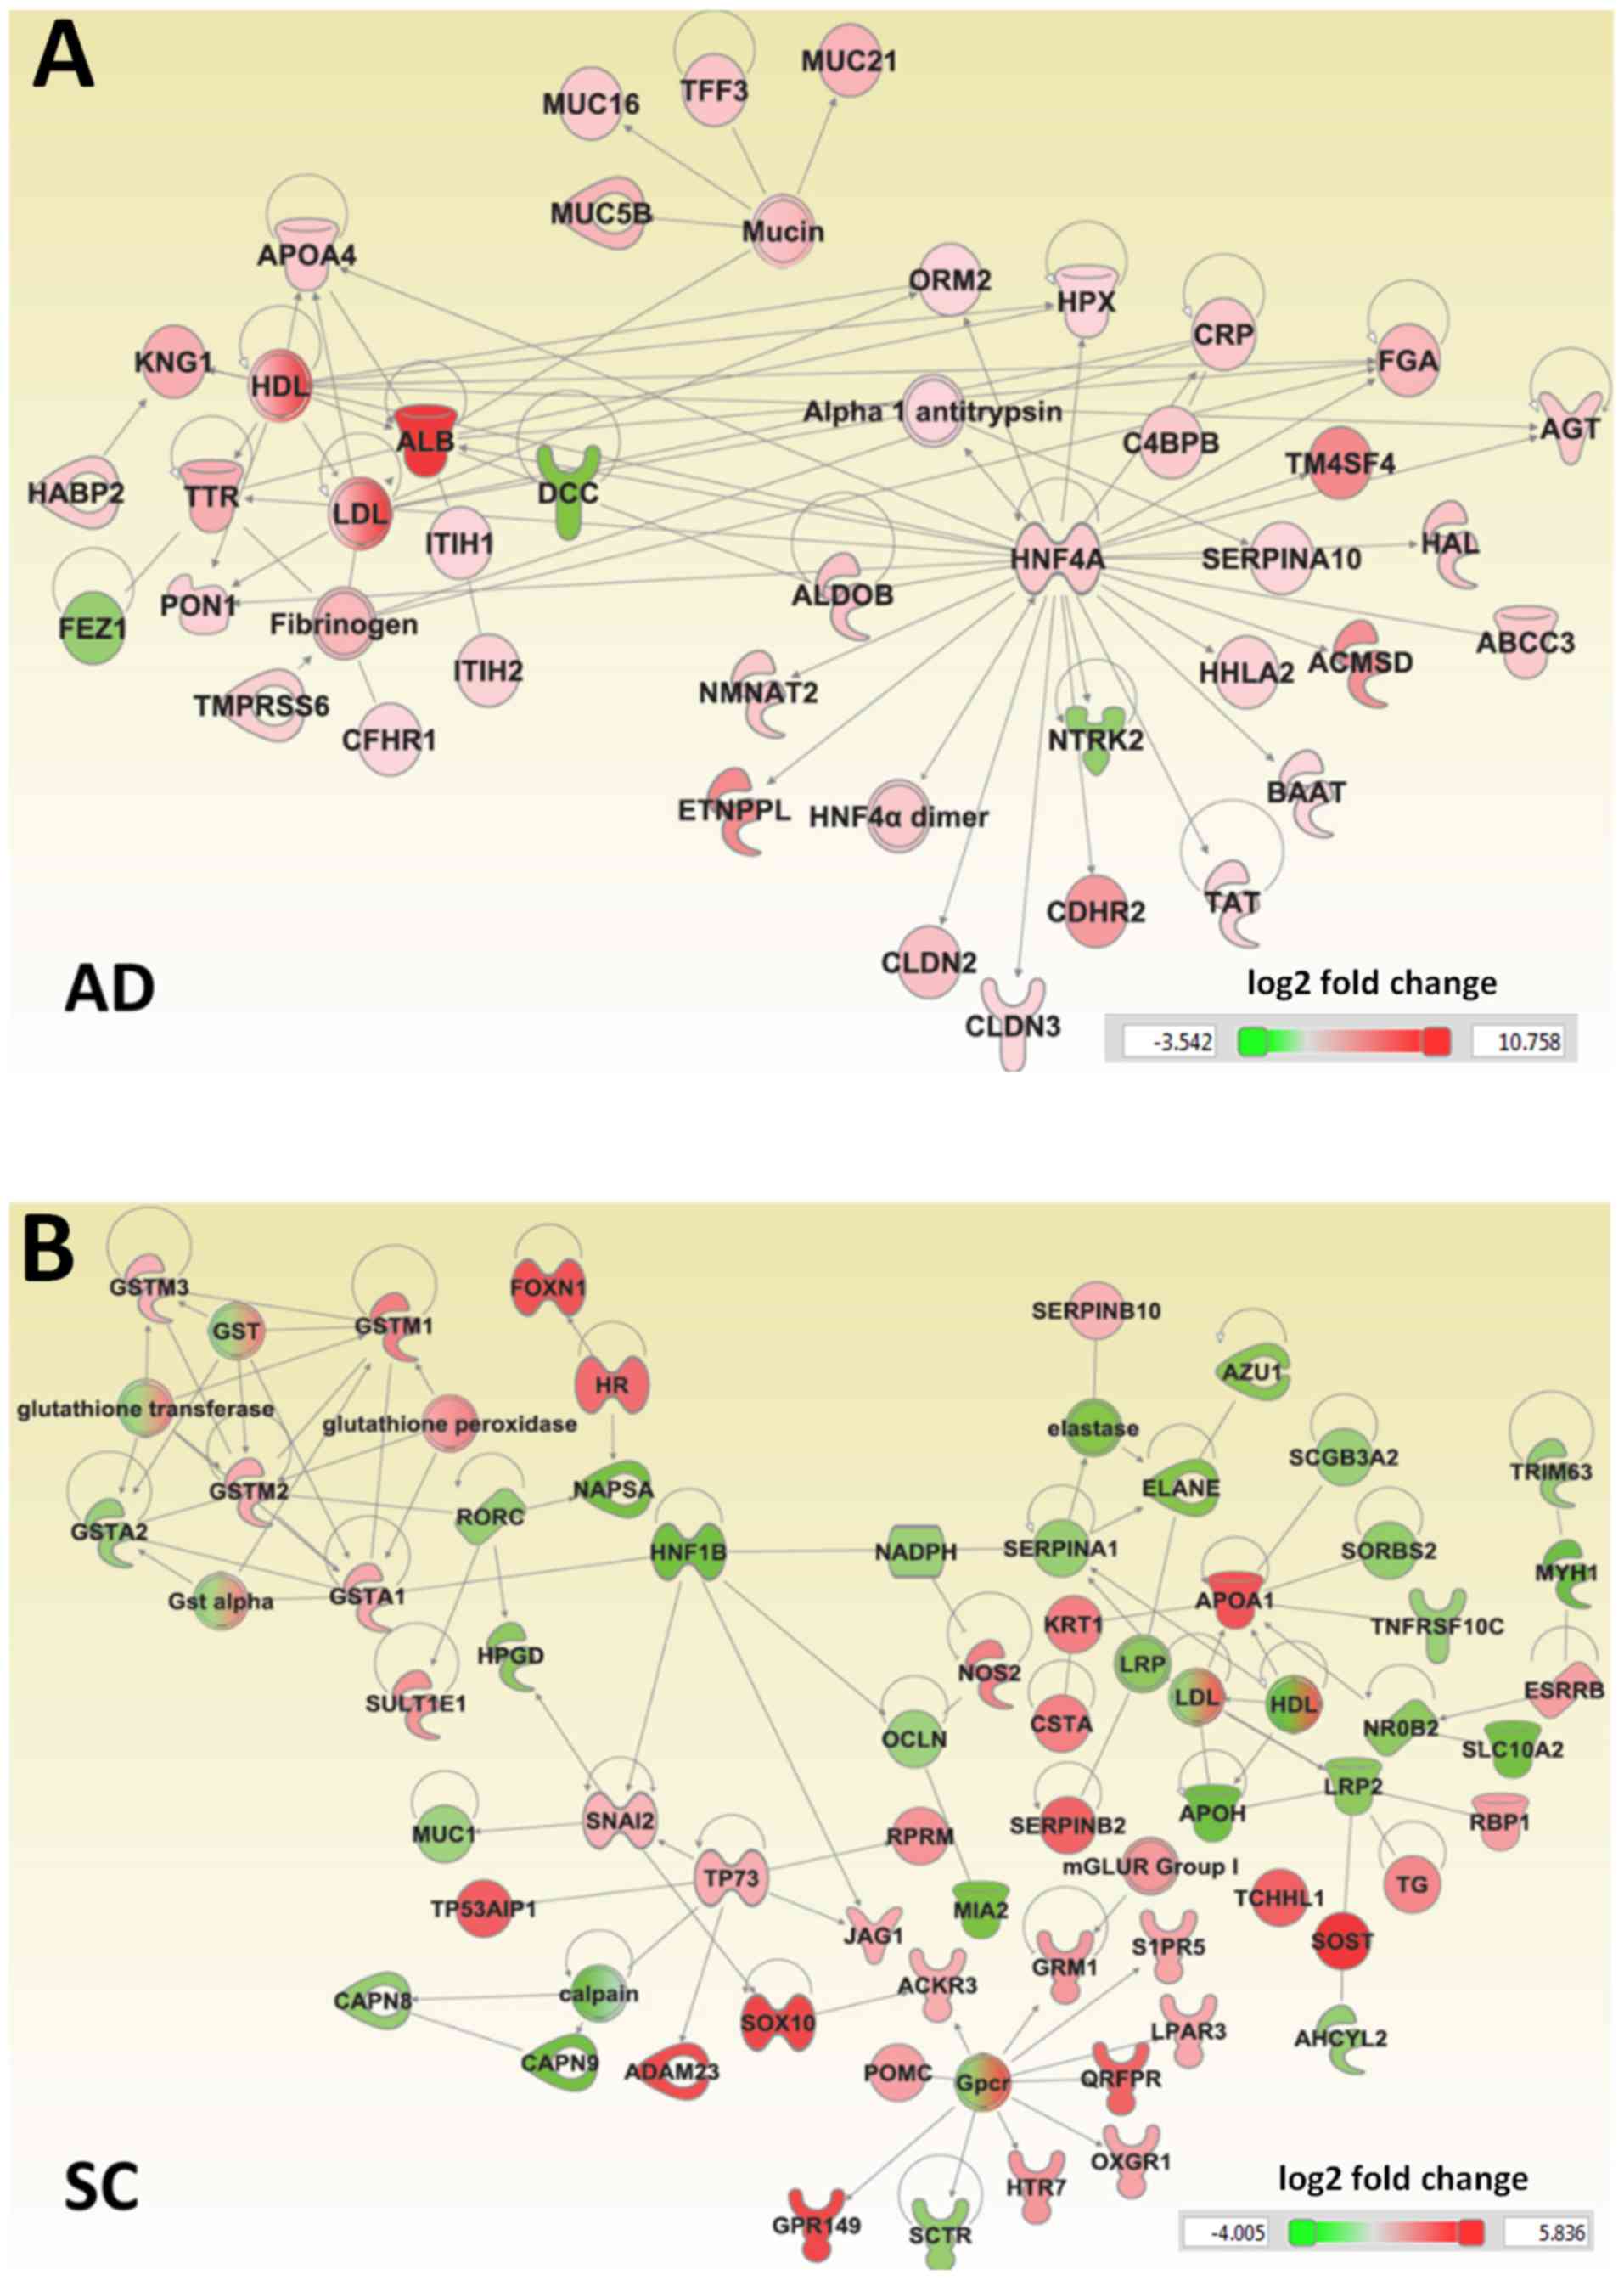
The IPA tool was used to generate an interaction
network for genes specifically differentially regulated in AD and
SC, based on known interactions (Fig.
2). The genes uniquely dysregulated in AD were enriched in a
number of molecular and cellular functions, including ‘molecular
transport’, ‘cell-to-cell signaling and interaction’, ‘amino acid
metabolism’ and ‘cellular growth and proliferation’. A number of
the dysregulated genes specific to AD were also involved in the
canonical farnesoid X receptor (NR1H4)/retinoid X receptor
(RXR) activation and liver X receptor (LXR)/RXR activation
pathways. The roles of these regulators in NSCLCs have not been
previously reported. A number of upstream regulators of these genes
were identified, including hepatocyte nuclear factor 4 α
(HNF4A), which regulated 26 genes, HNF1A, which
regulates 22 genes, transcription activator BRG1 (SMARCA4),
which regulates 14 genes, and Forkhead Box A2 (FOXA2), which
regulated 10 genes (Table III).
The HNF family of genes and FOXA2 have been
independently associated with AD as positive and negative
regulators of growth, respectively (20,21).
| Table III.Functional annotation terms of genes
enriched in lung adenocarcinoma. |
Table III.
Functional annotation terms of genes
enriched in lung adenocarcinoma.
| Gene Ontology
term | Count | P-value |
|---|
| Molecular and
cellular functions |
| Small
molecule biochemistry | 50 |
3.0×10⁻⁵ |
|
Molecular transport | 43 |
1.6×10⁻⁵ |
|
Cell-to-cell signaling and
interaction | 42 |
2.1×10⁻⁵ |
| Amino
acid metabolism | 18 |
3.0×10⁻⁵ |
|
Cellular growth and
proliferation | 16 |
2.1×10⁻⁵ |
| Canonical
pathways |
| FXR/RXR
activation | 13 |
1.1×10⁻¹¹ |
| LXR/RXR
activation | 9 |
3.2×10⁻⁷ |
| Acute
phase response signaling | 9 |
7.3×10⁻⁶ |
| eNOS
signaling | 6 |
1.9×10⁻³ |
|
Coagulation system | 3 |
2.2×10⁻³ |
| Upstream
regulators |
|
Hepatocyte nuclear factor
4-α | 26 |
7.7×10⁻³ |
|
Hepatocyte nuclear factor
1-α | 22 |
2.6×10⁻¹² |
|
Transcription activator
BRG1 | 14 |
2.0×10⁻⁴ |
|
Forkhead Box protein A2 | 10 |
1.9×10⁻⁶ |
|
Peroxisome
proliferator-activated receptor α | 10 |
2.1×10⁻³ |
|
LIM/homeobox protein Lhx1 | 8 |
1.2×10⁻⁶ |
|
Forkhead Box protein A1 | 8 |
1.8×10⁻⁵ |
| Bile
acid receptor | 7 |
1.6×10⁻⁴ |
| PR
domain zinc finger protein 1 | 7 |
1.6×10⁻³ |
|
Myoblast determination protein
1 | 6 |
2.6×10⁻³ |
| Mothers
against decapentaplegic homolog 3 | 6 |
7.4×10⁻³ |
Analysis of molecular pathways in
SC
The genes unique to early-stage SC were enriched in
‘xenobiotic metabolism’, ‘lipid metabolism’, ‘vitamin and mineral
metabolism’, ‘drug metabolism’ and ‘free radical scavenging’. These
results suggested that impaired lipid metabolism is specific to SC.
The canonical pathways ‘LPS/IL-1 mediated inhibition of RXR
function’, ‘xenobiotic metabolism signaling’ and ‘aryl hydrocarbon
receptor signaling’ were among those specifically dysregulated in
SC. Peroxisome proliferator-activated receptor-γ (PPARG),
which regulates 15 genes, c-Jun, which regulates 15 genes,
and RXR α (RXRA), which regulates 14 genes, were
among the upstream regulators of the differentially regulated genes
(Table IV).
| Table IV.Functional annotation terms enriched
in lung squamous cell carcinoma. |
Table IV.
Functional annotation terms enriched
in lung squamous cell carcinoma.
| Gene Ontology
term | Count | P-value |
|---|
| Molecular and
cellular functions |
| Small
molecule biochemistry | 58 |
7.9×10⁻⁸ |
| Lipid
metabolism | 45 |
7.9×10⁻⁸ |
| Vitamin
and mineral metabolism | 26 |
7.9×10⁻⁸ |
| Drug
metabolism | 15 |
3.8×10⁻⁶ |
| Free
radical scavenging Canonical pathways | 10 |
1.1×10⁻⁵ |
|
LPS/IL-1 mediated inhibition
of RXR function | 14 |
4.6×10⁻⁸ |
|
Xenobiotic metabolism
signaling | 12 |
3.5×10⁻⁵ |
| Aryl
hydrocarbon receptor signaling | 10 |
1.6×10⁻⁶ |
| PXR/RXR
activation | 6 |
5.8×10⁻⁵ |
|
Glutathione-mediated
detoxification | 5 |
5.0×10⁻⁵ |
| Upstream
regulators |
|
Peroxisome
proliferator-activated receptor γ | 15 |
5.8×10⁻⁵ |
|
Transcription factor AP-1 | 15 |
5.4×10⁻⁵ |
|
Retinoic acid receptor
RXR-α | 14 |
5.0×10⁻⁷ |
|
Estrogen receptor β | 13 |
7.2×10⁻⁵ |
| Tumor
protein 63 | 13 |
1.4×10⁻⁴ |
|
Retinoic acid receptor α | 12 |
8.9×10⁻⁵ |
| Histone
deacetylase 1 | 11 |
5.0×10⁻⁵ |
|
Homeobox protein Nkx-2.1 | 10 |
1.4×10⁻⁵ |
| Zinc
finger protein GLI2 | 7 |
7.9×10⁻⁵ |
|
LIM/homeobox protein Lhx1 | 7 |
9.0×10⁻⁵ |
Discussion
Lung carcinomas account for >25% of
cancer-associated mortalities worldwide, and the majority of
primary lung cancers are NSCLC histological subtypes, including AD
and SC (3). Personalized treatment
for these cancers requires a complete and detailed understanding of
the distinct molecular mechanisms that contribute to tumorigenesis,
especially in early stages when survival rates are >90%. In the
present study, a total of 172 genes with differential expression
(145 upregulated and 27 downregulated) specific to AD, and another
249 genes (146 upregulated and 103 downregulated) specific to SC
were identified.
The present study demonstrated that early-stage AD
exhibited a 150-fold upregulation of the oncogene LIN28A,
which is involved in cell cycle progression through the regulation
of cyclin-dependent kinase 2 in lung, breast, ovarian, colon, liver
and pancreatic cancer (22). In
addition, LIN28 has been demonstrated to confer resistance
to radiotherapy in lung carcinoma cell lines (23) and has been explored for its potential
role in breast cancer therapy (24).
The results of the present study revealed that the activity of this
oncogene was unique to the AD subtype of NSCLC, whereas no
significant changes in LIN28 expression levels were observed
in SC. These results suggested that LIN28A may be a novel
therapeutic target for AD. The palate, lung and nasal epithelium
carcinoma-associated gene, which has a documented association with
respiratory tumors with a glandular phenotype (25), was upregulated 38-fold in AD in the
present study. Members of the mucin family of genes, mucin 21 cell
surface-associated and mucin 5b oligomeric mucus/gel-forming, were
identified to be upregulated ~15-fold in AD, and are likely to be
involved in the excessive secretion of mucus by neoplastic cells in
AD (26). Mucin peptides
incorporated into liposomal vaccines are associated with extended
survival times in patients with lung cancer (27). Downregulation of several tumor
suppressor genes including SOSTDC1, ODAM, deleted in
colorectal carcinoma, fasciculation and elongation proteins ζ 1 and
annexin A8 was observed in AD, but not in SC. These genes are
associated with a variety of cancers, including lung, breast, colon
and prostate cancer (28–31).
In the present study, early-stage SC exhibited
specific upregulation of CTA family 45 members A1-4.
Auto-antibodies against the genes of this family have been
demonstrated to serve as biomarkers for NSCLC with low sensitivity
and high specificity (32), and a
RNAseq catalog of 90 cancer testis antigens were established by
Djureinovic et al (33). The
results of the present study also demonstrated that the expression
of another member of the CTA family, X antigen family member
2, was downregulated in SC; this gene has previously been
identified as a tumor suppressor in metastatic melanoma and Ewing
sarcoma (34). In addition, SC
exhibited downregulation of several tumor suppressor genes,
including melanoma inhibitory activity 2, which is involved in
hepatocellular carcinoma (30), and
secretoglobin family 3a member 1, which serves a role in testicular
germ cell tumors (35,36).
In the present study, ‘cellular function’ and ‘lipid
metabolism’ were associated with the genes dysregulated
specifically in early-stage SC. Alterations in lipid metabolism
have been previously implicated in human cancers, particularly oral
squamous cell carcinoma, in which increased lipid metabolism is
associated with invasiveness (37).
Previous studies have reported that impaired lipid metabolism in
NSCLC results in the loss of malignant potential (38–40). The
results of the present study suggested that abnormal lipid
metabolism may be specific to SC. AD exhibited significant
upregulation of LIPF; however, no evidence of dysregulated
lipid metabolism in AD was observed at a functional level. By
contrast, AD exhibited alterations in ‘molecular transport’,
‘cell-to-cell signaling and interaction’ and ‘amino acid
metabolism’.
Only SC exhibited strong enrichment of the ‘drug
metabolism’ cellular function in the present study. Previous
studies have suggested that high activity levels of cytochrome P450
isotypes, particularly cytochrome P450 family 1 (CYP1)
subfamily B member 1 (CYP1B1), serve a role in
carcinogenesis and drug resistance in human cancers, including
NSCLC, and may serve as therapeutic targets or prognostic
indicators (41,42). In addition, 5,7-dimethoxyflavone and
resveratrol have been used to inhibit CYP1 family protein
expression Hep G2 human hepatoma and MCF-10a non-tumorigenic human
mammary epithelial cell lines, respectively (43,44). The
results of the present study revealed that the ‘PXR/RXR’,
‘xenobiotic metabolism signaling’, ‘aryl hydrocarbon receptor
signaling’ and ‘glutathione-mediated detoxification’ canonical
pathways were also altered in early-stage SC. Previous studies have
demonstrated that PXR serves a role in xenobiotic metabolism in
human malignancies, such as colon, breast and gynecologic cancers
(45). The involvement of PXR
in NSCLC has not been previously reported. The aryl hydrocarbon
transcription factor is also involved in cytochrome metabolism and
activates the CYP1B1, CYP1A1 and CYP1A2 isotypes (46). The results of the present study
suggest that the dysregulation of genes associated with drug
metabolism may be specific to SC, and that the role of these
catabolic enzymes may be evident in early-stage cancer. These
results also identify several potential mechanisms of chemotherapy
resistance in SC.
The canonical pathways ‘FXR/RXR activation’ and
‘LXR/RXR activation’ were altered in early-stage AD, and the
NR1H4 gene was identified as an upstream regulator of AD in
the present study. Previous studies of FXR/RXR in
human cancers have demonstrated that it is activated in breast and
esophageal cancers, but can be downregulated in hepatobiliary
cancers (47–49). Loss of LXR/RXR is
involved in the growth and progression of prostatic carcinomas, and
LXR agonists have emerged as a novel therapy for prostate cancer
(50). The canonical pathways
‘LPS/IL-1 mediated inhibition of RXR function’ and ‘PXR/RXR
activation’ were altered in SC in the present study.
PXR/RXR is involved in the metabolism of xenobiotics
and has been demonstrated to be involved in multiple types of human
cancer, including colon, breast and gynecological cancers (45). Previous studies have demonstrated the
use of retinoid receptor expression as a prognostic indicator in
stage I NSCLC, but the role of specific retinoid receptors has not
been explored (51,52). The involvement of FXR/RXR,
LXR/RXR and PXR/RXR in NSCLC subtypes is a
novel finding of the present study.
The results of the present study demonstrated that
HNF4A and HNF1A were upstream regulators of the genes
specifically dysregulated in AD. A previous study has identified
the use of HNF4A as a biomarker for AD, and another study
identified HNF4G to be involved in the AKT signaling pathway
in lung cancer (20,53). The present results suggest that
HNF may be an upstream driver of tumorigenesis. In addition,
SMARCA4 was identified as another upstream regulator in AD.
Upregulation of this gene in AD is associated with poor prognosis
and a poor response to platinum-based chemotherapy (54,55).
Analysis of the upstream regulators in the present study also
identified FOXA2 and FOXA1 as specific regulators of
AD; the FOXA2 gene product has been demonstrated to prevent
lung tumor growth and metastasis by preventing
epithelial-mesenchymal transition (21).
In the present study PPARG, c-JUN and
RXRA were the most significant upstream regulators of the
genes specifically differentially regulated in early-stage SC. The
role of PPARG in lung cancer is unclear, although
PPARG has been studied in the context of pulmonary fibrosis,
where it was demonstrated to repress myofibroblast differentiation
(56). However, upregulation of
PPARG repressed tumor growth in pancreatic and colorectal
cancer (57,58), and PPARG inhibitors have been
used to induce anti-estrogen susceptibility in mammary tumors
(59). The role of the c-JUN
regulator in NSCLC may be related to the dysregulation of retinoid
signaling by the inhibition of RXRA, which is another
upstream regulator of the genes altered in SC (60). Based on prior studies (61,62),
c-JUN may be activated and RXRA may be consequently
inhibited in SC. Anti-tumor activity has been achieved through
c-JUN protein inhibition using a bisphenazine anticancer drug
(63). Several other upstream
regulators were identified in the present study, such as estrogen
receptor 2 and tumor protein p63, which have been previously
demonstrated to serve roles in NSCLC (64,65).
The major limitation of the present study was the
lack of experimental validation of the findings using in
vivo or in vitro experiments. However, to minimize false
positives, a very stringent cut-off was used to select the DEGs. In
addition, the large sample set provided high statistical power to
discover the differences with high confidence.
In conclusion, the present study revealed
early-stage differences in the gene expression profiles of AD and
SC. Unique sets of genes altered in each subtype were identified;
for example, ALB, LIN28A, LIPF, TM4SF4, AGXT2L1 and
ACMSD genes were upregulated >50-fold in AD, but were not
significantly upregulated in SD. Similarly, AMTN, ADH7, SOST
and CLDN22 were upregulated >50-fold in SC, but not in
AD. Several CTA family genes were highly upregulated in SC,
but not in AD, whereas several mucins were upregulated only in AD.
In addition, ‘lipid metabolism’ and ‘drug metabolism’ pathways were
associated with genes dysregulated specifically in SC, whereas
‘molecular transport’ and ‘cellular growth and proliferation’ were
significantly enriched only in AD. The results of the present study
provided gene expression alterations specific to each subtype,
which may help to identify the molecular mechanisms underlying the
pathogenesis of these subtypes. These findings also provide targets
for future studies investigating novel diagnostic methods and
personalized therapeutic approaches for AD and SC.
Acknowledgements
Not applicable.
Funding
The present study was supported by the Institutional
Start-Up Package to AS from the Medical College of Georgia at
Augusta University, Augusta, GA, USA.
Availability of data and materials
The datasets analyzed for this study are available
from The Cancer Genome Atlas (https://cancergenome.nih.gov).
Authors contributions
NV, JY and AS wrote the manuscript and created the
figures and tables. TJL and SKK performed data analysis. NV, JY,
SS, AS and NP contributed to the data interpretation. All authors
read and approved the final manuscript.
Ethics approval and consent to
participate
This study utilizes a publicly available data set
from TCGA (https://cancergenome.nih.gov/abouttcga) and was
granted an exemption from requiring ethics approval by the
Institutional Review Boards at Augusta University Augusta GA
USA.
Patient consent for publication
Not applicable.
Competing interests
The authors declare that they have no competing
interests.
References
|
1
|
Siegel RL, Miller KD and Jemal A: Cancer
statistics, 2018. CA Cancer J Clin. 68:7–30. 2018. View Article : Google Scholar : PubMed/NCBI
|
|
2
|
Jemal A, Bray F, Center MM, Ferlay J, Ward
E and Forman D: Global cancer statistics. CA Cancer J Clin.
61:69–90. 2011. View Article : Google Scholar : PubMed/NCBI
|
|
3
|
Torre LA, Siegel RL and Jemal A: Lung
cancer statistics. Adv Exp Med Biol. 893:1–19. 2016. View Article : Google Scholar : PubMed/NCBI
|
|
4
|
Muralidharan-Chari V, Clancy JW, Sedgwick
A and DSouza-Schorey C: Microvesicles: Mediators of extracellular
communication during cancer progression. J Cell Sci. 123:1603–1611.
2010. View Article : Google Scholar : PubMed/NCBI
|
|
5
|
Choy B, Findeis-Hosey JJ, Li F, McMahon
LA, Yang Q and Xu H: High frequency of coexpression of maspin with
p63 and p53 in squamous cell carcinoma but not in adenocarcinoma of
the lung. Int J Clin Exp Pathol. 6:2542–2547. 2013.PubMed/NCBI
|
|
6
|
Fukui T, Taniguchi T, Kawaguchi K,
Fukumoto K, Nakamura S, Sakao Y and Yokoi K: Comparisons of the
clinicopathological features and survival outcomes between lung
cancer patients with adenocarcinoma and squamous cell carcinoma.
Gen Thorac Cardiovasc Surg. 63:507–513. 2015. View Article : Google Scholar : PubMed/NCBI
|
|
7
|
Argon A, Nart D and Veral A: The value of
cytokeratin 5/6, p63 and thyroid transcription factor-1 in
adenocarcinoma, squamous cell carcinoma and non-small-cell lung
cancer of the lung. Turk Patoloji Derg. 31:81–88. 2015.PubMed/NCBI
|
|
8
|
Singhal S, Miller D, Ramalingam S and Sun
SY: Gene expression profiling of non-small cell lung cancer. Lung
Cancer. 60:313–324. 2008. View Article : Google Scholar : PubMed/NCBI
|
|
9
|
Shi WY, Liu KD, Xu SG, Zhang JT, Yu LL, Xu
KQ and Zhang TF: Gene expression analysis of lung cancer. Eur Rev
Med Pharmacol Sci. 18:217–228. 2014.PubMed/NCBI
|
|
10
|
Lu C, Chen H, Shan Z and Yang L:
Identification of differentially expressed genes between lung
adenocarcinoma and lung squamous cell carcinoma by gene expression
profiling. Mol Med Rep. 14:1483–1490. 2016. View Article : Google Scholar : PubMed/NCBI
|
|
11
|
Lacroix L, Commo F and Soria JC: Gene
expression profiling of non-small-cell lung cancer. Expert Rev Mol
Diagn. 8:167–178. 2008. View Article : Google Scholar : PubMed/NCBI
|
|
12
|
Grigoroiu M, Tagett R, Draghici S, Dima S,
Nastase A, Florea R, Sorop A, Ilie V, Bacalbasa N, Tica V, et al:
Gene-expression profiling in non-small cell lung cancer with
invasion of mediastinal lymph nodes for prognosis evaluation.
Cancer Genomics Proteomics. 12:231–242. 2015.PubMed/NCBI
|
|
13
|
Yousef GM, Scorilas A, Nakamura T, Ellatif
MA, Ponzone R, Biglia N, Maggiorotto F, Roagna R, Sismondi P and
Diamandis EP: The prognostic value of the human kallikrein gene 9
(KLK9) in breast cancer. Breast Cancer Res Treat. 78:149–158. 2003.
View Article : Google Scholar : PubMed/NCBI
|
|
14
|
Bahassi el M and Stambrook PJ:
Next-generation sequencing technologies: Breaking the sound barrier
of human genetics. Mutagenesis. 29:303–310. 2014. View Article : Google Scholar : PubMed/NCBI
|
|
15
|
Hagemann IS, Devarakonda S, Lockwood CM,
Spencer DH, Guebert K, Bredemeyer AJ, Al-Kateb H, Nguyen TT,
Duncavage EJ, Cottrell CE, et al: Clinical next-generation
sequencing in patients with non-small cell lung cancer. Cancer.
121:631–639. 2015. View Article : Google Scholar : PubMed/NCBI
|
|
16
|
Xu X, Yang Y, Li H, Chen Z, Jiang G and
Fei K: Assessment of the clinical application of detecting EGFR,
KRAS, PIK3CA and BRAF mutations in patients with non-small cell
lung cancer using next-generation sequencing. Scand J Clin Lab
Invest. 76:386–392. 2016. View Article : Google Scholar : PubMed/NCBI
|
|
17
|
Benjamini Y and Hochberg Y: Controlling
the false discovery rate-a practical and powerful approach to
multiple testing. J R Stat Soc B. 57:289–300. 1995.
|
|
18
|
Wang T, Han P, He Y, Zhao C, Wang G, Yang
W, Shan M, Zhu Y, Yang C, Weng M, et al: Lin28A enhances
chemosensitivity of colon cancer cells to 5-FU by promoting
apoptosis in a let-7 independent manner. Tumour Biol. 37:7657–7665.
2016. View Article : Google Scholar : PubMed/NCBI
|
|
19
|
Shen H, Yang Y, Zhao L, Yuan J and Niu Y:
Lin28A and androgen receptor expression in
ER−/Her2+ breast cancer. Breast Cancer Res
Treat. 156:135–147. 2016. View Article : Google Scholar : PubMed/NCBI
|
|
20
|
Sugano M, Nagasaka T, Sasaki E, Murakami
Y, Hosoda W, Hida T, Mitsudomi T and Yatabe Y: HNF4α as a marker
for invasive mucinous adenocarcinoma of the lung. Am J Surg Pathol.
37:211–218. 2013. View Article : Google Scholar : PubMed/NCBI
|
|
21
|
Tang Y, Shu G, Yuan X, Jing N and Song J:
FOXA2 functions as a suppressor of tumor metastasis by inhibition
of epithelial-to-mesenchymal transition in human lung cancers. Cell
Res. 21:316–326. 2011. View Article : Google Scholar : PubMed/NCBI
|
|
22
|
Li N, Zhong X, Lin X, Guo J, Zou L, Tanyi
JL, Shao Z, Liang S, Wang LP, Hwang WT, et al: Lin-28 homologue A
(LIN28A) promotes cell cycle progression via regulation of
cyclin-dependent kinase 2 (CDK2), cyclin D1 (CCND1), and cell
division cycle 25 homolog A (CDC25A) expression in cancer. J Biol
Chem. 287:17386–17397. 2012. View Article : Google Scholar : PubMed/NCBI
|
|
23
|
Oh JS, Kim JJ, Byun JY and Kim IA:
Lin28-let7 modulates radiosensitivity of human cancer cells with
activation of K-Ras. Int J Radiat Oncol Biol Phys. 76:5–8. 2010.
View Article : Google Scholar : PubMed/NCBI
|
|
24
|
Xiong H, Zhao W, Wang J, Seifer BJ, Ye C,
Chen Y, Jia Y, Chen C, Shen J, Wang L, et al: Oncogenic mechanisms
of Lin28 in breast cancer: New functions and therapeutic
opportunities. Oncotarget. 8:25721–25735. 2017.PubMed/NCBI
|
|
25
|
Bingle L, Cross SS, High AS, Wallace WA,
Devine DA, Havard S, Campos MA and Bingle CD: SPLUNC1 (PLUNC) is
expressed in glandular tissues of the respiratory tract and in lung
tumours with a glandular phenotype. J Pathol. 205:491–497. 2005.
View Article : Google Scholar : PubMed/NCBI
|
|
26
|
Corfield AP: Mucins: A biologically
relevant glycan barrier in mucosal protection. Biochim Biophys
Acta. 1850:236–252. 2015. View Article : Google Scholar : PubMed/NCBI
|
|
27
|
Palmer M, Parker J, Modi S, Butts C,
Smylie M, Meikle A, Kehoe M, MacLean G and Longenecker M: Phase I
study of the BLP25 (MUC1 peptide) liposomal vaccine for active
specific immunotherapy in stage IIIB/IV non-small-cell lung cancer.
Clin Lung Cancer. 3:49–58. 2001. View Article : Google Scholar : PubMed/NCBI
|
|
28
|
Liu L, Wu S, Yang Y, Cai J, Zhu X, Wu J,
Li M and Guan H: SOSTDC1 is down-regulated in non-small cell lung
cancer and contributes to cancer cell proliferation. Cell Biosci.
6:242016. View Article : Google Scholar : PubMed/NCBI
|
|
29
|
Kestler DP, Foster JS, Bruker CT, Prenshaw
JW, Kennel SJ, Wall JS, Weiss DT and Solomon A: ODAM expression
inhibits human breast cancer tumorigenesis. Breast Cancer (Auckl).
5:73–85. 2011.PubMed/NCBI
|
|
30
|
Ishii H, Vecchione A, Murakumo Y,
Baldassarre G, Numata S, Trapasso F, Alder H, Baffa R and Croce CM:
FEZ1/LZTS1 gene at 8p22 suppresses cancer cell growth and regulates
mitosis. Proc Natl Acad Sci USA. 98:10374–10379. 2001. View Article : Google Scholar : PubMed/NCBI
|
|
31
|
Lee MJ, Yu GR, Yoo HJ, Kim JH, Yoon BI,
Choi YK and Kim DG: ANXA8 down-regulation by EGF-FOXO4 signaling is
involved in cell scattering and tumor metastasis of
cholangiocarcinoma. Gastroenterology. 137:1138–1150, 1150.e1-e9.
2009. View Article : Google Scholar : PubMed/NCBI
|
|
32
|
Shan Q, Lou X, Xiao T, Zhang J, Sun H, Gao
Y, Cheng S, Wu L, Xu N and Liu S: A cancer/testis antigen
microarray to screen autoantibody biomarkers of non-small cell lung
cancer. Cancer Lett. 328:160–167. 2013. View Article : Google Scholar : PubMed/NCBI
|
|
33
|
Djureinovic D, Hallstrom BM, Horie M,
Mattsson JSM, La Fleur L, Fagerberg L, Brunnström H, Lindskog C,
Madjar K, Rahnenführer J, et al: Profiling cancer testis antigens
in non-small-cell lung cancer. JCI Insight. 1:e868372016.
View Article : Google Scholar : PubMed/NCBI
|
|
34
|
Zendman AJ, Van Kraats AA, Weidle UH,
Ruiter DJ and Van Muijen GN: The XAGE family of
cancer/testis-associated genes: Alignment and expression profile in
normal tissues, melanoma lesions and Ewings sarcoma. Int J Cancer.
99:361–369. 2002. View Article : Google Scholar : PubMed/NCBI
|
|
35
|
Hellerbrand C, Amann T, Schlegel J, Wild
P, Bataille F, Spruss T, Hartmann A and Bosserhoff AK: The novel
gene MIA2 acts as a tumour suppressor in hepatocellular carcinoma.
Gut. 57:243–251. 2008. View Article : Google Scholar : PubMed/NCBI
|
|
36
|
Lind GE, Skotheim RI, Fraga MF, Abeler VM,
Esteller M and Lothe RA: Novel epigenetically deregulated genes in
testicular cancer include homeobox genes and SCGB3A1 (HIN-1). J
Pathol. 210:441–449. 2006. View Article : Google Scholar : PubMed/NCBI
|
|
37
|
SantAnna-Silva ACB, Santos GC, Campos SPC,
Oliveira Gomes AM, Perez-Valencia JA and Rumjanek FD: Metabolic
profile of oral squamous carcinoma cell lines relies on a higher
demand of lipid metabolism in metastatic cells. Front Oncol.
8:132018. View Article : Google Scholar : PubMed/NCBI
|
|
38
|
Long J, Zhang CJ, Zhu N, Du K, Yin YF, Tan
X, Liao DF and Qin L: Lipid metabolism and carcinogenesis, cancer
development. Am J Cancer Res. 8:778–791. 2018.PubMed/NCBI
|
|
39
|
Luo X, Cheng C, Tan Z, Li N, Tang M, Yang
L and Cao Y: Emerging roles of lipid metabolism in cancer
metastasis. Mol Cancer. 16:762017. View Article : Google Scholar : PubMed/NCBI
|
|
40
|
Guo JY and White E: Autophagy is required
for mitochondrial function, lipid metabolism, growth, and fate of
KRAS (G12D)-driven lung tumors. Autophagy. 9:1636–1638. 2013.
View Article : Google Scholar : PubMed/NCBI
|
|
41
|
Murray GI, Taylor MC, McFadyen MC, McKay
JA, Greenlee WF, Burke MD and Melvin WT: Tumor-specific expression
of cytochrome P450 CYP1B1. Cancer Res. 57:3026–3031.
1997.PubMed/NCBI
|
|
42
|
Su JM, Lin P, Wang CK and Chang H:
Overexpression of cytochrome P450 1B1 in advanced non-small cell
lung cancer: A potential therapeutic target. Anticancer Res.
29:509–515. 2009.PubMed/NCBI
|
|
43
|
Chen ZH, Hurh YJ, Na HK, Kim JH, Chun YJ,
Kim DH, Kang KS, Cho MH and Surh YJ: Resveratrol inhibits
TCDD-induced expression of CYP1A1 and CYP1B1 and catechol
estrogen-mediated oxidative DNA damage in cultured human mammary
epithelial cells. Carcinogenesis. 25:2005–2013. 2004. View Article : Google Scholar : PubMed/NCBI
|
|
44
|
Wen X, Walle UK and Walle T:
5,7-Dimethoxyflavone downregulates CYP1A1 expression and
benzo[a]pyrene-induced DNA binding in Hep G2 cells. Carcinogenesis.
26:803–809. 2005. View Article : Google Scholar : PubMed/NCBI
|
|
45
|
Qiao E, Ji M, Wu J, Ma R, Zhang X, He Y,
Zha Q, Song X, Zhu LW and Tang J: Expression of the PXR gene in
various types of cancer and drug resistance. Oncol Lett.
5:1093–1100. 2013. View Article : Google Scholar : PubMed/NCBI
|
|
46
|
Xue P, Fu J and Zhou Y: The aryl
hydrocarbon receptor and tumor immunity. Front Immunol. 9:2862018.
View Article : Google Scholar : PubMed/NCBI
|
|
47
|
Swales KE, Korbonits M, Carpenter R, Walsh
DT, Warner TD and Bishop-Bailey D: The farnesoid X receptor is
expressed in breast cancer and regulates apoptosis and aromatase
expression. Cancer Res. 66:10120–10126. 2006. View Article : Google Scholar : PubMed/NCBI
|
|
48
|
Yang F, Huang X, Yi T, Yen Y, Moore DD and
Huang W: Spontaneous development of liver tumors in the absence of
the bile acid receptor farnesoid X receptor. Cancer Res.
67:863–867. 2007. View Article : Google Scholar : PubMed/NCBI
|
|
49
|
Guan B, Li H, Yang Z, Hoque A and Xu X:
Inhibition of farnesoid X receptor controls esophageal cancer cell
growth in vitro and in nude mouse xenografts. Cancer.
119:1321–1329. 2013. View Article : Google Scholar : PubMed/NCBI
|
|
50
|
Fukuchi J, Kokontis JM, Hiipakka RA, Chuu
CP and Liao S: Antiproliferative effect of liver X receptor
agonists on LNCaP human prostate cancer cells. Cancer Res.
64:7686–7689. 2004. View Article : Google Scholar : PubMed/NCBI
|
|
51
|
Khuri FR, Lotan R, Kemp BL, Lippman SM, Wu
H, Feng L, Lee JJ, Cooksley CS, Parr B, Chang E, et al: Retinoic
acid receptor-beta as a prognostic indicator in stage I
non-small-cell lung cancer. J Clin Oncol. 18:2798–2804. 2000.
View Article : Google Scholar : PubMed/NCBI
|
|
52
|
Chang YS, Chung JH, Shin DH, Chung KY, Kim
YS, Chang J and Kim SK and Kim SK: Retinoic acid receptor-beta
expression in stage I non-small cell lung cancer and adjacent
normal appearing bronchial epithelium. Yonsei Med J. 45:435–442.
2004. View Article : Google Scholar : PubMed/NCBI
|
|
53
|
Wang J, Zhang J, Xu L, Zheng Y, Ling D and
Yang Z: Expression of HNF4G and its potential functions in lung
cancer. Oncotarget. 9:18018–18028. 2017.PubMed/NCBI
|
|
54
|
Bell EH, Chakraborty AR, Mo X, Liu Z,
Shilo K, Kirste S, Stegmaier P, McNulty M, Karachaliou N, Rosell R,
et al: SMARCA4/BRG1 is a novel prognostic biomarker predictive of
cisplatin-based chemotherapy outcomes in resected non-small cell
lung cancer. Clin Cancer Res. 22:2396–2404. 2016. View Article : Google Scholar : PubMed/NCBI
|
|
55
|
Guerrero-Martinez JA and Reyes JC: High
expression of SMARCA4 or SMARCA2 is frequently associated with an
opposite prognosis in cancer. Sci Rep. 8:20432018. View Article : Google Scholar : PubMed/NCBI
|
|
56
|
Kulkarni AA, Thatcher TH, Olsen KC,
Maggirwar SB, Phipps RP and Sime PJ: PPAR-γ ligands repress
TGFβ-induced myofibroblast differentiation by targeting the
PI3K/Akt pathway: Implications for therapy of fibrosis. PLoS One.
6:e159092011. View Article : Google Scholar : PubMed/NCBI
|
|
57
|
Elnemr A, Ohta T, Iwata K, Ninomia I,
Fushida S, Nishimura G, Kitagawa H, Kayahara M, Yamamoto M, Terada
T and Miwa K: PPARgamma ligand (thiazolidinedione) induces growth
arrest and differentiation markers of human pancreatic cancer
cells. Int J Oncol. 17:1157–1164. 2000.PubMed/NCBI
|
|
58
|
Ogino S, Shima K, Baba Y, Nosho K, Irahara
N, Kure S, Chen L, Toyoda S, Kirkner GJ, Wang YL, et al: Colorectal
cancer expression of peroxisome proliferator-activated receptor
gamma (PPARG, PPARgamma) is associated with good prognosis.
Gastroenterology. 136:1242–1250. 2009. View Article : Google Scholar : PubMed/NCBI
|
|
59
|
Yuan H, Kopelovich L, Yin Y, Lu J and
Glazer RI: Drug-targeted inhibition of peroxisome
proliferator-activated receptor-gamma enhances the chemopreventive
effect of anti-estrogen therapy. Oncotarget. 3:345–356. 2012.
View Article : Google Scholar : PubMed/NCBI
|
|
60
|
Srinivas H, Juroske DM, Kalyankrishna S,
Cody DD, Price RE, Xu XC, Narayanan R, Weigel NL and Kurie JM:
c-Jun N-terminal kinase contributes to aberrant retinoid signaling
in lung cancer cells by phosphorylating and inducing proteasomal
degradation of retinoic acid receptor alpha. Mol Cell Biol.
25:1054–1069. 2005. View Article : Google Scholar : PubMed/NCBI
|
|
61
|
Szabo E, Riffe ME, Steinberg SM, Birrer MJ
and Linnoila RI: Altered cJUN expression: An early event in human
lung carcinogenesis. Cancer Res. 56:305–315. 1996.PubMed/NCBI
|
|
62
|
Xu XC, Sozzi G, Lee JS, Lee JJ, Pastorino
U, Pilotti S, Kurie JM, Hong WK and Lotan R: Suppression of
retinoic acid receptor beta in non-small-cell lung cancer in vivo:
Implications for lung cancer development. J Natl Cancer Inst.
89:624–629. 1997. View Article : Google Scholar : PubMed/NCBI
|
|
63
|
Dai J, Punchihewa C, Mistry P, Ooi AT and
Yang D: Novel DNA bis-intercalation by MLN944, a potent clinical
bisphenazine anticancer drug. J Biol Chem. 279:46096–46103. 2004.
View Article : Google Scholar : PubMed/NCBI
|
|
64
|
Marquez-Garban DC, Chen HW, Fishbein MC,
Goodglick L and Pietras RJ: Estrogen receptor signaling pathways in
human non-small cell lung cancer. Steroids. 72:135–143. 2007.
View Article : Google Scholar : PubMed/NCBI
|
|
65
|
Borczuk AC, Gorenstein L, Walter KL,
Assaad AA, Wang L and Powell CA: Non-small-cell lung cancer
molecular signatures recapitulate lung developmental pathways. Am J
Pathol. 163:1949–1960. 2003. View Article : Google Scholar : PubMed/NCBI
|