Introduction
Thyroid cancer is one of the fastest growing
malignancies and it was the fifth most common cancer worldwide in
2017 (1). The morbidity of thyroid
cancer has increased significantly over the past 30 years, with a
300% increase in the USA and an increase from ~10/1,000,000 to
30–40/1,000,000 in China (2).
Papillary thyroid carcinoma (PTC) is an endocrine malignancy and
the most common type of thyroid cancer, accounting for ~80% of all
thyroid cancer cases worldwide (3).
Late diagnosis may be the primary cause of the increase in PTC
morbidity (4). Therefore, early
diagnosis and treatment are required to improve patient prognosis
and increase survival rates (5). In
recent years, there has been an increased understanding of the
pathogenesis underlying PTC, particularly in microRNAs
(miRNAs/miRs) and DNA methylation associated with the occurrence,
progression, metastasis and prognosis of the disease. A previous
study investigating 653 patients with PTC revealed that mutations
in the promoter region of telomerase reverse transcriptase and the
B-Raf proto-oncogene serine/threonine kinase (BRAF) V600E mutation
contributed to the aggressiveness of PTC, particularly when the two
mutations coexisted (6). Another
study demonstrated that coiled-coil domain containing 67 (CCDC67)
was downregulated in PTC, and revealed an inverse relationship
between CCDC67 expression and PTC aggressiveness and BRAF T1799A
mutation and that CCDC67 expression may inhibit PTC cells (7). miRNAs regulate gene expression by
binding to the 3′untranslated regions of target mRNAs (8). Cheng et al (9) revealed that miR-150 inhibits cell
proliferation, migration and invasion of PTC by targeting
ρ-associated protein kinase 1 (ROCK1), and suggested that miR-150
may be an effective therapeutic target for the treatment of PTC.
Liu et al (10) revealed that
miR-363-3p inhibited the progression of PTC by targeting
phosphoinositide-3-kinase catalytic subunit α. The promoter
methylation status of genes associated with thyroid cancer
including caspase 8, cyclin dependent kinase inhibitor 2A, death
associated protein kinase 1 (DAPK1), estrogen receptor 1 (ESR1),
solute carrier family 5 member 5, Ras association domain family
member 1 (RASSF1) and TIMP metallopeptidase inhibitor 3, and the
abnormal methylation of RASSF1, DAPK1 and ESR1 may be used as
molecular markers for the early detection of thyroid cancer and the
diagnosis of the follicular thyroid carcinoma (FTC)-Hurthle and
FTC-Classic subtypes (11). The
current study investigated differentially expressed genes (DEGs),
differentially expressed miRNAs (DEMs) and differentially
methylated sites (DMSs) in PTC samples. Functional enrichment
analysis of DEGs was performed using the Database for Annotation,
Visualization and Integrated Discovery (DAVID), Kyoto Encyclopedia
of Genes and Genomes (KEGG) and Reactome, and the miRNA-target
interactions of DMSs and protein-protein interactions (PPI) of DEGs
were identified separately using the miRWalk database and the
Search Tool for the Retrieval of Interacting Genes/Proteins. The
regulated network was conducted based on the aforementioned
miRNA-target interactions and PPI to identify potential biomarkers
of PTC. The potential biomarkers were further validated using
clinical PTC samples using reverse transcription-quantitative
polymerase chain reaction (RT-qPCR) and methylation-specific PCR
(MSP). The aim of the current study was to identify potential
pathogenic biomarkers in PTC, and to increase the understanding of
PTC pathogenesis.
Materials and methods
Expression and methylation
profiles
The gene expression datasets GSE97001 (12) and GSE83520 (13), the miRNA expression profile dataset
GSE73182 (14), and the DNA
methylation profile datasets GSE86961 (15) and GSE97466 (16) were downloaded from the Gene
Expression Omnibus database (www.ncbi.nlm.nih.gov/geo). A total of four PTC tissue
and four normal thyroid tissue samples were included in the
GSE97001 dataset and were analyzed using an Agilent-026652 Whole
Human Genome Microarray 4×44K V2 platform. A total of 12 PTC tissue
and 12 normal tissue samples in the GSE83520 dataset were analyzed
using an Illumina HiSeq 2500 (Homo sapiens) platform,
subsequently the data produced were annotated using the University
of California, Santa Cruz (UCSC) Genome Browser (genome.ucsc.edu) and GENCODE (www.gencodegenes.org) respectively using UCSC.txt.gz
and GENCODE.txt.gz files. The GSE73182 dataset contained 19 PTC
tissue and five normal tissue samples, which were analyzed using an
Agilent-035758 Human miRBase 16.0 plus 031181 platform. A total of
41 PTC tissue and 41 normal tissue samples in the GSE86961 dataset
and 60 PTC tissue and 50 normal tissue samples in the GSE97466
dataset were analyzed using an Illumina HumanMethylation450
BeadChip (HumanMethylation450_15017482) platform.
Data processing and differential
analysis
The raw microarray data were converted into
expression data and normalized using the preprocessCore function
package (version 3.5; www.bioconductor.org/packages/release/bioc/html/preprocessCore.html).
TopHat, an application within preprocessCore was used to map the
RNA-Sequencing reads to the GRCh37/hg19 genome with the maximum
mismatches of two. The sorted .bam files from TopHat were used to
calculate the numbers of the reads which were mapped to the exons
of a gene based on Cufflinks, another application within
preprocessCore and normalized to reads per kilobase of the exon
model per million mapped reads (RPKM), which is the representation
of the expression values of the genes. Finally, through Cuffdiff in
Cufflinks DEGs were obtained using the cut-offs |log2(RPKM
Normal/RPKM PTC)|>1 and P<0.05. The average values of
multiple probes that corresponded to the same gene were determined.
The DEGs and DEMs between PTC tissue and normal samples were
screened using the limma package (version 3.18.13; www.bioconductor.org/packages/2.13/bioc/html/limma.html).
P<0.05 and |log fold-change (FC)|>2 were used to identify
DEGs, and P<0.05 and |log FC|>1 were used to identify DEMs.
The gplots package (version 3.0.1; cran.r-project.org/web/packages/gplots) was used to
conduct the cluster analysis.
For original DNA methylation data, from the datasets
GSE86961 and GSE97466, the β value of every methylated site was
calculated and normalized with the β distribution test and compared
using a two-sample Student's t-test. The DMSs were identified by
comparing β values between cases and controls using |Δβ|>0.2 and
P<0.05 as the cut-off criteria.
Functional and pathway enrichment
analysis
DAVID (version 6.8; david.ncifcrf.gov) is a web-accessible program that
integrates functional genomic annotations with intuitive graphical
summaries (17). KEGG (www.genome.jp/kegg) is an online resource for
interpreting high-level functions of biological systems from
molecular level data, including complete and partial sequenced
genome sequences, graphical cellular biochemical processes, and
information on chemicals, enzymes, molecules, and enzymatic
reactions (18). Reactome
(www.reactome.org) is a free, open-source, curated
and peer-reviewed pathway database, which provides intuitive
bioinformatics tools for the visualization, interpretation and
analysis of pathway knowledge to support basic research, genome
analysis, modeling, systems biology and education (19). Gene Ontology (GO), KEGG and Reactome
were used to perform enrichment analysis of the DEGs in DAVID.
Target prediction of DEMs
The targets of the DEMs were predicted using the
miRWalk database (version 2.0; www.umm.uni-heidelberg.de/apps/zmf/mirwalk), a
comprehensive atlas of predicted and validated miRNA-target
interactions. Putative targets were predicted using the ten
bioinformatics databases in the miRWalk database (http://www.umm.uni-heidelberg.de/apps/zmf/mirwalk/),
in which the miRNA-target interactions proved by at least one of
the ten bioinformatics databases were selected. Subsequently, the
inverse miRNA-gene regulation pairs were screened out and the
locations of the targets were selected.
Establishing the regulated network of
DEGs and DEMs
The PPIs were analyzed using the Search Tool for the
Retrieval of Interacting Genes/Proteins (version 10.0; string-db.org), and the DEG PPI pairs with a score
>500 were screened out. Based on inverse/opposite miRNA-gene
pairs and PPI pairs (which was miRNA-gene pairs and PPI pairs with
inverse/opposite regulation levels), the regulated network of the
DEGs and DEMs was constructed and visualized using the Cytoscape
software (version 3.5.1; www.cytoscape.org/download.php).
Investigation of the potential
biomarkers in patients with PTC
A total of 10 patients with PTC (6 females and 4
males) with a mean age of 40.6 years (range, 32–65 years) were
admitted to Tianjin Medical University Cancer Institute and
Hospital between July 2017 and December 2017. The study was
approved by the Tianjin Medical University Cancer Institute and
Hospital Ethics Committee (no. bc2018071), and all patients
provided written informed consent. PTC tissues as well as paired
paracancerous (1.0 cm from the tumor tissue) thyroid specimens were
collected from the patients. Total RNA from the tissue samples was
extracted using TRIzol (Invitrogen; Thermo Fisher Scientific,
Inc.). RT-qPCR and MSP were performed to detect the mRNA level and
methylation status of hsa-miR-199a-5p, decorin (DCN), C-X-C motif
chemokine ligand 12 (CXCL12), LDL receptor related protein 4 (LRP4)
and carbonic anhydrase 12 (CA12). The primers were designed and
synthesized by Takara Biotechnology Co., Ltd. and are presented in
Table I. RNA was reverse transcribed
into cDNA using the PrimeScript® 1st Stand cDNA
Synthesis kit (Takara Biotechnology Co., Ltd.) using the following
conditions: 30°C for 10 min, 42°C for 60 min and 95°C for 5 min.
qPCR was subsequently performed using the SYBR® Premix
Ex Taq™ kit (Takara Biotechnology Co., Ltd.) according to
manufacturer's protocol, and the QuantStudio™ 5 Real-Time PCR
system (Applied Biosystems; Thermo Fisher Scientific, Inc.). DNA
methylation modification was performed using an EZ-DNA
Methylation-Gold kit (Zymo Research Corp.), according to the
manufacturer's protocol. Briefly, 20 µl DNA sample was added in a
PCR tube to elute the DNA using M-Elution Buffer. Afterwards,
bisulfite conversion was performed as follows: ~2 µg of DNA was
diluted with double distilled water to 500 µl, and incubated at
42°C in a water bath for 30 min, 30 µl 10 mM para-dihydroxybenzene
and 520 µl 3.6 M bisulfite (pH 5.0) were subsequently added to the
DNA solution, and finally incubated for 16 h at 50°C in the dark.
qPCR optimization was performed for the conversed DNA, using the
following thermocycling conditions: 95°C for 5 min; followed by 40
cycles at 95°C for 15 sec, 60°C for 30 sec, and 72°C for 35 sec;
and a final extension step at 72°C for 5 min. The 2−ΔΔCq
method (20) was used to quantify
the expression of the target genes normalized to U6 and β-actin.
Each RT-qPCR experiment was repeated 3 times.
 | Table I.Reverse transcription-quantitative PCR
and methylation-specific PCR primers for hsa-miR-199a-5p, DCN,
CXCL12, LRP4 and CA12. |
Table I.
Reverse transcription-quantitative PCR
and methylation-specific PCR primers for hsa-miR-199a-5p, DCN,
CXCL12, LRP4 and CA12.
| Gene | Forward sequence
(5′-3′) | Reverse sequence
(5′-3′) | Size, bp |
|---|
| hsa-miR-199a-5p
(mRNA) |
CAGTGCAGGGTCCGAGGTAT |
CCCAGTGTTCAGACTACCTGTTC | 490 |
| hsa-miR-199a-5p
(methy) |
GAGGTTAAGTAATTTAGAGGTGTGG |
CTATATAACATCTTAATAACAAAAACG | 152 |
| DCN (mRNA) |
TCATCCTCCTTCTGCTTGCA |
TAGCAGAGTTGTGTCAGGGG | 560 |
| DCN (methy) |
TTAAGAATTTGAAGAATTTTTACGT |
AATAATCTCATTCTCATAAACACGC | 188 |
| CXCL12 (mRNA) |
GTGGTCGTGCTGGTCCTC |
TGTTGTTGTTCTTCAGCCGG | 267 |
| CXCL12 (methy) |
ATTTTAGTTTTTTAAGTAGGTGCGA |
TTGTTTTAGTGATGGGAAGTTTGT | 200 |
| LRP4 (mRNA) |
TGGAGAGTGTACCTGCATCC |
GACAGTCCTGCTCATCCGA | 560 |
| LRP4 (methy) |
TTTATTTGGGAGAATTTTGATTGT |
CCTAAAACATCCATACCAACTCATT | 122 |
| CA12 (mRNA) |
TTTCCTCCCAGCAGTCCTTT |
ACCAGGCTCTTCTTTCCCAA | 840 |
| CA12 (methy) |
TTGAGGTTGAGATTAGATAAAGTTTG |
ACCATACAACAAAATTAAAAACATA | 230 |
| U6 (mRNA) |
CAGTGCAGGGTCCGAGGTAT |
GCAGGGGCCATGGCTAATCTTCTCTGTATCG | 130 |
| U6 (methy) |
TTATATAATTGGGTTTTATTGAAAAA |
CAAAAACCATACTAATCTTCTCTATATC | 208 |
| β-actin (mRNA) |
CATCTCTTGCTCGAAGTCCA |
ATCATGTTTGAGACCTTCAACA | 308 |
| β-actin
(methy) |
ATTATTATTGGTAATGAGCGGTTTC |
TTCATAATAAAATTAAATATAATTTCGTA | 110 |
Statistical analysis
SPSS software (version 17.0; SPSS Inc.) was used to
perform all the statistical analyses. Data are expressed as the
mean ± standard deviation. A paired Student's t-test was used to
compare tumor and adjacent tumor tissues. P<0.05 was considered
to indicate a statistically significant difference.
Results
DEGs, DEMs and DMSs
In the GSE97001 dataset, a total of 469 (280
upregulated and 189 downregulated) DEGs were identified between PTC
tissue and normal tissue samples. The samples in the GSE83520
dataset were annotated using the University of California, Santa
Cruz (UCSC) Genome Browser (genome.ucsc.edu) and GENCODE (www.gencodegenes.org). Therefore, two sets of DEGs
were obtained for the GSE83520 dataset. A total of 464 (257
upregulated and 207 downregulated) and 379 (206 upregulated and 173
downregulated) DEGs were identified using UCSC and GENCODE,
respectively. A total of 155 overlapping DEGs (100 upregulated and
55 downregulated) were identified in the aforementioned three sets
of DEGs. The overlapping DEGs were termed DEGs-overlap and the top
20 upregulated and downregulated DEGs-overlap are presented in
Table II, according to the logFC
value. Among the DEGs-overlap, DCN and CXCL12 had a decreased
expression level in PTC tissues compared with that in normal
tissues, and LRP4 and CA12 had an increased expression level in PTC
tissues compared with that in normal tissues.
| Table II.Overlapping DEGs in the GSE97001 and
GSE83520 datasets. |
Table II.
Overlapping DEGs in the GSE97001 and
GSE83520 datasets.
| A, Upregulated
overlapping DEGs |
|---|
|
|---|
| Gene |
logFC-1a |
logFC-2b |
logFC-3c | Regulation |
|---|
| ZCCHC12 | 8.816 | 7.367 | 7.385 | Up |
| CITED1 | 8.092 | 4.968 | 5.004 | Up |
| CHI3L1 | 7.665 | 3.666 | 3.680 | Up |
| LRP4d | 7.376 | 4.666 | 4.720 | Up |
| KLHDC8A | 7.308 | 5.324 | 5.435 | Up |
| PCSK2 | 6.943 | 3.498 | 3.462 | Up |
| CLDN1 | 6.334 | 4.321 | 4.401 | Up |
| DPP4 | 6.043 | 4.806 | 4.885 | Up |
| GLDN | 5.806 | 2.455 | 2.886 | Up |
| APOC1 | 5.362 | 2.303 | 2.154 | Up |
| NELL2 | 5.236 | 2.871 | 2.941 | Up |
| CA12d | 5.226 | 2.424 | 2.756 | Up |
| CLDN16 | 5.199 | 5.379 | 5.590 | Up |
| LAMB3 | 5.069 | 4.137 | 4.298 | Up |
| TESC | 5.025 | 3.014 | 3.194 | Up |
| CDH2 | 4.963 | 3.449 | 3.387 | Up |
| LIPH | 4.958 | 5.904 | 6.719 | Up |
| KCNJ2 | 4.879 | 3.571 | 3.588 | Up |
| AGR2 | 4.860 | 4.951 | 4.891 | Up |
| CDH3 | 4.831 | 4.209 | 4.349 | Up |
|
| B, Downregulated
overlapping DEGs |
|
| Gene |
logFC-1a |
logFC-2b |
logFC-3c |
Regulation |
|
| CXCL12d | −2.066 | −2.236 | −2.367 | Down |
| DCNd | −2.218 | −3.785 | −3.791 | Down |
| FMO2 | −3.121 | −3.282 | −3.102 | Down |
| CA4 | −3.181 | −2.991 | −3.383 | Down |
| LRP1B | −3.312 | −5.615 | −5.622 | Down |
| MMRN1 | −3.344 | −4.017 | −4.296 | Down |
| CFD | −3.366 | −2.645 | −2.635 | Down |
| LIFR | −3.399 | −2.606 | −2.597 | Down |
| CRABP1 | −3.427 | −4.443 | −4.547 | Down |
| TFCP2L1 | −3.520 | −4.016 | −4.108 | Down |
| PLA2R1 | −3.558 | −3.542 | −3.645 | Down |
| IP6K3 | −3.789 | −3.040 | −3.093 | Down |
| CSGALN | −3.793 | −2.301 | −2.419 | Down |
| ACT1 |
| OGDHL | −3.908 | −2.300 | −2.300 | Down |
| PAPSS2 | −4.019 | −3.307 | −3.335 | Down |
| TPO | −4.044 | −4.915 | −4.988 | Down |
| APOD | −4.068 | −4.158 | −4.216 | Down |
| DIO1 | −4.179 | −2.706 | −2.832 | Down |
| SLC26A7 | −4.235 | −3.542 | −3.604 | Down |
| MAPK4 | −5.085 | −4.299 | −4.495 | Down |
A total of 19 DEMs (10 upregulated and 9
downregulated) were identified in the GSE73182 dataset (Table III). Among them, hsa-miR-199b-5p
had a lower expression level in PTC tissues compared with that in
normal tissues, and was the fourth most significant DEM according
to its P-value (P=1.439×10⁻⁵). hsa-miR-199a-5p had a
lower expression level in PTC tissues compared with that in normal
tissues. hsa-miR-199a-5p is highly homologous to hsa-miR-199b-5p,
and hsa-miR-199a-5p was selected for further experimentation in the
current study.
| Table III.Differentially expressed miRNAs in
papillary thyroid carcinoma tissue compared with normal tissue
samples. |
Table III.
Differentially expressed miRNAs in
papillary thyroid carcinoma tissue compared with normal tissue
samples.
| A, Upregulated
differentially expressed miRNAs |
|---|
|
|---|
| miRNA | Log
fold-change | Mean
expression | P-value |
Regulation |
| hsa-miR-221 | 3.048 | 12.412 |
4.266×10⁻⁶ | Up |
| hsa-miR-221 | 1.137 | 10.222 |
1.857×10⁻³ | Up |
| hsa-miR-15a | 1.094 | 13.427 |
1.189×10⁻⁵ | Up |
| hsa-miR-551b | 1.315 | 10.389 |
4.240×10⁻³ | Up |
|
hsa-miR-146b-5p | 4.369 | 13.696 |
5.028×10⁻⁵ | Up |
| hsa-miR-222 | 2.440 | 11.454 |
5.230×10⁻⁵ | Up |
| hsa-miR-21 | 1.423 | 16.552 |
1.836×10⁻⁴ | Up |
| hsa-miR-34a | 1.292 | 13.618 |
2.688×10⁻⁴ | Up |
| hsa-miR-181a | 1.301 | 12.806 |
1.181×10⁻³ | Up |
| hsa-miR-142-5p | 1.185 | 11.207 |
2.675×10⁻² | Up |
|
| B, Downregulated
differentially expressed miRNAs |
|
| hsa-miR-7 | −2.353 | 10.838 |
8.411×10⁻⁴ | Down |
| hsa-miR-100 | −1.064 | 12.917 |
8.011×10⁻⁶ | Down |
|
hsa-miR-199b-5p | −2.086 | 10.403 |
1.439×10⁻⁵ | Down |
| hsa-miR-195 | −1.300 | 11.918 |
3.590×10⁻³ | Down |
| hsa-miR-451 | −2.390 | 14.629 |
3.136×10⁻⁴ | Down |
|
hsa-miR-199a-3p | −1.929 | 12.468 |
4.349×10⁻³ | Down |
| hsa-miR-204 | −1.395 | 9.979 |
7.303×10⁻³ | Down |
| hsa-miR-144 | −1.433 | 11.784 |
9.732×10⁻³ | Down |
|
hsa-miR-199a-5pa | −1.191 | 11.381 |
1.756×10⁻² | Down |
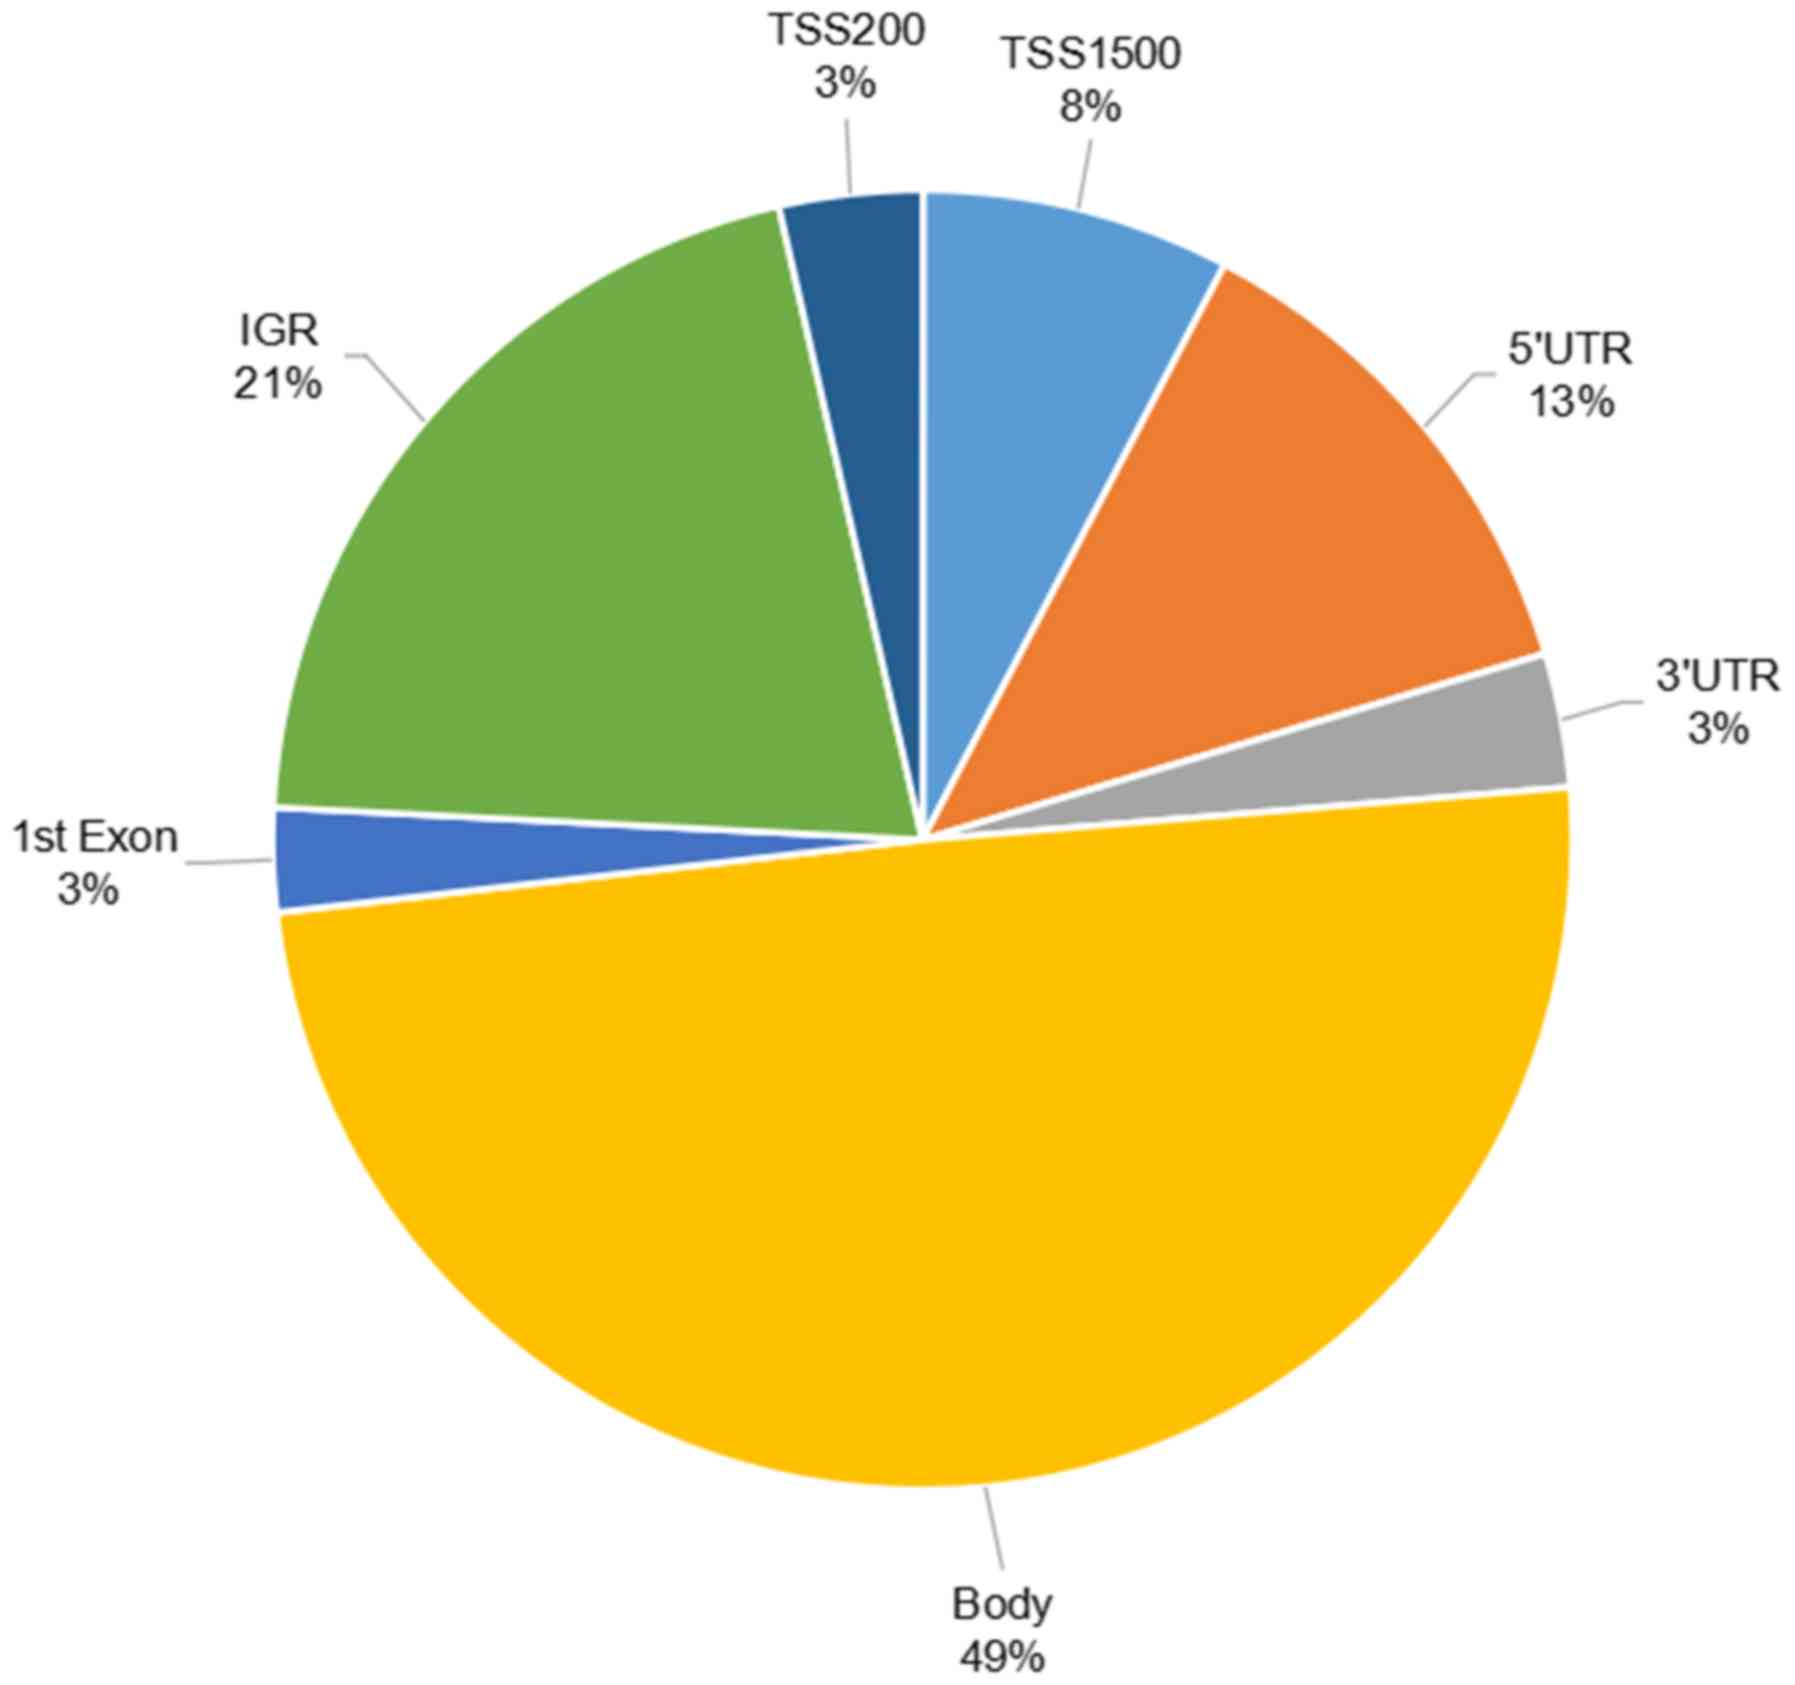
A total of 3,264 (230 upregulated and 3,034
downregulated) and 2,993 (240 upregulated and 2,753 downregulated)
DMSs were screened out in the GSE86961 and GSE97466 datasets,
respectively. There were 2,910 overlapping DMSs (212 upregulated
and 2,698 downregulated) between the two datasets. The overlapping
DMSs were termed DMSs-overlap. The locations of the DMSs-overlap
are presented in Fig. 1. The
DMSs-overlap were primarily located in the gene body (49%) and
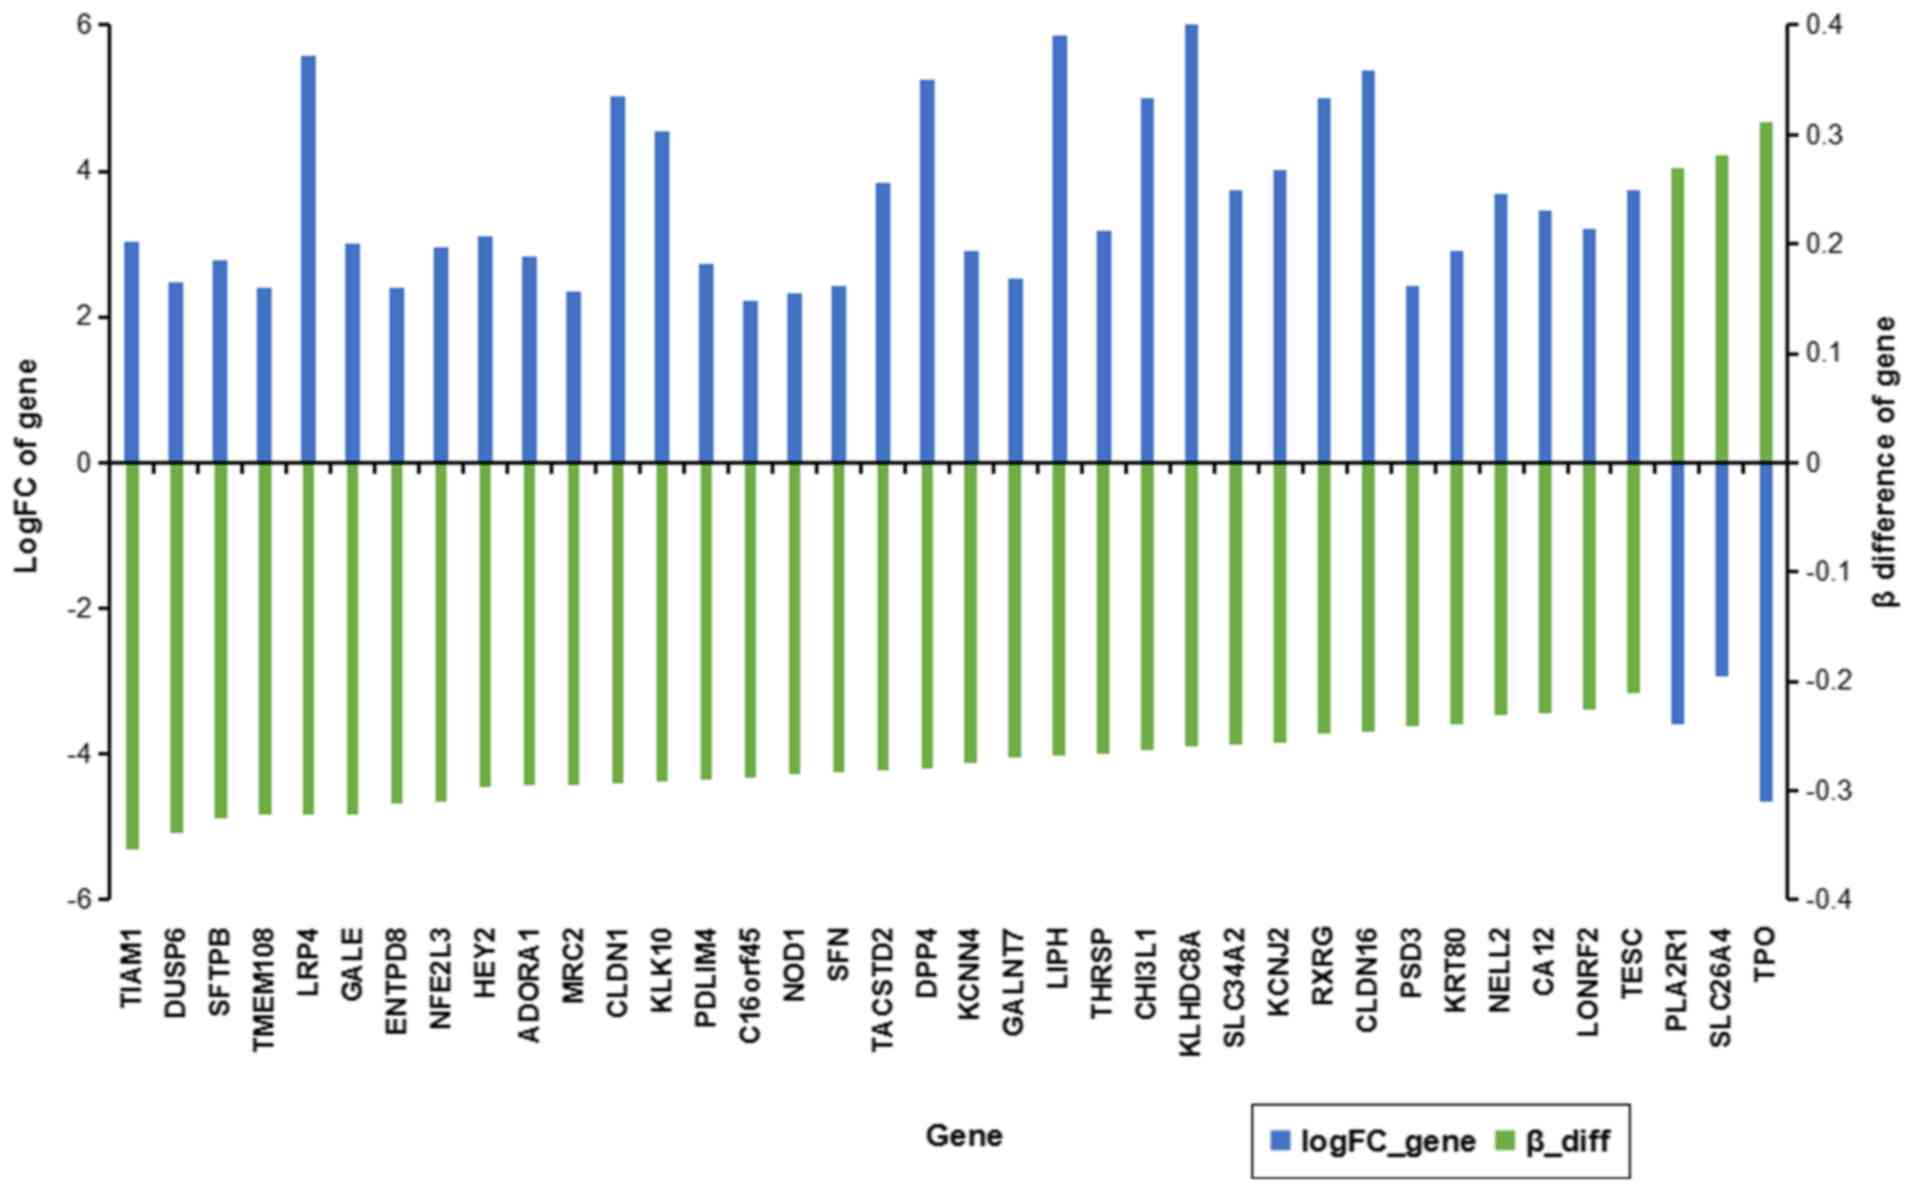
intragenic gene region (21%). The DMSs-overlap were located in 84
differentially methylation genes (DMGs), in which 38 DMGs
expression was negatively regulated by the DMSs-overlap (Fig. 2). Phospholipase A2 receptor 1, solute
carrier family 26 member 4 and thyroid peroxidase were
downregulated and hypermethylated in PTC tissues compared with that
in normal tissues, and the others were upregulated and
hypomethylated.
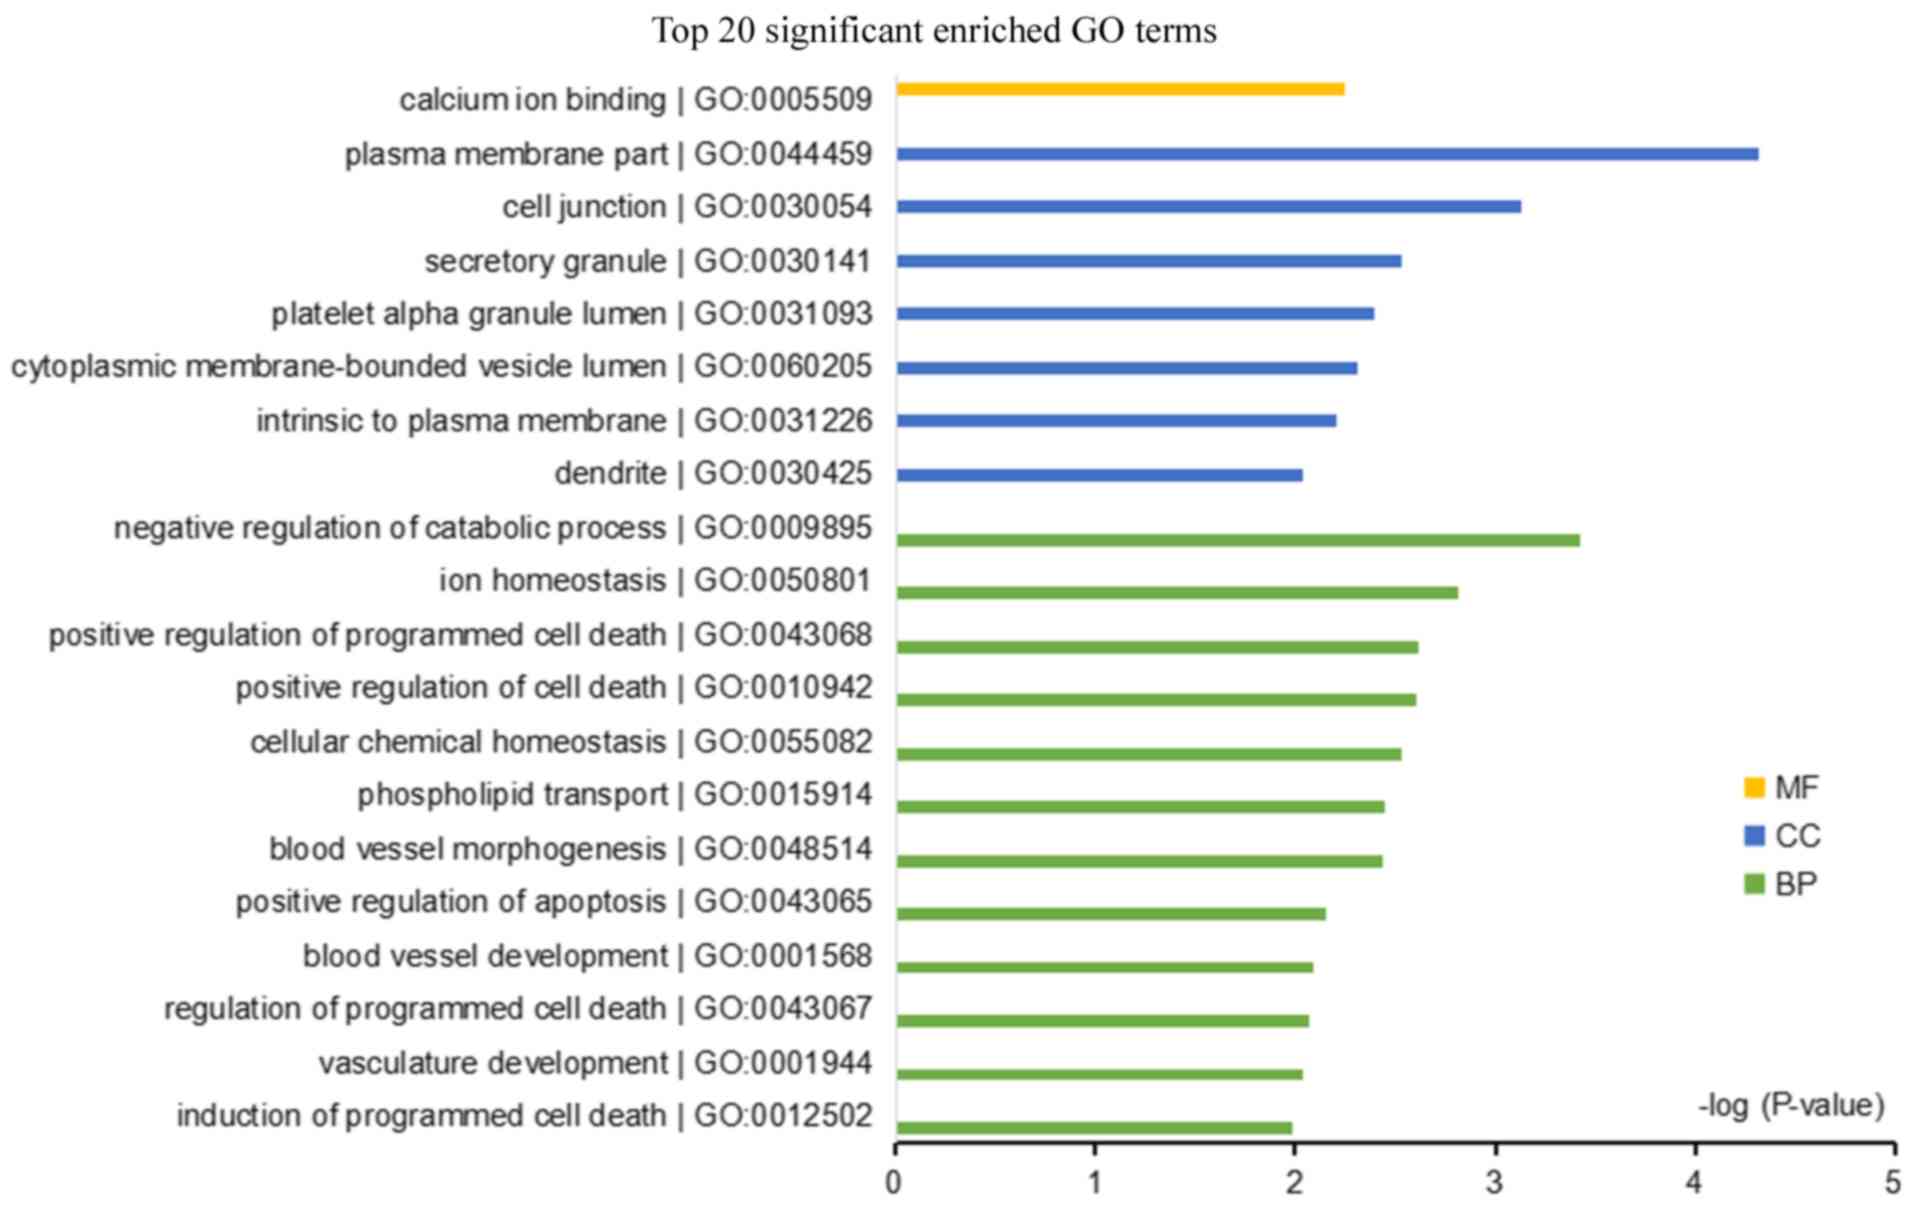
GO and KEGG pathway enrichment
The DEGs-overlap were enriched in 46 GO terms and
one KEGG pathway. The top 20 most significant GO terms are
presented in Fig. 3. The biological
process ‘negative regulation of catabolic process’ and the cellular
component ‘plasma membrane’ were the top two most significant
terms. The KEGG enriched pathway was ‘cell adhesion molecules’ and
the associated DEGs were claudin 16, CLDN1, cadherin (CDH)2, CDH3
and syndecan 4.
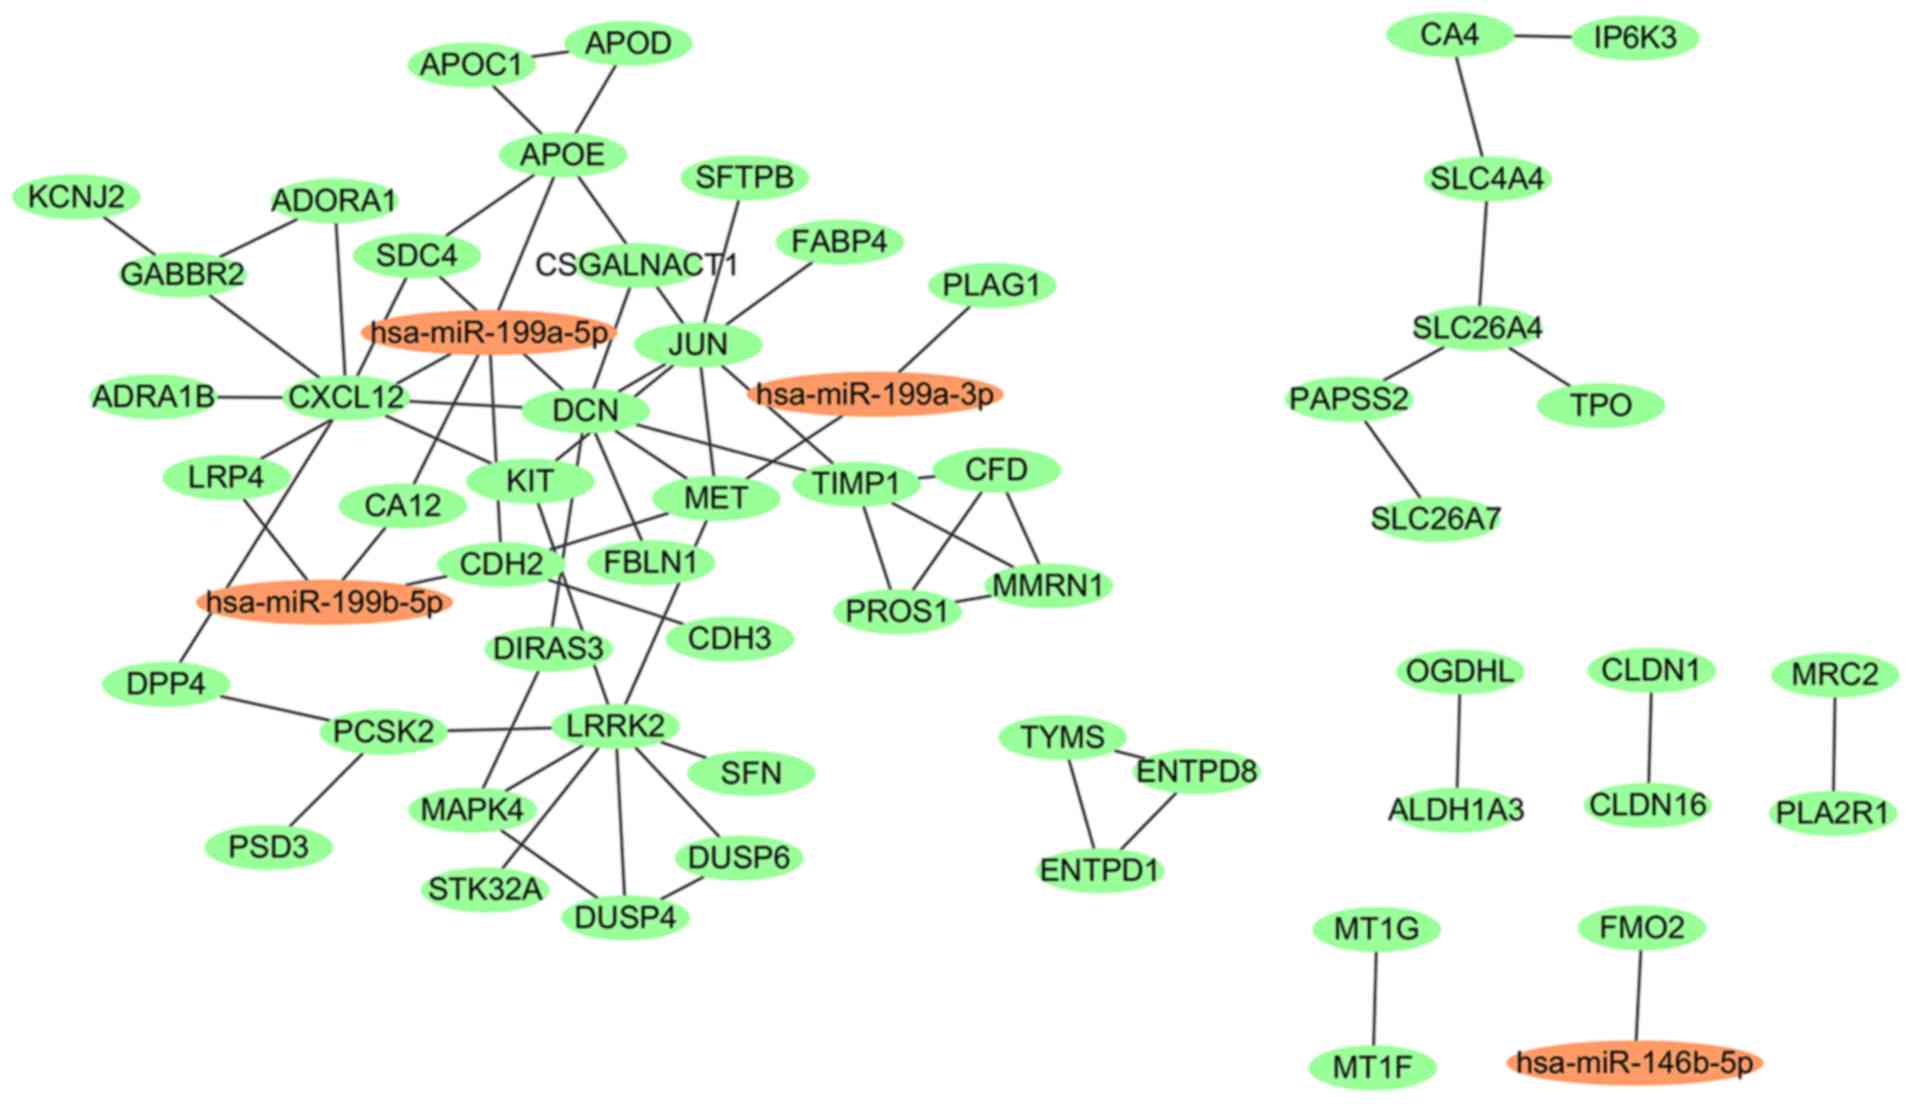
miRNA-gene pairs, PPI pairs and the
regulated network
A total of 15 miRNA-gene pairs were identified for
the DEMs, 12 of which were negative regulation pairs. A total of 60
PPI pairs were obtained for the DEGs-overlap. The regulated network
based on the PPI pairs and the aforementioned negative miRNA-gene
pairs is presented in Fig. 4. In the
network, hsa-miR-199a-5p, DCN and CXCL12 were nodes with the
highest scores, and CXCL12, CA12, DCN, KIT proto-oncogene, receptor
tyrosine kinase and apolipoprotein E were the target genes of
hsa-miR-199a-5p, predicted using the miRWalk database (version
2.0). LRP4 and CA12 overlapped between the regulated network and
the 38 negative DMGs presented in Fig.
2. hsa-miR-199a-5p, DCN, CXCL12, LRP4 and CA12 were
subsequently chosen for further experimentation in patients with
PTC.
Expression and methylation levels of
the potential biomarkers
The expression and methylation levels of the
aforementioned potential biomarkers are presented in Fig. 5 and Table
IV. The expression levels of hsa-miR-199a-5p and DCN were
significantly decreased in PTC tissues compared with that in normal
paracancerous tissues (P<0.001); however, no statistically
significant difference in the methylation levels were observed
(P>0.05). CXCL12 was significantly downregulated and
hypermethylated in PTC tissues compared with that in normal
paracancerous tissues (P<0.001), and LRP4 and CA12 were
significantly upregulated and hypomethylated in PTC tissues
compared with that in normal paracancerous tissues
(P<0.001).
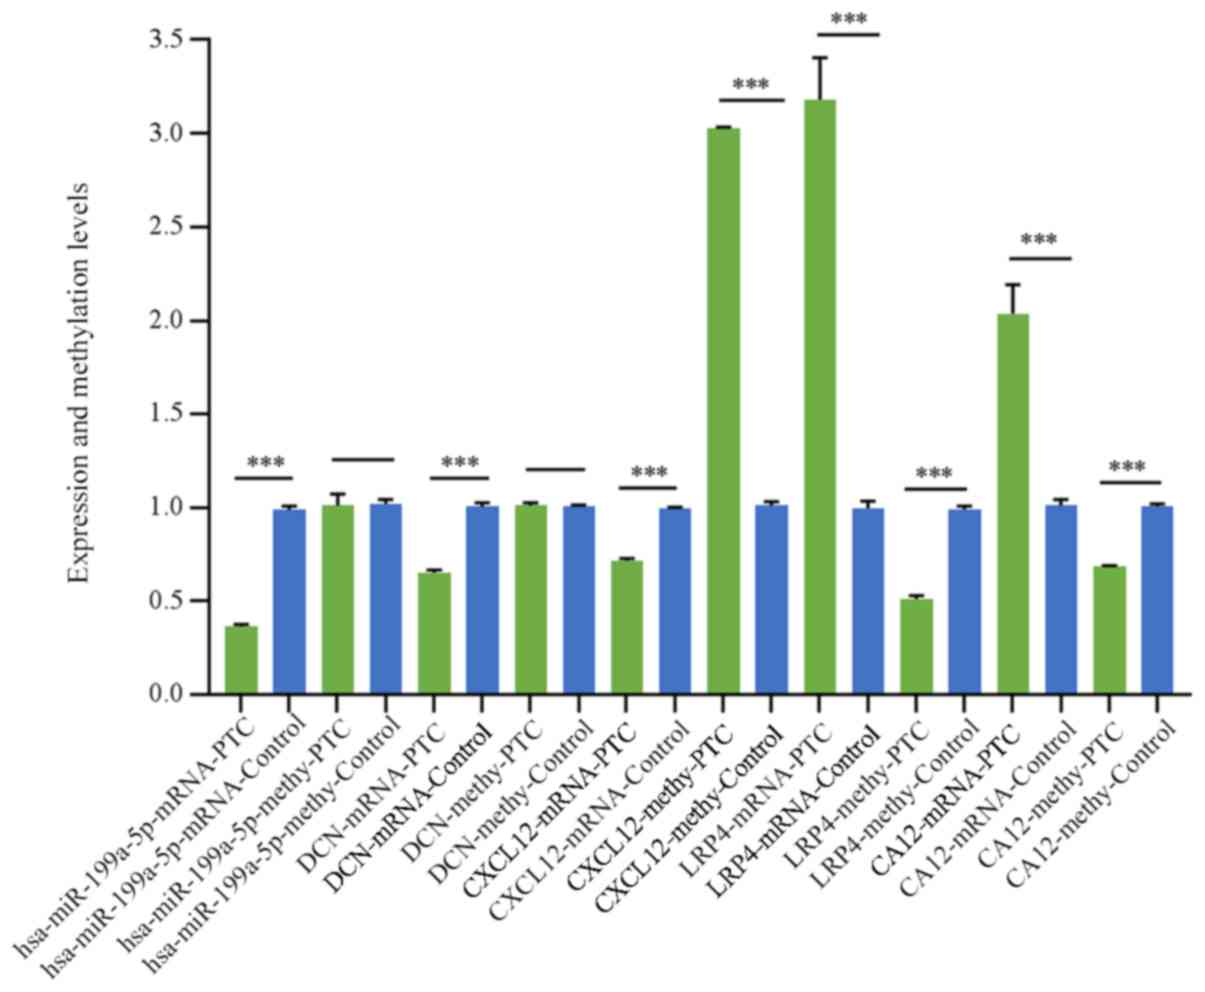 | Figure 5.Expression and methylation levels of
hsa-miR-199a-5p, DCN, CXCL12, LRP4 and CA12 in PTC and paired
paracancerous tissues using reverse-transcription-quantitative PCR
and methylation-specific PCR. ***P<0.001. miR, microRNA; DCN,
decorin; CXCL12, C-X-C motif chemokine ligand 12; LRP4, LDL
receptor related protein 4; CA12, carbonic anhydrase 12; methy,
methylated; PTC, papillary thyroid carcinoma. |
| Table IV.Expression and methylation levels of
hsa-miR-199a-5p, DCN, CXCL12, LRP4 and CA12. |
Table IV.
Expression and methylation levels of
hsa-miR-199a-5p, DCN, CXCL12, LRP4 and CA12.
| Parameter | mRNA | Methy |
|---|
|
hsa-miR-199a-5p |
| PTC
groupa | 0.362±0.014 | 1. 012±0.061 |
| Control
groupa | 0.987±0.021 | 1.020±0.023 |
|
P-value | <0.001 | 0.053 |
| t | −74.430 | 1.230 |
| DCN |
| PTC
groupa | 0.653±0.013 | 1.011±0.013 |
| Control
groupa | 1.005±0.021 | 1.007±0.008 |
|
P-value | <0.001 | 0.051 |
| t | −42.790 | 1.980 |
| CXCL12 |
| PTC
groupa | 0.715±0.014 | 3.025±0.011 |
| Control
groupa | 0.992±0.010 | 1.012±0.020 |
|
P-value | <0.001 | <0.001 |
| t | −48.030 | 265.290 |
| LRP4 |
| PTC
groupa | 3.180±0.226 | 0.513±0.016 |
| Control
groupa | 0.996±0.037 | 0.989±0.020 |
|
P-value | <0.001 | <0.001 |
| t | 28.620 | −55.660 |
| CA12 |
| PTC
groupa | 2.036±0.156 | 0.685±0.005 |
| Control
groupa | 1.011±0.032 | 1.009±0.009 |
|
P-value | <0.001 | <0.001 |
| t | 19.310 | −93.790 |
Discussion
The present study investigated DNA methylation and
gene expression profiles and identified hsa-miR-199a-5p, DCN,
CXCL12, LRP4 and CA12 as potential biomarkers in PTC. The
expression levels of hsa-miR-199a-5p and DCN were decreased in
patients with PTC. CXCL12 was downregulated and hypermethylated in
PTC tissues, while LRP4 and CA12 were upregulated and
hypomethylated.
hsa-miR-199a-5p has been extensively studied in
several types of cancer such as lung cancer (21) and breast cancer (22). However, there are few reports on the
role of hsa-miR-199b-5p in PTC. A recent study revealed that
hsa-miR-199a-5p expression was significantly downregulated in PTC
tissues and cells, and it inhibited the progression of PTC by
downregulating snail family transcriptional repressor 1 (SNAI1)
(23). A previous study demonstrated
that hsa-miR-199a-5p was downregulated in tumor tissues obtained
from patients with follicular thyroid carcinoma (FTC), and
exhibited a negative association with its target, connective tissue
growth factor (24). Therefore,
hsa-miR-199a-5p may serve as a novel biomarker for the clinical
management of thyroid carcinoma. Similar to previously published
studies, the differential expression analysis and RT-qPCR performed
in the current study revealed that the expression of
hsa-miR-199a-5p was decreased in patients with PTC. The present
study revealed that CXCL12, CA12, DCN, KIT proto-oncogene, receptor
tyrosine kinase and apolipoprotein E are potential target genes of
hsa-miR-199a-5p, which may aid to elucidate the pathways involved
in the pathogenesis of PTC. Chung et al (25) reported that CXCL12 has a
higher sensitivity and specificity as a novel diagnostic marker for
PTC compared with cytokeratin 19, Hector Battifora mesothelial
epitope-1 and galectin-3. Zhang et al (26) conducted a reduced representation
bisulfite sequencing analysis and identified CXCL12 as an important
gene in the co-function network, which suggested that CXCL12 may
facilitate PTC progression by methylation-mediated epigenetic
regulation of gene expression. The present study identified CXCL12
as a key pathogenic gene in the regulated network, and RT-qPCR and
MSP results demonstrated that CXCL12 was downregulated and
hypermethylated in PTC. Few studies have investigated the functions
of DCN and LRP4 in PTC. Arnaldi et al (27) revealed that DCN was downregulated in
a high percentage of patients with FTC. Jarzab et al
(28) demonstrated that LRP4 was
downregulated in PTC tissues, and was variably associated with the
immune response of PTC (Spearman's correlation coefficient, 0.792).
While data regarding the potential functions of CA12 in PTC are
limited, previous studies have demonstrated that CA12 is involved
in the progression and prognosis of patients with breast and
cervical cancer (29,30). The present study revealed that DCN
was downregulated in PTC tissues, while LRP4 and CA12 were
upregulated and hypomethylated. DCN, LRP4 and CA12 may therefore be
closely associated with the pathogenesis of PTC through the
methylation-mediated epigenetic regulation of gene expression. Ma
et al (23) revealed that
hsa-miR-199a-5p inhibited the progression of PTC by down-regulating
SNAI1, as demonstrated by the RT-qPCR, cell migration, invasion and
epithelial-mesenchymal transition results. According to the present
bioinformatics analysis and experimental results, it can be
hypothesized that hsa-miR-199a-5p may downregulate LRP4 and CA12,
and upregulate DCN and CXCL12. However, the clear regulatory
mechanisms need to be further verified in subsequent studies. The
present study involved analysis of mRNA, miRNAs and gene
methylation, and suggests that hsa-miR-199a-5p may be involved in
PTC through the methylation-mediated epigenetic regulation of the
aforementioned genes.
In conclusion, the present study revealed that
hsa-miR-199a-5p, DCN, CXCL12, LRP4 and CA12 may be associated with
the pathogenesis of PTC and may serve as potential diagnostic
markers for the disease. However, future clinical studies are
required to verify the results obtained in the current study.
Acknowledgements
Not applicable.
Funding
The present study was partially supported by the
National Natural Science Foundation of China (grant no.
81872169).
Availability of data and materials
The datasets generated and/or analyzed during the
present study are available in the Gene Expression Omnibus
repository (https://www.ncbi.nlm.nih.gov/geo/query/acc.cgi?acc=).
Authors' contributions
SW, XY, XZ and MG conceived and designed the study
and revised the manuscript. SW and XR acquired the data. SW, XY and
XW participated in the sequence alignment and performed the
statistical analysis. All authors read and approved the final
manuscript.
Ethics approval and consent to
participate
The present study was approved by the Tianjin
Medical University Cancer Institute and Hospital Ethics Committee
(no. bc2018071) and all patients provided written informed
consent.
Patient consent for publication
Not applicable.
Competing interests
The authors declare that they have no competing
interests.
References
|
1
|
Siegel RL, Miller KD and Jemal A: Cancer
statistics, 2017. CA Cancer J Clin. 67:7–30. 2017. View Article : Google Scholar : PubMed/NCBI
|
|
2
|
Li JY, Shi J, Sang JF, Yao YZ, Wang XC and
Su L: Role of survivin in the pathogenesis of papillary thyroid
carcinoma. Genet Mol Res. 14:15102–15111. 2015. View Article : Google Scholar : PubMed/NCBI
|
|
3
|
Ferrada CC, Godoy CC, Martínez AA and
García BH: Papillary thyroid cancer: Case reports of four family
cases. Rev Chil Pediatr. 85:351–358. 2014.(In Spanish). View Article : Google Scholar : PubMed/NCBI
|
|
4
|
Hodak S, Tuttle RM, Maytal G, Nikiforov YE
and Randolph G: Changing the cancer diagnosis: The case of
follicular variant of papillary thyroid cancer-primum non nocere
and NIFTP. Thyroid. 26:869–881. 2016. View Article : Google Scholar : PubMed/NCBI
|
|
5
|
Liang H, Zhong Y, Luo Z, Huang Y, Lin H,
Luo M, Zhan S, Xie K, Ma Y and Li QQ: Assessment of biomarkers for
clinical diagnosis of papillary thyroid carcinoma with distant
metastasis. Int J Biol Markers. 25:38–45. 2010. View Article : Google Scholar : PubMed/NCBI
|
|
6
|
Jin L, Chen E, Dong S, Cai Y, Zhang X,
Zhou Y, Zeng R, Yang F, Pan C, Liu Y, et al: BRAF and TERT promoter
mutations in the aggressiveness of papillary thyroid carcinoma: A
study of 653 patients. Oncotarget. 7:18346–18355. 2016. View Article : Google Scholar : PubMed/NCBI
|
|
7
|
Yin DT, Xu J, Lei M, Li H, Wang Y, Liu Z,
Zhou Y and Xing M: Characterization of the novel tumor-suppressor
gene CCDC67 in papillary thyroid carcinoma. Oncotarget.
7:5830–5841. 2016.PubMed/NCBI
|
|
8
|
Pauli A, Rinn JL and Schier AF: Non-coding
RNAs as regulators of embryogenesis. Nat Rev Genet. 12:136–149.
2011. View
Article : Google Scholar : PubMed/NCBI
|
|
9
|
Cheng L, Zhou R, Chen M, Feng L and Li H:
MicroRNA-150 targets Rho-associated protein kinase 1 to inhibit
cell proliferation, migration and invasion in papillary thyroid
carcinoma. Mol Med Rep. 16:2217–2224. 2017. View Article : Google Scholar : PubMed/NCBI
|
|
10
|
Liu J, Li Q, Li R, Ren P and Dong S:
MicroRNA-363-3p inhibits papillary thyroid carcinoma progression by
targeting PIK3CA. Am J Cancer Res. 7:148–158. 2017.PubMed/NCBI
|
|
11
|
Stephen JK, Chen KM, Merritt J, Chitale D,
Divine G and Worsham MJ: Methylation markers for early detection
and differentiation of follicular thyroid cancer subtypes. Cancer
Clin Oncol. 4:1–12. 2015.PubMed/NCBI
|
|
12
|
Iacobas DA, Tuli NY, Iacobas S, Rasamny
JK, Moscatello A, Geliebter J and Tiwari RK: Gene master regulators
of papillary and anaplastic thyroid cancers. Oncotarget.
9:2410–2424. 2017.PubMed/NCBI
|
|
13
|
Liyanarachchi S, Li W, Yan P, Bundschuh R,
Brock P, Senter L, Ringel MD, de la Chapelle A and He H:
Genome-wide expression screening discloses long noncoding RNAs
involved in thyroid carcinogenesis. J Clin Endocrinol Metab.
101:4005–4013. 2016. View Article : Google Scholar : PubMed/NCBI
|
|
14
|
Minna E, Romeo P, Dugo M, De Cecco L,
Todoerti K, Pilotti S, Perrone F, Seregni E, Agnelli L, Neri A, et
al: miR-451a is underexpressed and targets AKT/mTOR pathway in
papillary thyroid carcinoma. Oncotarget. 7:12731–12747. 2016.
View Article : Google Scholar : PubMed/NCBI
|
|
15
|
Beltrami CM, Dos Reis MB, Barros-Filho MC,
Marchi FA, Kuasne H, Pinto CAL, Ambatipudi S, Herceg Z, Kowalski LP
and Rogatto SR: Integrated data analysis reveals potential drivers
and pathways disrupted by DNA methylation in papillary thyroid
carcinomas. Clin Epigenetics. 9:452017. View Article : Google Scholar : PubMed/NCBI
|
|
16
|
Bisarro Dos Reis M, Barros-Filho MC,
Marchi FA, Beltrami CM, Kuasne H, Pinto CAL, Ambatipudi S, Herceg
Z, Kowalski LP and Rogatto SR: Prognostic classifier based on
genome-wide DNA methylation profiling in well-differentiated
thyroid tumors. J Clin Endocrinol Metab. 102:4089–4099. 2017.
View Article : Google Scholar : PubMed/NCBI
|
|
17
|
Dennis G Jr, Sherman BT, Hosack DA, Yang
J, Gao W, Lane HC and Lempicki RA: DAVID: Database for Annotation,
Visualization, and integrated discovery. Genome Biol. 4:P32003.
View Article : Google Scholar : PubMed/NCBI
|
|
18
|
Kanehisa M, Goto S, Sato Y, Furumichi M
and Tanabe M: KEGG: Kyoto encyclopedia of genes and genomes.
Nucleic Acids Res. 27:29–34. 2000.
|
|
19
|
D'Eustachio P: Reactome knowledgebase of
human biological pathways and processes. Methods Mol Biol.
694:49–61. 2011. View Article : Google Scholar : PubMed/NCBI
|
|
20
|
Livak KJ and Schmittgen TD: Analysis of
relative gene expression data using real-time quantitative PCR and
the 2(-Delta Delta C(T)) method. Methods. 25:402–408. 2001.
View Article : Google Scholar : PubMed/NCBI
|
|
21
|
Ahmadi A, Khansarinejad B, Hosseinkhani S,
Ghanei M and Mowla SJ: miR-199a-5p and miR-495 target GRP78 within
UPR pathway of lung cancer. Gene. 620:15–22. 2017. View Article : Google Scholar : PubMed/NCBI
|
|
22
|
Fehm T, Schultz S, Bartsch H, Petat-Dutter
K, Kahlert S, Sotlar K, Niederacher D and Neubauer H: Abstract
P4-09-09: Verification of the breast cancer progression-associated
miRNA hsa-miR-199a-5p using NanoString® platform. Cancer
Res. 76 (4 Suppl):2016.
|
|
23
|
Ma S, Jia W and Ni S: miR-199a-5p inhibits
the progression of papillary thyroid carcinoma by targeting SNAI1.
Biochem Biophys Res Commun. 497:181–186. 2018. View Article : Google Scholar : PubMed/NCBI
|
|
24
|
Sun D, Han S, Liu C, Zhou R, Sun W, Zhang
Z and Qu J: Microrna-199a-5p functions as a tumor suppressor via
suppressing connective tissue growth factor (CTGF) in follicular
thyroid carcinoma. Med Sci Monit. 22:1210–1217. 2016. View Article : Google Scholar : PubMed/NCBI
|
|
25
|
Chung SY, Park ES, Park SY, Song JY and
Ryu HS: CXC motif ligand 12 as a novel diagnostic marker for
papillary thyroid carcinoma. Head Neck. 36:1005–1012. 2014.
View Article : Google Scholar : PubMed/NCBI
|
|
26
|
Zhang S, Wang Y, Chen M, Sun L, Han J,
Elena VK and Qiao H: CXCL12 methylation-mediated epigenetic
regulation of gene expression in papillary thyroid carcinoma. Sci
Rep. 7:440332017. View Article : Google Scholar : PubMed/NCBI
|
|
27
|
Arnaldi LA, Borra RC, Maciel RM and
Cerutti JM: Gene expression profiles reveal that DCN, DIO1, and
DIO2 are underexpressed in benign and malignant thyroid tumors.
Thyroid. 15:210–221. 2005. View Article : Google Scholar : PubMed/NCBI
|
|
28
|
Jarzab B, Wiench M, Fujarewicz K, Simek K,
Jarzab M, Oczko-Wojciechowska M, Wloch J, Czarniecka A, Chmielik E,
Lange D, et al: Gene expression profile of papillary thyroid
cancer: Sources of variability and diagnostic implications. Cancer
Res. 65:1587–1597. 2005. View Article : Google Scholar : PubMed/NCBI
|
|
29
|
Watson PH, Chia SK, Wykoff CC, Han C, Leek
RD, Sly WS, Gatter KC, Ratcliffe P and Harris AL: Carbonic
anhydrase XII is a marker of good prognosis in invasive breast
carcinoma. Br J Cancer. 88:1065–1070. 2003. View Article : Google Scholar : PubMed/NCBI
|
|
30
|
Yoo CW, Nam BH, Kim JY, Shin HJ, Lim H,
Lee S, Lee SK, Lim MC and Song YJ: Carbonic anhydrase XII
expression is associated with histologic grade of cervical cancer
and superior radiotherapy outcome. Radiat Oncol. 5:1012010.
View Article : Google Scholar : PubMed/NCBI
|